 Paul Vriend
 Caspar T. J. Roebroek
 Tim van Emmerik
- Hydrology and Quantitative Water Management Group, Wageningen University, Wageningen, Netherlands
Plastic pollution in rivers negatively impacts human livelihood and aquatic ecosystems. Monitoring data are crucial for a better understanding of sources, sinks and transport mechanisms of riverine macroplastics. In turn, such understanding is key to develop effective plastic pollution prevention, mitigation, and removal strategies. Riverine plastic is mostly studied through the monitoring of floating plastic and through the quantification of plastic deposited on riverbanks. Existing riverbank plastic measurement methods vary greatly, which complicates direct comparison of data collected with different monitoring strategies. We present a framework to better compare and to aid the design of riverbank plastic monitoring methods, which is based on four common elements distilled from riverbank (plastic) litter monitoring methods currently in use. This framework can be used by scientists and practitioners to find the right trade-offs between the data required to answer specific research questions, and the available resources. Subsequently, we use the framework to suggest effective monitoring strategies for four frequently asked research questions. With this paper, we aim to provide a first step toward harmonization of riverbank plastic litter monitoring efforts.
Introduction
Plastic pollution in the riverine environment has been a topic of rising concern, due to its associated negative effects. These effects include increased mortality rates of fauna through ingestion or entanglement, damage to property, a reduction of livelihoods of those dependent on rivers, increased flood risk through the blockage of urban drainage systems, and transport of plastic into the world's oceans (Honingh et al., 2020; van Emmerik and Schwarz, 2020). Macroplastics are also a major source of microplastics in the riverine environment since they break down after exposure to ultraviolet light or mechanical forces in rivers (Weinstein et al., 2016). Despite the clear negative consequences of riverine macroplastics, a fundamental understanding of its sources, sinks, and transport mechanisms has not yet been achieved.
Monitoring plastic in the riverine environment is a prerequisite for understanding how plastic is transported and where it accumulates. Reliable and frequent plastic litter observations can aid the development of effective policy measures and mitigation strategies (Owens and Kamil, 2020; Vriend et al., 2020). Long-term observation of beach litter has already shown that monitoring can be used to determine fundamental characteristics of plastic transport in aquatic environments. Olivelli et al. (2020), for example, identified beaches as a major sink for plastic in the marine environment based on a dataset gathered through long-term monitoring of beach litter. For rivers, van Emmerik et al. (2019) observed a 10-fold increase in plastic flux in the river Seine as a result of increased river discharge, suggesting hydrological factors as main drivers of plastic transport. Based on field measurements along the Rhine, Mani et al. (2015) proposed that microplastic concentrations within river systems reflect the population and industry density in the proximity of the river. Data from (long-term) monitoring efforts support the development of targeted policy, and can be used to test whether implemented measures to reduce plastic pollution are effective (González-Fernández et al., 2018; van Calcar and van Emmerik, 2019). Despite the increasing efforts to monitor plastics in river systems, studying the fundamental transport and deposition mechanisms remains complicated due to the inconsistencies in measurement strategies.
Plastics have been observed in all river compartments; floating plastic, plastic within the water column, riverbed plastic, plastic within biota, and plastic that has been (temporarily) deposited on the riverbanks or within riverbeds (van Emmerik and Schwarz, 2020). To date, the floating (e.g., González-Fernández and Hanke, 2017; van Emmerik et al., 2018), and the riverbank plastics (e.g., Rech et al., 2015; Kiessling et al., 2019) have been most frequently studied, while the other compartments remain difficult to quantify. With the increased amount of efforts to monitor riverine macroplastics, the need for method harmonization became clear (González-Fernández and Hanke, 2017). First efforts for harmonization have been made, for example through the RIMMEL (RIverine and Marine floating macro litter Monitoring and Modeling of Environmental Loading) project for floating macroplastics (González et al., 2016; González-Fernández and Hanke, 2017). However, such a large-scale effort does not yet exist for riverbank plastic pollution. Given the recent interest in riverbank plastic monitoring (e.g., Battulga et al., 2019; Kiessling et al., 2019; van Emmerik et al., 2020a), the aim of this paper is to contribute to the harmonization of these riverbank plastic monitoring efforts.
Riverbank plastic monitoring aims to systematically collect data that can aid with developing strategies to decrease plastic pollution. Several of these efforts have been documented in the scientific literature (e.g., Battulga et al., 2019; Kiessling et al., 2019; van Emmerik et al., 2020a), but a large section of riverbank litter identification protocols remains unreported in peer-reviewed literature (Owens and Kamil, 2020). The driving questions, methods, types of observers, and types of data output vary greatly between protocols, which can create difficulties when comparing results between different programs (Owens and Kamil, 2020).
We examined the protocols currently in use and identified overlap and differences between them to create an overarching framework to facilitate systematic comparisons between protocols. This framework can be used by scientists, practitioners, and other organizations as a tool to help develop monitoring programs, or to better tailor programs currently in use to their specific needs. This is useful since a wide range of methods are currently being used to quantify riverbank plastic pollution, each having their own balance between several factors based on local context and available resources. When developing a monitoring protocol, it can be beneficial to have an overview of the range of possibilities, and the effects that certain decisions have on the output data. We show how to use the framework by determining suitable monitoring strategies for four research questions, based on resource availability. The goal of this study is to provide a framework that can be used to (1) effectively compare monitoring programs, and (2) act as a tool that can support researchers, governments and other organizations with developing and optimizing riverbank macroplastic monitoring strategies that fit local conditions and ambitions.
A Framework for Riverbank Macroplastic Monitoring
We identified four key elements to riverine monitoring protocols: (1) space (scale, sampling area and structure), (2) time (duration, structure, frequency, and period), (3) observers, and (4) plastic categorization (categories and size range) (Figure 1). These elements were distilled from riverbank litter monitoring protocols currently in use. The list of protocols currently in use was taken from the literature identified by van Emmerik and Schwarz (2020). In addition, we included a recently proposed protocol by Battulga et al. (2019). The protocols considered for the development of the proposed framework were the Plastic Pirates protocol by Kiessling et al. (2019), the Schone Rivieren (Dutch for “Clean Rivers”) protocol by the Dutch North Sea Foundation (Schone Rivieren, 2017), the protocol developed by Battulga et al. (2019) (hereafter called Battulga protocol), and the CrowdWater Protocol (van Emmerik et al., 2020b). Marine litter quantification protocols developed by the OSPAR Commission (2010) and United States National Oceanic and Atmospheric Administration (NOAA) (Lippiatt et al., 2013), were included in the study for comparison and to identify possible improvements of riverbank protocols. Both the available peer-reviewed literature and other materials available (e.g., training materials, item identification sheets) were studied for each protocol.
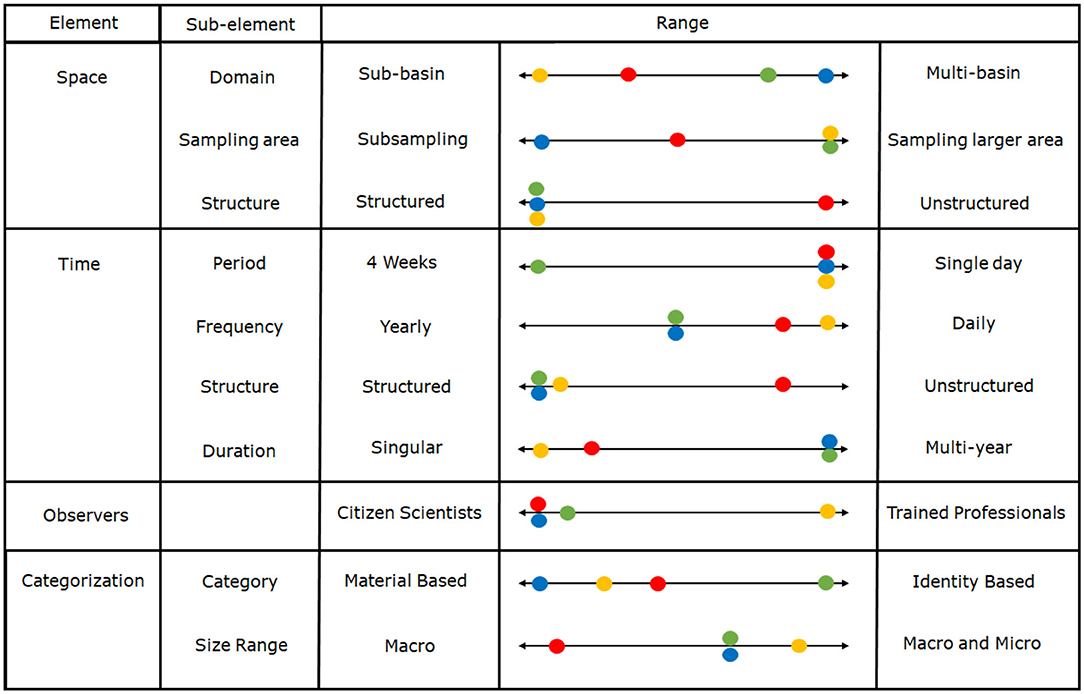
Figure 1. A schematic representation of the proposed framework for riverbank plastic pollution quantification protocols. The range of possibilities is given for each element within the framework. The colored dots represent where the Plastic Pirates (blue), Schone Rivieren (green), Battulga (yellow), and CrowdWater (red) are on this scale of possibilities.
Based on this literature review, we present a framework (Figure 1) that allows for the comparison and optimization of monitoring protocols. The framework depicts the range of possibilities for four key element and their respective sub-elements of riverbank plastic monitoring protocols. Specific protocols can be compared by the addition of colored dots on the range of possibilities. Considerations such as costs and effort required for different positions on these ranges are elaborated further in the text. Each monitoring project has limited resources, and this framework can also be used to identify tradeoffs: resources spent on one element reduce the amount of resources left for other elements. By identifying these tradeoffs, this framework offers the possibility for current and future monitoring protocols optimize this multitude of variables for their needs and resources, and match specific research questions to certain monitoring strategies to be used. We show how to use the framework in section Guidelines for Monitoring, where we suggest possible monitoring strategies for four research questions.
Space: Domain, Sampling Area, and Structure
The first spatial element that shapes monitoring protocols is the domain. The domain is the spatial coverage of the sampling program and determines the number of sampling locations that are required. When the research questions are focused on quantifying plastic presence a local scale, the number of measuring locations can be relatively low. For example, Battulga et al. (2019) quantified plastic pollution on a sub-basin scale and therefore only used 12 sampling sites relatively close to each other. However, when the aim of monitoring is to gather more holistic understanding on the spatial distribution of riverine plastic on a (multi) river basin scale, the number of sampling sites, and with it the required effort, increases. For example, The Schone Rivieren protocol used over 200 sampling sites to examine the Dutch segments of the Rhine and Meuse rivers (van Emmerik et al., 2020a), and the Plastic Pirates project had a total of 360 sampling sites to sample five major rivers across Germany. Difficulties arise with finding enough trained professionals to do sampling with so many sampling sites. Therefore, both these large-scale projects have opted to utilize citizen scientists for data collection. Such a decision is an example of how choices made for space can cause tradeoffs for other elements within the framework such as observers.
The second sub-element of space to consider when developing riverbank plastic pollution quantification protocols is the sampling area that is used to sample plastic on riverbanks (Figure 2). We have identified two distinct groups of sampling areas within the literature, these groups being (1) sampling a large predetermined area, and (2) taking subsamples within such predetermined areas (Figure 2). The former is characterized by the samples being taken at the same, large (>25 m2) sampling area (e.g., Schone Rivieren, 2017; Bruge et al., 2018; Battulga et al., 2019). The latter is characterized by the allocating of subsamples in a predetermined area (e.g., Lippiatt et al., 2013; Rech et al., 2015; Kiessling et al., 2019). Larger sampling areas that are currently being used range from 25 m2 (Dalu et al., 2019), to 100 m2 (Battulga et al., 2019), to 2,500 m2 (Schone Rivieren, 2017). The advantage of sampling a predetermined larger area is that the same area of the riverbank is covered every sampling round. However, sampling a large area also requires more time compared to its subsampling counterpart. In order to reduce time requirements for the analysis, most methods only analyze litter that can be seen while standing up (Lippiatt et al., 2013; Schone Rivieren, 2017; van Emmerik et al., 2020b). This leads to a higher degree of uncertainty in the data collected on smaller sized litter (Hanke et al., 2019).
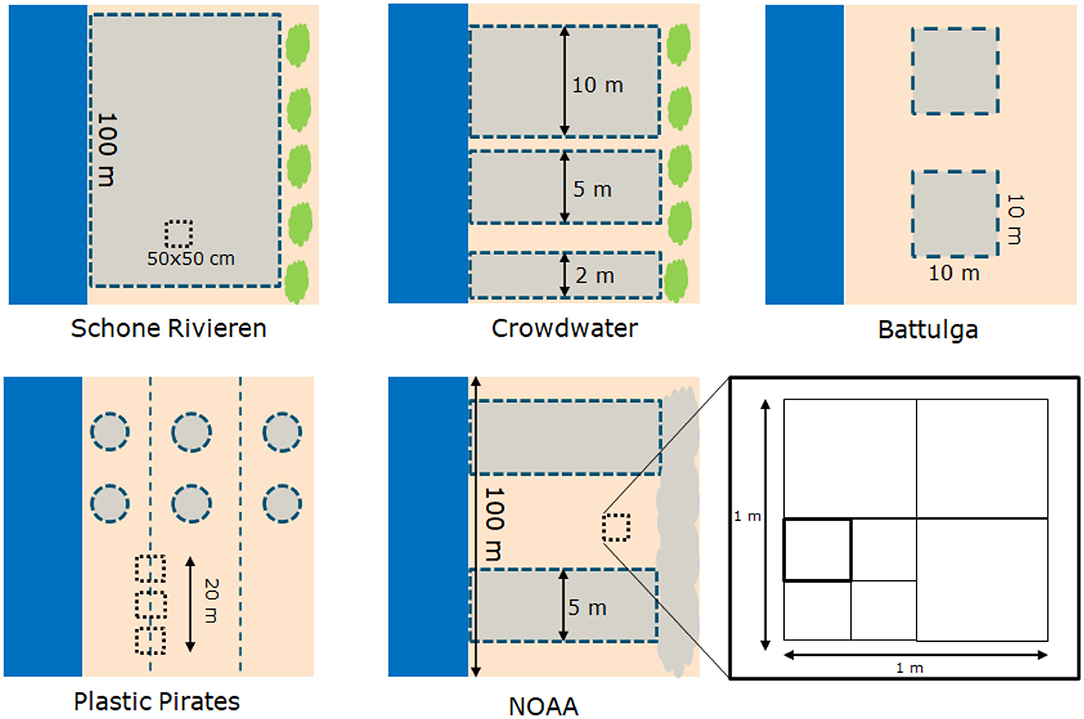
Figure 2. An overview of sampling areas (shaded areas, black dashed lines for microlitter analysis) for multiple riverbank plastic quantification protocols, and the NOAA beach litter protocol (adapted from Lippiatt et al., 2013) to exemplify random sampling.
Taking subsamples reduces the time required to perform the analysis, which allows for a more detailed analysis of the litter that is encountered. For example, Kiessling et al. (2019) allow for the observers to kneel and count. This reduces the uncertainty in the analysis of smaller particles as observed by Hanke et al. (2019). However, subsampling also comes with downsides, such as the risk of the over or under estimation of larger and less frequently found items. Moreover, most protocols allow the observers to choose where they take their samples, which can lead to data being influenced by observer bias. This issue can be negated by introducing an element of randomness to the sampling. For example, the NOAA beach monitoring protocol introduced random number tables which determine the exact location of transects, and the location of the microplastic sample (Lippiatt et al., 2013).
Depending on the goal of the monitoring program, data collection can be extended by collecting data at multiple distance-based zones, ranging from close to far from the river. By logging the distance of litter compared to the river, it can be determined at what levels of river discharge specific litter items are transported and deposited (van Emmerik et al., 2020a). This sub-element can be introduced by subdividing the sampling area in different (hydrological) zones, and determining what plastic is found within these zones. For example, Kiessling et al. (2019) take subsamples in three different hydrological zones on the riverbank, these being the river edge (river−5 m), the riverbank (5–15 m away from the river), and the zone that is not in contact with the river (15 m and beyond) (Figure 2, Plastic Pirates). This principle could also be implemented in protocols that do not take subsamples such as the Schone Rivieren project. However, an important consideration with these types of sampling methods is that river discharge, and thus the location of the water line on the riverbank, differ throughout the year. To avoid these problems and produce comparable data throughout changing conditions one can choose to take random subsamples within this area, or one can log the exact baseline location using GPS data (e.g., Bruge et al., 2018).
The third element to consider in space is the decision-making process for choosing where to perform monitoring along the river. The process of choosing sampling locations can either be structured or unstructured. In a structured process, locations are determined by expert judgement and are sampled in each measuring round (e.g., Schone Rivieren, 2017; Bruge et al., 2018). A structured process allows for site specific time trend analysis of plastic but is less suitable for examining the spatial variance of macroplastic along the river (van Emmerik et al., 2020a). An unstructured location decision process allocates sampling sites randomly along the river. As a result, different locations (both the side of the river and distance upstream from the river mouth) are used for each measuring round. For example, the sampling locations for the CrowdWater project (van Emmerik et al., 2020b) are not predetermined. Unstructured allocation of sampling sites gives a more representative overview of the spatial distribution of plastic over the river, and reduces the influences of site specific characteristics (e.g., how many visitors, proximity to sources of macroplastic) on the results (van Emmerik et al., 2020a).
Time: Period, Frequency, Structure, and Duration
The element of time can be divided in four sub-elements: the sampling period, frequency, temporal structure, and the duration (Figure 3). The timeframe in which all measurements for a measuring round are performed is called the sampling period. A measuring round is a set point in time at which the macroplastic presence is quantified (Figure 3A). The ideal length for measuring periods depends on the questions that one wants to answer. The period should be as short as possible when trying to determine the total plastic presence at a given time. This in order to reduce the effects of changes in environmental factors, such as discharge and wind, on the results. When trying to determine the effects of these environmental factors on riverine plastic transport, the sampling period should instead be longer and continuous in order to capture the natural variability of these events and their influence on the presence of plastic. Sampling periods vary widely over protocols. The Schone Rivieren protocol uses a measuring period of 4 weeks (van Emmerik et al., 2020a). The beach litter protocol developed by the National Oceanic and Atmospheric Administration (NOAA) wants measurements to be performed every 28 ± 3 days, the sampling period therefore is 7 days. A 1-day period was used by the Plastic Pirates project (Kiessling et al., 2019) and the CrowdWater project (van Emmerik et al., 2020b) since their observers did the work as part of the curriculum of schools and universities.
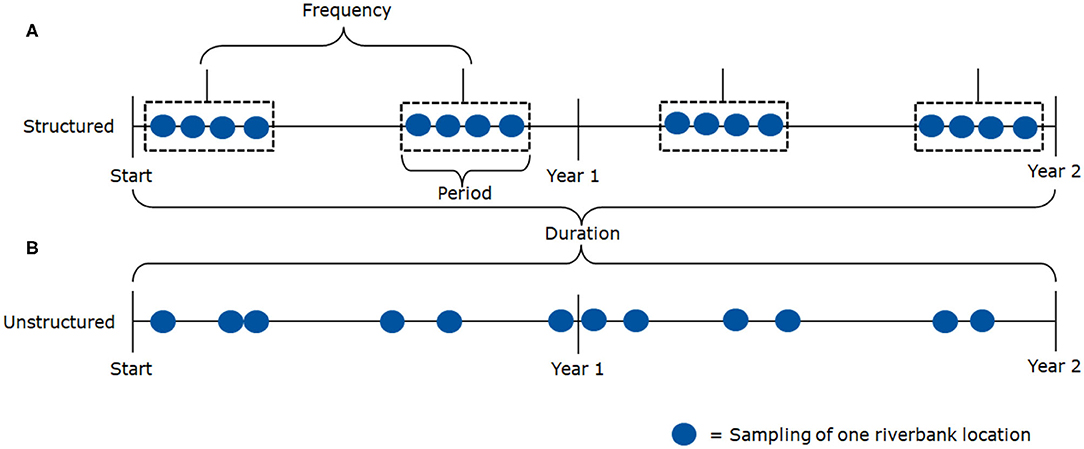
Figure 3. The four elements of time depicted on two timelines, where timeline (A) represents structured temporal sampling, and timeline (B) depicts unstructured temporal sampling. The duration is the total time that samples are taken, the frequency is the number of samples that are taken annually, and the period the time that samples are considered as one measuring round.
The second sub-element of time is the sampling frequency (Figure 3A). The sampling frequency is the number of times a sample is taken during a year. Ideally, the frequency should be balanced: samples should be taken at a rate high enough to identify litter trends, while not overburdening the observers. Most riverbank litter quantification protocols sample at a biannual frequency, once in spring and once in fall (Schone Rivieren, 2017; Kiessling et al., 2019). This is lower than frequencies used for coastal litter quantification, that are four times per year for the beach OSPAR method (OSPAR Commission, 2010) or once every month in the NOAA beach litter protocol (Lippiatt et al., 2013). The optimal frequency depends on the research questions. For example, if one tries to analyze the effects of local hydrometeorological changes on macroplastic transport and deposition, the sampling frequency should match the scale at which such events happen.
A third element to consider is the structure of the sampling (Figures 3A,B). The two aforementioned sub-elements occur when the protocol is structured. Structured protocols have a predetermined time protocol in which the timing of the sampling follows a preset pattern of measuring rounds and periods (e.g., Schone Rivieren, 2017; Bruge et al., 2018; Kiessling et al., 2019). The advantage of such a protocol is that the timing of the observations within the year are similar (e.g., beginning of fall), which ensures similar hydrometeorological conditions during each sampling round. Plastic sampling can also be unstructured. A random temporal protocol randomly allocates time slots for locations to be sampled rather than to follow a predetermined pattern. This allows for a larger temporal spread of observations throughout the year and captures more of the environmental gradients. The CrowdWater project comes clostest to fully unstructured temporal sampling as the observers are not bound to assigned observation time slots. However, since sampling timeslots are not randomly allocated but instead chosen by the observer, personal preferences (e.g., weather preferences) can introduce bias in the results.
The fourth sub-element of time is the duration of the monitoring program (Figures 3A,B). The duration is the range in time that observations are made on riverbanks, and can range from singular observations (Battulga et al., 2019) to multi-year monitoring programs (Bruge et al., 2018; Kiessling et al., 2019; van Emmerik et al., 2020a). This element has a large impact on the amount of resources that are required and can therefore affect choices for other elements. For example, Battulga et al. (2019) performed a one-off quantification of riverbank plastic which allowed for highly detailed item identification using only a few trained specialists. On the other hand, Kiessling et al. (2019) opted for a long-term monitoring plan that required them to utilize citizen scientists for their observations instead. The ideal duration of a monitoring strategy is dependent on the research question. For example, a long duration is required to determine the changes in litter presence over time (e.g., Kiessling et al., 2019), while a shorter duration can be used when determining riverine litter hotspots.
Observers
An important element to consider for monitoring is the observers used for the collection of samples. The quality of the observers determines the quality of the data. Two main choices for observers can be identified in the literature: sampling through the use of experts (e.g., Battulga et al., 2019) or through the utilization of citizen scientists (e.g., Lippiatt et al., 2013; Schone Rivieren, 2017; Kiessling et al., 2019; van Emmerik et al., 2020b). Sampling by trained professionals guarantees the highest chance for samples being taken similarly over time. However, hiring professionals is expensive and can thus limit the total number of samples that can be taken. Moreover, only a limited number of professionals are available, leading to further limitations in the number of samples that can be taken in a sampling period. Many initiatives therefore decided to use citizen scientists to sample riverbank litter. This allows for a large area to be sampled in a short period of time, while keeping the costs relatively low. This has the added benefit that it creates public awareness for the problem (Rambonnet et al., 2019). It is important to consider what the target group of the citizen scientists is, since this can impact the data quality. For example, Schone Rivieren (2017) and the CrowdWater project (van Emmerik et al., 2020b) used trained adults to do the sampling, while schoolchildren (aged 10–16 years) collected the samples in Kiessling et al. (2019) and Rech et al. (2015). To retain credible data quality, Kiessling et al. (2019) and Rech et al. (2015) used a simplified method compared to Schone Rivieren (2017), reducing for example the amount of litter categories.
Training of citizen scientists increases the quality and consistency of the data generated by citizen scientists (Zettler et al., 2017). Training can be done in multiple forms, for example, Kiessling et al. (2019) have developed an education program to be taught at schools. This program teaches children about environmental pollution and teaches the methods for riverbank litter sampling. Schone Rivieren (2017) organized training days at which trained professionals teach volunteers how to properly apply the methods to standardize the collection as much as possible. However, besides the training, the research team has little control over the data quality. It is therefore important to introduce a method to determine the accuracy of the volunteers. This, for example, can be done by reference measurements by trained professionals (Schone Rivieren, 2017; van Emmerik et al., 2020b), or by requiring the volunteers to take pictures of the research area so the raw data can be checked (Kiessling et al., 2019).
Categorization
Methods to classify the composition of litter in the literature can roughly be subdivided in three categories: classification based on identity, function, or material type of the item (Hoellein et al., 2014). Moreover, an important distinction that is made within monitoring program is what type of items are classified. Some protocols only quantify plastic litter items since they represent most of the riverine pollution (e.g., Battulga et al., 2019; van Emmerik et al., 2020b). Other programs decide to quantify all riverbank litter items (Kiessling et al., 2019: Schone Rivieren, 2017).
Item identity-based classification methods (e.g., Schone Rivieren, 2017) rely on the researcher identifying what the item is (e.g., cigarette filter, plastic bag, plastic bottles, etc.) and counting the specific items found in the research area. The item identification list for OSPAR beach litter monitoring is often used as a guide for this (e.g., Bruge et al., 2018; van Emmerik et al., 2020a). The advantages of using this system is that the litter is characterized at a very detailed level. Such data allows for more detailed and targeted data output for the monitoring. For example, identity-based categorization of floating macroplastic allowed the RIMMEL project to identify the 10 most frequently found items in the rivers they examined, which can be used by policy makers to implement highly targeted pollution reduction policies (González-Fernández et al., 2018). Identity-based classification methods risk having too many categories, which can lead to misclassification by the observers (Rambonnet et al., 2019). Several methods alleviated this problem by reduction of the number of item categories (e.g., Kiessling et al., 2019).
Function-based composition classification methods categorize litter based on what the item is used for (e.g., fishing, food related, construction) (Schwarz et al., 2019). This method of determining litter composition is less time consuming than the identity-based system, and the data can be compared to plastic production data to determine the amount of plastic lost to the environment (Geyer et al., 2017). Function-based analysis offers less detail for data analyses, and some items can belong to several function categories, which can make it difficult for the observer.
Material-based composition classification methods characterize litter based on the material it is (predominantly) made off (e.g., plastic, metal, glass). Each of these material types can be subdivided further in types of the material (e.g., different plastic polymers, metal types) (e.g., van Emmerik et al., 2018, 2020b). Material-based composition methods are useful when it is difficult to identify the identity or function of litter, or when research is focused on one material type (e.g., plastic). However, it is more difficult to identify possible sources of litter using this system. Proper identification of polymer types may require lab analysis of the litter (e.g., Raman spectroscopy or Fourier transform infrared spectroscopy) when labels on the items are missing, and classification difficulties occur when certain items are made up of multiple materials (van Emmerik et al., 2020a). Item based classification would be more suitable for such items.
Harmonization of data is required to allow for the comparison of results between monitoring programs. The fact that most studies use their own categorization schema makes that the combination of the results of multiple studies is only possible at the cost of a reduced level of detail of the data. Figure 4 shows a small section of a multi-layered schema that can be used to harmonize data from monitoring projects that have used different forms of categorization. The top layer of this scheme represents the total sample that is taken on the riverbank without categorization. This data can be used to quantify the amount of litter on riverbanks but does not consider what types of litter are found. The next layer represents the most detailed categorization that can be applied to the sample (identity-based categorization). Each further layer represents an increase in level of aggregation of the data gathered and a decrease in effort required to gather it. Aggregation of data obviously comes at the cost of a reduction in the level of detail but with the profit that more studies can be combined. When comparing datasets, the data can be aggregated to the level of detail of the projects lowest on this scale. For example, when comparing data from the CrowdWater project (van Emmerik et al., 2020b) that categorizes to polymer types with the Schone Rivieren protocol that categorizes at an item function, the data can only be compared at the level of detail of polymer type. The ideal level of detail of categorization depends on the research questions one tries to answer. The highest detail level of data could be necessary when one tries to trace specific items back to their source and can be used by policymakers to help develop targeted policy to reduce the most frequently found items. Lower levels of detail suffice for research that aim to quantify riverine plastic presence or identify riverine plastic hotspots.
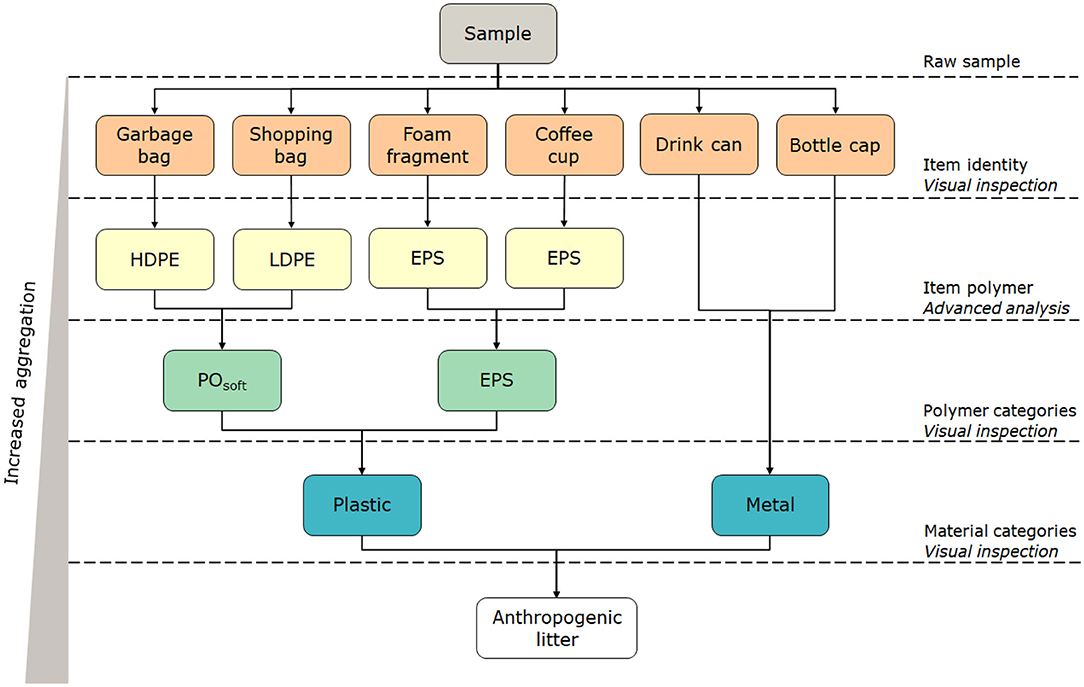
Figure 4. An example of riverbank plastic classification, where the upper layer represents the most detailed categorization (identity based, based on OSPAR categorization, not an exhaustive list), and each layer below represents a higher level of aggregation. The type of categorization and how this categorization is achieved is listed on the right side.
A second consideration for categorization is the size range of the debris that is analyzed. Riverbank plastic quantification protocols can be subdivided in three categories based on size of debris analyzed (1) protocols that quantify macroplastic, (2) protocols that quantify microplastic, and (3) protocols that analyze both micro- and macro-plastics. Protocols that quantify macroplastic have an approximate lower end size limit of 5 mm, though smaller particles are observed with a higher uncertainty since most protocols only sample litter that can be seen by observers who are standing up straight (Hanke et al., 2019). Protocols that quantify microplastic are well-established and highly standardized (e.g., Klein et al., 2015), since far more research has been done on microplastic than on macroplastic (Blettler et al., 2018).
Protocols that examine both size categories analyze macroplastic similarly to other protocols (e.g., Battulga et al., 2019). However, the microplastic analysis differs from the standardized protocols used for microplastic analysis. These methods include smaller particles up to a lower limit of around 1 mm. With this, small pellets are included, but microplastic for which lab analysis is required are excluded (van Emmerik et al., 2020a). Moreover, extensive treatment and analysis of the samples taken for microplastic analysis is lacking. The protocols used surely should be expanded to get an accurate indication of microplastic abundance in riverine systems.
Trade-Offs
When setting up monitoring programs using this framework (Figure 1), it is important to consider trade-offs between dimensions since certain decisions made for one element can influence the range of possibilities for another element. When considering that a project has limited resources, a balance has to be found between these elements. If one decides to sample a large area, or sample with high temporal frequency, it may be required to reduce the level of detail of the categorization in order to reduce the required human and financial resources. A second tradeoff can be identified between observers and categorization. Here, the decision on who is going to perform the research can influence the detail level of the categorization, and vice versa. For example, Kiessling et al. (2019) collaborated with school children aged 10–16 years for the data collection. This enabled them to sample a high number of locations at the same time since a large group of observers was available. However, this meant that they had to simplify the categorization to the point that only seven selected items were being analyzed since more complex categorization was deemed too complex for school children observers. The Schone Rivieren (2017) project uses a more elaborate categorization list of 109 items, which means that they require better trained observers for their sampling. Lastly, a trade-off presents itself between the elements of spatial scale and observers. When the spatial scale of sampling becomes too large, it is not feasible to gather enough trained professionals to sample at all locations, and thus requires the utilization of citizen scientists as observers.
The aforementioned trade-offs can be identified when each decision element range is visualized (Figure 5). Each axis in the plots in Figure 5 represents the scale of possibilities for each element as presented in Figure 1, where the inner circle represents the low effort/priority, and the outer circle represents high priority. The shape and orientation of the areas created by the marks are distinctly different for each protocol. For example, the Schone Rivieren protocol (Figure 5B) is orientated toward axis 1, 2, 3, 7, and 8, which translates in a high priority for spatial domain, sampling area, duration, categorization and size range. Contrarily, the CrowdWater protocol (Figure 5D) is orientated toward axis 3 and 4, indicating a priority for frequency and period. Each of the four protocols analyzed shows a distinctly different pattern, indicating tradeoffs were made. These differences are caused by the research goals of each monitoring program. The patterns in Figure 5 can be used to match methods to specific research questions. This knowledge can be used for future monitoring efforts to decide which methods to use.
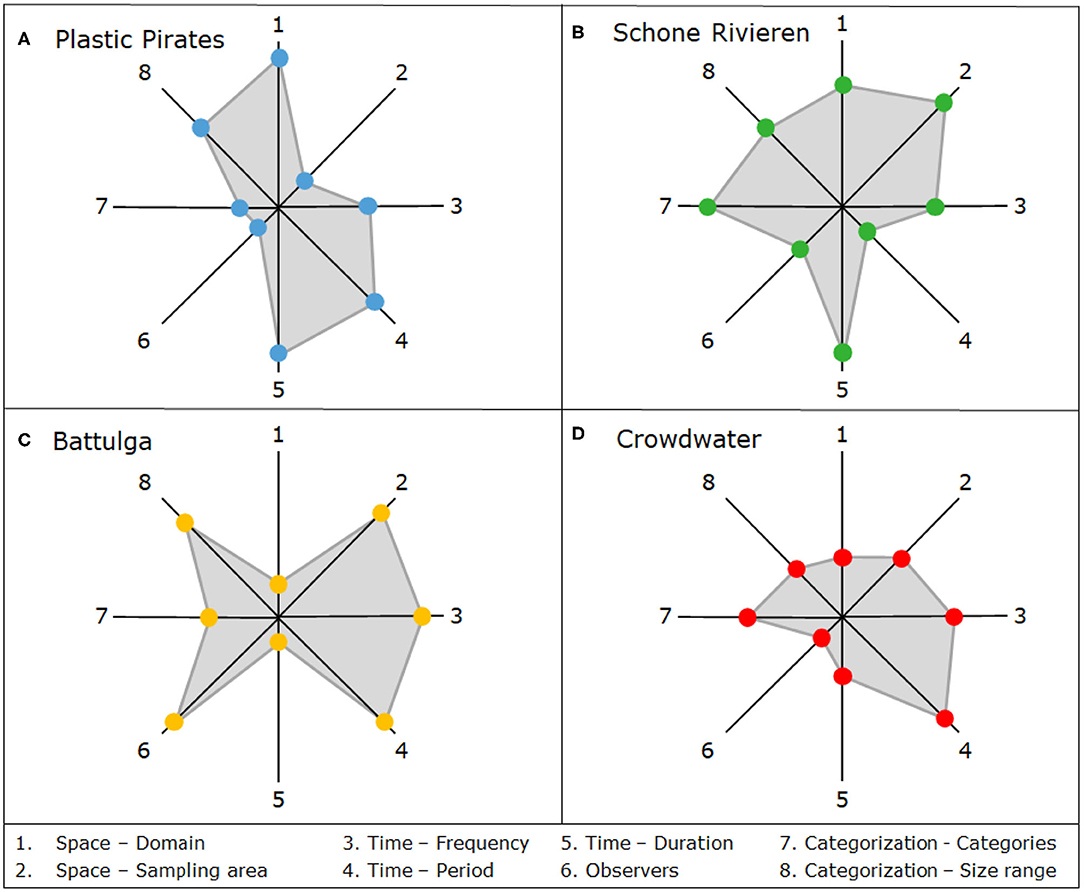
Figure 5. Graphical representation of the choices made for each element for the Plastic Pirates protocol (A), Schone Rivieren protocol (B), the Battulga protocol (C), and the CrowdWater protocol (D). Where each axis represents the following elements: (1) Sampling scale, (2) Space—Sampling area, (3) Time—Frequency, (4) Time—Period, (5) Time—Duration, 6. Observers, 7. Categorization, and (8) Size range. For each axis, the inner part represents low priority, and the outer part represents high priority. The sub-element of structure for time and space were excluded since these factors do not influence total cost.
The research aims for the Plastic Pirates project were to determine the material composition and spatial distribution of litter on a multi-river basin scale. To do so, Kiessling et al. (2019) had to make trade-offs on observers and categorization: the sampling was performed by citizen scientists, and the categorization was reduced to seven items. Future monitoring efforts that aim to determine the composition and spatial distribution of riverbank litter will likely encounter the same trade-offs and should therefore also take a citizen science approach with a similar temporal and spatial structure as a starting point.
The Schone Rivieren protocol can be used as an example for monitoring efforts with the aim to identify litter trends of specific items over time and space. The highly detailed categorization used within the Schone Rivieren protocol allows for the quantification of specific items. These data can be used to determine most frequently found items and to design targeted policy. To answer these specific research questions, the Schone Rivieren project required a protocol with a focus on duration and item categorization. However, the large domain also created the need for a citizen science approach instead of trained professionals. Future monitoring efforts with similar aims should therefore take the Schone Rivieren approach as a starting point.
The Battulga protocol is an example of how plastic pollution can be quantified on a local scale. By reducing the domain, the Battulga protocol allows for resources to be spent on a highly trained observers and a detailed categorization level. Future projects with the need for such a localized and detailed analysis can therefore use this protocol as a starting point. Lastly, the CrowdWater protocol is an example of a method to gather data in a relatively fast way. This quick method decreases the threshold for new citizen scientists to join the project. Though the data gathered using this method is rather coarse, the large group of citizen scientists ensure that the method can be applied on a large spatial and temporal scale. Future monitoring projects that quickly require data on a large temporal and spatial scale, and do not require a high level of detail in the data, can use the CrowdWater as a template.
Guidelines for Monitoring
The framework presented in this paper demonstrates that there is no universally applicable riverbank plastic monitoring strategy. The optimal monitoring strategy is highly dependent on the research question and available resources (e.g., monetary, time, equipment). In this section we apply the framework to identify suitable monitoring strategy alternatives for four research questions, taking different resource availability levels in consideration. The first two research questions are of interest to policy makers. The latter two research questions are focused on gaining a deeper scientific understanding of fundamental behavior of riverine plastic pollution. Note that we discuss a non-exhaustive selection of research questions and monitoring strategy options.
Research Questions Relevant for Policy Makers
1. What are the most common litter items found in a river basin?
To determine the most common litter items in a river system, priority needs to be given to both the spatial domain and categorization (Figure 6). Additionally, a short sampling period is recommended to keep the environmental factors such as river discharge and wind speed, as well as anthropogenic factors (e.g., people visiting riverbanks) as similar as possible. The other elements of the framework can be chosen according to the resource availability but remain interdependent. In a scenario with relatively low resources it can be decided to keep the sampling area relatively small, making observations faster and cheaper. Moreover, the spatial structure of the sampling can be optimized. By choosing the river beaches with expert judgement, rather than randomly (much) fewer observational sites might be necessary, especially in countries with large environmental variability in land-use, topography and population density. The frequency of measurements can be kept at a minimum to answer the research question. The decision on when the observations should take place is strongly context dependent, but in most cases organizing two sampling rounds, one in spring and one in autumn would be ideal. This way one sampling round covers the litter left behind by people visiting the riverbanks during the summer while the other covers items deposited during high discharge events during the rest of the year. Observers and categorization are strongly connected. To answer the question of most common item a more detailed categorization scheme should be utilized. This restricts the choice of observer as more in-depth instruction would be necessary, which would most likely exclude the choice of performing these observations as school assignment, such as done by Kiessling et al. (2019). Size range can be adjusted somewhat to give more detailed data or to reduce sampling time. A minimum threshold of item size can be determined to make both categorization easier and doable while standing.
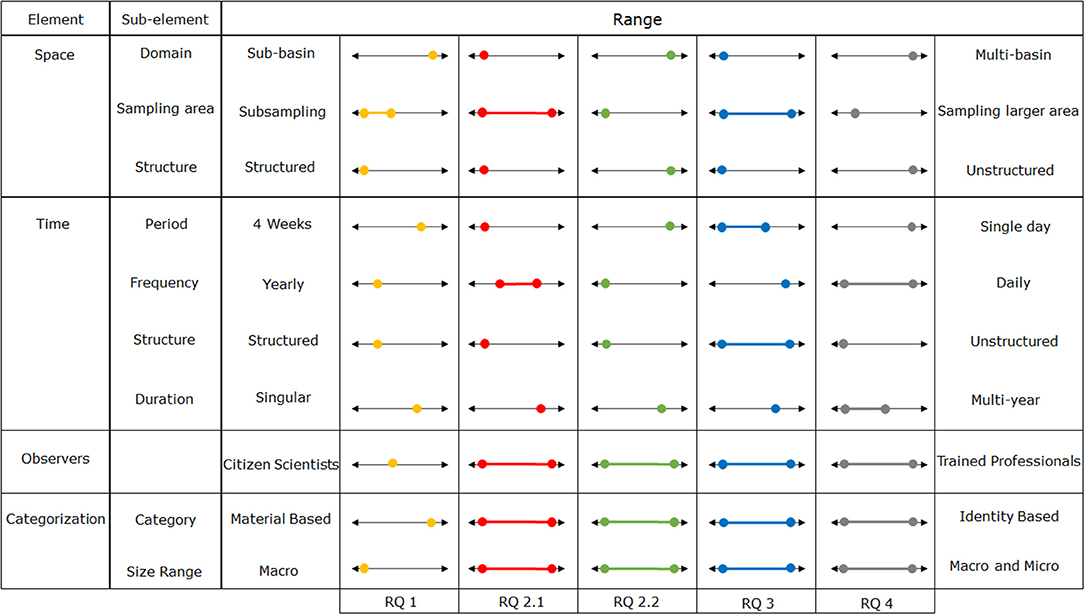
Figure 6. A schematic representation of the five monitoring strategies suggested for four research questions, with yellow representing the suggested strategy for research question 1 (common litter items), red and green representing the suggested strategies for research question 2 with red having a focus on time, and green having a focus on space, blue representing the suggested strategy for research question 3 (seasonal variations of litter), and gray representing the suggested strategy for research question 4 (hotspot identification).
2. Are newly implemented policies effective at reducing the presence of specific items in a river basin?
A baseline needs to be constructed to monitor the efficacy of a policy on the number of specific items found in a river basin. Two strategies can be used to do this: one focusing on the time and the other on the space dimension (Figure 6). The strategy focusing on time monitors a number (potentially low if resources are limited) of locations that are sampled several times before and after the policy is implemented to find trends in time. If only few sites are sampled it is recommended to allocate them with expert-judgement rather than at random, to cover as much of the environmental variability as possible in those sites. Depending on the exact research question, a suitable monitoring duration can be determined. The samples, per round, can occupy a large period, as locations are tracked individually. Frequency of the samples can be kept relatively low when resources are low, but to capture variability induced by hydrometeorological circumstances more samples need to be taken. The sampling area can be decided based on the expected abundance of the items affected by the policies. If the abundance is high, a small sampling area can be used. Less abundant items require a larger sampling area to ensure a representative sample.
Alternatively, a strategy can be used that focuses on a large number of samples in space rather than in time. By doing this you are not tracking specific locations over time but comparing litter quantity distributions before and after implementation of the policy, similar to randomized control trials in medicinal and political studies. As the spatial variability of litter is very large, a lot of randomly allocated sampling locations are necessary. To reduce sampling burden, it can be decided to keep the sampling area relatively small. This sampling strategy requires few sampling rounds, but samples should be taken in a relatively short period to prevent distribution distortion by hydrometeorological events. In both sampling strategies observer and size range depend on the specific item that the policy is implemented on. If for example plastic bags are banned there is basically no invalid observer choice, while smaller, harder to determine items or item categories (such as single use plastic items) a minimum in training of the observers is required.
Research Questions Relevant for Improving Fundamental Understanding
3. Does riverbank macrolitter exhibit seasonal variations?
Seasonal changes in macrolitter abundance are hypothesized to be caused by hydrometeorology and singular events such as people visiting the riverbanks for recreational purposes. The duration of a suitable monitoring strategy should therefore be at least 1 year to capture the complete seasonal cycle of litter presence (Figure 6). However, only sampling a single year might cause significant biases as the importance of singular (chance) events are a relatively strong driver of litter quantities. A high measurement frequency must be adopted to capture such singular events. The temporal structure of the sampling might both be evenly structured or random. If random temporal sampling is adopted, it needs to be implemented in a way that still covers all seasons (for example by picking a random day of every month). The spatial dimension for this research question depends on the context of the project, but potentially a single, well-chosen location might be sufficient to get an initial understanding of the temporal variability. To draw conclusions covering a more diverse set of environments more sampling locations can be added. In both cases it would be recommended to decide on the sampling location with expert-judgement. Observers and categorization schemes are again strongly linked. In a context of low resource availability, it might be decided upon to not categorize litter and just weigh the total amount of litter at a location, which does not restrict the choice of observer. If seasonality in both quantity and composition of the litter are of interest a more detailed scheme might be used, which consequentially reduces the choice of observers. The sampling area is dependent on the litter density in the river system. Low litter densities require a large sampling area to ensure the gathering of a representative litter sample, while subsampling can be utilized if the litter density is high.
4. Where are riverbank macrolitter hotspots in river systems?
A strongly spatially distributed monitoring strategy is required to find the hotspots in litter quantity in a river system (Figure 6). The samples should cover the whole system and the sampling sites are recommended to be chosen randomly. It can be decided to sample only a small area per sample to keep resource burden of the samples as low as possible. The temporal dimension strongly depends on the context of the question. Potentially a single measurement round would suffice to determine hotspots, although the seasonal cycle in litter quantities would likely be able to change the hotspot locations. To keep the samples as similar as possible to avoid capturing differences in litter quantity caused by changes in hydrometeorological conditions, the samples should be taken in a time window that is as short as possible. Again, observers and item categorization are strongly linked. To purely locate hotspots, it might for example be decided to use drones to capture images of the beaches that are interpreted categorically by the observer as non/medium/strongly polluted, thus getting an overview of pollution with relatively low manpower and with potentially a very high-resolution picture of hotpots. This method is however rather imprecise, making it impossible to determine hotspots of specific items and getting exact numbers on litter quantities. If it is decided to sample litter in the field, the observer and categorization tradeoff is similar to question 3. The more detailed the categorization, the more instruction the observer should receive, limiting the choice of potential observers. If sampled litter is not categorized, and only its mass is measured, a broader group of people would potentially be able to perform the observations.
Discussion
Riverine plastic pollution is a global and transboundary problem that requires internationally consistent observations to be reduced. We have identified several steps that can be taken to improve riverbank litter monitoring programs on such a global scale. Firstly, we mark the importance of using harmonized protocols. Currently, methods vary greatly between monitoring programs. This suffices for monitoring litter on a local scale, but it makes identifying riverine litter trends on a global scale more difficult since the collected data may also differ considerably (Rambonnet et al., 2019). Building upon this, we also highlight the need for the sharing of data between litter monitoring initiatives. Little data is currently shared between riverine litter monitoring programs (González et al., 2016). Data collection, recording, and sharing could be further harmonized and streamlined through the usage of standardized apps (Rambonnet et al., 2019). The sharing, and subsequent intercomparison of data between different monitoring programs could aid with identifying strengths and weaknesses of the methods that are being applied and allow for. It would also allow for the comparison of monitoring programs for the same river in different countries (e.g., Schone Rivieren, 2017; Kiessling et al., 2019). Moreover, comparing data between different areas could present insights on how litter pollution is different in different regions and river basins.
Secondly, we identified a discrepancy in the focus of riverine litter research. Riverbank litter quantification efforts can be grouped in two categories: plastic focused or all anthropogenic litter focused research. Plastic focused efforts only quantify plastic litter that is found on riverbanks (e.g., Battulga et al., 2019; van Emmerik et al., 2020b). While plastic has been recognized as a major component of litter in river systems (van Emmerik and Schwarz, 2020), research has shown that litter composed of other materials has a significant presence as well (Kiessling et al., 2019). What materials to focus the monitoring efforts on depends on what the monitoring data will be used for. Detailed data on all material types are required for developing preventative policy measures since data on frequently found items can be used to implement bans on these items. Research focused solely on plastics is useful for riverbank cleaning efforts since different plastic polymers are handled differently by waste handlers. It is however important to consider with plastic focused monitoring that litter made up of different materials are also present when communicating the results.
Thirdly, the proposed framework is based on studies that have been applied on European rivers since these are most frequently studied for plastic pollution (Blettler et al., 2018; Owens and Kamil, 2020). However, observations of floating macroplastic transport have demonstrated that typical plastic concentrations and transport loads can be several orders of magnitude higher in other regions (South-East Asia vs. Europe), and during different hydrological regimes (van Calcar and van Emmerik, 2019). Higher plastic concentrations can influence the applicability of riverbank plastic quantification protocols. For example, riverbanks with large amounts of plastic deposited on them require more time to be sampled since more item have to be analyzed. We therefore emphasize the importance to expand riverbank plastic monitoring efforts to areas with higher plastic concentrations.
We see possibilities to further expand on and improve current riverbank identification protocols through the utilization of new technologies. The usage of cameras with artificial intelligence models to automatically quantify litter could be utilized to significantly decrease the effort required monitoring. Such cameras and software are already being used to quantify floating riverine plastic (Basurko et al., 2019; Kataoka and Nihei, 2020; van Lieshout et al., 2020). Combining this technology with the utilization of unmanned aerial vehicles (UAVs) has been suggest as effective alternatives to quantify floating macroplastic transport in rivers (Geraeds et al., 2019) and beach litter (Martin et al., 2018). The implementation of such technologies is easier when a common framework for riverbank litter monitoring is adopted since this ensures that units of measurement are similar between different monitoring programs.
Finally, it is important to recognize that riverbank litter is only one component of the total litter transport in a river system. Like van Emmerik and Schwarz (2020) have identified, the total litter load in a river is made up of several components, including floating and suspended litter among others. Therefore, specific methods for each component have to be combined to fully quantify riverine litter transport, and to study whether studying one element is representative for the total plastic transport within rivers. Doing so would provide a more accurate picture of litter transport by rivers, which could aid with the development of reduction and mitigation strategies, as well as with calibration of global riverine plastic emission models (e.g., Jambeck et al., 2015; Lebreton et al., 2017; Meijer et al., 2019) (Vriend et al., 2020).
Concluding Remarks
In this paper, we propose a framework for designing and comparing riverbank macroplastic monitoring strategies. Monitoring of river plastic pollution is required in order to design efficient mitigation and removal strategies. However, methods to do so vary greatly which makes it difficult to compare and use data on a large scale. This novel framework is the first effort to systematically compare monitoring protocols currently in use.
The framework identifies four key elements to riverine monitoring protocols: (1) space (scale, sampling area and structure), (2) time (duration, structure, frequency, and period), (3) observers, and (4) plastic categorization (categories and size range), and gives the range of possibilities that can be used for each of these elements. This framework can be used to systematically compare, harmonize and optimize current riverbank plastic monitoring protocols, and can be used as a guide for future monitoring initiatives to matchmake their research goals to suitable research methods.
We propose a diagram that can be used to harmonize data between programs, which facilitates the comparison of data. Moreover, we identify trade-offs that have been made in current monitoring protocols in their design processes. We use these trade-offs to matchmake specific riverbank plastic monitoring research questions to the most suitable methods to answer these questions. This information can be used starting point for those interested in setting up monitoring programs themselves.
The framework can be used by researchers, governments and other organizations to help with the developing and optimizing riverbank macroplastic monitoring strategies that fit local conditions and ambitions. We show how the framework can be used to achieve this by using the framework to suggest monitoring strategies for a set of commonly used research questions. We hope that this guiding framework offers help for those wanting to start monitoring riverbank plastics, and with it, lowers the threshold for organizations to do so. This framework is a step toward a standardized riverbank plastic monitoring protocol. Frequent and long-term monitoring using such a protocol would provide scientifically sound and objective data on global plastic pollution, which will allow for the finding of answers to fundamental questions about how plastic is transported within river systems, where it accumulates and how to efficiently remove it. These data could be used for the development of targeted and effective policy to decrease plastic environmental pollution and to reduce the negative impacts it currently has.
Data Availability Statement
All datasets generated for this study are included in the article/supplementary material.
Author Contributions
PV and TE conceived the idea. PV conducted the literature review and prepared the initial draft. PV, CR, and TE wrote the final manuscript. All authors contributed to the article and approved the submitted version.
Funding
This research was partly funded by the Dutch Ministry of Infrastructure and Water Management, Directorate-General for Public Works and Water Management (Rijkswaterstaat).
Conflict of Interest
The authors declare that the research was conducted in the absence of any commercial or financial relationships that could be construed as a potential conflict of interest.
Acknowledgments
We thank Marijke Boonstra, Winnie de Winter, and Merijn Hougee from Stichting De Noordzee for the fruitful discussions, which motivated this manuscript. We thank Juliane Kupfernagel, Anna Schwarz, Winnie de Winter, and Gert Vriend for their valuable inputs during the writing process.
References
Basurko, O. C., Epelde, I., Liria, P., Ruiz, I., Delpey, M., Declerck, A., et al. (2019). Monitoring riverine litter by advanced technology. Eur. Geosci. Union Gen. Assemb. 21, EGU2019–EGU18999.
Battulga, B., Kawahigashi, M., and Oyuntsetseg, B. (2019). Distribution and composition of plastic debris along the river shore in the Selenga River basin in Mongolia. Environ. Sci. Pollut. Res. 26, 14059–14072. doi: 10.1007/s11356-019-04632-1
Blettler, M. C., Abrial, E., Khan, F. R., Sivri, N., and Espinola, L. A. (2018). Freshwater plastic pollution: recognizing research biases and identifying knowledge gaps. Water Res. 143, 416–424. doi: 10.1016/j.watres.2018.06.015
Bruge, A., Barreau, C., Carlot, J., Collin, H., Moreno, C., and Maison, P. (2018). Monitoring litter inputs from the adour river (Southwest France) to the marine environment. J. Sci. Eng. 6:24. doi: 10.3390/jmse6010024
Dalu, T., Malesa, B., and Cuthbert, R. N. (2019). Assessing factors driving the distribution and characteristics of shoreline macroplastics in a subtropical reservoir. Sci. Total Environ. 696:133992. doi: 10.1016/j.scitotenv.2019.133992
Geraeds, M., van Emmerik, T., de Vries, R., and bin Ab Razak, M. S. (2019). Riverine plastic litter monitoring using unmanned aerial vehicles (UAVs). Remote Sens. 11:2045. doi: 10.3390/rs11172045
Geyer, R., Jambeck, J. R., and Law, K. L. (2017). Production, use, and fate of all plastics ever made. Sci. Adv. 3:e1700782. doi: 10.1126/sciadv.1700782
González, D., Hanke, G, Tweehuysen, G., Bellert, B., Holzhauer, M., Palatinus, A., et al. (2016). Riverine Litter Monitoring - Options and Recommendations. MSFD GES TG Marine Litter. Thematic Report; JRC Technical Report; EUR 28307. Luxembourg: Publications Office of the European Union.
González-Fernández, D., and Hanke, G. (2017). Toward a harmonized approach for monitoring of riverine floating macro litter inputs to the marine environment. Front. Mar. Sci. 4:86. doi: 10.3389/fmars.2017.00086
González-Fernández, D., Hanke, G., Kideys, A., Navarro-Ortega, A., Sanchez-Vidal, A., Brugère, A., et al. (2018). Floating Macro Litter in European Rivers-Top Items (JRC technical report). Luxembourg: European Commission-DG Joint Research Centre.
Hanke, G., Walvoort, D., van Loon, W., Addamo, A. M., Brosich, A., del Mar Chaves Montero, M., et al. (2019). EU Marine Beach Litter Baselines. EU Science Hub. Luxembourg: Publications Office of the European Union.
Hoellein, T., Rojas, M., Pink, A., Gasior, J., and Kelly, J. (2014). Anthropogenic litter in urban freshwater ecosystems: distribution and microbial interactions. PLoS ONE 9:e98485. doi: 10.1371/journal.pone.0098485
Honingh, D., van Emmerik, T., Uijttewaal, W., Kardhana, H., Hoes, O., and van de Giesen, N. (2020). Urban river water level increase through plastic waste accumulation. Front. Earth Sci. 8:28. doi: 10.3389/feart.2020.00028
Jambeck, J. R., Geyer, R., Wilcox, C., Siegler, T. R., Perryman, M., Andrady, A., et al. (2015). Plastic waste inputs from land into the ocean. Science 347, 768–771. doi: 10.1126/science.1260352
Kataoka, T., and Nihei, Y. (2020). Quantification of floating riverine macro-debris transport using an image processing approach. Sci. Rep. 10:2198. doi: 10.1038/s41598-020-59201-1
Kiessling, T., Knickmeier, K., Kruse, K., Brennecke, D., Nauendorf, A., and Thiel, M. (2019). Plastic Pirates sample litter at rivers in Germany–riverside litter and litter sources estimated by schoolchildren. Environ. Pollut. 245, 545–557. doi: 10.1016/j.envpol.2018.11.025
Klein, S., Worch, E., and Knepper, T. P. (2015). Occurrence and spatial distribution of microplastics in river shore sediments of the Rhine-main area in Germany. Environ. Sci. Technol. 49, 6070–6076. doi: 10.1021/acs.est.5b00492
Lebreton, L. C., Van der Zwet, J., Damsteeg, J. W., Slat, B., Andrady, A., and Reisser, J. (2017). River plastic emissions to the world's oceans. Nat. Commun. 8:15611. doi: 10.1038/ncomms15611
Lippiatt, S., Opfer, S., and Arthur, C. (2013). Marine debris monitoring and assessment: recommendations for monitoring debris trends in the marine environment. Front. Mar. Sci. 6:447. doi: 10.3389/fmars.2019.00447
Mani, T., Hauk, A., Walter, U., and Burkhardt-Holm, P. (2015). Microplastics profile along the Rhine river. Sci. Rep. 5:17988. doi: 10.1038/srep17988
Martin, C., Parkes, S., Zhang, Q., Zhang, X., McCabe, M. F., and Duarte, C. M. (2018). Use of unmanned aerial vehicles for efficient beach litter monitoring. Mar. Pollut. Bull. 131, 662–673. doi: 10.1016/j.marpolbul.2018.04.045
Meijer, L. J. J., van Emmerik, T., Lebreton, L., Schmidt, C., and van der Ent, R. (2019). Over 1000 rivers accountable for 80% of global riverine plastic emissions into the ocean. arXiv. doi: 10.31223/osf.io/zjgty
Olivelli, A., Hardesty, D., and Wilcox, C. (2020). Coastal margins and backshores represent a major sink for marine debris: insights from a continental-scale analysis. Environ. Res. Lett. 15:074037. doi: 10.1088/1748-9326/ab7836
OSPAR Commission (2010). Guideline for monitoring Marine Litter on the Beachers in the OSPAR Maritime Area. London: OSPAR commission.
Owens, K. A., and Kamil, P. I. (2020). Adapting coastal collection methods for river assessment to increase data on global plastic pollution: examples from India and Indonesia. Front. Environ. Sci. 7:208. doi: 10.3389/fenvs.2019.00208
Rambonnet, L., Vink, S. C., Land-Zandstra, A. M., and Bosker, T. (2019). Making citizen science count: best practices and challenges of citizen science projects on plastics in aquatic environments. Mar. Pollut. Bull. 145, 271–277. doi: 10.1016/j.marpolbul.2019.05.056
Rech, S., Macaya-Caquilpán, V., Pantoja, J. F., Rivadeneira, M. M., Campodónico, C. K., and Thiel, M. (2015). Sampling of riverine litter with citizen scientists—findings and recommendations. Environ. Monitor. Assess. 187:335. doi: 10.1007/s10661-015-4473-y
Schone Rivieren. (2017). Handleiding Voor Monitoring. Avaliable online at: https://schonerivieren.org/images/Onderzoek/DEF_Handleiding_monitoring_-_Schone_Rivieren_2018-2019.pdf (accessed April 21, 2020).
Schwarz, A. E., Ligthart, T. N., Boukris, E., and Van Harmelen, T. (2019). Sources, transport, and accumulation of different types of plastic litter in aquatic environments: a review study. Mar. Pollut. Bull. 143, 92–100. doi: 10.1016/j.marpolbul.2019.04.029
van Emmerik, T., and Schwarz, A. (2020). Plastic debris in rivers. Wiley Interdiscip. Rev. Water 7:e1398. doi: 10.1002/wat2.1398
van Calcar, C. J., and van Emmerik, T. H. M. (2019). Abundance of plastic debris across European and Asian rivers. Environ. Res. Lett. 14:124051.
van Emmerik, T., Kieu-Le, T. C., Loozen, M., van Oeveren, K., Strady, E., Bui, X. T., et al. (2018). A methodology to characterize riverine macroplastic emission into the ocean. Front. Mar. Sci. 5:372. doi: 10.3389/fmars.2018.00372
van Emmerik, T., Seibert, J., Strobl, B., Etter, S., den Oudendammer, T., Rutten, M., et al. (2020b). Crowd-based observations of riverine macroplastic pollution. Front. Earth Sci. 8:298 doi: 10.3389/feart.2020.00298
van Emmerik, T., Tramoy, R., van Calcar, C., Alligant, S., Treilles, R., Tassin, B., et al. (2019). Seine plastic debris transport tenfolded during increased river discharge. Front. Mar. Sci. 6:642. doi: 10.3389/fmars.2019.00642
van Emmerik, T. H. M., Vriend, P., and Roebroek, C. T. J. (2020a). An Evaluation of the River-OSPAR Method for Quantifying Macrolitter on Dutch Riverbanks. Wageningen: Wageningen University.
van Lieshout, C., van Oeveren, K., van Emmerik, T., and Postma, E. (2020). Automated river plastic monitoring using deep learning and cameras. Earth Space Sci. 7:e2019EA000960. doi: 10.1029/2019EA000960
Vriend, P., Van Calcar, C., Kooi, M., Landman, H., Pikaar, R., and Van Emmerik, T. (2020). Rapid assessment of floating macroplastic transport in the Rhine. Front. Mar. Sci. 7:10. doi: 10.3389/fmars.2020.00010
Weinstein, J. E., Crocker, B. K., and Gray, A. D. (2016). From macroplastic to microplastic: degradation of high-density polyethylene, polypropylene, and polystyrene in a salt marsh habitat. Environ. Toxicol. Chem. 35, 1632–1640. doi: 10.1002/etc.3432
Keywords: macroplastic, microplastic, observations, litter, hydrology, marine litter, citizen scientists, riverbank
Citation: Vriend P, Roebroek CTJ and van Emmerik T (2020) Same but Different: A Framework to Design and Compare Riverbank Plastic Monitoring Strategies. Front. Water 2:563791. doi: 10.3389/frwa.2020.563791
Received: 19 May 2020; Accepted: 24 August 2020;
Published: 21 October 2020.
Edited by:
Karsten Rinke, Helmholtz Centre for Environmental Research (UFZ), GermanyReviewed by:
Eddy F. Pazmino, Escuela Politécnica Nacional, EcuadorJoana Correia Prata, University of Aveiro, Portugal
Copyright © 2020 Vriend, Roebroek and van Emmerik. This is an open-access article distributed under the terms of the Creative Commons Attribution License (CC BY). The use, distribution or reproduction in other forums is permitted, provided the original author(s) and the copyright owner(s) are credited and that the original publication in this journal is cited, in accordance with accepted academic practice. No use, distribution or reproduction is permitted which does not comply with these terms.
*Correspondence: Paul Vriend, cGF1bC52cmllbmRAd3VyLm5s