 Hannah Ritchie
 Jessica A. Eisma
 Alison Parker
- 1Cranfield Water Science Institute, Cranfield University, Bedford, United Kingdom
- 2Department of Civil Engineering, University of Texas at Arlington, Arlington, TX, United States
Sand dams, a rainwater harvesting technique, are small dams constructed across ephemeral streams. During the rainy season, water is stored in the sand that accumulates behind the dam. Sand dams provide communities in drylands with water during the dry season via scoop holes, pools, and shallow wells. Whilst many studies portray sand dams as a positive solution to the growing threat of dryland water insecurity, others highlight their challenges, including poor water quality, evaporation and leakage from some dams, and the contested failure rate and ability of dams to provide water year-round. This article reviews the peer-reviewed and gray literature on sand dams discovered through Scopus and Google Scholar searches, reference lists, and personal contacts. Findings from the collected literature were reviewed and categorized into sand dam hydrology, health and well-being impacts, economic cost and benefits, and water quality topics. In most numerical simulations, sand dams supply water to the local community throughout much of the dry season and exhibit a long-term positive impact on groundwater. Accounts of water storage and loss based on field measurements, conversely, often show that most water is lost due to evapotranspiration and seepage from the sand reservoir rather than community use. Furthermore, the positive impact on local groundwater storage, while variable, is likely seasonal. Sand dams are relatively affordable to build; construction estimates range from 6,000 to 8,500 EUR. However, existing literature suggests that sand dams are likely not a cost-efficient means of supplying water. Nevertheless, successful sand dams can significantly increase water availability and use, whilst reducing traveling time for water collection, subsequently providing a host of secondary benefits from improved hygiene, economic opportunity, and education. Positive impacts, however, are not equally shared and depend on variables, such as abstraction method, catchment, and household location. Furthermore, their water quality is variable, with high microbiological levels detected especially in scoop holes. Whilst sand dams can increase water security and resilience, they may not be an inclusive solution for all. More research is needed to assess the long-term sustainability of sand dams while accounting for the uncertainty of a changing climate.
1. Introduction
Climate change is exacerbating water stress worldwide. Rural dryland communities already struggling to meet water demand will face increasing water shortages under climate change (Huang et al., 2017). The prevalence of water in the United Nations' 2015 Sustainable Development Goals is a testament to its importance for the global community (United Nations General Assembly, 2015), and public and private entities have responded accordingly. The fraction of all water-related publications dedicated to dryland challenges has exhibited a sharp uptick in the past few years (see Figure 1). Water harvesting techniques, such as roof tanks, dams, and rock catchments are a popular way to tackle climate change-driven increases in rural water insecurity. However, there is often a disconnect between research-based technical guidelines on water harvesting and its implementation, which is largely led by private organizations. This disconnect is likely caused by (1) insufficient consideration of physiographic and sociocultural differences (Yemenu et al., 2014; Lasage and Verburg, 2015), (2) poor alignment between the needs of rural residents and the organizations who study or implement water harvesting techniques (Wanyonyi, 2013), (3) missing data on important indicators in many water harvesting datasets, and (4) the poor public accessibility of the data that does exist (Lasage and Verburg, 2015).
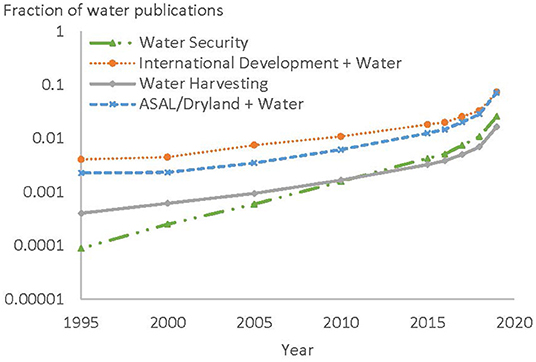
Figure 1. Prevalence of dryland water harvesting topics in the full text of published literature as a fraction of all published literature on the topic of water in a given year. Source: Google Scholar, Date retrieved: 27 Dec 2020.
One such water harvesting technique deployed in drylands are sand dams, on which this review will be focused. Sand dams are small dams built across impervious sandy streambeds in drylands that experience infrequent, high-intensity rainfall. Rainfall erodes the topsoil, and surface runoff transports the soil to streams, where it is carried along by ephemeral streamflow. Sand settles behind the dam wall, while lighter silt and clay particles remain suspended and are transported over the dam's spillway. Over time, the sand behind the dam becomes level with the top of the spillway, indicating that the dam has fully matured (see Figure 2). Depending on erosion rates within the catchment, sand dams can take anywhere from one season to 7 years to mature (Borst and de Haas, 2006). Rainfall and surface runoff infiltrate into the sand dam and are stored in the pore spaces between sand particles. Local communities use the stored water for domestic and agricultural purposes. Many sandy streambeds store water in drylands, but sand dams scale up this potential by increasing the volume of sand in the streambed. In addition to increasing the potential for water storage, sand dams can also help protect stored water from evaporation (Borst and de Haas, 2006; Quinn et al., 2018b; Eisma and Merwade, 2020), increase the quality of stored water (Quinn et al., 2018a; Graber Neufeld et al., 2020), improve overall ecosystem health (Manzi and Kuria, 2012; Ryan and Elsner, 2016; Eisma and Merwade, 2020), and improve the well-being of the local community (de Bruijn and Rhebergen, 2006; Lasage et al., 2008; Pauw et al., 2008; Maddrell, 2010). Despite numerous positive impacts cited in the literature, some studies note that not all sand dams effectively capture and store water (Van Loon and Droogers, 2006; Nissen-Petersen, 2010; de Trincheria et al., 2015, 2018; Eisma and Merwade, 2020; Ngugi et al., 2020). For a sand dam to perform optimally, well-sorted sand must be the primary reservoir material. When silt and/or clay settle into the reservoir in large volumes, the ability of the sand dam to capture and store water is significantly reduced (de Trincheria et al., 2015; Eisma and Merwade, 2020).
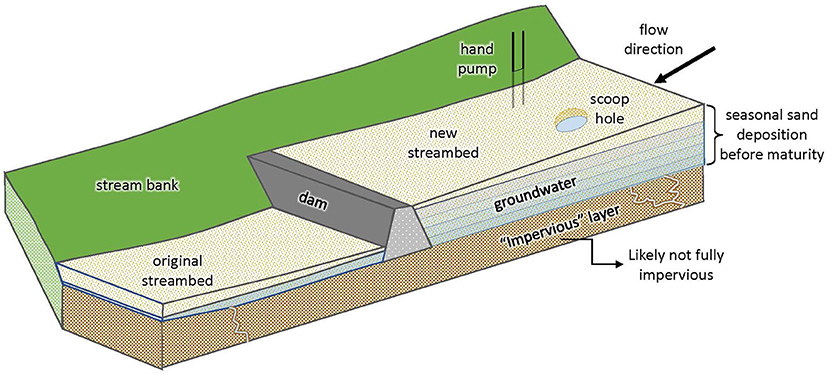
Figure 2. Sand dam schematic showing seasonal sand deposition before maturity and two common abstraction methods (adapted from Eisma and Merwade, 2020).
Spurred by non-governmental organization support, sand dams have spread rapidly over the past 25+ years and can be found in drylands around the world (see Figure 3). However, the overwhelming majority of sand dams have been built in Southeastern Kenya, perhaps due to unique and favorable physiographic features, and thus the majority of sand dam research has also been conducted in Kenya. Researchers have noted sand dams since at least 1968 (Stengel, 1968), but they were the subject of a flurry of studies starting with Borst and de Haas in 2006. The sand dam literature was then relatively quiet for nearly a decade before studies by de Trincheria et al. (2018) and Quinn et al. (2018a,b) raised new questions and renewed interest. Sand dams are gaining in popularity, but the current literature expresses many opposing viewpoints at least partially influenced by vested interests (Cruickshank and Grover, 2012; Lasage and Verburg, 2015) that need to be analyzed and clarified. Part of this disparity likely arises because research in rural areas of low and middle-income countries is difficult and must contend with many limitations including access, information, and resources. However, research guides foreign and domestic decision-making about developmental priorities and directions, and thus research quality is imperative, especially with a changing climate.
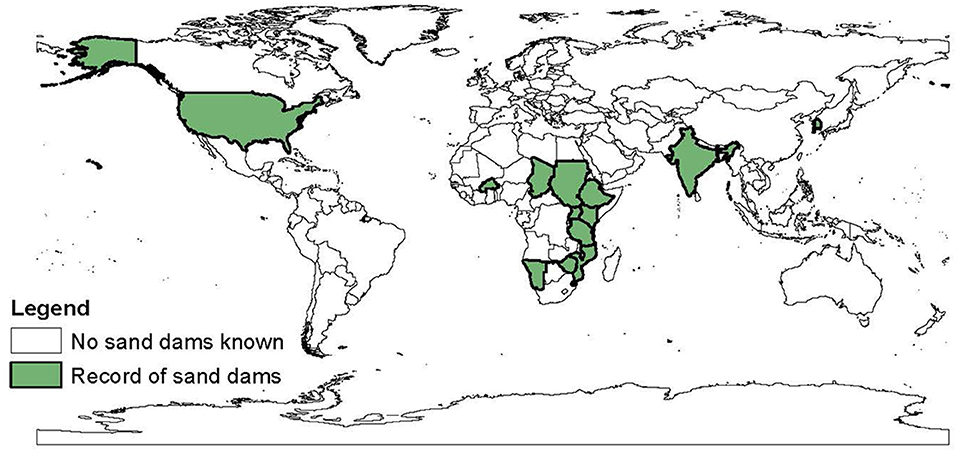
Figure 3. Sand dams have spread to drylands around the world. Countries with known sand dams are shaded.
Whilst a number of studies have been published on sand dams, many of these are not peer-reviewed. To date, only a cursory review of sand dam knowledge has been published as part of a larger examination of managed aquifer recharge (Standen et al., 2020). As no specific review of sand dams exists, studies are fragmented, findings are difficult to compare, and results are hard to interpret. A comprehensive analysis of sand dam literature supports better informed future research and implementation practices. More rigorous scientific work on sand dams and other water harvesting technologies must be encouraged to ensure water project managers are better informed when choosing the most appropriate technology for their target community. This article aims to review and critique the evidence for the benefits of sand dams as a climate change adaptation. It reviews the hydrological capabilities and limitations of sand dams, followed by the impacts of sand dams on the health and well-being of communities, their economic implications, and finally their water quality implications. This study used the search terms “sand dam” and “sand storage dam” in Scopus and Google Scholar to find peer-reviewed and gray literature. Additional references were found from (a) the reference list of key papers, (b) personal contacts, and (c) from general searches in Scopus and Google Scholar to support the main findings. Literature not related to any of the aforementioned themes, referring to other types of sand dams, such as “tailing sand dams,” and whose primary topic was not sand dams were then excluded. This resulted in 54 pieces of peer-reviewed and gray literature that were reviewed for this article. The literature was categorized into the topics of the article, which doubles as the article structure.
2. Sand Dam Hydrology
Many studies have employed modeling techniques to answer questions related to the functioning of sand dams and their role in local and regional hydrology, climate change, and water management. This section explores the broad categories of water balances and more general hydrological models of sand dams.
2.1. Water Balance
To examine the hydrology of sand dams, a few water balance studies have been conducted. While the water balance equation varies somewhat among the studies, the general form for a sand dam water balance is as follows (Chow, 2010):
where Fin is the flow of water into the reach, Fout is the flow of water over the sand dam spillway, ET is the water lost due to evapotranspiration, QA is the water lost due to abstraction by community members, and S is the water lost due to seepage through the confining layer, into the streambanks, and around the sand dam.
Calculating the water balance for a sand dam requires collection of various inflow and outflow measurements during an extended field study. As a result, only three studies have collected the necessary data (see Table 1) (Borst and de Haas, 2006; Quinn et al., 2019; Eisma and Merwade, 2020). Of the three water balances, only Quinn et al. (2019) and Eisma and Merwade (2020) provide an analysis of intra-seasonal sand dam water storage fluxes. The assessment presented in Borst and de Haas (2006) is of lumped seasonal fluxes. Despite these differences, the factors considered in the hydrological accounting are similar: baseflow, leakage and/or seepage from the sand dam, evaporation or evapotranspiration, and abstraction (Table 1). Many of these factors have a high degree of uncertainty related to the difficulties associated with determining them in situ.
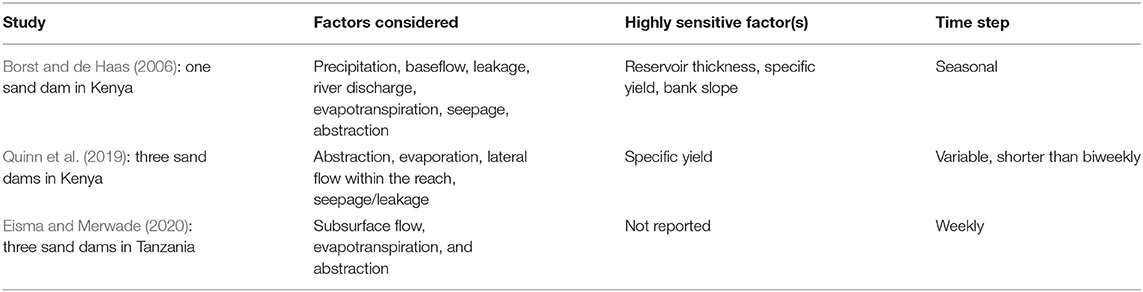
Table 1. Published sand dam water balances.
As shown in Table 1, Borst and de Haas (2006) and Quinn et al. (2019) identified the most sensitive factors in their respective water balances, that is those that have the greatest effect on the simulated factor of interest (e.g., abstractable water). The common factor among the sensitive factors is specific yield: the volume of water released from the sand dam by a unit decrease in water table height (Borst and de Haas, 2006). Specific yield is a critical factor in determining a sand dam's water storage effectiveness. It essentially defines the maximum amount of water available for abstraction from a unit volume of sand dam material (Quinn et al., 2019). Yet, specific yield is highly uncertain for sand dams due to the variable composition of reservoir material. Most literature on this topic, and the value used by Borst and de Haas (2006), cites the specific yield of sand dams as 0.25–0.30 (Hut et al., 2008; Quilis et al., 2009; de Trincheria et al., 2018). However, an analysis conducted by Quinn et al. (2018b) indicates that a sand dam specific yield in the range of 0.10–0.16 is more realistic. The discrepancy in expected specific yield and that determined by Quinn et al. (2018b) is caused by the assumption in most studies that sand dam reservoir material is well-sorted sand. Quinn et al. (2019), however, finds that the reservoir material is likely to be poorly sorted, resulting in a significantly reduced specific yield. A sand dam with a lower than expected specific yield will be incapable of providing water to the local community at the expected rate. This impacts not only the sand dam's boon to local water availability, but also their cost-benefit ratio. Future research is therefore needed to identify the range and distribution of sand dam reservoir specific yield.
While evapotranspiration was not identified as a sensitive factor by either Borst and de Haas (2006) or Quinn et al. (2018b), Eisma and Merwade (2020) found that a functioning sand dam loses up to 88% of its stored water via evapotranspiration. Evapotranspiration is responsible for the majority of water lost from sand dams despite their reputation for protecting stored water from evapotranspiration (Borst and de Haas, 2006; Hut et al., 2008; Lasage et al., 2008; Neal, 2012; Ryan and Elsner, 2016; Quinn et al., 2018b). Similar to lower-than-expected specific yield, high rates of evapotranspiration losses negatively impact the utility of sand dams. Sand dams do reduce expected evapotranspiration losses by up to 19% (Eisma and Merwade, 2020). However, this number is provided relative to evapotranspiration simulated by the Famine Early Warning Systems Network Land Data Assimilation System (FLDAS), rather than calculated with data taken at their study sites. Future studies need to better quantify evapotranspiration losses from sand dams and should also investigate cost-effective methods for further protecting stored water from evaporation.
Infiltration rate has not been studied in the context of sand dams, yet infiltration rate is likely a significant factor in the water balance of sand dams. Due the added challenge of measuring rainfall, surface runoff, and infiltration, water balances at sand dams have largely been initiated after the rainy season has ended, avoiding the need to quantify such parameters in the field (Quinn et al., 2019; Eisma and Merwade, 2020). Despite this, infiltration rates across sand dams likely vary significantly, because infiltration is limited by the hydraulic conductivity of the soil (Chow, 2010). Quinn et al. (2018b) note that hydraulic conductivity at three sand dams likely varies greatly due to highly varied soil profiles. Thus, infiltration rates across sand dams are likely highly variable and dependent upon the composition of the soil upstream of the sand dam. Further research is needed to define the magnitude and range of infiltration rate across sand dams.
Sand dams are built in ephemeral streams, many of which only flow for a few days directly following a rain event. Thus, flow into sand dams is largely limited to a few substantial rain events throughout the rainy season. However, some sand dams do receive lateral seepage from the streambanks during the dry season (Quinn et al., 2019). With the exception of lateral seepage inflows, sand dams primarily lose water during the dry season. The quantity of water supplied to a sand dam also varies spatially, as sand dams constructed in higher order streams will likely receive greater volumes of runoff from upstream catchments. Stream order is weakly correlated to sand dam effectiveness (Ngugi et al., 2020). While spatial and temporal variability of water storage in sand dams is acknowledged in the literature, very little work has examined these variations and developed causation among catchment characteristics and sand dam performance. The work that has been done is largely inconclusive (Beswetherick et al., 2018; Ngugi et al., 2020), highlighting the importance for more research in this area.
2.2. Catchment-Scale Sand Dam Hydrology
While many studies have examined the hydrology of individual sand dams, only a few have assessed the impact of a network of sand dams within a catchment (Van Loon and Droogers, 2006; Aerts et al., 2007; Lasage et al., 2015). The potential of sand dams in drylands was studied using a simplistic modeling strategy that clustered 273 sand dams into 12 representative reservoirs (Van Loon and Droogers, 2006). The sand dams did not store enough water to supply communities throughout the dry season, and the last month of the dry season exhibited the greatest unmet need (Van Loon and Droogers, 2006). Sand dams helped meet 6% of the annual water demand and larger dams were more effective in meeting demand than a greater number of dams (Van Loon and Droogers, 2006). Sand dams decreased downstream flow by 1%. Aerts et al. (2007) and Lasage et al. (2015) studied the ability of sand dams to supply communities with water under future climate scenarios in Kenya and Ethiopia. The results of the two studies vary somewhat based on the climate scenario being tested, but the underlying story is essentially the same. Sand dams will continue to improve water availability for their local communities but will have an increasingly negative impact on downstream flows. With climate change, sand dams will store a higher percentage of discharge (Aerts et al., 2007; Lasage et al., 2015). Aerts et al. (2007) concluded that sand dams currently store between 1.8 and 3.8% of total seasonal runoff, slightly more than the 1% figure concluded by Van Loon and Droogers (2006). The percentage of seasonal runoff stored by sand dams could increase by between 11 and 60%, depending on water use trends, sand dam construction rates, and the severity of climate change (Aerts et al., 2007). Most of this impact is unavoidable however, because climate change has a greater impact on flow conditions than does the presence of a sand dam (Lasage et al., 2015).
While the existing catchment-scale sand dam literature provides an interesting first attempt at quantifying the broader impacts of sand dams, the results must be re-considered given the findings of recent publications. Further research should re-examine sand dam water storage potential considering new estimates for evaporation, seepage, and non-functioning sand dams provided by recently published sand dam studies (de Trincheria et al., 2018; Quinn et al., 2018b, 2019; Eisma and Merwade, 2020). Research that considers recent findings would better inform water managers on sand dam potential in their communities. Published studies at the catchment scale assume each sand dam stores a given volume of water, and only Van Loon and Droogers (2006) has considered, although conservatively, the impact of non-functioning sand dams. However, recent studies have highlighted the disparity in storage potential (de Trincheria et al., 2018; Quinn et al., 2019; Eisma and Merwade, 2020), the unexpectedly low specific yield of sand dams (Quinn et al., 2019), and issues related to non-functioning sand dams (Viducich, 2015; de Trincheria et al., 2018; Eisma and Merwade, 2020). Furthermore, Lasage et al. (2015) assume only 5% of stored water is lost to evaporation and to seepage, but recent publications cite evapotranspiration and seepage losses up to 88 and 24%, respectively (de Trincheria et al., 2015; Eisma and Merwade, 2020). It is not clear why Van Loon and Droogers (2006) assume that subsurface evapotranspiration is 50% of surface evapotranspiration, despite subsurface evapotranspiration being highly sensitive to water table depth (Hellwig, 1973). As a last note, both Aerts et al. (2007) and Lasage et al. (2015) employed essentially the same model and the same set of assumptions. Thus, their findings have not yet been verified by other publications. Future research must examine the impacts of sand dams at the catchment scale and under climate change given the recent findings on sand dam storage capacity and water loss mechanisms while employing a wider variety of models, each with their own unique set of assumptions.
2.3. Subsurface and Surface Flow Models
Multiple subsurface and surface flow models have been built to explore how sand dams interact with the local environment. Despite the many flow models developed, most are finite element or finite difference models that have been used to investigate the hydrology of Dam Kwa Ndunda in Kitui County, Kenya (Hoogmoed, 2007; Hut et al., 2008; Quilis et al., 2009). Additional models have been used to study the relationship between surface runoff and sand dam effectiveness (Jansen, 2007) and to study the impact of spillway height and catchment characteristics on sand dam sedimentation (Viducich, 2015). Whilst many models have expanded our understanding of sand dams, their limitations provide opportunities for future researchers, as explored in the following sections.
2.3.1. Subsurface Flow Models
Subsurface flow models have been developed of two independent dams, Kwa Ndunda and Voi in Kenya (Hoogmoed, 2007; Hut et al., 2008) and of a theoretical three-dam cascading system (Quilis et al., 2009), as shown in Table 2. As solely subsurface flow models, these models do not necessarily include rainfall as an input, rather they make assumptions about the impact of rainfall on a key input variable. For example, by assuming groundwater recharge is always a certain percentage of precipitation depth (Hoogmoed, 2007), or by assigning season-based values to sand dam reservoir storage (Hut et al., 2008). Further, none of the subsurface flow models consider the impact of subsurface evaporation on sand dam storage and groundwater levels, which artificially increases the impact of sand dams on groundwater levels. Sand dams lose a significant portion of their stored water to evapo(transpi)ration (de Trincheria et al., 2015; Quinn et al., 2019; Eisma and Merwade, 2020), and this loss must be adequately considered in model development.
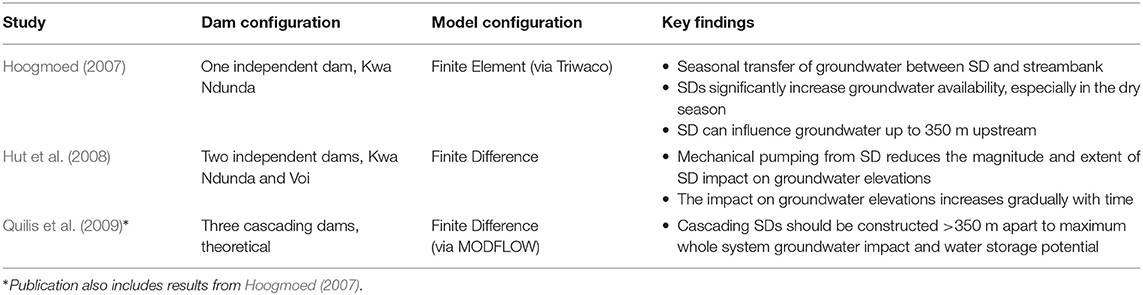
Table 2. Sand dam subsurface flow models.
The results of finite difference models can be heavily influenced by the boundary conditions assigned during model creation. When developing a finite difference subsurface flow model for drylands, modelers must take special care not to artificially increase the inflow of water into the study area. For example, Hut et al. (2008) assigned a constant 1 m of groundwater at one boundary of their study area. Thus, they essentially included a constant inflow of water, because the groundwater naturally flowed from the input boundary toward the sand dam. It is, then, no surprise that their simulations exhibited an increase in groundwater elevations around the sand dam. Hut et al. (2008) likely artificially inflated the impact of sand dams on local groundwater elevation due to their assumption of a constant inflow of water at the study area boundary. In water-scarce regions, ill-suited assumptions during model development can have a significant impact on the findings.
While the previous subsurface flow modeling studies produced insight into the influence of sand dams on groundwater dynamics, many questions remain. Further research is needed to understand the spatial and temporal extent of groundwater impact that results from the added storage in a sand dam. Special attention must be paid to the formulation of water inflow and outflow, being sure not to create unrealistic conditions for dryland hydrology, which has not always been true for the modeling studies reviewed here. For example, the impact of groundwater on surface conditions must be realistic, given that the water table is often many meters below ground level in dryland regions (MacDonald et al., 2012). Further, a subsurface flow model should be developed to study seepage from the sand dam, both through the streambanks and through the impervious layer, noting that the impervious layer is rarely, if ever, fully impervious (Maddrell and Neal, 2012; Eisma and Merwade, 2021). Such a study would inform on the benefits of careful site selection. Subsurface flow models remain an important tool for investigating the potential of sand dams in drylands, and researchers should continue to refine their use in the study of water harvesting.
2.3.2. Surface Flow Models
Surface flow models are not commonly employed to study sand dams, because sand dams store water underground and are often filled by a single flash flood (Hut et al., 2008). However, surface flow models can provide insight into the optimal design of the dam structure (Jansen, 2007; Viducich, 2015) and their sedimentation process (Viducich, 2015). Similar to findings in Van Loon and Droogers (2006), the MATLAB-based model in Jansen (2007) indicated that larger dams, rather than more dams, should be built to increase availability of water. This is primarily because additional dams are likely to be built in sub-optimal locations, and thus do not capture and store as much water as the existing sand dams constructed in optimal locations. While larger dams built in optimal locations maximize water storage within a catchment, larger dams increase the risk of flooding, erosion, and seepage (Jansen, 2007). Conversely, a greater number of smaller dams minimizes these risks while providing more equitable water access throughout a catchment. The USACE Hydrologic Engineering Center's River Analysis System model developed in Viducich (2015) shows, however, that sedimentation of a sand dam is highly dependent upon spillway height. High spillways are likely to trap fine particles in the sand dam reservoirs, resulting in slower infiltration of water, greater difficulty in abstracting water, and less overall water storage (Viducich, 2015). To combat this issue, Viducich (2015) recommends building the sand dam spillway in stages (Nissen-Petersen, 2011; de Trincheria et al., 2015), noting that as the spillway height increases, the height of each subsequent stage can also increase. Building the sand dam spillway in stages is not unanimously supported (Hut et al., 2008; Ertsen and Hut, 2009), but Viducich (2015) remains the only study to examine this question from a modeling perspective.
The sedimentation process in sand dams remains a point of confusion and contention in the sand dam community (Nissen-Petersen, 2006; de Trincheria et al., 2018; Eisma and Merwade, 2020; Ngugi et al., 2020). Further surface flow models should be developed to study the sedimentation process of sand dams, and the simulated processes should be studied in parallel with a field study and data monitoring. Some uncertainty surrounding sand dam sedimentation may be due to the inability of the surface models to properly simulate dryland hydraulics and hydrology, hence the need for a field study to verify simulation results. Sedimentation is perhaps the primary reason for sand dam failure and is thus vital to the sustainability of sand dams in dryland water security.
3. Health and Well-Being of Local Communities
A number of studies have explored the health and well-being implications of sand dams largely through interviews, surveys, and observations. This section outlines the overwhelmingly positive primary and secondary impacts that sand dams are recorded as having on communities, as well as the few studies which raise concerns.
3.1. Primary Impacts
Sand dams have been shown to have substantial impacts on the health and well-being of local communities. The primary benefits, as outlined by Pauw et al. (2008) are increased water availability, which allows higher levels of domestic, agricultural and other income generating consumption, and reduced traveling time for water collection. Pauw et al. (2008) compared households with and without access to sand dams in Kitui, alongside dam density, rainfall and agricultural factors to evaluate whether differences observed are actually caused by the sand dams.
Sand dams are said to increase both accessibility and use of water (Nissen-Petersen, 2006; Pauw et al., 2008). According to Maddrell and Bown (2017), each sand dam can directly provide year-round clean water for up to 1,200 people, whilst indirectly benefiting up to 100,000. This claim however, is unsupported by research and should be interpreted with caution. With the storage of water within the accumulated sand, communities with a dam were found by Pauw et al. (2008) to have access to water for an average of 2.5 months longer compared to those relying on water stored solely in the riverbed. Compared to 5 years previous, households with a dam claimed that their source holds water for a longer period of time, and have increased their overall water usage by 321%, compared to a 3.1% decrease for households without. These results are concurrent with the belief that consumption increases with accessibility (Van Haveren, 2004). Nissen-Petersen (2006) similarly promotes the increase in available water, finding that extractable water volume increased within the Mwiwe riverbed post-dam construction. Furthermore, with the construction of a sand dam, time spent collecting water is reduced. Average distance traveled by households interviewed by Pauw et al. (2008) decreased significantly from 2,828 to 812 m, saving, on average, 99.8 min/day, compared to an average distance of 3,501 m for households without, thus increasing disparity (Pauw et al., 2008). Maddrell (2010) and de Bruijn and Rhebergen (2006) found similar time benefits. They report that people spend 30–90 min/day on average collecting water (Maddrell, 2010), and that distance and time decreased from 3 to 1 km and 140 min to 90 min/day, respectively (de Bruijn and Rhebergen, 2006) with the construction of a sand dam. Whilst all of these results are positive, small sample sizes mean the results are not easily scalable.
As outlined in the hydrology section of this paper, there is contention over the water availability provided by sand dams. de Trincheria et al. (2015) undertook physical studies on 30 sand dams in Kenya and found at least 67% of them lack the capacity to supply continuous water to even one household during the entire dry season. In a modeling study, Van Loon and Droogers (2006) similarly showed that during the long dry season domestic needs are not met as a result of water shortages in some parts of Kitui County. However, the results of modeling studies are potentially influenced by the hypotheses and assumptions made about the study area and processes during model development. Thus, care should be taken when drawing conclusions from modeling results, because the initial hypotheses and assumptions may not be supported by the current literature (see section 2). Furthermore, the results are significant only for the specific study locations and may or may not be representative of the performance of dams elsewhere. Ngugi et al. (2020) recorded from questionnaires, corroborated by field observations and measurements, that 57% of the dams studied did not have water at the end of the short dry period, with a further 7% having no water at the end of the long dry season. These figures are based on a calculated capacity requirement of n households with 5.98 people/household using 20 L/day. These results are useful for highlighting the capacity of sand dams to improve water security, and could be improved by analysing abstraction data to triangulate results.
These contested benefits may be further compounded by the success rate of sand dams. Very few studies have specifically sought to understand how many dams never fill with sand or break down once constructed, with the values attained by those having done so varying to a large extent. Whilst one study found a 9–11% failure rate (Pauw et al., 2008), Nissen-Petersen (2010) found non-functionality at 90%. Furthermore, de Trincheria and Nissen-Petersen (2015) found 65% of studied sand dams (n = 48) to not be effectively accumulating sand sediment and 29% to be showing severe structural damages. Whilst none of these studies indicate the age of the dams, the reasons of failure were attributed to poor protection of banks, accumulation of silt rather than coarse sand due to rushed construction, rivers bypassing the dam wall and foundation damage, resulting in leakage, filling with very little water or washing away. The general uncertainty surrounding true sand dam success rates significantly limits our understanding of the benefits that sand dams provide. Whilst sand dams may increase water availability and reduce traveling time in certain months and in certain dams, research utilizing larger sample sizes across different seasons is needed to understand any temporal and spatial variation in benefits and whether sand dams are able to provide a year-round water supply.
3.2. Secondary Health Impacts
The two aforementioned primary impacts have been shown to have a plethora of secondary impacts on communities. Closely linked to increased water availability is the improvement in standards of hygiene and nutrition that dams provide as people report to spend more time washing and cooking (Aroka, 2010). Similarly, Lasage et al. (2008) reported that as a result of time saved fetching water, 29% of households spend more time on domestic tasks including both increasing hygiene as well as cooking meals, both of which will positively impact the health and well-being of a household. This study compared socio-economic developments in the Kiindu catchment, which has three sand dams, to the Koma catchment, which has none. They interviewed 20 households in the former and 19 in the latter on socio-economic changes over the past 10 years from prior to post-sand dam construction, relying on a long recall period. Owing to this improvement in hygiene, alongside the storage of water below the surface and the filtering effect of the sand, the risk of water-borne and mosquito-borne diseases are reduced (Stern and Stern, 2011). This widely cited benefit is supported by Maddrell (2010) who reports that in one Kenyan village, the clinic recorded a 90% reduction in diarrhea post-sand dam construction. There is a risk of sampling bias in these two latter studies, potentially purposefully selecting successful dams, as a result of affiliations with sand dam organizations. Further research would therefore benefit for testing this hypothesis in a more scientifically rigorous way. There is a further risk of confounding factors obscuring the causal effect of sand dams from mere correlations.
Pauw et al. (2008), conversely, found the effect on disease incidence to be both positive and negative. The average number of diseases per household were the same for households with and without a dam (1.80 and 1.79, respectively), with 67% claiming that suffering from disease had stayed constant or lessened with a dam, compared to 76% claiming suffering had increased or stayed constant without a dam. It is unclear from the interviews whether people suffer less because they contract the disease less often or because they are more able to treat it. Less suffering therefore cannot conclusively be attributed to the construction of the dam. Results on disease incidence are evidently inconclusive and inconsistent, highlighting the need for further work to understand the true nature of disease prevalence.
The impact on nutrition may also be felt by the diversification and volume of crops and livestock that can be grown and reared due to increased irrigation, resulting in a more varied and improved diet (Stern and Stern, 2011). Such a phenomenon is cited by Maddrell (2010), who claims that as a result of sand dams, “trees can grow naturally, birds and insects return and farmers can set up tree and vegetable nurseries to diversify diets.” As a result of Kitui sand dams, it has been found that farmers grow an average of 1.39 more, predominantly irrigated crops, than they did before dam construction (Pauw et al., 2008). They also found a significant increase in tree planting amongst households with a dam, who planted an average of 12.87 new trees, compared to 5.0 planted by those without a dam in the past 5 years (z = 3.30; p = 0.00098), due to high irrigation needs.
3.3. Secondary Well-Being Impacts
Crop diversification is also met with reduced crop failure, further increasing yields and calorific intake (Lasage et al., 2008). This results in reduced vulnerability to future floods and droughts if produce can be stored and traded. This consequently improves well-being as people are less stressed, feeling more secure in their situation. This has the potential to reduce domestic violence and conflict within the home (Maddrell, 2010). Maddrell (2010) also hypothesizes that conflict may be reduced in the wider community as competition for water between different groups is lessened. This may further be strengthened by the socializing that water collectors can undertake whilst at the sand dam (Chan, 2019). This means of communication that water sources provide may be an important mechanism for improving mental health and well-being.
A sand dam's contribution to community strengthening, however, is an area of contention. Prior to construction, a dam committee is usually set up, enabling NGO and community cooperation in the sand dam building process (Lasage et al., 2008). According to Stern and Stern (2011), there are multiple benefits of this, including local ownership, strengthening of knowledge and skills from accompanying training, and motivation and help exchanged between members in present and future projects (Stern and Stern, 2011). Having said this, Ertsen et al. (2005) believes such involvement does not lead to stronger structures within the community as sand dam committees seem to stop functioning after construction. This may in part be exacerbated by the fact that dams need minimum maintenance, on top of the fact that the technology is largely predefined by the NGO, limiting decision making powers of the community (van Wijk-Sijbesma, 2001). Even if strong community ties are not made as a result of sand dam construction however, the training which a lot of NGOs provide in areas including food budgeting, soil conservation and sanitation can be an added benefit (Ertsen et al., 2005). Despite this training, Borst and de Haas (2006) argues that more education and behavior change initiatives are needed before the full benefits of sand dams can be felt. The uncertainty around the impacts on community structures provides room for further research into the impacts of different water supply interventions with varying degrees of community involvement.
School education is another secondary benefit. Children and women, the primary water collectors, spend less time fetching water. This permits mothers to assume more household tasks, freeing children from these responsibilities and allowing them to attend school more regularly, a mechanism critical for boosting development (Maddrell, 2010). Pauw et al. (2008) received similar responses from interviews: both that children have more time to go to school and that more money is available to send children to school since dam construction. However, the difference in school attendance between the two groups was not found to be significant. More research into the long term impact that sand dams are having on the level of education would be useful.
Finally, the standard of living can be improved by house construction and increased ownership of assets, which sand dams have been shown to facilitate (Lasage et al., 2008). For example, Lasage et al. (2008) found that due to increased water availability, households with dams produce more bricks, which can be used to construct houses in the community. Due to rising economic status, the number of radios has increased by 107% since dam construction, compared to 26% in the Koma catchment (de Bruijn and Rhebergen, 2006). This is just one of the economic benefits attributed to sand dams. Of course, confounding factors may also be responsible for some of these observed changes. However, regardless, with increased economic opportunity in agriculture, brick and basket making and other professions due to increased mobility and availability of time and water, people's income and therefore well-being and standard of living have the opportunity to rise.
3.4. Heterogeneity in Health and Well-Being Impacts
As the literature illustrates, the majority of health and well-being impacts that sand dams have are positive. There is, however, a suggestion that these benefits are not homogeneous and may differ between household, source type, and catchment (Pauw et al., 2008). Impacts may depend on whether a household is a member of the sand dam committee and therefore allowed to access the water, a household's income, or the proximity with which they live to the sand dam (Ertsen and Hut, 2009; Chan, 2019). For example, Chan (2019) found that at one dam, only members who were part of the construction of the well were allowed to fetch water from the handpump. Local circumstances exacerbate differences between catchments with some sand dams providing enough water to satisfy only domestic needs, whilst other allow for diversification of livelihoods (Strohschein, 2016). The level of impact a sand dam can have on health and well-being may further be affected by volume restrictions set by communities, breakages of hand pumps, time of year, and perceived quality (Chan, 2019). As Aerts et al. (2007) points out, these differences will likely only be exacerbated with climate change.
Owing to limited published research with statistically significant evidence to support the benefits of sand dams, it would be advantageous for future research to analyse in more depth the positive and negative health and well-being impacts of sand dams and how these vary spatially and temporally between different demographic groups. Whilst having identified several benefits attributed to sand dam construction, several studies do not account for other potential changes in the area. It would therefore be beneficial to explore the impact of these confounding factors when studying the influence of sand dams on communities. Finally, conducting studies which rely less on recall and instead utilize real-time accounts of prior to post-sand dam construction would be beneficial.
4. Economic Assessment
Sand dams are touted as a low-cost solution to water availability in rural communities and are cited for secondary benefits that increase financial stability in their communities. Surveys and interviews with community members have provided an understanding of the economic impact of sand dams, as discussed in this section.
4.1. Cost-Efficiency of Sand Dams
The cost-efficiency of sand dams in providing water to the community is based on their cost of construction, annual maintenance, expected longevity, and water yield (de Trincheria et al., 2018). The last of these, water yield, is highly variable and thus introduces great uncertainty into the numbers presented here. Some sand dams fail to supply one household with water throughout the dry season (de Trincheria et al., 2018), while others support entire communities (Borst and de Haas, 2006; Lasage and Verburg, 2015). Construction of a sand dam is generally reported to cost 6,000 to 10,000 EUR (Tuinhof and Heederik, 2002; Munyao et al., 2004; Lasage et al., 2008; Ertsen and Hut, 2009; de Trincheria et al., 2018). Some of this range can be accounted for by the differences in dam height and width. However, dam construction costs in the lower range likely ignore the community's contribution of local materials, labor, food, and housing for skilled tradesmen (Munyao et al., 2004; de Trincheria et al., 2018). Communities and NGOs typically employ a cost-sharing model when planning the construction of a sand dam, wherein the community supplies 44–50% of the construction costs and the NGO covers the remaining costs (Munyao et al., 2004; Cruickshank and Grover, 2012; Lasage et al., 2015). Sand dams are generally accepted to have no annual maintenance costs (Lasage et al., 2008; de Trincheria et al., 2018), and estimates of their lifespan range from 20 to 50 years (Lasage et al., 2015; de Trincheria et al., 2018). Despite the lack of maintenance for the sand dams themselves, the handpumps often constructed adjacent to sand dams require upkeep. Further, the soil beneath the apron of the sand dam frequently erodes, compromising the structural integrity of the sand dam (see Figure 4). Handpumps and sand dam aprons thus need to be considered as maintenance costs in sand dam cost-efficiency calculations. Further, while lifespan estimates for sand dams typically range from 20 to 50 years, additional research is needed to investigate the main factors affecting sand dam lifespan and to provide a more comprehensive analysis of sand dam failure. Assessing the cost-efficiency of sand dams presents many challenges due to high variability in sand dam design, construction, and use.
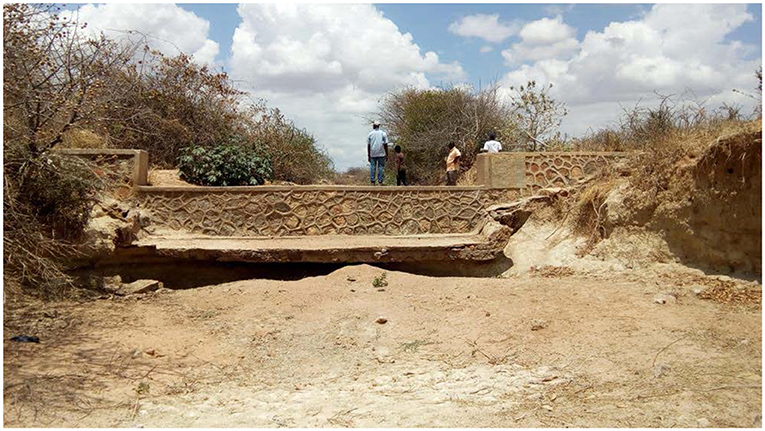
Figure 4. Mshikamano sand dam near Dodoma, Tanzania exhibiting significant erosion of the apron and left streambank. Photograph taken while looking upstream during the dry season. Photo credit: J. A. Eisma.
Attempts to assess the cost-efficiency of sand dams essentially fall into two categories: those where water yield is determined in the field and those where it is assumed based on sand dam reservoir dimensions. Studies in the two categories produce highly disparate cost-efficiency metrics. In most studies where water yield is assumed, the one-time cost of obtaining 1 m3 of water from a sand dam ranges from 0.10 to 0.68 EUR (Mati, 2005; Gies et al., 2014; Lasage and Verburg, 2015). This represents a significant improvement in the cost to obtain water, considering a local price for purchasing 1 m3 of water is ~1.10 EUR (Stern and Stern, 2011). Based on such low water supply costs, sand dams are often concluded to be the most cost-efficient water harvesting technology when compared to rain jars, above ground and underground tanks, open reservoirs, etc. (Mati, 2005; Lasage and Verburg, 2015). However, recent studies have found that sand dams do not store as much water as commonly reported (de Trincheria et al., 2015, 2018; Quinn et al., 2019; Eisma and Merwade, 2020). An in-depth field study of 30 of the 48 sand dams in four different catchments within the Kikumbulyu administrative area in Makueni County, Kenya found that most had an extremely low cost-efficiency (de Trincheria et al., 2015, 2018). Because de Trincheria et al. (2015) found that 67% of sand dams they studied failed to supply water throughout the dry season, they calculated the average cost-efficiency of sand dams to be 5,635 EUR per 1 m3 of water yield. Annualizing construction, maintenance, operation costs, and interest over the expected life time of a sand dam, de Trincheria et al. (2018) found the annual water supply to cost more than 30 EUR/household/year. The contrast in reported cost-efficiencies for sand dam water supply indicates that the true average cost efficiency likely lies somewhere between the two extremes of 0.10–5,635 EUR per 1 m3 of water.
The effectiveness of sand dams lies at the heart of the debate concerning their cost efficiency. Water yield exhibits the greatest variability, and therefore introduces the greatest uncertainty into the cost efficiency of sand dams. Most variability in sand dam water yield is likely related to the reservoir storage capacity, reservoir soil texture (sand vs. silt, etc.), and seepage from the sand dam to the streambanks and/or through the streambed rather than catchment-scale parameters like catchment area, mean areal rainfall, or runoff coefficient. Further, as Hut et al. (2008) notes, most sand dams fill with water after a single rain event, so water yield is not necessarily limited by catchment-scale factors. Further research must be conducted to determine the distribution of sand dam water yield. Most studies cite only the average water yield, which is an accurate indicator of water yield only if the data is normally distributed. However, water yield is likely not normally distributed across sand dams (de Trincheria et al., 2018). The average annual water yield of 30 dams was 112.3 m3/year, but the median was only 15.8 m3/year (de Trincheria et al., 2018). Determining the distribution of sand dam water yield is challenging, due to the difficulties in randomly sampling sand dams in a region. Sand dams are often built in small, rural communities that are poorly connected to transportation links, and their locations are not publicly available information. While important to assessing the economic impact of sand dams, simply determining the water yield of sand dams is a massive undertaking. Additional benefits of stored and leaked sand dam water are not often included in the cost-benefit analysis, despite the water providing many valuable ecosystem services. For example, stored and/or leaked water recharges the groundwater, increases water available to plants, and provides a water supply for wildlife.
4.2. Economic Opportunities in Sand Dam Communities
In communities with a highly functioning sand dam, community members often receive a financial boon as a secondary benefit to increased water security. Constructed in primarily agrarian communities, the additional water stored in sand dams allows for crop diversification, increased irrigation, and livestock raising (Tuinhof and Heederik, 2002; Manzi, 2005; Lasage et al., 2008; Pauw et al., 2008; Cruickshank and Grover, 2012). Increased agricultural activity in sand dam communities leads to a 100% increase in agricultural water consumption (Lasage et al., 2008). Farmers use sand dam water to irrigate ~30% more crops than those without a sand dam (Lasage et al., 2008; Pauw et al., 2008), increasing crop production by 20% (Manzi, 2005). Irrigated crops in sand dam communities can be sold to raise a household's income by up to 40 EUR per irrigated acre (Pauw et al., 2008). Irrigation also supports crop diversification, which provides households with financial stability by protecting against total crop failure (Manzi, 2005; Lasage et al., 2008).
The availability of water and the time saved collecting water are also used to develop non-agricultural money-making ventures, which diversify income and protect against extreme hardship in dry years (Lasage et al., 2008). The most popular of these activities are brick making, basket weaving, laundry services, and beekeeping (Pauw et al., 2008; Ertsen and Hut, 2009; Cruickshank and Grover, 2012; Quinn et al., 2018a). Many also use the time saved collecting water to make ropes and to earn money as casual laborers (Pauw et al., 2008). Communities that pursue brick making not only sell the bricks but also use them to build better homes and more permanent buildings, further improving their standard of living (Lasage et al., 2008; Cruickshank and Grover, 2012).
Overall, the estimated financial benefit to sand dam communities is given in a range from 100 to 215 EUR per year, which represents up to 20% of Kenya's annual per capita gross national income (Lasage et al., 2008; Pauw et al., 2008). To demonstrate the impact of such a growth in income, bicycle ownership in a sand dam community increased by 240% relative to a 10% increase in a nearby non-sand dam community (Pauw et al., 2008). Unfortunately, the financial benefits of sand dams are not equally shared within the community. Users living closest to the sand dams are the most likely to benefit from the additional water and time saved collecting water (Ertsen and Hut, 2009; Cruickshank and Grover, 2012). This discrepancy in benefit is exacerbated further when individuals in the community own a cart or a donkey and can lead to a widening of income inequality (Cruickshank and Grover, 2012). In addition, pastoralists are likely to receive a greater benefit from sand dams than farmers (11.9–13 vs. 0.1–3.1% increase in income), because the additional water reduces the livestock mortality rate while simultaneously supporting herd growth (Gies et al., 2014). Pastoralists make the smallest financial contribution to sand dam construction efforts. In pastoralist communities, NGOs often hire casual laborers to construct the dam to guarantee that the work is completed before pastoralists move on with their herds (Ertsen and Hut, 2009). While functioning sand dams improve the economy of local communities, their benefits are not shared equally among those in the community.
While many studies have developed a foundation for understanding the breadth and magnitude of economic benefits stemming from sand dams, opportunities for further studies remain. For example, study of the economic benefits stemming from sand dams must account for additional training offered by NGOs to some communities. Sand dams in closer proximity to NGO offices are more likely to be visited and receive additional services after their dam is complete (Cruickshank and Grover, 2012). For example, Dam Kwa Ndunda in Kitui County serves as an exemplary sand dam for its sponsoring NGO. The sand dam community is often visited by potential funders and researchers and has been bolstered by additional trainings, such as beekeeping and sunflower production. Conversely, many sand dam communities never receive their promised sand dam maintenance training (Cruickshank and Grover, 2012). In addition, variable sand dam water yield produces unequal economic impact on communities, a reality that remains unexamined. Further research should develop a better understanding of the relationship between sand dam water yield, NGO training opportunities and relationship with the sand dam community, and economic impact.
5. Water Quality Implications
5.1. Water Quality Levels
5.1.1. Electrical Conductivity
Most water quality studies in sand dams focus primarily on salinity and microbiological quality, with Electrical Conductivity (EC) or Total Dissolved Solids (TDS) (derived from conductivity) being the most frequently tested parameters (see Table 3). Multiple studies have found EC/TDS levels which fall below Kenyan (where most sand dam research has occurred) national and global standards (see Table 4).
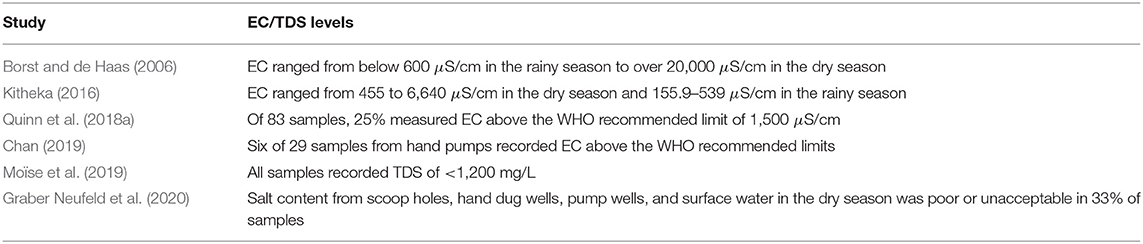
Table 3. Levels of EC/TDS measured in different studies.
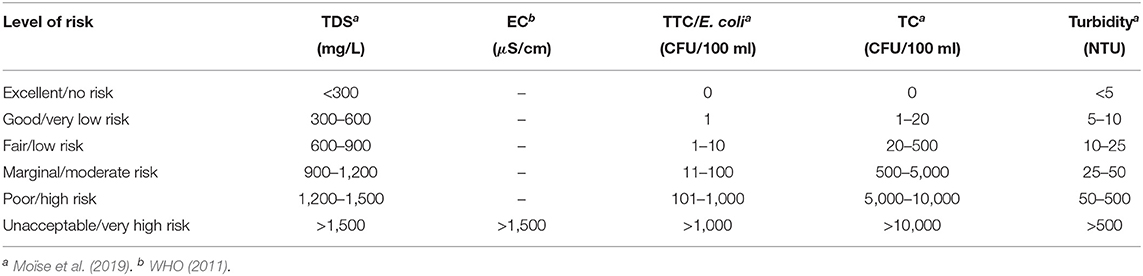
Table 4. Water quality ratings based on total dissolved solids (TDS), electrical conductivity (EC), thermotolerant coliforms (TTC), total coliforms (TC), and turbidity.
The majority of papers found a similar proportion of samples falling below quality standards. All studies recorded some samples of high to very high risk, except for Moïse et al. (2019) whose TDS samples all fell below 1,200 mg/L (marginal)—indicating minimal risk. Quinn et al. (2018a) tested EC at 50 dam sites with many pump wells and scoop holes tested twice, improving the reliability of results. Graber Neufeld et al. (2020) undertook similar scientific rigor, randomly selecting 89 sites from 953 sites by a random number generator. Although those selected sites were only from 1990 onwards and built exclusively by two sand dam organizations, bias is limited due to the random selection. Moïse et al. (2019) on the other hand, purposively selected only three dam sites based on water availability, ease of accessibility and presence of at least two modes of abstraction. The very small sample size and selection criteria could explain the lower recorded values of TDS and could have introduced unconscious bias. Similarly, the study by Chan (2019) was funded by Excellent Development and studied only their dams with smart hand pumps, potentially introducing bias into the selection process.
5.1.2. Microbiological
Whilst EC is important in influencing perceptions and water source choice, in isolation it rarely poses a health risk at the values at which it is usually found in water (de França Doria et al., 2009). Microbiological quality, on the other hand, poses a greater threat to user's health. The indicator bacteria, Thermotolerant (TTC) and Total Coliforms (TC), are frequently used measures of microbiological quality in water quality testing. This is because they indicate the potential presence of other more harmful bacteria, which individually are much more difficult to measure (Ferguson et al., 2012). A number of the samples in Table 5 do not comply with WHO standards for microbiological quality (see Table 4). Having said this, the stringent drinking water guidelines of 0 TTC/100 ml is widely understood to be unattainable in many countries (Parker et al., 2010).
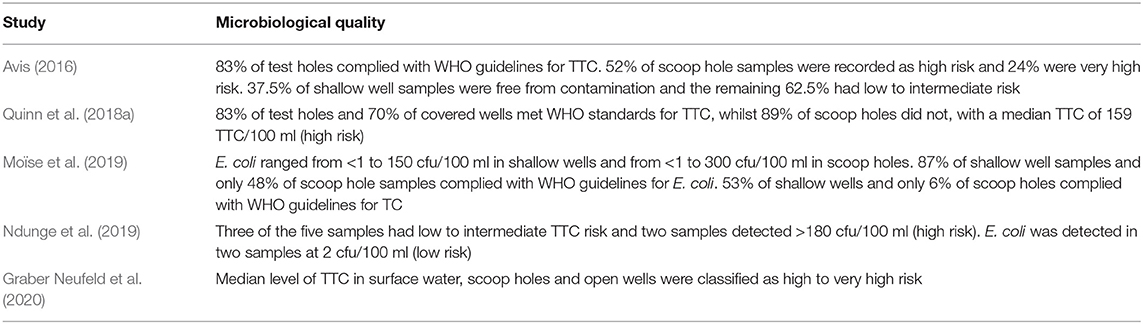
Table 5. Measures of microbiological quality in different studies.
These results indicate significant levels of microbiological contamination, which have not been considered by many advocates of sand dams. Having said this, some caution must be taken when analysing these results. For example, Avis (2016) only tested eight shallow wells, whilst Ndunge et al. (2019) only tested five samples—both too small a sample size from which to draw statistically significant conclusions. Furthermore, the technique of testing for TTC was new to the research team, with four of the five positive test hole samples being recorded in the first five samples (Avis, 2016). Whilst digging techniques improved with time, this initial difficulty may have resulted in an inaccurate estimation of water quality. Furthermore, the use of membrane filtration by Avis (2016) to carry out the microbiological analysis could also have led to false estimates of water quality, because the technique is unsuitable for the high turbidity levels present in most samples. Furthermore, the mode of abstraction is clearly highly influential and will be discussed further below.
5.1.3. Other Physicochemical Parameters
Other physicochemical quality parameters explored in the literature include turbidity, pH, temperature, total hardness (TH), biochemical oxygen demand (BOD), and trace metal elements. On analysis of these findings, turbidity is the most critical physicochemical parameter as turbid water is unpleasant to taste, difficult to chlorinate, and bacteria, viruses and other microbial parasites can hide themselves in the suspended particles (Moïse et al., 2019). It is recommend by WHO that turbidity should not exceed 5 NTU (WHO, 2017). Table 6 outlines the turbidity values documented in a handful of studies.
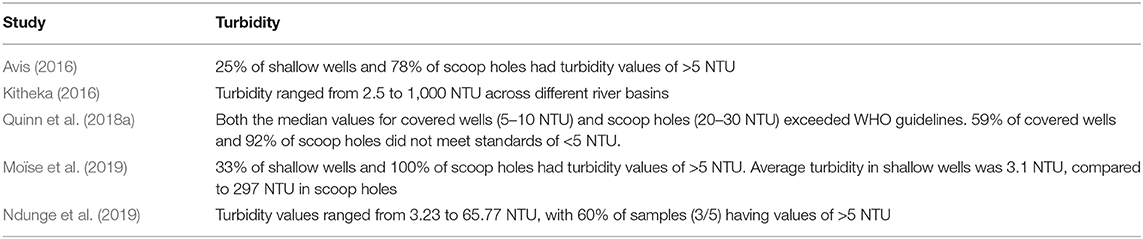
Table 6. Measures of turbidity in different studies.
Total hardness levels should not exceed 300 ppm in drinking water WHO (2011). Moïse et al. (2019) found mean TH to be 277.38 mg/L. Whilst a maximum hardness of 1,115 mg/L was recorded, 92% of samples complied with WHO recommendations. Ndunge et al. (2019) found similar results with a mean TH 229 mg/L, with two of the five samples only marginally exceeding the standard.
Whilst quality concerns in some localities appear minimal, results from multiple studies indicate heightened levels of EC, TDS, TTC, and TC in certain sand dams, posing several challenges to the local community. As all of these studies focused only on quality once the sand dams had been constructed, further research is needed to understand how physicochemical parameters change from prior- to post-sand dam construction. This would demonstrate whether sand dams are altering the quality of river water, giving a more comprehensive understanding of the impact that sand dams can have.
5.2. Spatial Variations in Water Quality
Water quality in sand dams is spatially highly variable, both between localities and abstraction method. Firstly, EC values tend to be higher in pump wells and sand dams compared to in river scoop holes and surface waters (Kitheka, 2016). Similar trends were found in the Ukambani region of Kenya (Graber Neufeld et al., 2020). Water from pump wells had a median TDS of >1,500 ppm, compared to 500 ppm in scoop holes and surface waters and ~800 ppm in hand dug wells. Measurements of TDS by Moïse et al. (2019) were similarly higher in pump wells (692–1,132 mg/L) than in scoop holes (64–872 mg/L). These heightened levels of EC and TDS in the sand dam pump well may be as a result of ground water recharge, the increased residence time of water entrapped in the dam, and solubilization of minerals from soils, allowing a greater degree of mineral dissolution and therefore a higher value of TDS and EC (Kitheka, 2016).
Anecdotal evidence from Strohschein (2016) conversely suggests that in Kivuna catchment, the riverbed water is considered salty whilst the shallow wells are considered less salty. As quality was not a focus of this study, no data is available, and these comments should therefore be considered with care. The studies in general give little explanation for the changes in EC. As a result of this, and the conflicting results from different studies, further research should focus on both the occurrence and causes of such variation to explore whether any practical steps can be made to mitigate high levels of EC.
Microbiological quality and turbidity are often of a lower standard in scoop holes, surface water and hand dug wells compared with pumps wells. For example, Ndunge et al. (2019) identified counts of E.coli only in their scoop hole samples, with levels of fecal coliforms also higher here compared to water samples from taps and shallow wells. Additionally, whilst high fecal coliform levels were detected in surface water, scoop holes, and open wells by Graber Neufeld et al. (2020), significantly lower levels were detected in pump wells. The disparity is further highlighted in studies by Avis (2016), Quinn et al. (2018a), and Moïse et al. (2019) in Table 5. This may be due to the poor sanitary conditions (such as human contact, animal contact, and water runoff) related to these methods of abstraction (Cairncross and Feachem, 2018). These findings thus suggest that sand dams themselves are fairly effective filters of microbiological contamination, with the source of most microbiological contamination rooted in human error.
5.3. Seasonal Variations in Water Quality
Not only do disparities in water quality occur between abstraction methods, but also between seasons. There is evidence that EC levels are affected by rainfall and stream flow, with the flowing water providing a flushing effect of salts through a system, suggesting that EC levels will be higher in the dry season (Pillsbury, 1981). Borst and de Haas (2006) found the EC of water from sand dams to typically be between 2,000 and 10,000 μS/cm at the end of the dry season. This compared to values of <600 μS/cm when the rainy season started owing to much lower levels of EC in rainfall compared to that of groundwater. Similarly, in Makueni, samples taken from areas of lower rainfall and those taken in the dry season were found to have higher average conductivity (Quinn et al., 2018a). Attributing these factors to higher levels of rainfall again is only an assumption and the limited time frame and lack of measurement of confounding factors limits this interpretation. EC improvements with subsequent storms have been demonstrated in a model sand dam scenario, in which a 0.5 m3 sand reservoir was constructed (Hatem kamel and Almula, 2016). The study found that EC decreased by ~80% after five storm events, with TDS also decreasing significantly. The crudeness with which these results have been obtained, however, limits their usefulness when determining the significance and degree of variation seen between seasons. The study is based on a sand dam model built to simulate a sand reservoir, which was filled with sand samples from two different soils. It is, however, unknown where these soils are from, making results limited in explaining real-world, location-specific processes.
Whilst conductivity levels may be higher in the dry season, there is evidence that microbiological quality is lower in the rainy season. Changes in contamination is determined by a balance of factors, such as the input of uncontaminated water (flushing effect), the input of new contamination and the proliferation of existing bacteria (Graber Neufeld et al., 2020). In a study in Niassa, Mozambique, higher levels of TTC were recorded in both traditional and improved wells during the rainy season (November–March) and in the leadup to the rain (August–September). This later spike could in part be attributed to an increased demand of the wells combined with minimal yield (Godfrey et al., 2006). At sand dam sites, Avis (2016) noted that water running from the soiled surfaces of sand dams into scoop holes likely contributes to contamination here, with this impact likely increasing in significance during the rainy season. Despite general consensus that it is often rainfall which transports coliforms into water sources (Reade, 2001), Graber Neufeld et al. (2020) found no statistically significant difference in levels of coliforms between the dry and rainy season.
Due to some uncertainties around seasonal quality variations, it would be beneficial to undertake an in-depth longitudinal study at various localities. Water quality (EC and microbiological) along with different variables within each location, such as land-use and surrounding geology should be compared. This would enable a better understanding of the causes of quality variations throughout the year.
6. Discussion and Conclusions
Quite simply, sand dam hydrology is poorly understood. Most sand dam modeling efforts have effectively explored the hydrology of a perfectly functioning sand dam built into an impervious, homogeneous, and isotropic subsurface. These studies show that sand dams store water for years without drying, raise the groundwater table, and provide water sufficient to support a community in a changing climate (Aerts et al., 2007; Hut et al., 2008; Quilis et al., 2009; Lasage et al., 2015). However, hydrological analyses based on field data collected from a handful of sand dams in Kenya and Tanzania tell a different story. Many of these dams do not retain water throughout the dry season, due to issues with low storage volumes (siltation), seepage (pervious streambed, water flow under or around the dam), and over-abstraction (de Trincheria et al., 2015; Quinn et al., 2019; Eisma and Merwade, 2020). Whilst this may be the case, sand dams are able to reduce the rate of water loss due to runoff and evaporation, thus extending the duration of water availability through the year (Quinn et al., 2018b; Eisma and Merwade, 2020). Sand dams can also raise the local groundwater, with the extent of impact, however, often limited in space and time (Quinn et al., 2019; Eisma and Merwade, 2020). Functioning sand dams can provide a buffer against climate change-induced increases in water scarcity. However, sand dams likely cannot meet 100% of the predicted needs and are not a one-size-fits-all solution to rural water scarcity.
The majority of sand dam studies identify a positive contribution to the health and well-being of those in local communities. Even if some do not provide a year-round water supply, on successfully filling with sand they are shown to increase water availability (Pauw et al., 2008). Before maturity, a process that can take up to seven years (Borst and de Haas, 2006), sand dams are essentially a traditional masonry dam and store ponded water, increasing local water availability. However, ponded water is not protected from evaporation or filtered by the sand. Additionally, water accessibility is increased by the provision of a well with a handpump and/or by bringing water closer to settlements, thus reducing water collection times (Pauw et al., 2008). With these impacts comes a plethora of secondary benefits from reduced disease incidence, increased school attendance and improved nutrition (Aroka, 2010; Maddrell, 2010; Stern and Stern, 2011). Whilst impacts are potentially heterogeneous, dependent on factors, such as geographic location and individual sand dam characteristics, their impacts are reported as overwhelmingly positive by the majority of studies.
Highly functioning sand dams provide water to their communities at less than half the cost of buying water locally (Mati, 2005; Stern and Stern, 2011; Gies et al., 2014; Lasage and Verburg, 2015). Thus, sand dams are often cited as the most cost-efficient small-scale water harvesting technology (Mati, 2005; Lasage and Verburg, 2015). However, many sand dams do not provide the expected water yield, which can make them less cost effective (de Trincheria et al., 2018). In such cases, an investment of up to 10,000 EUR may not significantly increase local water security. For communities with a productive sand dam, their livelihoods are significantly improved. The additional water is used for a wide range of economic activities, such as brick and basket making, irrigating higher value crops to sell, and laundry services (Manzi, 2005; Lasage et al., 2008; Pauw et al., 2008; Cruickshank and Grover, 2012). The increase in economic opportunity raises the local income by up to 215 EUR per capita or 20% of Kenya's annual per capita gross national income (Lasage et al., 2008; Pauw et al., 2008). Unfortunately, these benefits are not shared equally by all, with those living closer to the sand dam receiving the most benefits (Ertsen and Hut, 2009; Cruickshank and Grover, 2012).
The water quality of sand dams, whilst highly spatially and temporally variable, does pose concerns in certain situations. Electrical conductivity tends to be found at higher values in pump wells than in scoop holes and surface water (Kitheka, 2016; Graber Neufeld et al., 2020), whilst microbiological contamination is higher in scoop holes, likely as a result of poor sanitary conditions (Cairncross and Feachem, 2018; Ndunge et al., 2019). These high levels of microbiological contamination, accompanied by such high use of scoop holes are concerning trends across many rural communities, which, along with the underlying causes, need to be taken much more seriously. Other physicochemical quality parameters of note are hardness and turbidity. Whilst turbidity in scoop holes poses a threat, with low compliance of standards, total hardness is less of an issue, with the majority of samples falling within standards. Additionally, higher EC values tend to be found in the dry season, whilst lower microbiological quality persists in the rainy season, resulting in temporally variable threats.
6.1. Critique of the Current Literature
From our review of the literature, several common limitations of current studies have been identified. These shortcomings limit the confidence we can have in their findings regarding the potential benefits and disadvantages of sand dams.
6.1.1. Study Bias
One of the major critiques is in the sampling of sand dam sites. Firstly, sand dams are more often than not constructed by sand dam specific organizations. Whilst this presents benefits in the form of knowledge, time and effort, it can also inadvertently lead to the pursuit of positive results. For example, several of the study authors have direct ties to sand dam organizations, with two such studies being overwhelmingly positive. On the other hand, one is interestingly less so, advocating sub-surface dams instead of sand dams, following several decades of experience in dryland water harvesting techniques (Nissen-Petersen, 2010). Secondly, all of the studies to date have employed non-probability sampling, thus introducing the potential for skewed results. Finally, even when not linked to potential biases, sample selection in many of the studies has been small, limiting the statistical power of results. It is therefore recommended that future studies employ larger sampling sizes. It would also be beneficial for a study at one point to include all constructed dams in a sampling frame. This would ensure no bias toward selecting favorable sand dams for study and would also provide insight into the success rate of dams, which few studies have addressed.
Most published studies focus on Kenya, displaying a distinct lack of geographically diverse study sites. With many optimum sites, Kenya has seen by far the most sand dams constructed in recent years. This has unsurprisingly made it a fitting country for sand dam research. Having said this, sand dams do exist outside of Kenya. The current lack of research in other countries limits our understanding of the applicability of sand dams elsewhere, however, and hence minimizes confidence and subsequent investment in sand dams in such places. Carrying out studies in localities outside of Kenya, both with known and unknown sand dam potential is therefore encouraged.
6.1.2. Questionable Methodologies
Other limitations in a number of the reviewed studies stem from less than optimum methodologies. For example, most interviews, surveys and participatory methods have relied on recall, with no studies gaining real-time data. Whilst real-time data collection is very often impractical, relying on recall can significantly reduce the accuracy of results, especially when collecting data from many years previous, prior to sand dam construction for example. Other studies have lacked scientific rigor, with, for example, no statistical analysis, crude data collection methods and sampling techniques, and a lack of data to support claims. Whilst this is by no means the case for all studies, it is important to note. Finally, with regards to methods, is the prevalence of cross-sectional studies. Whilst a handful of studies conducted longitudinal studies, the majority collected data at only one point in time. This is limiting due to missed trends in seasonal variations and future studies should strive to collect data across seasons and in real-time, if feasible.
Furthermore, results from sand dam field studies often do not agree with modeling results, because the assumptions made to develop the models are questionable. For example, most sand dam models assume a specific yield of 0.25–0.30. However, field studies indicate that the specific yield of sand dams is likely around half of that (Quinn et al., 2018b). Further, sand dam models assume the structure is built into an impervious streambed, but this is likely rarely the case. Identifying the imperviousness of a streambed is challenging under the best circumstances but infeasible in the rural drylands where sand dams are built. As much as possible, sand dam models should reflect the findings of field studies investigating the hydrology of sand dams.
6.2. Further Research Needs
The assessment of current knowledge on sand dams presented above highlights the need for further research, firstly to provide evidence to support or counter existing uncertainties and secondly to conduct studies on which no data exists, ensuring that some of the limitations identified are addressed. Very few studies have looked at the future role of sand dams under climate change. Under increasing pressure to improve water security as a result of climatic uncertainty, further studies on sand dams must highlight their potential benefits and shortcomings in improving water security so that informed decisions can be made about their sustainability.
Many gaps remain in our understanding of sand dam hydrology and the opportunities that sand dams present for increased water security. Studies should be conducted to better quantify evaporation losses and to identify cost-effective ways to protect stored water from evaporation. Additionally, an extensive field study is needed to examine the spatial and temporal extent of groundwater impact that results from added storage in a sand dam. If sand dams do significantly recharge the local groundwater table, such a study would explain the dynamics of the recharge process and provide insights into how sand dams function within their local ecosystem. Further, studies should employ a greater variety of models to examine the effectiveness of sand dams under climate change, incorporating varied assumptions and considering recent findings when setting parameters.
Finally, a need for studying sand dam sites pre- and post-construction has been identified. Whilst a lot of work has been done on appropriate site selection, no studies have measured parameters before and after construction in real-time. Useful data to collect would include water quality, water availability, wealth, and education. By measuring such parameters pre- and post-construction in real time, the impact that the dams are having on water quality, the health and well-being of local residents, and their ability to cope with climate change could be better understood.
6.3. Uncertainty and Sand Dams With a Changing Climate
The limitations of the current literature and gaps in our knowledge make it difficult to unequivocally support sand dams as the most effective climate change adaptation for rural dryland communities. Their role in helping communities to cope in a changing climate and increasing water stress cannot yet be fully defined. At best, sand dams revitalize communities by increasing water availability, health, and economic activity. At worst, sand dams are expensive man-made waterfalls. These two extremes are unlikely to be affected by climate change, and sand dams are likely to continue providing a positive, but varying, impact on their local community. Current climate change projections in East Africa indicate a trend toward increased rainfall that is concentrated in fewer, more intense events (Bank, 2013). This will exacerbate the current condition in most of rural East Africa, where communities lack the infrastructure to capture and store water for use between rain events and during the dry season.
Such a pattern of rainfall will have far reaching impacts, because much of the economic activity in rural communities relies on the use of water. For example, most agricultural land in sub-Saharan Africa is primarily rainfed. Infrequent rainfall will increase the likelihood that crops will experience extended periods of water stress, which will decrease crop yield (Biazin et al., 2012). Reduced crop yield will not only impact the food security of rural communities but will also significantly reduce their annual income, which is typically generated from selling excess crops to the market. Sand dams can successfully improve rural water availability but are often not reliable enough to be the sole solution employed by rural communities facing decreased water access as a result of climate change. Communities would benefit from a multi-modal approach that relies on a combination of water harvesting infrastructures to increase climate change resilience. With a changing climate, sand dams will increasingly provide unequal access to water for many communities. As shown in the climate change analysis by Aerts et al. (2007) and Lasage et al. (2015), sand dams will continue to improve water availability in local communities but may have an increasingly negative impact on downstream flows. With a reduced frequency of rainfall events, sand dams may store a higher percentage of seasonal runoff thereby reducing water security for downstream communities (Aerts et al., 2007).
Climate change also has implications for the quality of water in sand dams. Warmer temperatures may increase the rate of evaporation from sand dams, potentially increasing the salinity of the stored water. Increased salinity not only reduces the palatability of water but will also negatively impact crop production (Grattan, 2002). Whilst the microbiological quality from scoop holes is often low, this is often due to poor sanitary conditions. The sand dams themselves, however, are largely able to filter much of the microbiological contamination in the water. More extreme weather, however, has the potential to improve conditions for the growth of bacteria, increasing the risk of water-borne illnesses (Charron et al., 2004).
Sand dams certainly have widespread positive impacts for many communities, and these benefits will continue despite a changing climate. However, sand dams also leave some households behind—due to unequal benefits within, and across communities (Ertsen and Hut, 2009; Cruickshank and Grover, 2012), most notably in downstream communities and in those with non-functioning sand dams. Further work is needed to improve both the science of sand dams and the water management practices employed by sand dam communities to maximize their potential as a climate change adaptation.
Author Contributions
HR and JE contributed equally to writing the manuscript and share first authorship. AP contributed by reviewing this work and providing the expert knowledge. All authors contributed to the article and approved the submitted version.
Funding
JE was supported in part by USAID (grant no. A1134) and HR was supported by Engineering and Physical Sciences Research Council (grant no. EP/S022066/1).
Conflict of Interest
The authors declare that the research was conducted in the absence of any commercial or financial relationships that could be construed as a potential conflict of interest.
Acknowledgments
The authors would like to thank the two peer reviewers for their comments and constructive criticisms that helped improve the quality of the review.
References
Aerts, J., Lasage, R., Beets, W., de Moel, H., Mutiso, G., Mutiso, S., et al. (2007). Robustness of sand storage dams under climate change. Vadose Zone J. 6:572. doi: 10.2136/vzj2006.0097
Aroka, N. (2010). Rainwater harvesting in rural Kenya: reliability in a variable and changing climate (Master's thesis), Stockholm University, Stockholm, Sweden.
Avis, O. (2016). “A microbial analysis of water stored in sand dams and associated abstraction methods,” in 7th RWSN Forum (Abidjan).
Bank, W. (2013). Turn Down the Heat: Climate Extremes, Regional Impacts, and the Case for Resilience. A Report for the World Bank by the Potsdam Institute for Climate Impact Research and Climate Analytics.
Beswetherick, S., Carrière, M., Legendre, V., Mather, W., Perpes, T., and Saunier, B. (2018). Guidelines for the Siting of Sand Dams. Cranfield: Cranfield University.
Biazin, B., Sterk, G., Temesgen, M., Abdulkedir, A., and Stroosnijder, L. (2012). Rainwater harvesting and management in rainfed agricultural systems in sub-saharan africa-a review. Phys. Chem. Earth 47, 139–151. doi: 10.1016/j.pce.2011.08.015
Borst, L., and de Haas, S. (2006). Hydrology of sand storage dams: a case study in the Kiindu catchment, Kitui District, Kenya (Master's thesis), Vrije Universiteit Amsterdam, Amsterdam, Netherlands.
Cairncross, S., and Feachem, R. (2018). Environmental Health Engineering in the Tropics: Water, Sanitation and Disease Control. London: Routledge.
Chan, J. (2019). Abstraction of water from sand dams in Machakos and Makueni counties (Kenya) via handpumps (Master's thesis), Cranfield University, Bedford, United Kingdom.
Charron, D. F., Thomas, M. K., Waltner-Toews, D., Aramini, J. J., Edge, T., Kent, R. A., et al. (2004). Vulnerability of waterborne diseases to climate change in canada: a review. J. Toxicol. Environ. Health 67, 1667–1677. doi: 10.1080/15287390490492313
Cruickshank, A., and Grover, V. I. (2012). “These are our water pipes sand dams, women and donkeys: dealing with water scarcity in Kenya's arid and semi-arid lands,” in Climate Change and the Sustainable Use of Water Resources, ed W. Leal Filho (Berlin: Springer), 701–726. doi: 10.1007/978-3-642-22266-5_42
de Bruijn, E., and Rhebergen, W. (2006). Socio-Economic Impacts of Sand Dams, Case Study in Kitui District, Kenya. Amsterdam: Faculty of Earth and Life Sciences, Vrije Universiteit.
de França Doria, M., Pidgeon, N., and Hunter, P. R. (2009). Perceptions of drinking water quality and risk and its effect on behaviour: a cross-national study. Sci. Total Environ. 407, 5455–5464. doi: 10.1016/j.scitotenv.2009.06.031
de Trincheria, J., Leal, W. F., and Otterpohl, R. (2018). Towards a universal optimization of the performance of sand storage dams in arid and semi-arid areas by systematically minimizing vulnerability to siltation: a case study in Makueni, Kenya. Int. J. Sediment Res. 33, 221–233. doi: 10.1016/j.ijsrc.2018.05.002
de Trincheria, J., and Nissen-Petersen, E. (2015). “Sand storage dams. Performance, cost-efficiency, working principles and constraints,” in International Symposium on RWH in Ethiopia (ISRH) (Dire Dawa).
de Trincheria, J., Nissen-Petersen, E., Filho, W., and Otterphol, R. (2015). “Factors affecting the performance and cost-efficiency of sand storage dams in South-Eastern Kenya,” in Conference Proceeding at the International Symposium on RWH in Ethiopia (ISRH) (The Hague).
Eisma, J. A., and Merwade, V. M. (2020). Investigating the environmental response to water harvesting structures: a field study in Tanzania. Hydrol. Earth Syst. Sci. 24, 1891–1906. doi: 10.5194/hess-24-1891-2020
Eisma, J. A., and Merwade, V. M. (2021). A data-driven approach to assessing the impact of water harvesting structures on regional water storage in East Africa. J. Hydroinform. 23, 352–367. doi: 10.2166/hydro.2021.115
Ertsen, M., Biesbrouck, B., Postma, L., and van Westerop, M. (2005). Community Organisation and Participatory Design of Sand-Storage Dams in Kenya. Coalitions and Collisions. Nijmegen: Wolf Publishers.
Ertsen, M., and Hut, R. (2009). Two waterfalls do not hear each other. Sand-storage dams, science and sustainable development in Kenya. Phys. Chem. Earth 34, 14–22. doi: 10.1016/j.pce.2008.03.009
Ferguson, A. S., Layton, A. C., Mailloux, B. J., Culligan, P. J., Williams, D. E., Smartt, A. E., et al. (2012). Comparison of fecal indicators with pathogenic bacteria and rotavirus in groundwater. Sci. Total Environ. 431:314–322. doi: 10.1016/j.scitotenv.2012.05.060
Gies, L., Agusdinata, D. B., and Merwade, V. (2014). Drought adaptation policy development and assessment in east africa using hydrologic and system dynamics modeling. Nat. Hazards 74, 789–813. doi: 10.1007/s11069-014-1216-2
Godfrey, S., Timo, F., and Smith, M. (2006). Microbiological risk assessment and management of shallow groundwater sources in Lichinga, Mozambique. Water Environ. J. 20, 194–202. doi: 10.1111/j.1747-6593.2006.00040.x
Graber Neufeld, D., Muendo, B., Muli, J., and Kanyari, J. (2020). Coliform bacteria and salt content as drinking water challenges at sand dams in Kenya. J. Water Health 18, 602–612. doi: 10.2166/wh.2020.192
Hatem kamel, A., and Almula, A. S. (2016). Experimental investigation about the effect of sand storage dams on water quality. ZANCO J. Pure Appl. Sci. 28, 485–491. doi: 10.21271/zjpas.v28i2.857
Hellwig, D. (1973). Evaporation of water from sand, 3: the loss of water into the atmosphere from a sandy river bed under arid climatic conditions. J. Hydrol. 18, 305–316. doi: 10.1016/0022-1694(73)90054-1
Hoogmoed, M. (2007). Analyses of impacts of a sand storage dam on groundwater flow and storage: groundwater flow modelling in Kitui District, Kenya (Master's thesis), Department of Hydrogeology, Vrije Universiteit Amsterdam, Amsterdam, Netherlands.
Huang, J., Li, Y., Fu, C., Chen, F., Fu, Q., Dai, A., et al. (2017). Dryland climate change: recent progress and challenges. Rev. Geophys. 55, 719–778. doi: 10.1002/2016RG000550
Hut, R., Ertsen, M., Joeman, N., Vergeer, N., Winsemius, H., and van de Giesen, N. (2008). Effects of sand storage dams on groundwater levels with examples from Kenya. Phys. Chem. Earth 33, 56–66. doi: 10.1016/j.pce.2007.04.006
Jansen, J. (2007). The influence of sand dams on rainfall-runoff response and water availability in the semi-arid Kiindu Catchment, Kitui District, Kenya (Master's thesis), Vrije Universiteit Amsterdam, Amsterdam, Netherlands.
Kitheka, J. U. (2016). Seasonal river channel water exchange and implications on salinity levels in sand dams: case of semi-arid Kitui region, Kenya. J. Environ. Earth Sci. 6, 66–85.
Lasage, R., Aerts, J., Mutiso, G.-C., and de Vries, A. (2008). Potential for community based adaptation to droughts: sand dams in Kitui, Kenya. Phys. Chem. Earth 33, 67–73. doi: 10.1016/j.pce.2007.04.009
Lasage, R., Aerts, J. C. J. H., Verburg, P. H., and Sileshi, A. S. (2015). The role of small scale sand dams in securing water supply under climate change in Ethiopia. Mitig. Adapt. Strat. Glob. Change 20, 317–339. doi: 10.1007/s11027-013-9493-8
Lasage, R., and Verburg, P. H. (2015). Evaluation of small scale water harvesting techniques for semi-arid environments. J. Arid Environ. 118, 48–57. doi: 10.1016/j.jaridenv.2015.02.019
MacDonald, A. M., Bonsor, H. C., Dochartaigh, B. É. Ó., and Taylor, R. G. (2012). Quantitative maps of groundwater resources in Africa. Environ. Res. Lett. 7:024009. doi: 10.1088/1748-9326/7/2/024009
Maddrell, S., and Bown, S. (2017). Sand dams: Africa's answer to climate change. Brentford: Excellent Development.
Manzi, H. (2005). Kitui sand dam socio-economic impacts and outcomes from changes in agriculture practices and production (Master's thesis), Egerton University, Nakuru, Kenya.
Manzi, H. K., and Kuria, D. N. (2012). The use of satellite images to monitor the effect of sand dams on stream bank land cover changes in Kitui District. J. Agric. Sci. Technol. 13, 133–150.
Mati, B. (2005). Overview of Water and Soil Nutrient Management Under Smallholder Rainfed Agriculture in East Africa. International Water Management Institute (IWMI). Technical report, Working paper, 105 pp.
Moïse, N., Kaluli, J. W., and Home, P. G. (2019). Evaluation of sand-dam water quality and its suitability for domestic use in arid and semi-arid environments: a case study of Kitui-west sub-county, Kenya. Int. J. Water Resour. Environ. Eng. 11, 91–111. doi: 10.5897/IJWREE2019.0855
Munyao, J., Munyoki, J., Kitema, M., Kithuku, D., Munguti, J., and Mutiso, S. (2004). Kitui Sand Dams: Construction and Operation. Kitui: SASOL Foundation, 53.
Ndunge, D., Mbuge, D., and Omuto, C. (2019). Protocol for evaluating sand dam water quality in semi-arid areas: a case study of makueni county. IOSR J. Eng. 9, 1–14.
Neal, I. (2012). The potential of sand dam road crossings. Dams Reservoirs 22, 129–143. doi: 10.1680/dare.13.00004
Ngugi, K. K., Gichaba, C. M., Kathumo, V. V., and Ertsen, M. M. (2020). Back to the drawing board: assessing siting guidelines for sand dams in Kenya. Sustain. Water Resour. Manage. 6, 1–28. doi: 10.1007/s40899-020-00417-4
Nissen-Petersen, E. (2006). Water From Dry Riverbeds. Technical handbook for DANIDA. ASAL Consultants Limited for the Danish International Development Assistance.
Nissen-Petersen, E. (2011). Sand Dams or Silt Traps. ASAL Consultants Limited. Available online at: http://www.samsamwater.com/library/Sand_dams_or_silt_traps.pdf (accessed December 10, 2013).
Parker, A., Youlten, R., Dillon, M., Nussbaumer, T., Carter, R. C., Tyrrel, S. F., et al. (2010). An assessment of microbiological water quality of six water source categories in north-east uganda. J. Water Health 8, 550–560. doi: 10.2166/wh.2010.128
Pauw, W., Mutiso, S., Mutiso, G., Manzi, H., Lasage, R., Aerts, J., et al. (2008). An Assessment of the Social and Economic Effects of the Kitui Sand Dams. Sasol & Institute for Environmental Studies.
Pillsbury, A. F. (1981). The salinity of rivers. Sci. Am. 245, 54–65. doi: 10.1038/scientificamerican0781-54
Quilis, R. O., Hoogmoed, M., Ertsen, M., Foppen, J. W., Hut, R., and Vries, A. (2009). Measuring and modeling hydrological processes of sand-storage dams on different spatial scales. Phys. Chem. Earth 34, 289–298. doi: 10.1016/j.pce.2008.06.057
Quinn, R., Avis, O., Decker, M., Parker, A., and Cairncross, S. (2018a). An assessment of the microbiological water quality of sand dams in southeastern Kenya. Water 10:708. doi: 10.3390/w10060708
Quinn, R., Parker, A., and Rushton, K. (2018b). Evaporation from bare soil: lysimeter experiments in sand dams interpreted using conceptual and numerical models. J. Hydrol. 564, 909–915. doi: 10.1016/j.jhydrol.2018.07.011
Quinn, R., Rushton, K., and Parker, A. (2019). An examination of the hydrological system of a sand dam during the dry season leading to water balances. J. Hydrol. X 4:100035. doi: 10.1016/j.hydroa.2019.100035
Reade, A. (2001). Interpretation of water quality surveillance data for maintenance purposes in the highlands of Guatemala (Master's thesis), Cranfield University, Bedford, United Kingdom.
Ryan, C., and Elsner, P. (2016). The potential for sand dams to increase the adaptive capacity of East African drylands to climate change. Reg. Environ. Change 16, 2087–2096. doi: 10.1007/s10113-016-0938-y
Standen, K., Costa, L. R., and Monteiro, J. P. (2020). In-channel managed aquifer recharge: a review of current development worldwide and future potential in Europe. Water 12:3099. doi: 10.3390/w12113099
Stengel, H. W. (1968). Wasserspeicherung in den Sanden eines Riviers: Ein wasserbautechn. Beitr. dargestellt an den Verhaeltnissen der Farm Otjozondu, Distrikt Karibib, Suedwestafrika. Windhoek: SWA Wiss. Ges.
Stern, J. H., and Stern, A. (2011). Water Harvesting Through Sand Dams. Tech. NP, Echo Technical Note.
Strohschein, P. (2016). Exploring the Influence of Sand Storage Dams on Hydrology and Water Use. M.Sc thesis, TU Delft, Delft.
Tuinhof, A., and Heederik, J. P. (2002). Management of Aquifer Recharge and Subsurface Storage: Making Better Use of Our Largest Reservoir. Technical report, The World Bank.
United Nations General Assembly (2015). Transforming Our World: The 2030 Agenda for Sustainable Development. New York, NY: Division for Sustainable Development Goals.
Van Haveren, B. P. (2004). Dependable water supplies from valley alluvium in arid regions. Environ. Monit. Assess. 99, 259–266. doi: 10.1007/s10661-004-4031-5
Van Loon, A., and Droogers, P. (2006). Water Evaluation and Planning System, Kitui-Kenya. Wageningen: WatManSup Research, 69 pp.
van Wijk-Sijbesma, C. (2001). The Best of Two Worlds? Methodology for Participatory Assessment of Community Water services. PhD thesis, Wageningen University, Wageningen.
Viducich, J. (2015). Spillway staging and selective sediment deposition in sand storage dams (Master's thesis), Oregon State University, Corvallis, OR, United States.
Wanyonyi, J. M. (2013). Rainwater harvesting possibilities and challenges in Kenya. Nairobi: Kenya Rainwater Association.
WHO (2017). Water Quality and Health-Review of Turbidity: Information for Regulators and Water Suppliers. Technical report, World Health Organization.
Keywords: water harvesting, rural communities, arid, semi-arid, water quality, modeling, cost-efficiency, societal impact
Citation: Ritchie H, Eisma JA and Parker A (2021) Sand Dams as a Potential Solution to Rural Water Security in Drylands: Existing Research and Future Opportunities. Front. Water 3:651954. doi: 10.3389/frwa.2021.651954
Received: 11 January 2021; Accepted: 15 March 2021;
Published: 14 April 2021.
Edited by:
Seifu Kebede Gurmessa, University of KwaZulu-Natal, South AfricaReviewed by:
Alemseged Tamiru Haile, International Water Management Institute, EthiopiaGuillaume Lacombe, Institut National de la Recherche Agronomique (INRA), France
Copyright © 2021 Ritchie, Eisma and Parker. This is an open-access article distributed under the terms of the Creative Commons Attribution License (CC BY). The use, distribution or reproduction in other forums is permitted, provided the original author(s) and the copyright owner(s) are credited and that the original publication in this journal is cited, in accordance with accepted academic practice. No use, distribution or reproduction is permitted which does not comply with these terms.
*Correspondence: Hannah Ritchie, aGFubmFoLnJpdGNoaWVAY3JhbmZpZWxkLmFjLnVr; Jessica A. Eisma, amVzc2ljYS5laXNtYUB1dGEuZWR1
†These authors have contributed equally to this work and share first authorship