 Rajesh Melaram1*
 Brandon Lopez-Dueñas2
- 1School of Health Sciences, Walden University, Minneapolis, MN, United States
- 2Department of Science, Eastern Florida State College, Melbourne, FL, United States
Clean, fresh, and safe drinking water is essential to human health and well-being. Occasionally, biological contaminants taint surface water quality used for human consumption and recreation. Microcystins (MCs) and nodularins (NODs) are toxic monocyclic peptides produced by cyanobacteria in fresh and brackish water. These secondary metabolites can reach hazardous concentrations, impairing surface drinking water supplies and thereby increasing the risk of exposure to consumers. Inconsistent screening of MCs and NODs is not uncommon in drinking water systems and no provisional guidance value has been established in Florida to protect community and public health. We performed a case study of two Florida lakes supplying drinking water to adjacent communities for the purpose of monitoring MCs and NODs over the potential peak algae bloom season (June-August). An indirect competitive enzyme-linked immunosorbent assay (icELISA) was employed to analyze concentrations of total MCs and NODs in environmental water samples from Lake Manatee and Lake Washington. Toxin concentrations were similar in each lake, averaging 0.19 μg/L. The highest toxin concentration (0.47 μg/L) was reported in Lake Manatee at Site 15, a location where other toxin concentrations demonstrated statistical significance with toxins detected at Sites 6 (p = 0.014) and 8 (p = 0.011). Inferential analyses from the Kruskal-Wallis H Test revealed a statistically significance difference in toxin concentrations by sampling month within the two Floridian drinking water systems (p < 0.001). Furthermore, phosphate and nitrite concentrations showed no significant relationships with total MCs and NODs in each lake (p > 0.05). Although results indicate a low probable health risk from cyanotoxins, more research is needed to understand the intrinsic nature of MCs and NODs by examining their prevalence, distribution, and dynamics in surface drinking water supplies serving nearby communities.
Introduction
Potable water is a top priority in community public health. Drinking water quality contributes to daily activities (bathing, cleaning, cooking) and impacts overall health and longevity. Natural processes and human actions can alter water composition including chemical, microbiological, and physical characteristics. Of these water quality parameters, microorganisms such as bacteria are considered of high importance as they commonly reside in drinking water (Levallois and Villanueva, 2019). Lakes supplying drinking water can become contaminated by cyanobacteria and their associated toxins (cyanotoxins,) increasing health risks among consumers. Water pollution from cyanobacteria has shown to cause human gastrointestinal symptoms and illness (Kubickova et al., 2019). Ensuring safe drinking water quality free of cyanobacterial products may protect and improve community public health.
Cyanobacteria are photosynthetic microorganisms capable of proliferating as harmful algal blooms (HABs) in eutrophic waters (Kimambo et al., 2019). In past decades, the frequency, intensity, and location of HABs have increased worldwide (Anderson, 2014; Backer et al., 2015). HAB occurrences are widespread in freshwater ecosystems across the United States, including the Great Lakes, small inland lakes, and rivers (Schmale et al., 2019). Such phenomena can adversely impact agriculture, drinking water, fisheries, food and real estate industries, recreation, tourism, and water quality in general (Cheung et al., 2013; Watson et al., 2015; Carmichael and Boyer, 2016). When HAB organisms deteriorate, algal cells excrete cyanotoxins into surface waters at environmentally relevant concentrations, posing ecological and human health risks (Codd et al., 2005).
Microcystins (MCs) are heterocyclic peptides produced by cyanobacteria (Turner et al., 2018). Several toxic cyanobacterial species can release MCs into the aquatic environment including Microcystis, Dolichospermum, Hapalosiphon, Nostoc, Oscillatoria, and Planktothrix (Szlag et al., 2015). The prevalence of MCs in drinking water is considered a serious health threat (Sakai et al., 2013). Most human exposure to MCs occurs via accidental ingestion of contaminated drinking water (Funari and Testai, 2008). Other relevant exposure pathways include aerosol inhalation, consumption of contaminated aquatic foods, and dermal contact (Drobac et al., 2013). The most toxic MC variant is MC-LR (Lone et al., 2015) and contains the amino acids leucine (L) at position 2 and arginine (R) at position 4 in the cyclic heptapeptide (Carmichael, 1992). The recommended guidance value of acute and chronic exposure to MC-LR in drinking water is 1.0 and 12.0 μg/L, respectively (WHO, 2020).
Nodularins (NODs) constitute other cyanotoxins with similar chemical and toxicological properties as MCs. The NODs are primarily synthesized by Nodularia spumigena in brackish waters and consist of a cyclic pentapeptide structure (Ploug, 2008). NODs depend on an uptake mechanism analogous to MCs, where organic anion transporting peptides actively transport biotoxins into hepatocytes, subsequently inactivating catalytic subunits of serine and threonine phosphatases (Buratti et al., 2017). Consequently, hyperphosphorylation occurs within cells and causes severe cytoskeletal deformities and disturbances in cell cycle control and metabolism (Campos and Vasconcelos, 2010). However, NODs do not covalently bind phosphatases in the same degree as MCs due to absence of a methyldehydroalanine residue (Martins and Vasconcelos, 2009). NODs have been detected in liver and muscle tissue of mullet and dietary transfer of these hepatotoxins may present human health risks (Stewart et al., 2012).
MC poisonings in livestock, pets, and wildlife are well-documented (Mez et al., 1997; Stewart et al., 2006; Backer et al., 2013; Wood, 2016). Domestic animals, wildlife, and human fatalities have resulted from MC intoxications (Lawton and Robertson, 1999). Upon intake, MCs can inactivate serine and threonine phosphatases in hepatocytes (Eriksson et al., 1990). Past animal toxicology experiments revealed abnormal liver changes after oral MC-LR exposure, including altered serum enzyme activities and hepatic injury (Fawell et al., 1999; Heinze, 1999; Sedan et al., 2015). Cyanobacteria-impacted drinking water has shown to cause potential acute health effects, including lower respiratory and gastrointestinal symptoms (Lévesque et al., 2014). Epidemiological scholars have linked chronic MC exposure to liver cancers or diseases on a global scale (Zhang et al., 2015; Zheng et al., 2017). The most renowned human outbreak attributed to MC pollution occurred in a Brazilian hemodialysis center, killing 76 patients (Azevedo et al., 2002). The aforesaid studies demonstrate the probable health effects of MC exposure in proximity to contaminated water reservoirs.
Biochemical assays and chemical methods are conventional methods of MC detection (Shamsollahi et al., 2014; Massey et al., 2020). Protein phosphatase inhibition assay (PPIA) is a biochemical assay based on phosphatase 1 (PP1) or 2 (PP2) inhibition. PPIA is efficient at conveniently testing multiple samples without extra analyses. The biochemical assay is simple, feasible, and provides toxicological information on animal and human health. Major limitations of PPIA include false positive results, lack of specificity, and matrix effects (Robillot and Hennion, 2004; Massey et al., 2020). High-performance liquid chromatography (HPLC) and liquid chromatography-mass spectrometry (LC-MS) can separate and identify MCs with high specificity and sensitivity. MC analysis via HPLC involves stationary and mobile phases of acetonitrile or methanol. HPLC can confirm MC variants in an unknown sample and generate qualitative and quantitative data on toxins. The method is merited for its accurate detection of intracellular and extracellular MCs. Yet, HPLC demands financial cost, technical expertise, and extensive sample cleanup (Massey et al., 2020). LC-MS is an intricate analytic technique used to detect MC variants in water. MC structure has been detected via LC-MS in other matrices such as blue-green algae dietary supplements and vegetables (Heussner et al., 2012; Parker et al., 2015; Qian et al., 2017). LC-MS detectors are limited by equipment cost, sample processing time, and technical operation (Ortiz et al., 2017; Foss et al., 2019).
Water treatment facilities are recommended to use an enzyme-linked immunosorbent assay (ELISA) to quantify MCs in raw and treated waters (USEPA, 2015). ELISA can track relative changes in MC concentrations and serve as an indicator to control algae blooms (Guo et al., 2005). The immunoassay is valued for producing reliable, repeatable, and variable MC concentration results (Yu et al., 2002; Akter et al., 2017). An indirect competitive ELISA (icELISA) is widely used to screen cyanotoxins in the environment (McElhiney and Lawton, 2005). icELISA is an extension of direct ELISA wherein a secondary antibody conjugate binds a primary antibody to detect MCs. While icELISA cannot differentiate MC variants, it recognizes the Adda (3S-amino-9S-methoxy-2S,6,8S-trimethyl-10-phenyldeca-4E,6E-dienoic acid) moiety on MC for quantitation (Kleintech et al., 2018; Botha et al., 2019). The related NODs have this same feature, which explains why they are grouped together in toxin analyses. icELISA can analyze MC concentrations below World Health Organization's (WHO) drinking water guidance value of 1.0 μg/L (Baralla et al., 2017; Botha et al., 2019; Xu et al., 2020). The ease of operation, inexpensive cost, fast screening capabilities, and sensitivity of icELISA may represent a critical step in evaluating drinking water quality for the public health community.
Toxic HABs constitute a significant problem to surface drinking water supplies and public health (Burns, 2008). Eutrophication driven by nutrient loading of phosphorous and nitrogen can stimulate algae proliferation, resulting in water blooms (Heisler et al., 2008; Yang et al., 2008). Former studies examined influences of anthropogenic nutrient loads of phosphorus and nitrogen on cyanobacterial algal blooms (Smith et al., 2006; Dodds et al., 2009; Paerl et al., 2011; O'Neil et al., 2012). An empirical model also supported phosphorus and nitrogen as critical drivers of cyanobacterial abundance and dominance in lakes (McCarthy et al., 2009). Limited knowledge, however, exists on nitrites with algal bloom development and cyanotoxin production in surface water (Monchamp et al., 2014; Hampel et al., 2020). Nitrites represent key intermediates within the nitrogen cycle as denitrifying bacteria convert nitrate ions to nitrites in water. Nitrites are formed prior to underlying processes including atmospheric evaporation, plant uptake, soil immobilization, and waterway contamination (Xia et al., 2018). Therefore, nitrite analysis might become more common in water quality research since they can contaminate drinking water.
Lake Manatee and Lake Washington are two shallow lakes in Florida and supply drinking water to nearby communities. Both lakes are surrounded by agricultural lands and housing developments and have previously experienced cyanobacterial bloom events. Unfortunately, blooms within these drinking water systems are rarely sighted or reported to local public health authorities. However, few anecdotal reports recount blue-green algae or microcystin toxins in Lake Manatee and Lake Washington, respectively. In 2017, blue-green algae were the culprit of unearthly drinking water in Manatee County, Florida. Despite numerous customer complaints, water treatment officials proclaimed the drinking water was safe for consumption. Two years later, the adjacent Manatee River endured algal blooms scattered along riverbanks as blue and green hues. No reports indicated whether algal blooms diffused into Lake Manatee. Just over two decades ago, surface water in Lake Washington contained MC levels six times acceptable drinking water standards.
Based on limited and sporadic reports of cyanobacterial blooms in the lakes, it seems plausible algal blooms in Lake Manatee and Lake Washington can release toxins into the aquatic environment at variable concentrations. To our knowledge, no case study has been conducted to monitor the occurrence of total MCs and NODs in Lake Manatee and Lake Washington over the potential peak algae bloom season. We employed an icELISA to analyze concentrations of MCs and NODs in environmental water samples from the drinking water systems. Due to eutrophication and cyanobacterial bloom formation in the lakes, nitrites may persist at detectable levels. Cyanobacteria flourish with adequate sunlight and possibly impede the nitrifying process, thereby increasing denitrification in water (Hayden et al., 2014). One study in South Florida revealed a decrease in nitrogen efficiency as cyanobacteria and nitrifiers competed for ammonium and urea (Hampel et al., 2019). Such competition may improve denitrification in the aquatic environment and facilitate removal of nitrogen back into the atmosphere. Additionally, nitrite quantification in water reservoirs with cyanobacterial bloom development remains understudied. Thus, we also measured the presence of nitrites in addition to phosphates in Lake Manatee and Lake Washington to assess their relationship with total MCs and NODs during the sampling period.
Materials and Methods
Geomorphological Features of Central Florida Lakes
The Florida penisula is characterized by distinct geological and morpholophical features, which provide context into the formation of Central Florida lakes. Most of Florida is flat and lacks prominent features seen in other parts of the United States. In Central Florida, physical features are quite varied and include coastal marshes, highlands, lowlands, ridges, and upland plains. Central Florida is comprised of two major physiographic regions: (1) the Central Highlands and (2) the Coastal Lowlands. The Central Highlands sits approximately 40 to 325 feet above sea level whereas the Coastal Lowlands form the eastern coastline of Florida and lie below 100 feet. Central Florida is mainly composed of limestone and domolite, which are readily dissolved by rainwater seeping into the subsurface environment. This solution process is considered the most common origin of Floridian lakes (Schiffer, 1998).
Study Locations
Lake Washington, located in Brevard County, Florida, (28.1468° N, −80.7464° W, Figure 1) has a surface area of 17.65 km2 and a surface elevation of 4.9 m. Lake Washington, part of the St. John's River, is the most critical drinking water source in Melbourne. The Melbourne Water Treatment Plant is located on Lake Washington's eastern side (28.1468 ° N, −80.7330 ° W, Figure 1, left).

Figure 1. Lake Washington (left) and Lake Manatee (right). Site numbers of environmental samples in Lake Washington and Lake Manatee:  = Sites 1–5;
  = 6–10;
  = Sites 11–15;
  = Water treatment plants. Distance of scale bars are expressed in miles.
Lake Manatee, located in Manatee County, Florida (27.4947° N, −82.3479° W, Figure 1), has a surface area of 4.75 km2 and a maximum depth of 3.4 m. Lake Manatee is an artificial reservoir and a major water source for Bradenton and nearby municipalities in Manatee County. The Lake Manatee Water Treatment Plant is located on the western side of Lake Manatee (27.4896° N, −82.3579° W, Figure 1, right).
Sample Collection
A total of 60 environmental water samples were collected across 15 sites in Lake Manatee and Lake Washington between June 22 and August 31, 2019, to assess the occurrence of total MCs and NODs. During every sampling occasion, which occurred monthly, four samples were gathered from each of five sites. Site clusters appeared on days when adverse weather conditions persisted (Lake Washington) or restricted areas prevented usage of water vehicles (Lake Manatee). Sampling occurred nearshore or closest to water treatment plants on such occasions. Time of collection and field observations were recorded at every sampling site for all sampling occasions (Supplementary Table 1). Pre-rinsed 4 fl oz (118.294 mL) glass amber bottles stored lake water for analysis. Pre-rinsed bottles involved submergence within the upper 12 inches of the water column. Contents emptied downstream and re-immersed 6–12 inches below the surface water to obtain a sample volume of 100 mL. Samples were stored in labeled bags and transported on ice to Eastern Florida State College (Melbourne, FL). Samples were refrigerated at 4°C up to 5 days.
Sample Extraction
After each sampling occasion, 1 mL aliquots from 20 environmental water samples were prepared in glass vials to extract total MCs and NODs. The Abraxis QuikLyse System TM rapidly lysed cyanobacterial cells in samples for enumeration of dissolved, or free, plus bound MCs before ELISA testing. A volume of 100 μL QuikLyse TM Reagent A was added to samples, capped, inverted for 2 min, and incubated at room temperature for 8 min. The same process was repeated for QuikLyse TM Reagent B, except a volume of 10 μL was dispensed into samples.
Microcystin and Nodularin Analysis
The congener-independent detection of intracellular and extracellular MCs and NODs was determined by Abraxis Microcystins/Nodularins (ADDA) ELISA kit (Microtiter Plate) PN 520011 (Warminster, PA). The limit of detection for the assay, based on MC-LR, was 0.10 μg/L. Standards (0, 0.15, 0.40, 1.0, 2.0, 5.0 μg/L), quality control (0.75 ± 0.185 μg/L), and samples in volumes of 50 μL were pipetted in duplicate into a 96-well plate (Hercules, CA). Antibody solution (50 μL) was added to individual wells, covered, and mixed for 30 s on lab bench. The ELISA plate incubated for 90 min at room temperature and washed three times with 250 μL wash buffer. Enzyme conjugate solution (100 μL) was added to individual wells, covered, and mixed for 30 s on lab bench. The ELISA plate incubated for another 30 min at room temperature and washed three more times with wash buffer. Substrate solution (100 μL) was added to individual wells, covered, and mixed for 30 s on lab bench. The final incubation time ran for 20 min in the dark. The reaction was halted by 50 μL of stop solution. A Bio-Rad Model 550 microplate reader was used to analyze total MCs and NODs at 450 nm within 15 min of terminating reactions. The mean absorbance value for each standard was divided by standard zero to calculate B/B0%. Abraxis standard concentrations on the horizontal logarithmic axis plotted against B/B0% standards on the vertical linear axis generated standard curves for total MCs and NODs determination. Concentrations of total MCs and NODs were reported in μg/L.
Nutrient Measurement
Colorimetric assays (Phosphate Assay Kit ab65622 and Griess Reagent Kit ab234044) measured phosphates and nitrites in environmental water samples, respectively. Abcam (Cambridge, MA) supplied reagents and standards for use in colorimetric assays. The colorimetric assays were optimized for nutrient measurement in biological samples, including algal blooms. They assessed concentrations between 0.001 and 1 mM and between 0.1 and 1 mM, respectively. A fresh set of standards were prepared for every use. Reaction components increased 5X in 1 mL cuvettes for duplicate standard and sample readings in a Spectronic 200 spectrophotometer. Phosphate (650 nm) and nitrite (540 nm) measurements occurred under ambient temperature. Averaged duplicate readings of standards and samples subtracted from standard 0 resulted in corrected absorbances. Corrected absorbances plotted against standard concentrations generated standard curves for nitrite and phosphate. Phosphate or nitrite concentration (mM) in samples was determined by dividing phosphate or nitrite (nmol/sample) from standard curve by sample volume (mL) in a 1 mL cuvette. Final concentrations were converted and reported in mg/L.
Statistical Analysis
Concentrations of cyanotoxins (total MCs and NODs) in Lake Manatee and Lake Washington were entered in Microsoft Excel and categorized by month (June–July) and sample site (1–15). Box-and-whisker plots graphically illustrated variations in total MCs and NODs in the lakes. Bar graphs displayed the concentration of nutrients (nitrites and phosphates) of environmental water samples. Statistical analyses were conducted in Statistical Package for the Social Science (SPSS) Version 25. Descriptive statistics including sample size, minimum, maximum, mean, and standard deviation were calculated for cyanotoxins and nutrients. The Kruskal-Wallis H test examined whether total MCs and NODs concentrations differed by sampling month in Lake Manatee and Lake Washington. Pairwise comparisons were also made between sampling sites and toxin concentrations. Bar graphs depicted frequency of phosphate and nitrite concentrations in the lakes. Toxin and nutrients data were ranked from lowest to highest concentrations for correlation tests. Two-tailed Spearman rank correlations measured the strength and direction of associations between nutrients and cyanotoxins. Two toxin samples were excluded from analyses due to concentrations below the limit of detection (< 0.10 μg/L). For nutrients, 11 samples (nitrite) returned non-detectable concentrations (<0.01 mg/L).
Results
Enzyme-Linked Immunosorbent Assay Calibration
A calibration curve was prepared for every ELISA plate. Each calibration curve displayed a linear relationship between Abraxis standard concentrations (0–5.0 μg/L) and B/B0%. A quality control standard (0.75 ± 0.185 μg/L) was used in each standard curve to validate quantitation of total MCs and NODs in environmental water samples. Sample runs produced consistent R2 values, which ranged from 0.9797 to 0.9964. The average R2 statistic for Lake Manatee and Lake Washington was 0.9929 and 0.9872, respectively. The overall average R2 statistic for ELISA curves was 0.9901.
Bloom Samples
Blooms samples were defined as environmental water samples with visible algal scum or discolored water. Bloom material was observed in 21.18% (25/118) of samples. The prevalence of bloom samples in Lake Manatee was 8.47% (5/59). A small algae bloom was sighted on June 22, 2019, in a small cove on the north side of Lake Manatee. All Lake Manatee bloom samples originated from Site 3. The prevalence of bloom samples in Lake Washington was 33.89% (20/59). Lake Washington endured an algae bloom in July 2019, where discolored water was collected from Sites 6–10.
Microcystin and Nodularin Occurrence
Supplementary Table 2 summarizes concentrations of total MCs and NODs in Lake Manatee and Lake Washington between June and August 2019. Reported total MCs and NODs (μg/L) included the sum of intracellular and extracellular toxins in environmental water samples. From the 120 samples, 118 (98.36%) contained detectable toxin levels. Two samples, one from each lake, had non-detectable toxin levels (< 0.10 μg/L). A total of 42 (35%) samples returned total MCs and NODs above 0.20 μg/L. The mean concentration of total MCs and NODs in the lakes was 0.19 μg/L (σ = 0.05). Toxin levels were highest in August compared to June and July. No sample from either lake exceeded the recommended WHO drinking water guidance value of 1.0 μg/L. All samples were categorized as low (< 0.10 to ≤ 10 μg/L) in terms of the WHO relative probable health risk.
Over the sampling period, total MCs and NOD concentrations ranged from 0.11 to 0.47 μg/L in Lake Manatee (Figure 2). The sample with a maximum toxin concentration of 0.47 μg/L was collected from a recreational site (Figure 1, right, Site 15). Pairwise comparisons indicated a statistically significant difference in toxin concentrations between Site 15 and Sites 6 and 8 (Table 1). The mean concentration of total MCs and NODs in Lake Manatee was 0.19 μg/L (σ = 0.07). A Kruskal-Wallis H Test indicated a statistically significant difference between sampling month and total MCs and NODs in Lake Manatee, H(2) = 20.5, p = < 0.001 (Table 2). In Lake Washington, total MC and NOD concentrations ranged from 0.11 to 0.31 μg/L (Figure 3). The sample with a maximum toxin concentration of 0.31 μg/L was collected from a boat ramp (Figure 1, left, Site 14). Pairwise comparisons indicated a statistically significant difference in toxin concentrations between Site 15 and Sites 8 and 9 (Table 1). The mean concentration of total MCs and NODs in Lake Washington was 0.19 μg/L (σ = 0.05). Another Kruskal-Wallis H Test indicated a statistically significant difference between sampling month and total MCs and NODs in Lake Washington, H(2) = 28.7, p = <0.001 (Table 2).
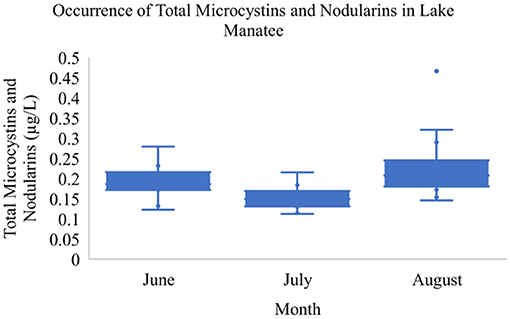
Figure 2. Occurrence of total microcystins and nodularins in Lake Manatee.
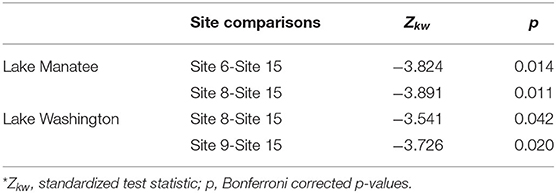
Table 1. Pairwise comparisons of sampling sites and toxin concentrations.
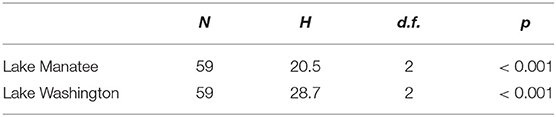
Table 2. Summary of independent-samples kruskal-wallis H tests.
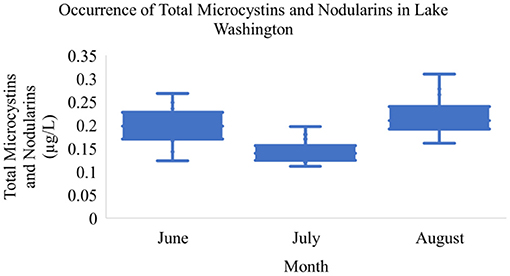
Figure 3. Occurrence of total microcystins and nodularins in Lake Washington.
Measurement and Frequency of Nitrite and Phosphate Concentration
Of the 120 environmental samples collected from Lake Manatee and Lake Washington, 60 samples (50%) were analyzed for nitrites and phosphates (Supplementary Table 3). Nitrite concentrations occurred in 49 (81.66%) samples and ranged from 0.005 to 0.845 mg/L. In Lake Manatee, nitrite concentrations largely measured at 0.13 or 0.29 mg/L (Figure 4). Nitrite concentrations in Lake Washington varied considerably, with three samples having a concentration of 0.19 mg/L (Figure 5). Phosphate concentrations occurred in 60 (100%) and ranged from 0.12 to 0.58 mg/L. Most samples had a concentration of 0.19 mg/L, with two samples attaining a maximum concentration of 0.52 mg/L (Figure 6).
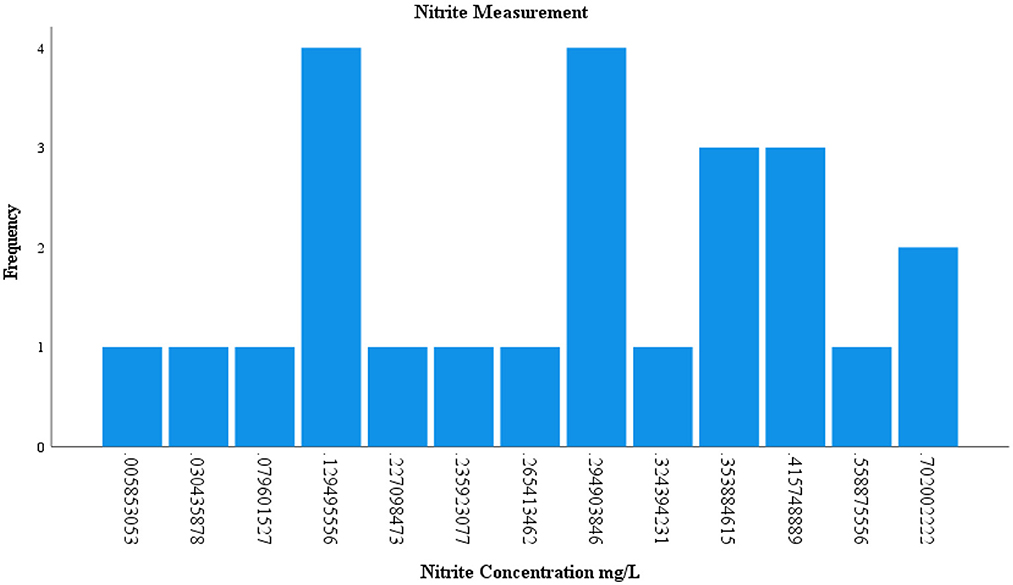
Figure 4. Measurement of nitrite in Lake Manatee.
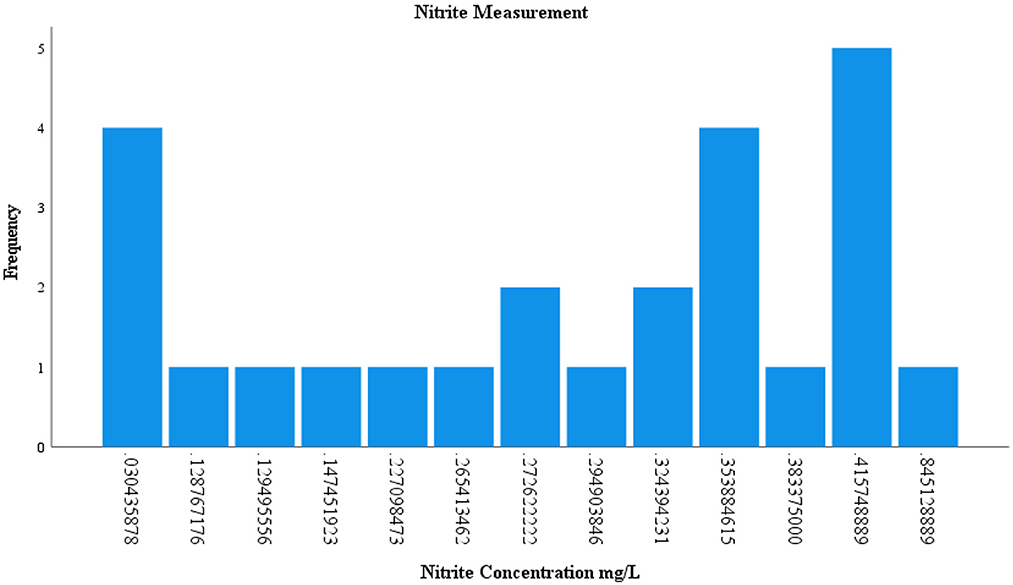
Figure 5. Measurement of nitrite in Lake Washington.
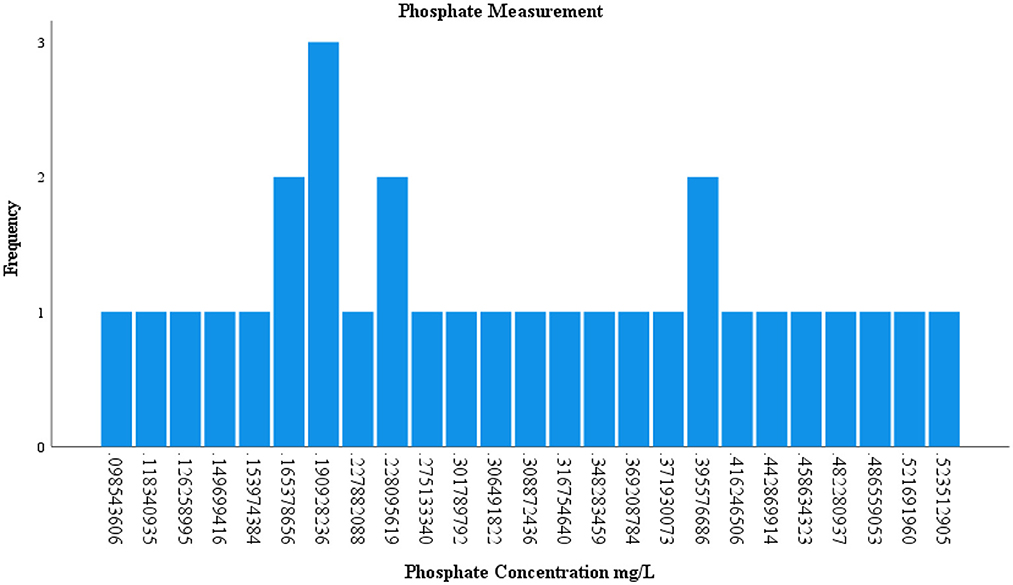
Figure 6. Measurement of phosphate in Lake Manatee and Lake Washington.
Associations Between Nutrients and Cyanotoxins
Associations between nutrient and cyanotoxin concentrations in Lake Manatee and Lake Washington were measured by two-tailed Spearman rank correlations. Correlation results indicated no significant relationships between total MCS and NODs and nutrients in the drinking water systems (p > 0.05). Correlation coefficients were similar for associations between nutrients and total MCs and NODs in Lake Manatee and Lake Washington (Table 3).
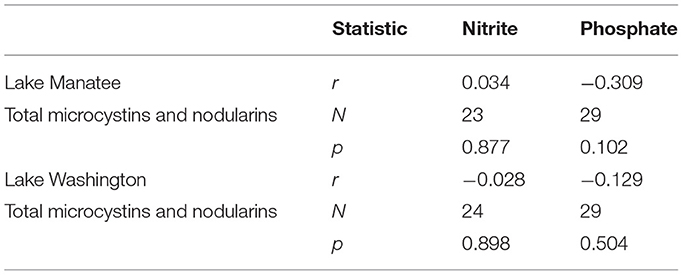
Table 3. Correlation coefficients for nutrients and total microcystins and nodularins.
Discussion
HABs are pervasive incidents of vast microbial populations in surface waters and vary in distribution, magnitude, and severity worldwide (Anderson, 2014; Backer et al., 2015). Some HABs can release toxic secondary metabolites into the aquatic environment, presenting hazards to local ecology, wildlife, and human health (Cheung et al., 2013; Watson et al., 2015; Carmichael and Boyer, 2016). For instance, cyanobacterial HABs are becoming more prevalent in water reservoirs and may comprise potentially toxigenic species capable of releasing cyanotoxins. The MCs represent the largest class of cyanotoxins, which share chemical and toxicological properties with NODs. These monocyclic peptides inhibit PP1 and PP2 in hepatocytes of vertebrates with different affinities, classifying them as hepatotoxins (Martins and Vasconcelos, 2009). Research has identified both toxins as potential carcinogens and tumor promoters (Humpage, 2008). While cyanotoxins typically persist at low concentrations in water, detection of such compounds is a priority for preserving drinking water quality and minimizing human exposure.
There is no recommended guidance value for cyanotoxins in Florida's drinking water albeit the number of cyanobacterial bloom episodes annually. Additionally, community water treatment plants do not perform routine analyses on cyanotoxins to ensure drinking water quality. Water treatment officials may send a sample or two of raw water from the source of intake to an independent lab with cyanotoxin expertise to ascertain toxin measurements. However, limited data on few samples provides little to no information about the potential health risks of cyanotoxins. Thus, a rapid and sensitive method is needed to screen multiple samples of toxins in community lakes. We implemented an icELISA to monitor the occurrence of total MCs and NODs in Lake Manatee and Lake Washington over the potential peak algae bloom season.
Historically, cyanotoxins may have occurred in the lakes although never analyzed for biomonitoring practices. Toxin data on MCs and NODs are scarce or not readily accessible, making it difficult to understand the persistence and behavior of cyanotoxins in bloom-forming lakes. The results of our case study revealed detectable toxin concentrations in Lake Manatee and Lake Washington. The average concentration of total MCs and NODs between the lakes was 0.19 μg/L, indicative of a low probable health risk. This does not mean communities are safeguarded from cyanotoxins but may experience a low level of exposure over time.
Also, sampling month had significantly influenced toxin concentrations during the study. In each lake, concentrations of total MCs and NODs remained higher in June than in July and increased from July to August. Environmental conditions may have been relatively conducive for cyanotoxin production in June and became very promising in August. Phosphorus and nitrogen are major nutrient drivers of cyanobacterial blooms (Heisler et al., 2008; Yang et al., 2008) and have been associated with MC production in water reservoirs (Oh et al., 2001). We measured the presence of nitrites and phosphates in environmental water samples and related their levels with total MC and NOD concentrations. Nitrites represent a minoritarian form of nitrogen and have not been well-studied relative to algal bloom development (Monchamp et al., 2014). No significant associations occurred between nutrient and cyanotoxin concentrations in each lake, suggesting nutrient availability alone may not directly influence total MCs and NODs during the sampling period. The observed associations differed from multiple studies on nutrients and cyanobacterial growth (Smith et al., 2006; Dodds et al., 2009; Paerl et al., 2011; O'Neil et al., 2012). Total phosphorus demonstrated a weak relationship with MC concentrations in the Harris Chain of Lakes in Florida (Bigham et al., 2009), which is consistent with the weak relationship observed between phosphate and total MCs and NODs in Lake Manatee and Lake Washington.
Our study results differed from other research identifying MCs in water reservoirs. Cyanotoxins detected in water sources of Haimen and Fusui, China remained generally low (0.062–0.292 μg/L) over the sampling period (Ueno et al., 1996). Detectable toxin concentrations in Lake Manatee and Lake Washington ranged from 0.11 to 0.46 μg/L. A Brazilian water treatment contained MC concentrations of 1.5, 2.1, and 0.60 μg/L between June and August (Oliveira et al., 2019). Such concentrations exceeded the maximum concentrations within the Floridian drinking water systems. Perhaps climatic factors and geography contributed to elevated toxins in Brazil. In 2007, annual cyanotoxin production was measured in recreational sites of the St. John's River, including Lake Washington (Williams et al., 2007). Yet, individual data on MCs or NODs in Lake Washington were not published within the study. Two years later, low MC concentrations occurred in 187 Florida lakes, with 7% of samples exceeding the WHO's drinking water guidance value of 1.0 μg/L (Bigham et al., 2009). We did not detect a concentration greater than 1.0 μg/L which alludes to some important factors. Toxins concentrations in lakes are variable and change in response to weather events and resultant water quality conditions. Differences in toxin concentrations of the lakes may have been attributed to sampling locations (open water vs. shoreline, bloom vs. near bloom) and sampling method (depth, repeated samples, sample volume). We confirmed detectable cyanotoxins within two drinking water systems in Florida that may pose a health risk from low level exposure through the oral route.
Limitations
Several limitations were inherent within the case study. Foremost, we utilized an immunoassay (icELISA) for the detection of cyanotoxins in lake water samples. Though icELISA is practical for variable measurements of many samples in a single run, the assay is limited by cross-reactivity. In other words, false positives can result from antibodies targeting other antigenic substances within the sample matrix. Another limitation of ELISA is the inability to differentiate specific congeners of toxins. More sophisticated methods, such as HPLC and LC-MS, are required to identify the most common variants and their associated concentrations. This suggests that other cyanotoxins (cylindrospermopsins, anatoxins, saxitoxins) were present in the lakes. Additionally, this study was limited by the sole measurement of a minoritarian nitrogen component, nitrite. Oftentimes, nitrate and ammonia are measured, but we opted to quantify nitrite due to its understudied nature and role in cyanobacterial blooms and drinking water quality. Lastly, temporal dynamics of cyanotoxins and nutrients were not evaluated as the study was short in duration. This was a case study of two important drinking water systems in Florida to raise awareness on cyanotoxins and human health. Study results may prompt future research in water reservoirs throughout Florida.
Future Directions and Conclusions
MCs and NODs are cyanotoxins produced by cyanobacteria in fresh and brackish waters. Cyanobacterial HAB development in surface water presents hazardous risks to ecological and human health. The current study explored the occurrence of total MCs and NODs in two Floridian drinking water systems during the potential peak algae bloom season. The study results may extend upon biomonitoring studies on cyanotoxins by providing a benchmark for total MCs and NODs in community drinking water systems. Future studies can regularly test for MCs and NODs on a broader scale to evaluate their occurrence in surface drinking water supplies. Longitudinal studies can offer valuable information on cyanobacterial abundance, dynamics, and toxicity. More field studies of the lakes may pinpoint the major environmental influences of cyanobacterial bloom formation and cyanotoxin production. Consistent and routine biomonitoring efforts of Florida lakes can maintain quality drinking water and prevent human exposure.
Data Availability Statement
The original contributions presented in the study are included in the article/Supplementary Materials, further inquiries can be directed to the corresponding author.
Author Contributions
RM wrote and edited most of the manuscript. BL-D assisted in methodology and creation of figures and tables. Both authors contributed to the article and approved the submitted version.
Conflict of Interest
The authors declare that the research was conducted in the absence of any commercial or financial relationships that could be construed as a potential conflict of interest.
Publisher's Note
All claims expressed in this article are solely those of the authors and do not necessarily represent those of their affiliated organizations, or those of the publisher, the editors and the reviewers. Any product that may be evaluated in this article, or claim that may be made by its manufacturer, is not guaranteed or endorsed by the publisher.
Acknowledgments
We thank Eastern Florida State College for allowing us to conduct toxin analyses in a laboratory setting.
Correction note
A correction has been made to this article. Details can be found at: 10.3389/frwa.2025.1653373.
Supplementary Material
The Supplementary Material for this article can be found online at: https://www.frontiersin.org/articles/10.3389/frwa.2022.899572/full#supplementary-material
References
Akter, S., Vehniainen, M., Meriluoto, J., Spoof, L., and Lamminmaki, U. (2017). Non-competitive ELISA with broad specificity for microcystins and nodularins. Adv. Oceangr. Limnol. 8, 121–130. doi: 10.4081/aiol.2017.6349
Anderson, D. (2014). HABs in a changing world: a perspective on harmful algal blooms, their impacts, and research and management in a dynamic era of climatic and environmental change. Harmful Algae 2012. 3–17.
Azevedo, S. M., Carmichael, W. W., Jochimsen, E. M., Rinehart, K. L., Lau, S., Shaw, G. R., et al. (2002). Human intoxication by microcystins during renal dialysis treatment in Caruaru-Brazil. Toxicology 181–182. 441-446. doi: 10.1016/S0300-483X(02)00491-2
Backer, L. C., Landsberg, J. H., Miller, M., Keel, K., and Taylor, T. K. (2013). Canine cyanotoxin poisonings in the United States (1920s-2012): review of suspected and confirmed cases from three data sources. Toxins 5, 1597–1628. doi: 10.3390/toxins5091597
Backer, L. C., Manassaram-Baptiste, D., LePrell, R., and Bolton, B. (2015). Cyanobacteria and algae blooms: review of health and environmental data from the harmful algal-bloom related surveillance system (HABISS) 2007-2011. Toxins 7, 1048–1064. doi: 10.3390/toxins7041048
Baralla, E., Varoni, M., Sedda, T., Pasciu, V., Floris, A., and Demontis, M. (2017). Microcystins presence in mussels (M. galloprovincialis) and water of two productive Mediterranean's lagoons (Sardina, Italy). Biomed. Res. Int. 2017, 769245. doi: 10.1155/2017/3769245
Bigham, D. L., Hoyer, M. V., and Canfield, D. E. (2009). Survey of toxic algal (microcystin) distribution in Florida lakes. Lake Reservoir. Manag. 25, 264–275. doi: 10.1080/07438140903136555
Botha, C. J., Laver, P. N., Singo, A., Venter, E. A., Ferreira, G. C. H., Rosemann, M., et al. (2019). Evaluation of a Norwegian-developed ELISA to determine microcystin concentrations in fresh water. Wat. Sci. Technol. Wat. Suppl 0. 19, 743–752. doi: 10.2166/ws.2018.118
Buratti, F. M., Manganelli, M., Vichi, S., Stefanelli, M., Scardala, S., Testai, E., et al. (2017). Cyanotoxins: producing organisms, occurrence, toxicity, mechanism of action and human health toxicological risk evaluation. Arch. Toxicol. 91, 1049–1130. doi: 10.1007/s00204-016-1913-6
Burns, J. (2008). Toxic cyanobacteria in Florida waters. Adv. Exp. Med. Biol. 619, 127–137. doi: 10.1007/978-0-387-75865-7_5
Campos, A., and Vasconcelos, V. (2010). Molecular mechanisms of microcystin toxicity in animal cells. Int. J. Mol. Sci. 11, 268–287. doi: 10.3390/ijms11010268
Carmichael, W. W. (1992). Cyanobacteria secondary metabolites – the cyanotoxins. J. Appl. Microbiol. 72, 445–459. doi: 10.1111/j.1365-2672.1992.tb01858.x
Carmichael, W. W., and Boyer, G. L. (2016). Health impacts from cyanobacteria harmful algae blooms: implications for the North American Great Lakes. Harmful Algae 54, 194–212. doi: 10.1016/j.hal.2016.02.002
Cheung, M. Y., Liang, S., and Anderson Lee, J. (2013). Toxin-producing cyanobacteria in freshwater: a review of the problems, impact on drinking water safety, and efforts for protecting public health. J. Microbiol. 51, 1–10. doi: 10.1007/s12275-013-2549-3
Codd, G. A., Morrison, L. F., and Metcalf, J. S. (2005). Cyanobacterial toxins: risk management for health protection. Toxicol. Appl. Pharmacol. 203, 264–272. doi: 10.1016/j.taap.2004.02.016
Dodds, W. K., Bouska, W. W., Eitzmann, J. L., Pilger, T. J., Pitts, K. L., Riley, A. J., et al. (2009). Eutrophication of U.S. freshwaters: analysis of potential economic damages. Environ. Sci. Technol. 43, 12–19. doi: 10.1021/es801217q
Drobac, D., Tokodi, N., Simeunović, J., Baltić, V., Stanić, D., and Svirčev, Z. (2013). Human exposure to cyanotoxins and their effects on health. Arh. Hig. Rada Toksikol. 64, 119–130. doi: 10.2478/10004-1254-64-2013-2320
Eriksson, J. E., Grönberg, L., Nygård, S., Slotte, P., and Meriluoto, J. A. O. (1990). Hepatocellular uptake of 3H-dihydromicrocystin-LR, a cyclic peptide toxin. Biochim. Biophys. Acta 60–66. doi: 10.1016/0005-2736(90)90190-Y
Fawell, J. K., Mitchell, R. E., Everett, D. J., and Hill, R. E. (1999). The toxicity of cyanobacterial toxins in the mouse: i microcystin-LR. Hum. Exp. Toxicol. 18, 162–167. doi: 10.1177/096032719901800305
Foss, A. J., Aubel, M. T., Gallagher, B., Mettee, N., Miller, A., and Fogelson, S. B. (2019). Diagnosing microcystin intoxication of canines: clinicopathological indications, pathological characteristics, and analytical detection in postmortem and antemortem samples. Toxins 11, 456. doi: 10.3390/toxins11080456
Funari, E., and Testai, E. (2008). Human health risk assessment related to cyanotoxins exposure. Crit. Rev. Toxicol. 38, 97–125. doi: 10.1080/10408440701749454
Guo, Y. C., Lee, A. K., Yates, R. S., Liang, S., and Rochelle, P. A. (2005). Analysis of microcystins in drinking water by ELISA and LC/MS/MS. J. Am. Water Works Assoc. 109, 13–25. doi: 10.5942/jawwa.2017.109.0027
Hampel, J. J., McCarthy, M. J., Aalto, S. L., and Newell, S. E. (2020). Hurricane disturbance stimulated nitrification and altered ammonia oxidizer community structure in Lake Okeechobee and St. Lucie Estuary (Florida). Front. Microbiol. 11, 1541. doi: 10.3389/fmicb.2020.01541
Hampel, J. J., McCarthy, M. J., Reed, M. H., and Newell, S. E. (2019). Short term effects of Hurricane Irma and cyanobacterial blooms on ammonium cycling along a freshwater–estuarine continuum in south Florida. Front. Mar. Sci. 6, 640. doi: 10.3389/fmars.2019.00640
Hayden, C. J., and Beman, J. M. H.i. (2014). abundances of potentially active ammonia-oxidizing bacteria and archaea in oligotrophic, high-altitude lakes of the Sierra Nevada, California, USA. PLoS ONE 9, e111560. doi: 10.1371/journal.pone.0111560
Heinze, R. (1999). Toxicity of the cyanobacterial toxin microcystin-LR to rats after 28 days intake with the drinking water. Environ Toxicol 14, 57–60. doi: 10.1002/(SICI)1522-7278(199902)14:1<57::AID-TOX9>;3.0.CO;2-J
Heisler, J., Glibert, P., Burkholder, J., Anderson, D., Cochlan, W., Dennison, W., et al. (2008). Eutrophication and harmful algal blooms: a scientific consensus. Harmful Algae 8, 3–13. doi: 10.1016/j.hal.2008.08.006
Heussner, A. H., Mazija, L., Fastner, J., and Dietrich, D. R. (2012). Toxin content and cytotoxicity of algal dietary supplements. Toxicol. Appl. Pharmacol. 265, 263–271. doi: 10.1016/j.taap.2012.10.005
Humpage, A. (2008). “Toxin types, toxiconkinetics and toxicodynamics,” in Cyanobacterial Harmful Algal Blooms: State of the Science and Research Needs (New York, NY: Hudnell, S, Springer), 383–415.
Kimambo, O. N., Gumbo, J., and Chikoore, H. (2019). The occurrence of cyanobacteria blooms in freshwater ecosystems and their link with hydro-meteorological and environmental variations in Tanzania. Heliyon 5, e01312. doi: 10.1016/j.heliyon.2019.e01312
Kleintech, J., Puddick, J., Wood, S. A., Hildebrand, F., Laughinghouse, I. V., Pearce, H. D., et al. (2018). cyanobacteria in Svaldbard: chemical diversity of microcystins detected using a liquid chromatography mass spectrometry precursor ion screening method. Toxins 10, 147. doi: 10.3390/toxins10040147
Kubickova, B., Babica, P., Hilscherova, K., and Šindlerová, L. (2019). Effects of cyanobacterial toxins on the human gastrointestinal tract and the mucosal innate system. Environ. Sci. Eur. 31, 31. doi: 10.1186/s12302-019-0212-2
Lawton, L. A., and Robertson, P. K. (1999). Physico-chemical treatment methods for the removal of microcystins (cyanobacterial hepatotoxins) from potable waters. Chem. Soc. Rev. 28, 217–224. doi: 10.1039/a805416i
Levallois, P., and Villanueva, C. M. D. (2019). water quality and human health: an editorial. Int. J. Environ. Res. Pub. Health 16, 631. doi: 10.3390/ijerph16040631
Lévesque, B., Gervais, M. C., Chevalier, P., Gauvin, D., Anassour-Laouan-Sidi, E., Gingras, S., et al. (2014). Prospective study of acute health effects in relation to exposure to cyanobacteria. Sci. Total Environ, 466–467. 397-403. doi: 10.1016/j.scitotenv.2013.07.045
Lone, Y., Koiri, R. K., and Bhide, M. (2015). An overview of the toxic effect of potential human carcinogen microcystin-LR on testis. Toxicol. Rep. 2, 289–296. doi: 10.1016/j.toxrep.2015.01.008
Martins, J., and Vasconcelos, V. (2009). Microcystin dynamics in aquatic organisms. J. Toxicol. Environ. Health 12, 65–82. doi: 10.1080/10937400802545151
Massey, I. Y., Wu, P., Wei, J., Luo, J., Ding, P., Wei, H., et al. (2020). A mini-review on detection methods of microcystins. Toxins 12, 641. doi: 10.3390/toxins12100641
McCarthy, M. J., James, R. T., Chen, Y., East, T. L., and Gardner, W. S. (2009). Nutrient ratios and phytoplankton community structure in the large, shallow, eutrophic, subtropical Lakes Okeechobee (Florida, USA) and Taihu (China). Limnol 10, 215–227. doi: 10.1007/s10201-009-0277-5
McElhiney, J., and Lawton, L. A. (2005). Detection of the cyanobacterial hepatotoxins microcystins. Toxicol. Appl. Pharmacol. 203, 219–230. doi: 10.1016/j.taap.2004.06.002
Mez, K., Beattie, K. A., Codd, G. A., Hanselmann, K., Hauser, B., Naegeli, H., et al. (1997). Identification of a microcystin in benthic cyanobacteria linked to cattle deaths on alpine pastures in Switzerland. J. Phycol. 32, 111–117. doi: 10.1080/09670269710001737029
Monchamp, M. E., Pick, F. R., Beisner, B. E., and Maranger, R. (2014). Nitrogen forms influence microcystin concentration and composition via changes in cyanobacterial community structure. PLoS ONE 9, e85573. doi: 10.1371/journal.pone.0085573
Oh, H. M., Lee, S. J., Kim, J. H., Kim, H. S., and Yoon, B. D. (2001). Seasonal variation and indirect monitoring of microcystin concentrations in Daechung reservoir, Korea. Appl. Environ. Microbiol. 67, 1484–1489. doi: 10.1128/AEM.67.4.1484-1489.2001
Oliveira, E. D. C., Castelo-Branco, R., Silva, L., Silva, N., Azevedo, J., Vasconcelos, V., et al. (2019). First detection of microcystin-LR in the Amazon River at the drinking water treatment plant of the municipality of Macapá, Brazil. Toxins 11, 669. doi: 10.3390/toxins11110669
O'Neil, J. M., Davis, T. W., Burford, M. A., and Gobler, C. J. (2012). The rise of harmful cyanobacteria blooms: The potential roles of eutrophication and climate change. Harmful Algae 14, 313–334. doi: 10.1016/j.hal.2011.10.027
Ortiz, X., Korenkova, E., Jobst, K. J., MacPherson, K. A., and Reiner, E. J. (2017). A high throughput targeted and non-targeted method for the analysis of microcystins and anatoxin-A using on-line solid phase extraction coupled to liquid chromatography-quadrupole time-of-flight high resolution mass spectrometry. Anal. Bioanal. Chem. 409, 4959–4969. doi: 10.1007/s00216-017-0437-0
Paerl, H. W., Hall, N. S., and Calandrino, E. S. (2011). Controlling harmful cyanobacterial blooms in a world experiencing anthropogenic and climatic-induced change. Sci. Total Environ. 409, 1739–1745. doi: 10.1016/j.scitotenv.2011.02.001
Parker, C. H., Stutts, W. L., and DeGrasse, S. L. (2015). Development and validation of a liquid chromatography-tandem mass spectrometry method for the quantitation of microcystins in blue-green algal dietary supplements. J. Agric. Food Chem. 63, 10303–10312. doi: 10.1021/acs.jafc.5b04292
Ploug,. H. (2008). Cyanobacterial surface blooms formed by Aphanizomenon sp. and Nodularia spumigena in the Baltic Sea: small-scale fluxes, pH, and oxygen microenvironments. Limnol. Oceanogr. 53, 914–921. doi: 10.4319/lo.2008.53.3.0914
Qian, Z. Y., Li, Z. G., Ma, J., Gong, T. T., and Xian, Q. M. (2017). Analysis of trace microcystins in vegetables using matrix solid-phase dispersion followed by high performance liquid chromatography triple quadrupole mass spectrometry detection. Talanta 173, 101–106. doi: 10.1016/j.talanta.2017.05.079
Robillot, C., and Hennion, M. C. (2004). Issues arising when interpreting the results of the protein phosphatase 2A inhibition assay for the monitoring of microcystins. Anal. Chim. Acta 512, 339–346. doi: 10.1016/j.aca.2004.03.004
Sakai, H., Hao, A., Iseri, Y., Wang, S., Kuba, T., Zhang, Z., et al. (2013). Occurrence and distribution of microcystins in Lake Taihu, China. Sci. World J. 2013, 838176. doi: 10.1155/2013/838176
Schiffer, D. M. (1998). Hydrology of Central Florida Lakes: A Primer. Washington, DC: U.S. Geological Survey.
Schmale, D. G., Ault, A. P., Saad, W., Scott, D. T., and Westrick, J. A. (2019). Perspectives on harmful algal blooms (HABs) and the cybersecurity of freshwater systems. Front. Bioeng. Biotechnol. 7, 128. doi: 10.3389/fbioe.2019.00128
Sedan, D., Laguens, M., Copparoni, G., Aranda, J. O., Giannuzzi, L., Marra, C. A., et al. (2015). Hepatic and intestine alterations in mice after prolonged exposure to low oral doses of microcystin-LR. Toxicon 104, 26–33. doi: 10.1016/j.toxicon.2015.07.011
Shamsollahi, H. R., Alimohammadi, M., Nabizadeh, R., Nazmara, S., and Mahvi, A. H. (2014). Measurement of microcystin-LR in water samples using improved HPLC method. Glob. J. Health Sci. 7, 66–70. doi: 10.5539/gjhs.v7n2p66
Smith, V. H., Joye, S. B., and Howarth, R. H. (2006). Eutrophication of freshwater and marine ecosystems. Limnol. Oceanogr. 51, 351–355. doi: 10.4319/lo.2006.51.1_part_2.0351
Stewart, I., Eaglesham, G. K., McGregor, G. B., Chong, R., Seawright, A. A., Wickramasinghe, W. A., et al. (2012). First report of a toxic Nodularia spumigena (Nostocales/Cyanobacteria) bloom in sub-tropical Australia. II. Bioaccumulation of nodularin in isolated populations of mullet (Mugilidae). Int. J. Environ. Res. Public Health 9, 2412–2443. doi: 10.3390/ijerph9072412
Stewart, I., Webb, P. M., Schluter, P. J., and Shaw, G. R. (2006). Recreational and occupational field exposure to freshwater cyanobacteria – a review of anecdotal and case reports, epidemiological studies and challenges for epidemiological assessment. Environ. Health 5, 6. doi: 10.1186/1476-069X-5-6
Szlag, D. C., Sinclair, J. L., Southwell, B., and Westrick, J. A. (2015). Cyanobacteria and cyanotoxins occurrence and removal from five-high-risk conventional treatment drinking water plants. Toxins 7, 2198–2220. doi: 10.3390/toxins7062198
Turner, A. D., Dhanji-Rapkova, M., O'Neill, A., Coates, L., Lewis, A., and Lewis, K. (2018). Analysis of microcystins in cyanobacterial blooms from freshwater bodies in England. Toxins 10, 39. doi: 10.3390/toxins10010039
Ueno, Y., Nagata, S., Tsutsumi, T., Hasegawa, A., Watanabe, M. F., Park, H. D., et al. (1996). Detection of microcystins, a blue-green algal hepatotoxin, in drinking water sampled in Haimen and Fusui, endemic areas of primary liver cancer in China, by highly sensitive immunoassay. Carcinogenesis 17, 1317–1321. doi: 10.1093/carcin/17.6.1317
USEPA (2015). Recommendations for Public Water Systems to Manage Cyanotoxins in Drinking Water. Washington, DC: Office of Water, U.S. Environmental Protection Agency.
Watson, S. B., Whitton, B. A., Higgins, S. A., Paerl, H. W., Brooks, B., and Wehr, J. D. (2015). “Harmful algal blooms,” in Freshwater Algae of North America, 2nd Edn, eds J. D. Wehr, G. Robert, R. G. Sheath, J. P. Kociolek (San Diego, CA: Academic Press), 873–920.
Williams, C. D., Aubel, M. T., Chapman, A. D., and D'Aiuto, P. E. (2007). Identification of cyanobacterial toxins in Florida's freshwater lakes. Lake Reservoir. Manag. 23, 144–152. doi: 10.1080/07438140709353917
Wood, R. (2016). Acute animal and human poisonings from cyanotoxin exposure – a review of the literature. Environ. Int. 91, 276–282. doi: 10.1016/j.envint.2016.02.026
Xia, X., Zhang, S., Li, S., Zhang, L., Wang, G., Wang, J., et al. (2018). The cycle of nitrogen in river systems: sources, transformation, and flux. Environ. Sci. 20, 863–891. doi: 10.1039/C8EM00042E
Xu, Z. L., Ye, S. L., Luo, L., Hua, X., Lai, J. X., Cai, X. P., et al. (2020). Fluorescent enzyme-linked immunoassay based on silane-doped carbon dots for sensitive detection of microcystin-LR in water and crucian samples. Sci. Total Environ. 708, 134614. doi: 10.1016/j.scitotenv.2019.134614
Yang, X. E., Wu, X., Hao, H. L., and He, Z. L. (2008). Mechanisms and assessment of water eutrophication. J. Zhejiang Univ. Sci. B 9, 197–209. doi: 10.1631/jzus.B0710626
Yu, F., Liu, B., Chou, H., and Chu, F. (2002). Development of a sensitive ELISA for the determination of microcystins in algae. J. Agric. Food Chem. 50, 4176–4182. doi: 10.1021/jf0202483
Zhang, F., Lee, J., Liang, S., and Shum, C. K. (2015). Cyanobacteria blooms and non-alcoholic liver disease: evidence from a county level ecological study in the United States. Environ. Health 14, 41. doi: 10.1186/s12940-015-0026-7
Keywords: drinking water, enzyme-linked immunosorbent assay, microcystins, nodularins, cyanotoxin
Citation: Melaram R and Lopez-Dueñas B (2022) Detection and Occurrence of Microcystins and Nodularins in Lake Manatee and Lake Washington-Two Floridian Drinking Water Systems. Front. Water 4:899572. doi: 10.3389/frwa.2022.899572
Received: 18 March 2022; Accepted: 25 May 2022;
Published: 05 July 2022; Corrected: 18 September 2025.
Edited by:
Xubo Gao, China University of Geosciences Wuhan, ChinaReviewed by:
Arya Vijayanandan, Indian Institute of Technology Delhi, IndiaDong-Xing Guan, Zhejiang University, China
Yihui Dong, East China University of Technology, China
Chengcheng Li, China University of Geosciences Wuhan, China
Copyright © 2022 Melaram and Lopez-Dueñas. This is an open-access article distributed under the terms of the Creative Commons Attribution License (CC BY). The use, distribution or reproduction in other forums is permitted, provided the original author(s) and the copyright owner(s) are credited and that the original publication in this journal is cited, in accordance with accepted academic practice. No use, distribution or reproduction is permitted which does not comply with these terms.
*Correspondence: Rajesh Melaram, cmFqZXNoLm1lbGFyYW1Ad2FsZGVudS5lZHU=