 Benjamin E. K. Ryan
 Trisha Shrum1
 Asim Zia
- 1Department of Community Development and Applied Economics, University of Vermont, Burlington, VT, United States
- 2Institute for Environmental Diplomacy and Security (IEDS), University of Vermont, Burlington, VT, United States
- 3Department of Computer Science, University of Vermont, Burlington, VT, United States
Farms are a major source of water pollution in the form of nutrient run off that cause harmful algal blooms and anoxia, both signs of deteriorating water quality. Current policies that incentivize the adoption of nutrient management practices (NMPs) are insufficient, especially as climate change increases the frequency and intensity of flooding. To evaluate the incentives of current policy designs, we implemented a conjoint analysis on survey data collected in the Missisquoi and Lamoille watersheds of Lake Champlain Basin in three waves (2013, 2015, 2020). Using panel and cross-sectional observations over the three waves, we investigate farmers' willingness to accept (WTA) payment for NMPs that improve soil health and reduce nutrient runoff. We identified farmers' WTA for the adoption of three NMPs, cover cropping, conservation tillage, and buffer strips. The approach quantifies gaps between the incentives offered by the current federal conservation programs and payments preferred by farmers as well as the relative importance of NMP attributes. The influence of the payments decreased over the course of the three survey waves, suggesting the characteristics of NMPs are driving farmers' preferences for them. Our analysis shows farmers WTA is 1.13–6 times higher than what existing incentive programs offer. The incentive gaps between WTA and the cheapest of NMPs offered by EQIP are $55.61 for tillage, $103.60 for cover crop and $37.62 for buffers. Designing policy instruments to reduce this gap, the federal programs and policies will be more effective at scaling up the adoption of NMPs by farmers as a tool for sustainable watershed management.
Introduction
Agricultural practices can drive socio-ecological regime shifts and are emerging as powerful avenues toward greater sustainability and diversity of life (Altaweel, 2008; Bengochea Paz et al., 2020; Melchior and Newig, 2021). Farmers are under myriad pressures from both extreme events and slow-moving impacts of global climate change on the localized deterioration of soil and water quality vital for their production and socio-ecological wellbeing (Rockström et al., 2017). Growing and increasingly affluent populations are driving agricultural expansion and intensification. This agricultural trend exacerbates externalities on society and the environment like eutrophication, hypoxia from harmful algal blooms, water quality deterioration, and greenhouse gas emissions, problems that are projected to become more severe in the future (Tilman et al., 2001). The practices of agriculture present challenges and opportunities in the socio-ecological systems we rely on.
Agricultural practices offer opportunities for remediation, mitigation, and adaptation (Poeplau and Don, 2015; Kaye and Quemada, 2017; Hou et al., 2020; Qi et al., 2020). Best management practices (BMPs), also known as conservation agriculture practices, emerged from the criticism of agricultural practices that contributed to the Dust Bowl of the United States. BMPs were codified under the financial and technical auspices of the National Conservation Resource Service (NRCS) as they evolved into watershed management tools of non-point source pollution (Ice, 2004). NRCS and United States Department of Agriculture (USDA) BMPs are widely considered to promote a multitude of environmental benefits and ecosystem services including provisioning of water quality and quantity, nurturing healthy and diverse soils, and carbon sequestration (Bracmort et al., 2006; Sharpley et al., 2006; Power, 2010; Motsinger et al., 2016; Li et al., 2017; Lal et al., 2018; Barnes et al., 2019; Morari et al., 2019; Crystal-Ornelas et al., 2021). These benefits are not only ecological but also can improve the productivity and profitability of farms (Kragt and Robertson, 2014). We focus on three BMP's, cover cropping, conservation tillage, and buffer strips, for their contribution to nutrient management in agricultural fields. Nutrient Management Practices (NMPs) are integral for sustainable watershed management, particularly with looming extremes brought on by climate change (Lal et al., 2018).
Even with this array of tangible benefits, adoption of many of NMPs is low across the United States varying greatly by crop type as well as geographical location. For example, 64% of soybean producers in the Southern Seaboard (including parts of Virginia, Delaware, Maryland, North Carolina, South Carolina, Georgia, Alabama, Mississippi, Texas, Louisiana, and Arkansas) adopted conservation till (i.e., no-till and reduced till) practices (Wade et al., 2015). While in the Northern Crescent (which includes New England states, New York, New Jersey, parts of Ohio, Pennsylvania, Michigan, Wisconsin, and Minnesota), 28% of farmed land is conservation tilled (Wade et al., 2015). Thus, it is necessary to understand the underlying characteristics of farms and operators that may influence willingness-to-accept payments.
Demographic characteristics of farmers, such as higher levels of education and experience, have been shown to positively influence NMP adoption (Paudel et al., 2008; Burton, 2014). Conversely, farmer age is negatively associated with adoption (Chouinard et al., 2016). Farm characteristics like production type (Arbuckle and Roesch-McNally, 2015), farm size (Ahnström et al., 2009; Baumgart-Getz et al., 2012), enrollment in federal conservation programs [NRCS Environmental Quality Incentives Program (EQIP)] and land tenure (Parker et al., 2007; Reimer and Prokopy, 2014; Chouinard et al., 2016; Ulrich-Schad et al., 2016; Varble et al., 2016) have all been shown to have varying effects on adoption including positive, negative, and negligible effect. Environmental consciousness and pro-environmental values have been suggested to be a positive predictor of NMP adoption (Lubell and Fulton, 2008; Reimer and Prokopy, 2014; Pradhananga and Davenport, 2019). Higher levels of trust in technical and information sources are shown to positively influence adoption (Baird et al., 2016; Daxini et al., 2019). To summarize, barriers to the adoption of NMPs by farmers include social psychological issues such as farmer attitudes, norms and behavioral control (Wilson et al., 2014; Liu et al., 2018; Doran et al., 2020), poor policy incentives (Conner et al., 2016), programmatic rules (Del Rossi et al., 2021) and adverse socio-economic conditions (Schattman et al., 2018). Some NMPs entail greater operational costs or opportunity costs; for example, the costs of buffer strips are likely higher compared to reduced tillage or cover crops (Reimer and Prokopy, 2014; Natural Resources Conservation Service, 2017).
Research on farmers adoption of practices is abundant in the literature (Greiner and Gregg, 2011; Liu et al., 2018; Prokopy et al., 2019). This is in part due to the diversity of NMPs themselves as well as the complexity of the human-natural system interaction exemplary of agriculture (see Figure 1). Assessing willingness to accept (WTA) payment for these practices is important in determining tradeoffs regarding financial barriers to adoption while offering opportunities to improve design. Incentive gaps between WTA and what is offered reveals financial barriers that limit the broader use of NMPs for sustainable watershed management. A study that uses the same survey methodology and the first wave of data, found farmers' willingness-to-accept (WTA) ranged between $35 and $118 per acre more than the level offered by the EQIP, a voluntary federal program to financially assist farmers in adoption (Conner et al., 2016). Helling et al. (2015), found the average cost of cover cropping to be $129.24/acre while buffer strips were $807.33/acre. The authors estimated government willingness-to-pay to be $9.79 and $43.65 less than the costs of implementation reported by farmers (Helling et al., 2015). Local, regional, and national institutions have long incentivized practices that produces public services such as clean water with varying effects (Armstrong et al., 2011).
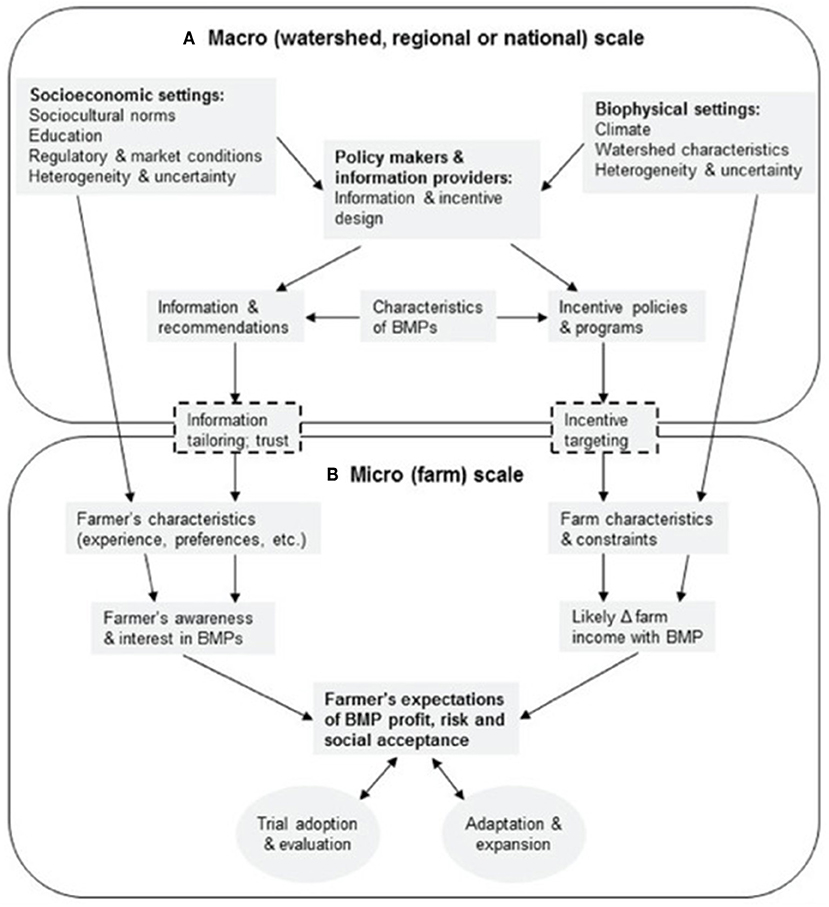
Figure 1. Conceptual framework of adoption of BMPs. Adapted by Liu et al. (2018) from Greiner and Gregg (2011). The boxes and arrows denote influences; the rounded boxes denote scales; the ovals represent actions related to BMP adoption; and the dashed boxes denote elements that may or may not be present. (A) Macro (watershed, regional, national) scale. (B) Micro (farm) scale.
Watershed management often transcends temporal, geographic and governance scales through the interconnection of local actions like NMPs to the mandates of federal statutes and, at times, transnational agreements (Norman and Bakker, 2009). As required under Section 303 (d) the Clean Water Act (CWA), the United States Environmental Protection Agency (EPA) established the Total Maximum Daily Load (TMDL) for phosphorus in the Lake Champlain Basin in 2016 (Clean Water Act, 1972). This entails an assessment of sub-waterbodies that do not meet the water quality standards and establishes the allocation of pollution loads across different sources, all to be implemented by the State of Vermont. The tactical basin of the Missisquoi River emptying into the Missisquoi Bay was identified as a priority area due to the characteristics of the basin, the legacy phosphorus in sediment and the dominance of agriculture in the land use mosaic (International Joint Commission, 2020). The TMDL requires an 83% reduction in non-point source phosphorus pollution from agricultural sources for the Missisquoi watershed (U.S. Environmental Protection Agency Region 1 New England, 2016). This degree of reduction demanded is much greater than the Lamoille basin which drains into Mallet's Bay at 29% (U.S. Environmental Protection Agency Region 1 New England, 2016). In light of these substantial demands on agricultural practices in the watersheds, the State of Vermont considers NMPs as necessary to achieve compliance with federally-mandated state water quality goals (U.S. Environmental Protection Agency Region 1 New England, 2016). Farmers play a pivotal role accomplishing the TMDL targets, yet the voluntary cost-sharing and educational initiatives offered have been slow to encourage NMP adoption among Vermont farmers (Wade et al., 2015). In this paper, we focus our attention on assessing farmer incentives for ultimately scaling up the adoption of NMPs as a watershed management tool. This is because basin scale hydro-ecological systems models have identified adoption of NMPs by farmers as a critical policy goal for improving water quality in freshwater rivers and lakes in the face of global climate change induced increases in the frequency and intensity of extreme events (Zia et al., 2016; Hecht et al., 2022).
Our research question is: (1) What is the willingness to accept payment for NMPs implementation in the case of the Missisquoi and Lamoille watersheds of Vermont? Using a ranked conjoint analysis administered in three survey waves in 2013, 2015, and 2020, we seek to understand farmer stated preferences regarding NMPs payments and identify if any incentive gaps exist. In our discussion of the study results, we introduce possible explanations of farmer preferences and explore how the findings relate to policy design and public discourse around the provisioning of clean water at the watershed level.
Materials and Methods
Conjoint analysis is a widely-used methodology to determine the influence of attributes, including price, on the preferences of consumers or participants. It falls under the broader umbrella of stated preference choice experiments. Of the various stated preference methodologies, both conjoint analysis (CA) and contingent valuation (CV) are commonly used yet complex to design, analyze and interpret. These methodologies often are incorporated into survey instruments and employed in consumer market research (Nguyen et al., 2015; Meyerding et al., 2019) and are increasingly used in the analysis of environmental policies and practices (Farber and Griner, 2000; Alriksson and Öberg, 2008), healthcare policy (Ryan and Farrar, 2000; Marshall et al., 2010), and social-ecological systems (Farber and Griner, 2000; Arifin et al., 2009; Conner et al., 2016).
In the conjoint analysis, hypothetical scenarios with varying attributes and prices are presented to the study participant who is asked to rank the scenarios to best match their preferences. Providing a full list of all options which would be far more difficult for participants to accurately rank (Sayadi et al., 2009; Conner et al., 2016). A full profile without orthogonal design would likely overwhelm participants and lead to a poor understanding of preference structure (Hair et al., 2010). For this reason, an orthogonal design is used to reduce the number of options available to farmers in terms of Nutrient Management Practices (attributes), the ranges of incentive payments (price), and the subsequent combinations of these. We include three individual NMPs (attributes): cover cropping, conservation tillage, conservation buffer strips. The listed combinations in the survey instrument are conservation tillage and cover cropping, conservation tillage and conservation buffer strips, cover cropping and conservation buffer strips and cover cropping, conservation tillage, and conservation buffer strips (see Table 1).
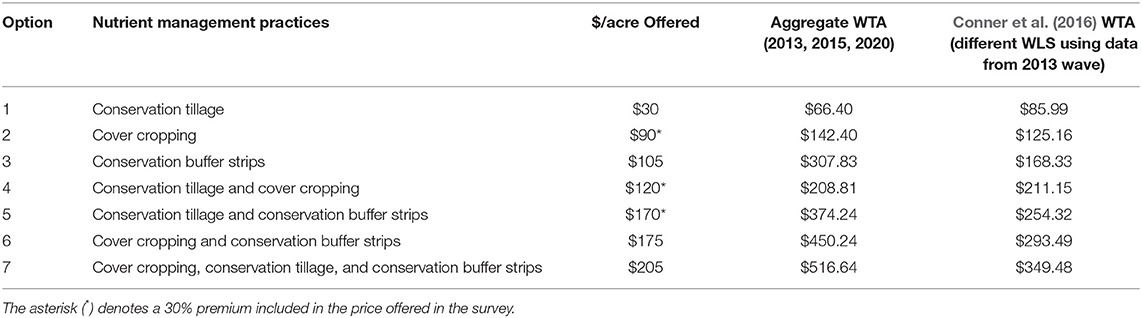
Table 1. Nutrient management practices options and calculated WTA.
The preference for each attribute is ascertained by analyzing participants' rankings of scenarios. The underlying theory of utility maximization is assumed for each rank (Kalish and Nelson, 1991). Conjoint analysis presents an opportunity for assessing not only the willingness to accept compensation, but also the influence of attributes (NMPs and compensation level) in the form of partial worths, which are also known as partial utilities (Alriksson and Öberg, 2008). This is a decompositional approach where researchers use the choice sets (based on ranking) to ascertain the partial worths of the attributes including compensation level. In this study, the attributes are the NMPs presented in the survey instrument.
Data Collection
The survey instrument presented a total of seven scenarios to participants who were instructed to rank from their most preferred (1) to their least preferred (7). The survey instrument and model capture observations from all the rankings (1–7), including the options that may not be as easily ranked due to indifference points between options. In other words, rankings should be strictly interpreted to be weak preferences (A ≽ B) which could be either indifference points between scenarios (A ~ B) or strong preferences (A ≻ B). This is opposed to solely using the first ranked-choice or the last ranked in the analysis of preference (Fok et al., 2012). Weak preferences may increase or decrease the accuracy of the estimation by not capturing the ambiguity, thus influencing the determination of willingness-to-accept and relative importance.
The levels of payment for the choice sets were determined based both the findings of a literature review and feedback from the experts of UVM Extension. A 30% premium was calculated and randomly assigned to three of the seven choice sets presented in the conjoint survey question. We included these premiums as prices in a conjoint analysis should be equal or higher than the current market price (Green and Srinivasan, 1978). The premium acts as a stimulus set to improve the accuracy and validity of parameter estimates. There is risk in that if premiums are too high and beyond reason, validity and predictability of the model could be compromised. Hence, the determination of incentive level in the instrument are based on UVM Extension feedback and existing literature. The choice sets were framed as an annual payment for implementation and verbal descriptions provided for those participants unsure of the practices or the terms of the offer.
We conduct our analysis based on survey data that was collected in three waves 2013, 2015, and 2020 in northwestern Vermont (Table 2). The surveys years were selected as they aligned with the broader data collection efforts of farmers administered in Vermont through existing research programs, specifically National Agricultural Statistical Service (NASS) and Vermont Established Program to Stimulate Competitive Research (EPSCoR). Farmers that grossed over $1,000 in agricultural revenues from the Lamoille and Missisquoi watersheds were included in the study population. A subset (N = 21) of the first wave participants remained in the panel throughout all three waves. Each wave consisted of a survey that included the same questions exploring farm characteristics, farm management, and production, farmer decision-making, existing nutrient management, climate and extreme weather perceptions as well as the experience, education, age, and income of farmers. The third survey wave includes an expanded questionnaire investigating, in more depth, the variables of the first and second waves relating to nutrient management planning, climate risk perceptions, social, and knowledge networks.
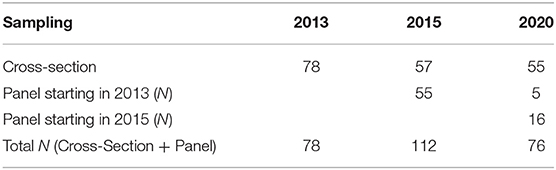
Table 2. Summary of panel participants and cross-section for survey waves.
The first survey wave was initiated in March 2013, and was conducted by the National Agricultural Statistical Service (NASS) through the selection of zip codes. In the 2013 wave, a screening postcard was sent to farmers (N = 1,104) in the target watersheds with annual revenues >$1,000. Of the 220 postcards returned, 52% (n = 114) responded by agreeing to take the survey, the remaining 48% did not respond, responded “maybe,” left it blank, or declined to participate. These 114 farmers, as well as those who had responded to the postcard with “maybe” or not filled out the field, were sent the survey via mail (N = 128). Around 62% (N = 78) of surveys were completed and returned. Phone-based surveys were administered to farmers who did not return the mailed survey, and are included in the data. The final response rate from the initial screening postcard population was 7%.
A panel of farmers was established after the completion of a second survey, conducted in 2015. The second wave included this panel (N = 55) and additional farmers not included in the first wave (N = 57). The survey was conducted by mail as part of the Vermont EPSCoR Research on Adaptation to Climate Change (RACC) initiative.
The third survey wave was carried out in 2020 by the Center for Rural Studies (CRS) using phone interviews and online surveys for the Vermont EPSCoR Basin Resilience to Extreme Events (BREE) and included a more extensive questionnaire. The geographic scope in the sampling expanded beyond the Missisquoi and Lamoille watersheds to the entire Lake Champlain Basin within Vermont. The survey sample size for the third wave was N = 76, and it included panel participants from the first and second waves (N = 21). Recruitment was conducted through postcard mailings based on farmer networks and associations (specifically Northeast Organic Farming Association, Vermont Sheep and Goat Association, University of Vermont Extension, Vermont Maple Sugar Makers' Association, and existing statewide list of dairies), Front Porch Forum advertisements, and direct communication with farmers at farmer's markets. Based on the sampling criteria established by the Center for Rural Studies, farmers were sent postcard invitations to complete the survey. The small sample size for all waves is worthy to note in interpreting the results as it influences the validity and accuracy of the estimation and subsequent analysis of WTA. In attempting to address the issue of sample size, we employ weights to reflect the distribution of farmers based on management type (organic and conventional) as well as size of production in acreage. The sample size is large enough to capture signals that are worthy of analysis, interpretation and policy recommendations, albeit acknowledging this limitation.
Weighted Least Square Regression
A weighted least square (WLS) regression is used to model the conjoint analysis. The weighting procedure includes characteristics of the sampling population at the Lamoille and Missisquoi watershed scale and assigns weights them based on the USDA Agricultural Census of 2017 (US Department of Agriculture National Agricultural Statistics Service, 2019). Final weights used for the WLS model include farm size (acres) and management type (organic, conventional). Income is not included in the weighting, as it is not collected in the USDA Census. Farm income is likely correlated with farm size which is included in the weighting (Rada and Fuglie, 2019). Each survey wave has weights calculated separately and ascribed to each particular case. This estimation method is used to control for the farm size and management type which likely influence NMP preferences as well as WTA. WLS has been shown to be a robust estimation when assigned to subjects in conjoint analysis for categorical variables (Sanchez and Gil, 1997; Næs et al., 2001; Wang et al., 2015; Kaijie and Min, 2016). Using an Ordinary Least Squares model the assumption must hold that the errors unobserved errors are homoscedastic and normally distributed, the use of WLS attempts to address these concerns in model specification bias. Due to the nature of data collected being de-identified, we are not able to use geolocation to determine the relation of farms in the watershed, specifically in terms of elevation and hydrological relation (i.e., upstream vs. downstream farms). The WLS model is as follows:
where Rij is the ranking given by individual i for each choice j, the β0 is the intercept and ß1 is the coefficient for the incentive, X1ij. Each individual ranking is weighted based on the criteria of farm size and management type. The three conservation practices are coded as dummy variables: conservation tillage, X2ij, cover crop, X3ij, and conservation buffers, X4ij. To test the model robustness, we include demographic and farm characteristics in an expanded model. The partial worths represent the proportion of the utility that an attribute or level of an attribute (ith) contributes to the overall utility of a choice set. The partial worths sum to a total of 1, meaning that, by a standard assumption of ranked conjoint analysis, 100% of the utility of the choice set modeled is represented. The advantage of calculating partial worths is that the relative importance of an attribute can be attributed to the price (in this case incentive payment). With the partial worths, relative importance is calculated using the summation function (Halbrendt et al., 1995).
Relative importance (RI) presents a method of interpretation of the WLS regression, showing the importance of an attribute compared to that of the other attributes. The relative importance of the ith attribute (RIithattribute) is calculated by first ascertaining the range of the partial-worth coefficients of the ith attribute (URi). This range is imputed by taking the difference between the highest and lowest values of each attribute. The denominator of the second term sums the ranges of all attributes.
The relative importance is a weighted percentage of the ith attribute, thus it is multiplied by 100 (in the first term). The relative importance of an attribute is interpreted as a linear proportion. For example, when price has a relative importance of 10%, and different attribute has a relative importance of 5%, then price is two times more important in determining the preference of the participant (i.e., consumer or farmer). The relative importance of attributes due to their relationship with partial worths sum to a total of 100%.
Using partial worths, the willingness to accept is estimated using a Compensation Equivalence Index (CEI) (Payson, 1994). Compensation Equivalence Index a form of the Expenditure Equivalence index (EEI), is the summation of the change in the ith attribute (dci) for the ith attribute coefficient (βi). Where y is the estimated coefficient of price and P is the base price level. This index indicates the proportional change of incentives needed to for participants to be indifferent between given choice sets. For example, an NMP with a CEI of 1.1 is interpreted as farmers are willing to accept a payment 10% higher than the reference profile, which is the lowest level of incentive.
The CEI calculates the incentive (price) level that changes the preference of the participants to be indifferent between the baseline and the alternatives presented in the conjoint analysis. Due to the lack of baseline included in the survey instrument, the intercept (βo) used in this analysis as the baseline. This lack of baseline may influence the estimation through truncation if the most preferred option for a farmer is equivalent to $0 and not implementing any NMP. Although this differs from reality, the assumption of a baseline is needed to determine willingness to accept. Due to the additive properties of the partial worths, the WTA for the combination of the practices (Option 4–7) is determine by adding WTAs together. These methods have been used in previous literature investigating the WTA of NMPs by farmers using the 2013 survey wave (Conner et al., 2016).
Results
Descriptive Statistics
The three survey waves conducted in 2013, 2015, and 2020 are presented in Table 3. Demographic characteristics of farmers include age, years of farming, and education. In order to protect the identity of farmers in a relatively small geographic area with low populations, farmers' year of birth is coded into decades of birth. The 2013 sample average birth decade is 1940–1949 coded as 3, where the 2015 mean birth year is 1950–1959. The 2020 survey samples younger farmers with the being the decade of 1970–1979. All survey waves (2013, 2015, 2020) present similar means for the years of farming of 26.86, 30.87, 31.07 years, respectively. Similar to age, education was coded not in years, but by attainment. In this variable, attainment is coded ranging from some high school (1) to graduate degree (6). The three survey waves differ in the average educational attainment. The 2013 sample and the 2015 sample had average educations closer to some college, while the 2020 sample had more educated respondents. Total acres owned is a variable included in the descriptive statistics and between the three waves, there are some differences in the standard errors. The 2013, 2015, and 2020 waves means for total owned acres are 219.74, 195.07, 240.02 acres, and the standard deviations are 218.65, 276.45, 417.94 acres, respectively. The 2020 survey standard deviation of total owned acres shows a much larger scale of farm production (in terms of acreage) than the other two previous survey waves. This may be due to the broadened geographic scope of the latter survey into the Lake Champlain Plain. The means of leased land is also reported in Table 3, with some consistency across the survey waves. The 2015 wave skews toward more land leased (87.54 acres), while the 2013 survey samples farmers that relied on less leased land (67.09 acres). Similar to the age and education variables, both net and gross income were collected in a manner to protect the identities of farmers as well as obtain accurate self-reporting. The descriptive statistics present a range of net and gross incomes for each survey wave. Gross income means range from $50,000 to $74,999 in the 2013 and 2015 waves, while the mean moves into a higher range in 2020 at $75,000–$99,999. Easements, which are legally protected for a particular conservation use in perpetuity for example grasslands, is coded as a dummy variable. For the three waves of 2013, 2015, and 2020 35, 16, and 23% of participants reported having easements on the land they managed, respectively.
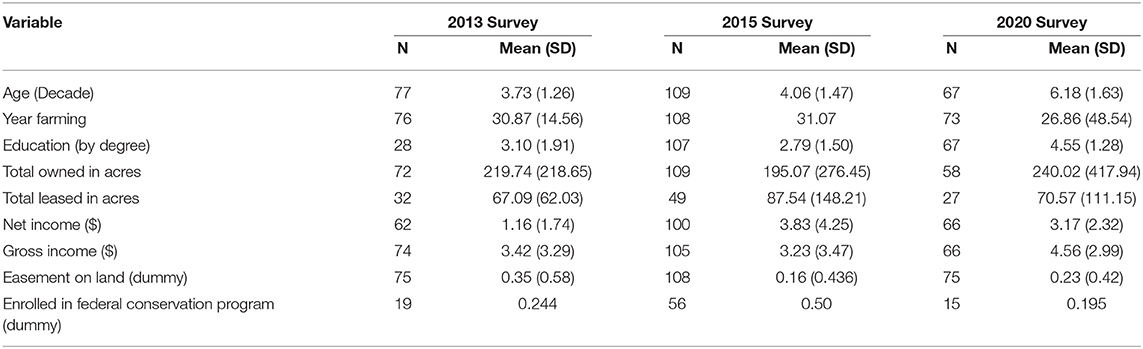
Table 3. Descriptive statistics of survey waves.
The farmers sampled in the three waves reported their participation in federal conservation programs including the Environmental Quality Incentive Program (EQIP), Conservation Reserve Enhancement Program (CREP), Wildlife Incentives Program (WIP), among others. Over the three survey waves, the percentage of farmers sampled that are enrolled in voluntary federal conservation programs differs with 24.4% enrolled in 2013, 50% enrolled in 2015, and 19.5% enrolled in 2020. This disparity may be due to selection bias in the recruitment process. The tests conducted to control for this found no statistically significant correlation between ranking and enrollment in federal conservation programs.
Of the 78 participants in the first survey wave, 30 completed the conjoint question fully. This entails ordering preferences from 1 to 7 without ranking option as equal (e.g., multiple options ranked third) and without options missing a ranking (i.e., leaving options blank). For the second wave (N = 112) and third wave (N = 76), we included 37 and 42 participants, respectively, who completed the conjoint question on the survey correctly as described above by ranking all options (1–7). The observations with multiple options ranked the same, and the observations missing ranking for some options were removed from the conjoint analysis sample.
Conjoint Analysis
The results from the conjoint analysis show that the most preferred of the available options presented is $205/acre for cover crop, conservation tillage, and conservation buffers (see Figure 1). With 55% ranking this option as first and 12% ranking it as last. The least preferable option for participants is the $30/acre for conservation tillage (66% ranked it last, 5% ranked it first). The most and least preferred NMPs of each survey wave individually and comparatively are reported in the Supplementary Figures 1–3.
Using IBM SPSS 28, a weighted least square regression model is conducted with the aggregated survey data from all three waves (see Table 4). The three NMP practices were found to be marginally significant with conservation tillage (p = 0.089), while a higher threshold of significance was found with cover crop (p = 0.021) and buffer strips (p = 0.012). The incentive variables were found to be not significant (p = 0.185). The variables included in the model (incentive, conservation tillage, cover crop, and conservation buffer) account for 30.1% of the variation in the ranking of preference by the participating farmers. The model was run using the SPSS bootstrap module (n = 1,000) at the 95th percentile (see Table 5).
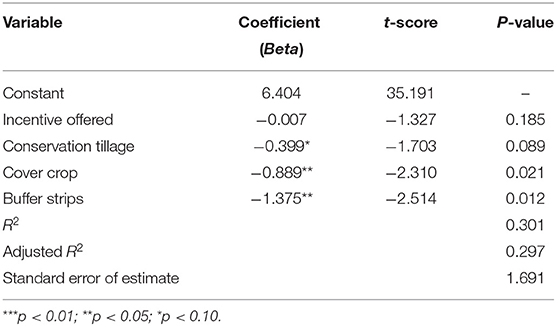
Table 4. Aggregate of the three survey waves.
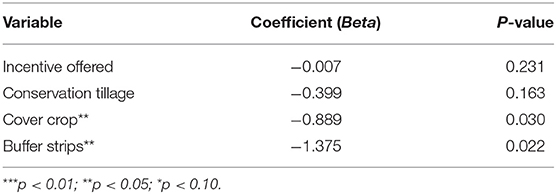
Table 5. Bootstrap aggregate of the three survey waves.
The expanded full model initially included the variables of farmer education, years farming, climate risk perception, size of farm, land tenure, and income (see Supplementary Material). The constricted model for our analysis included dummy variables for incentive and the three conservation practices, as the control variables did not substantially change the outcomes of interest and the restricted model had the best fit, based on it having the highest adjusted R-square. From this WLS regression, partial worths of each attribute is for each set of choices are calculated by multiplying the coefficient of that attributes by the value of each base incentive levels of the three NMPs (e.g., $30 for conservation tillage *-0.36).
The WLS regression conducted on the individual survey waves and found substantial differences between the 2013 wave compared to the 2015 and 2020 waves (Table 6). The survey waves showed the high significance of the NMPs (p < 0.001) and marginal significance of the incentive variable (p < 0.1) in 2015. While these variables 2013 present no significance. The survey wave of 2020 presents conservation tillage as a marginally significant variable (p = 0.097). From the regression coefficients, the partial worths are calculated (Table 7). These partial worths were calculated for the aggregate of all three survey waves (Table 7) as well as for each survey wave (Supplementary Material) (Tables 8–13). For the purposes of our analysis, we assume farmers receive $6.404/acre regardless of whether any of the NMPs were implemented in the field.
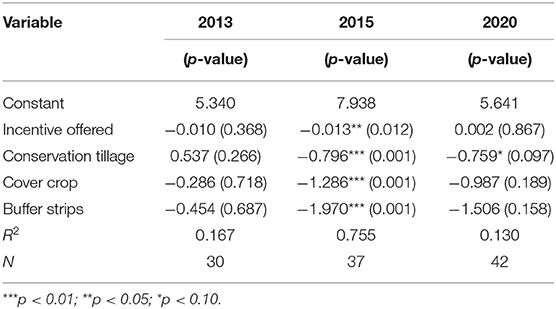
Table 6. Three survey waves regression results.

Table 7. Partial worths of aggregated survey waves.
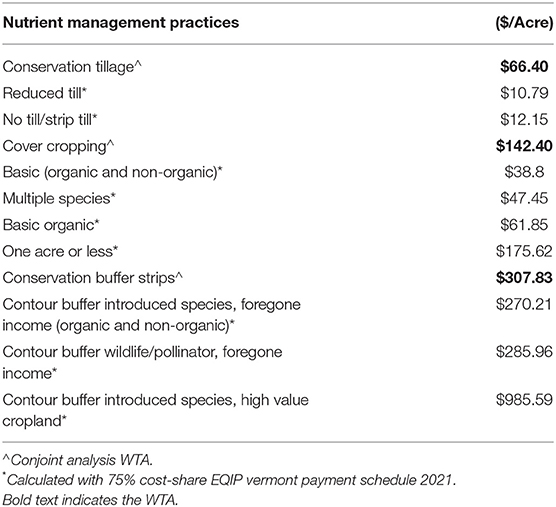
Table 8. Aggregate regression results with wave dummy variable.

Table 9. Aggregate regression results with net income and education variables.
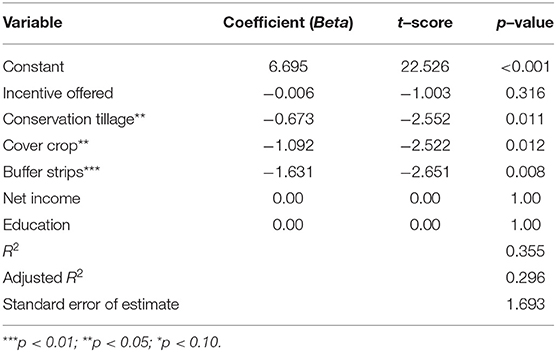
Table 10. 2013 survey wave regression results.
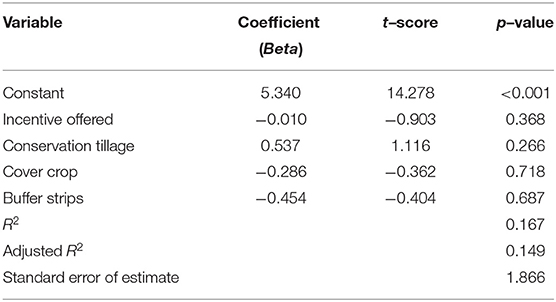
Table 11. Part–worths of 2013 survey waves.
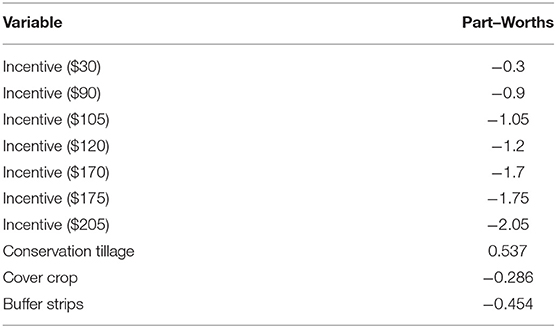
Table 12. 2015 survey wave regression results.
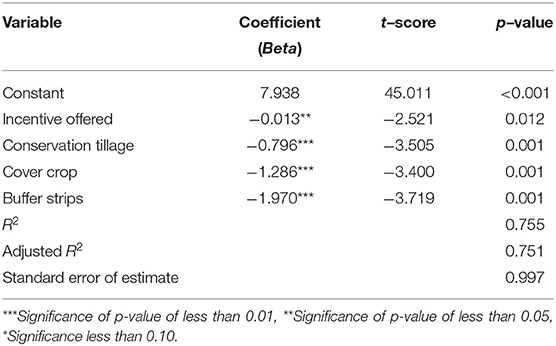
Table 13. Part–worths of 2015 survey waves.
In interpreting the coefficients, positive coefficients suggest a less preferred management practice, while the negative coefficients suggest a more preferred practice. This is due to the larger incentives being ranked higher in the preference order. In terms of the utility regarding the ranking of practices, a positive coefficient indicates less utility than the negative coefficients. When controlling for each wave by adding year fixed effects, we found no significant difference in the regression results (see Supplementary Material) (Table 14). We controlled for net income and education (Supplementary Material) (Table 15), with minimal change to the regression coefficients; the significance of the NMPs increased when adding these controls. Farmer socio-demographic characteristics included initially in the model are income, experience, and education were shown to not improve the estimation of the WLS model. Including farm characteristics of farm size, land tenure (proportion acres owned/leased), and the presence of an easement on the farm, did not improve the estimation.
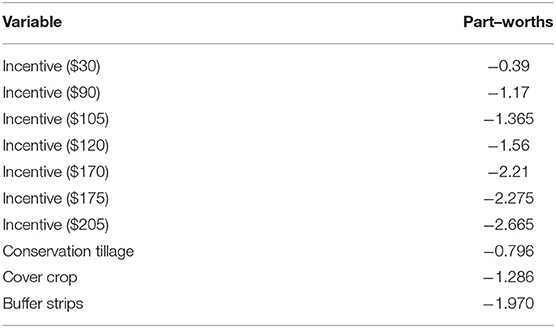
Table 14. 2020 survey wave regression results.
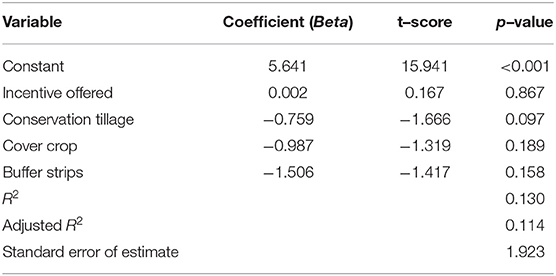
Table 15. Partial–worths of 2020 survey waves.
The relative importance when investigating the aggregate of all survey waves shows that incentives and buffers are of equal influence in determining the most preferable NMP (Figure 2). Cover crops at 22% relative importance, account for over twice as much compared to tillage (10%) in this determination.
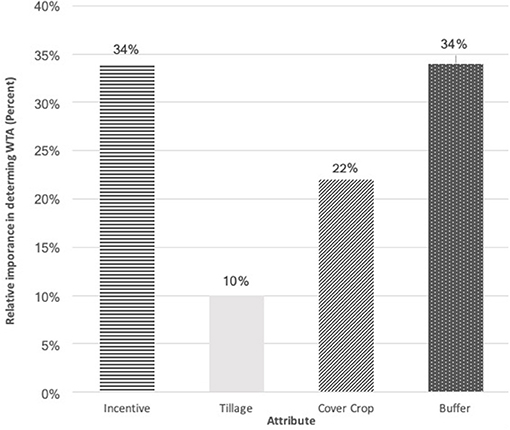
Figure 2. Aggregate relative importance of attributes.
Figure 3 shows a trend over the course of time revealing more nuanced preferences than the aggregate. In 2013, incentives accounted for 58%, a stark majority compared to the 18% of tillage, 9% cover crop, and 15% buffer. By 2015, the variables begin to equalize more, with incentives still being the majority influencer at 36%, albeit by a small margin compared to buffer crops (31%). The relative importance of the other two NMPs of cover crop and tillage are 20 and 13%, respectively. The 2020 survey wave shows dramatically different motivations regarding the ranking of the preferences. Conservation buffers with a value of 41% is the most important attribute in determining preference, while tillage and cover crops are calculated to 22 and 27%, respectively. Incentives, with a value of 10%, are over four times less influential than conservation buffers.
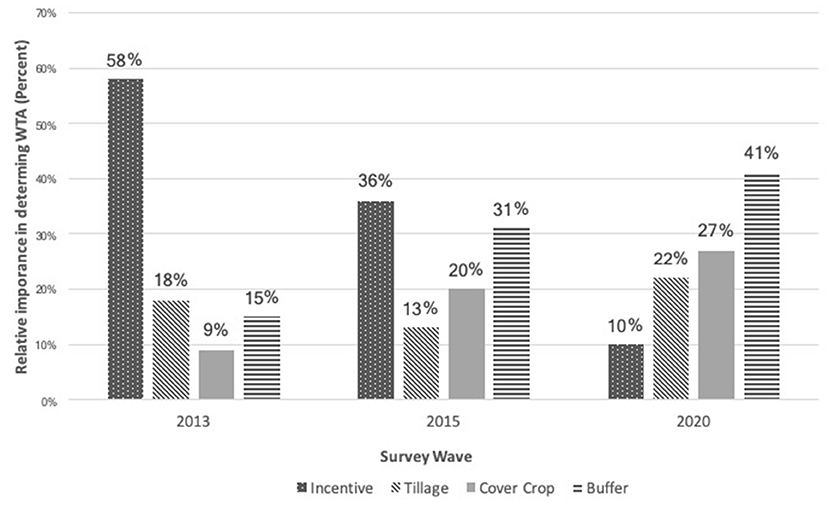
Figure 3. Relative importance by the three survey waves in determining WTA.
The relative importance of the individual survey waves presented in Figure 3. The willingness to accept payment is calculated using the Compensation Equivalence Index (CEI). A base price is assumed as the intercept of the model (6.404) and the parameter of price is for the model (−0.007). This makes up the denominator of the CEI equation. The change of the coefficients of the ith attribute is the absolute value of the ith coefficient with the base being zero. For example, to calculate the WTA for the least preferred option, $30/acre for conservation tillage, we take the coefficient for the price (−0.021) and simply add the coefficient for the attribute of tillage (−0.399). This is the numerator of the CEI equation.
The minimum WTA is determined for the aggregate and compared to the findings of Conner et al. (2016), which utilize the 2013 survey data. Conner et al. (2016) employ a weighted least square estimator based on the ranking order. The WLS used in our study assigns weights based on farm size (a proxy for income) and management type (specifically organic and conventional practices). Our analysis shows that farmers' willingness to accept for all NMPs is higher than the offered payments in the conjoint question (see Table 1). The difference between the offered price and the WTA calculated is substantial. The difference between the conjoint options and the WTA for conservation tillage is $36.5, cover cropping is $52.5, and $202.83 for conservation buffers. Farmers' willingness to accept payment for buffer strips is almost three times higher (2.93) than that offered in the conjoint question, whereas conservation tillage WTA is over twice as high for farmers than offered in the conjoint question. The willingness to accept payment for cover cropping is over 1.5 times higher than the amount offered per acre in the conjoint question. As one moves down the table into the combination of NMPs, due to the additive nature of the calculation, WTA ranges between 74 and 150% higher than that which is offered in the survey. Our findings show that buffers are substantially higher (45%) than found by Conner et al. (2016), while conservation tillage is lower (−23%), and the cover crop variable is higher (12%). Conner et al. (2016), use a different weighted least square (WLS) model based on assigning greater weights to the higher ranked options than the lower ranks. Our approach of weighting the sample population based on farm size and production type opposed to weighting the rank offers more insightful inferences at the watershed scale.
Discussion
Encouraging NMPs among farmers is a key strategy of the NRCS for sustainable watershed management under the pressures of climate change. The incentive structures are determined at the state-level. In the case of Vermont, NRCS will cover up to 75% of costs of implementation. With this structure, farmers are expected to pay upfront costs and 25% is not recouped. In our analysis, we include the cost-share amounts at 75% for conservation practices for purposes of comparison (Table 16). The incentives offered to farmers by the NRCS Environmental Quality Incentive Program (EQIP) differ by type of agriculture practice and management type (see Table 16). All practices documented in the NRCS Payment Schedule have a separate category with a price premium for historically underrepresented groups but due to the number of options, all the payment levels are not reported for comparison. Due to the paucity of publicly available data on the NRCS schedule of payments, only 2017 and 2021 payment data are presented in Table 16. To assess if any incentive gaps exist, we compared the WTA calculated with the level of payments offered from the array of options through EQIP.
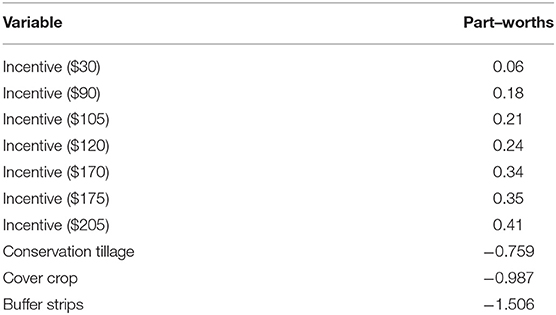
Table 16. Comparison of aggregate WTA to 2021 EQIP payments for implementation of nutrient management practices.
EQIP and NMPs
In the EQIP Schedule of Payment 2021, conservation tillage is not listed. In lieu of this, we identified Residue and Tillage Management, Reduced Till ($10.79/acre) as closely related. We also categorized No-till practices as a conservation tillage practice. The EQIP payments for No-till ranges from $12.15 to $14.58/acre.
Cover crops have a substantially larger number of options (30) in the 2021 Payment Schedule. For purposes of comparison, three incentive options are selected: Basic (organic and non-organic) Cover Crop at $38.8/acre, Multiple Species (organic and non-organic) cover crop at $47.45/acre, and Basic (Organic) cover crop at $61.85/acre. Those farming on one acre or less are compensated more ($175.62).
As with cover cropping, conservation buffer strips not explicitly named in the EQIP document. We have selected multiple practices that are closely related to conservation buffer strips for purposes of comparison. Farmers that adopt contour buffer strips that are titled Introduced Species, Foregone Income (Organic and Non-Organic) are compensated at $270.21/acre whereas it is $285.96/acre for contour buffers that are Wildlife/Pollinator, Foregone Income (Organic and Non-Organic). The Foregone Income component of this combination is substantially lower compared to Introduced Species, High-Value Cropland where the compensation is $985.59/acre. The menu of EQIP payments is detailed and diverse in terms of the range of payment, characteristics of a NMP, and farm management types. We attempt to represent heterogeneity in our assessment the gaps between WTA and EQIP payments.
The results of the analysis show that willingness to accept payment to implement the three NMPs is much higher than the incentives offered by NRCS EQIP (Figure 3). When accounting for the cost-sharing criteria of the program of payment of up to 75%, the difference between willingness to accept and the willingness to pay by NRCS is notably large. The incentive gaps between WTA and the cheapest of NMPs offered by EQIP are $55.61 for tillage, $103.60 for cover crop and $37.62 for buffers (Figure 3). This suggests that the incentives offered by NRCS are lower than the WTA. Specifically, six times less for conservation tillage, 3.6 times less for cover crop and 1.13 less for buffers.
Comparing the NRCS Schedule of Payment published in 2017–2021, there are substantial changes in incentive levels offered. The incentive for cover crops (Basic) decreased by roughly 17%, while Residue and Tillage Management, Reduced Till payments decreased 10% and buffer strips that are Introduced Species, Foregone Income (Organic and Non-Organic) decreased 22% (Natural Resources Conservation Service, 2017, 2021). These decreases in payments coupled with rising rates of inflation at 5.5% based on the Consumer Price Index between 2017 and 2020, illuminates possible financial barriers to adoption (US Bureau of Labor Statistics, 2022).
Untangling Motivation
In our model, incentives were shown to be less significant in the model specification and partial worths less influential. These findings offer insight into aspects motivating farmers to adopt NMPs aside from incentives. The relative importance calculations (Figure 4), suggest a trend toward the NMP practices themselves influencing farmer preference thus their characteristics acting as a motivation for implementation. In an earlier study, using a different weight least square model found the coefficients of incentives to be significant, and the coefficients for NMPs suggest that cover crops were the most preferable (Conner et al., 2016). In our analysis, conservation buffers presented the most relative importance, while all three NMPs were significant. This suggests incentives were not as important as a determinant of farmer preferences and further research is needed to understand the role of payments vs. practices in terms of motivation.
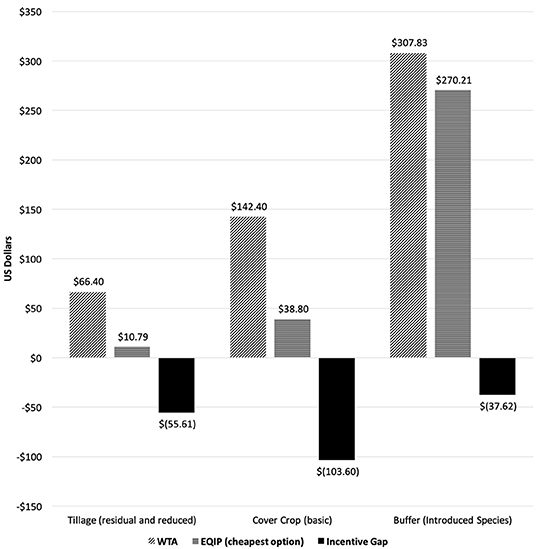
Figure 4. Quantifying incentive gap comparing WTA and EQIP payments with 75% cost-share. Incentive gaps of calculated WTA and cheapest EQIP NMP option.
Identifying the particular reasons for the change in observed stated preference is challenging. Individual motivations and macro-factors (social, policies, and economics) may have influenced farmers' choice sets and willingness-to-accept. Policies including Total Maximum Daily Load as well as federal and the State of Vermont-led programs may have influenced perceptions that more generous than current levels of incentives were to be offered in the near future. In 2015, the TMDL was revised. The public discourse around this initiative may have influenced the ranking of the participants who were hopeful in the opportunities of incentive schemes. Increasing awareness of NMPs among farmers and the public may contribute to these trends as well (Gedikoglu and McCann, 2012; Gao and Arbuckle, 2022). Previous literature has shown that farmers participating in EQIP are motivated not by the incentives themselves but by the environmental impact of the practices (Baumgart-Getz et al., 2012; Reimer et al., 2012). Incentives can address the unforeseen costs, associated risk and uncertainty of implementation on productivity and profitability (Reimer and Prokopy, 2014; Palm-Forster et al., 2017; Piñeiro et al., 2020). Although risk aversion was found to be not significant for no-till practices and significant for cover cropping in Tennessee (Campbell et al., 2021), this may play a role in determining farmers' preferences of NMPs and was not fully captured in our analysis.
Farmer socio-demographic characteristics included initially in the model are income, experience, and education are shown to not improve the estimation of the WLS model. Similarly, including farm characteristics of farm size, land tenure (proportion acres owned/leased), and the presence of an easement on the farm showed to not improve the estimation. When perceptions of climate change and the effect of extreme weather were included the R-square was not higher nor p-value lower. These aspects relating to farm characteristics as well as socio-demographic and cultural identities may influence decision-making through the mediating factors of beliefs which in turn drive the implementation of NMPs (Januchowski-Hartley et al., 2012; Ulrich-Schad et al., 2016; Sok et al., 2021). To our knowledge there is no research investigating these intersections around climate change, beliefs and NMPs. Understanding some of the farmer motivations whether financial or socio-cultural relating NMP adoption and WTA are key to improving the plethora of benefits including productive agriculture, clean water, vibrant, and connected ecosystems which extend beyond the watershed.
Broad Implications and Policy Relevance
The Missisquoi and Lamoille watersheds are emblematic of the challenges for sustainable management of watersheds that drain agricultural landscapes. As reliance on NMPs to address water quality increase in the face of climatic extremes of temperature and precipitation, incentive structures and policies need to be designed so they are compatible with both farmers' and society's needs. The current mandates of the EPA under the 2016 TMDL for Lake Champlain, have catalyzed the political pressure on farmers to reduce their nutrient budgets around phosphorus. The current policies of the NRCS that are purported to usher in the transition toward sustainable agriculture may be insufficient. Increasing direct incentive payments is one approach to increase adoption of NMPs, while alternatives like tax credits and specialized insurance have also been shown to increase willingness (Palm-Forster et al., 2017). These alternatives carry their own challenges of implementation; particularly political barriers, land tenure, and transactions costs for farmers and institutions (Palm-Forster et al., 2016; Duke et al., 2020; Del Rossi et al., 2021).
Incentives are fundamentally connected to the distribution and access to information among and between actors in the systems (farmers, regulators, and consumers) as well as the heterogeneity of land (Fraser, 2009; Denny et al., 2019). As farmers are motivated by the nature of particular NMPs in producing benefits both to the public in the form of ecosystem services as well private in the form of economic efficiencies of increased productivity, information regarding NMP performance is fundamental to their decision-making (Savage and Ribaudo, 2016). Not only is the access to knowledge integral, but the transparency of their actions is becoming increasingly more granular and public. The technological innovation (e.g., AI and satellite imagery) in the private and public sectors provides opportunities to address some of the historically challenging aspects of governing non-point source water pollution.
The information age may offer opportunities to shift incentives away from the poor performance of existing programs and enable farmers to be flexible in nutrient management practices in achieving pollution goals while being appropriately compensated for the costs (Ahnström et al., 2009). There is a need for further research into incorporating reflexivity of individual farmers' behavior and knowledge around the performance of practices and the institutional mechanisms encouraging their adoption (Yoder et al., 2019). A greater understanding of how knowledge, both indigenous and technical as well as individual and aggregated data could be paired with incentives offers avenue of new research. The incorporation of site-specific knowledge could improve adoption and increase the participation in federal programs or the emerging markets of ecosystem services. Our findings quantifying WTA at 1.13–6 times higher than what is offered is integral for crafting better policies necessary to manage water quality. These findings are applicable for design of policies at the local level like the State of Vermont Working Group on Payment for Ecosystem Services, and the Pay-for-Phosphorus program, as well as programs targeting transboundary watersheds under the stressors of climate change.
Conclusion
In our analysis, we investigated the average willingness to accept of farmers in the Lake Champlain Basin of Vermont using conjoint analysis. We found farmer's willingness to accept for all three different nutrient management practices (conservation tillage, cover crop, and buffer strips) to be (1.13–6 times) higher than existing federal cost-sharing program (Environmental Quality Incentive Program). The relative importance of the incentives diminishing while the importance of the NMPs themselves increased over the three survey waves. From these findings, it is evident that farmers' willingness to accept is higher than what is currently offered. Thus, farmers are saddled with deciding to either bear the costs of providing clean water (subsidizing public services) or maximizing their private gain through production. These localized decisions are vital promote sustainable watershed management and further research is needed in quantifying incentive gaps in implementing nutrient management practices across the diversity of geographies, scales and farming systems. From these findings, policies designed to manage water quality sustainably will have to close the incentive gap to meet the rising social, ecological, and global pressures.
Agriculture is at a pivotal moment in history as the practice has led to drastic changes in our climate, ecological systems, and human wellbeing at the cost of planetary sustainability. With this weight of the past, comes the opportunity of the future. Current incentives to transition agriculture toward greater sustainability have yet to be designed to best meet farmers and society's collective needs in the present and for what is to come. Although incentives are one aspect of motivating sustainable agriculture and provisioning clean water, there are a suite of factors that may be more potent if they were to be paired with monetary compensation.
Data Availability Statement
The raw data supporting the conclusions of this article will be made available by the authors, without undue reservation.
Ethics Statement
The studies involving human participants were reviewed and approved by Institutional Review Board University of Vermont. The patients/participants provided their written informed consent to participate in this study.
Author Contributions
BR the first author conducted the data analysis, drafted, and edited the manuscript. TS and AZ contributed equally as second authors to the writing and editing of the manuscript. AZ contributed to the conceptualization and analysis of this paper. All authors contributed to the article and approved the submitted version.
Funding
This material was based upon work supported by the National Science Foundation Grants OIA-1556770 & FW/HTF-2026431.
Conflict of Interest
The authors declare that the research was conducted in the absence of any commercial or financial relationships that could be construed as a potential conflict of interest.
Publisher's Note
All claims expressed in this article are solely those of the authors and do not necessarily represent those of their affiliated organizations, or those of the publisher, the editors and the reviewers. Any product that may be evaluated in this article, or claim that may be made by its manufacturer, is not guaranteed or endorsed by the publisher.
Acknowledgments
Many thank to my committee members, as well as Dr. Qingbin Wang, Dr. David Conner, Jennifer Miller for their guidance and support as well as Heather Darby for their prior research from which this paper would not be possible. Thanks to Richmond Baye, Shashank Poudel, and Stephen Guion for their constructive feedback and endless help. Also, many thanks to the Center for Rural Studies, Vermont EPSCoR, and the Lake Champlain Basin Program.
Supplementary Material
The Supplementary Material for this article can be found online at: https://www.frontiersin.org/articles/10.3389/frwa.2022.918035/full#supplementary-material
References
Ahnström, J., Höckert, J., Bergeå, H. L., Francis, C. A., Skelton, P., and Hallgren, L. (2009). Farmers and nature conservation: what is known about attitudes, context factors and actions affecting conservation? Renew. Agric. Food Syst. 24, 38–47. doi: 10.1017/S1742170508002391
Alriksson, S., and Öberg, T. (2008). Conjoint analysis for environmental evaluation. Environ. Sci. Pollut. Res. 15, 244–257. doi: 10.1065/espr2008.02.479
Altaweel, M. (2008). Investigating agricultural sustainability and strategies in northern Mesopotamia: results produced using a socio-ecological modeling approach. J. Archaeol. Sci. 35, 821–835. doi: 10.1016/j.jas.2007.06.012
Arbuckle, J. G., and Roesch-McNally, G. (2015). Cover crop adoption in Iowa: the role of perceived practice characteristics. J. Soil Water Conserv. 70, 418–429. doi: 10.2489/jswc.70.6.418
Arifin, B., Swallow, B. M., Suyanto, S., and Coe, R. D. (2009). A conjoint analysis of farmer preferences for community forestry contracts in the Sumber Jaya Watershed, Indonesia. Ecol. Econ. 68, 2040–2050. doi: 10.1016/j.ecolecon.2008.12.007
Armstrong, A., Ling, E. J., Stedman, R., and Kleinman, P. (2011). Adoption of the conservation reserve enhancement program in the New York city watershed: the role of farmer attitudes. J. Soil Water Conserv. 66, 337–344. doi: 10.2489/jswc.66.5.337
Baird, J., Jollineau, M., Plummer, R., and Valenti, J. (2016). Exploring agricultural advice networks, beneficial management practices and water quality on the landscape: a geospatial social-ecological systems analysis. Land Use Policy 51, 236–243. doi: 10.1016/j.landusepol.2015.11.017
Barnes, A. P., Soto, I., Eory, V., Beck, B., Balafoutis, A. T., Sánchez, B., et al. (2019). Influencing incentives for precision agricultural technologies within European arable farming systems. Environ. Sci. Policy 93, 66–74. doi: 10.1016/j.envsci.2018.12.014
Baumgart-Getz, A., Prokopy, L. S., and Floress, K. (2012). Why farmers adopt best management practice in the United States: a meta-analysis of the adoption literature. J. Environ. Manage. 96, 17–25. doi: 10.1016/j.jenvman.2011.10.006
Bengochea Paz, D., Henderson, K., and Loreau, M. (2020). Agricultural land use and the sustainability of social-ecological systems. Ecol. Model. 437:109312. doi: 10.1101/2020.07.27.222422
Bracmort, K. S., Arabi, M., Frankenberger, J. R., Engel, B. A., and Arnold, J. G. (2006). Modeling long-term water quality impact of structural BMPs. Trans. ASABE 49, 367–374. doi: 10.13031/2013.20411
Burton, R. J. (2014). The influence of farmer demographic characteristics on environmental behaviour: a review. J. Environ. Manage. 135, 19–26. doi: 10.1016/j.jenvman.2013.12.005
Campbell, K. M., Boyer, C. N., Lambert, D. M., Clark, C. D., and Smith, S. A. (2021). Risk, cost-share payments, and adoption of cover crops and no-till. J. Soil Water Conserv. 76, 166–174. doi: 10.2489/jswc.2021.00027
Chouinard, H. H., Wandschneider, P. R., and Paterson, T. (2016). Inferences from sparse data: an integrated, meta-utility approach to conservation research. Ecol. Econ. 122, 71–78. doi: 10.1016/j.ecolecon.2015.11.019
Clean Water Act. (1972). Section 303(d) 33 U.S.C §§1251 et seq. of the Clean Water Act (Federal Water Pollution Control Act 1972).
Conner, D., Miller, J., Zia, A., Wang, Q., and Darby, H. (2016). Conjoint analysis of farmers' response to conservation incentives. Sustainability 8:684. doi: 10.3390/su8070684
Crystal-Ornelas, R., Thapa, R., and Tully, K. L. (2021). Soil organic carbon is affected by organic amendments, conservation tillage, and cover cropping in organic farming systems: a meta-analysis. Agric. Ecosyst. Environ. 312:107356. doi: 10.1016/j.agee.2021.107356
Daxini, A., Ryan, M., O'Donoghue, C., and Barnes, A. P. (2019). Understanding farmers' intentions to follow a nutrient management plan using the theory of planned behaviour. Land Use Policy 85, 428–437. doi: 10.1016/j.landusepol.2019.04.002
Del Rossi, G., Hecht, J. S., and Zia, A. (2021). A mixed-methods analysis for improving farmer participation in agri-environmental payments for ecosystem services in Vermont, USA. Ecosyst. Serv. 47:101223. doi: 10.1016/j.ecoser.2020.101223
Denny, R. C., Marquart-Pyatt, S. T., and Houser, M. (2019). Understanding the past and present and predicting the future: farmers' use of multiple nutrient best management practices in the Upper Midwest. Soc. Nat. Resour. 32, 807–826. doi: 10.1080/08941920.2019.1574045
Doran, E. M., Zia, A., Hurley, S. E., Tsai, Y., Koliba, C., Adair, C., et al. (2020). Social-psychological determinants of farmer intention to adopt nutrient best management practices: implications for resilient adaptation to climate change. J. Environ. Manage. 276:111304. doi: 10.1016/j.jenvman.2020.111304
Duke, J. M., Liu, H., Monteith, T., McGrath, J., and Fiorellino, N. M. (2020). A method for predicting participation in a performance-based water quality trading program. Ecol. Econ. 177:106762. doi: 10.1016/j.ecolecon.2020.106762
Farber, S., and Griner, B. (2000). Using conjoint analysis to value ecosystem change. Environ. Sci. Technol. 34, 1407–1412.
Fok, D., Paap, R., and Van Dijk, B. (2012). A rank-ordered logit model with unobserved heterogeneity in ranking capabilities. J. Appl. Econom. 27, 831–846. doi: 10.1002/jae.1223
Fraser, R. (2009). Land heterogeneity, agricultural income forgone and environmental benefit: an assessment of incentive compatibility problems in environmental stewardship schemes. J. Agric. Econ. 60, 190–201. doi: 10.1111/j.1477-9552.2008.00183.x
Gao, L., and Arbuckle, J. (2022). Examining farmers' adoption of nutrient management best management practices: a social cognitive framework. Agric. Human Values. 39, 535–553. doi: 10.1007/s10460-021-10266-2
Gedikoglu, H., and McCann, L. M. (2012). Adoption of win-win, environment-oriented, and profit-oriented practices among livestock farmers. J. Soil Water Conserv. 67, 218–227. doi: 10.2489/jswc.67.3.218
Green, P. E., and Srinivasan, V. (1978). Conjoint analysis in consumer research: issues and outlook. J. Consum. Res. 5, 103–123. doi: 10.1086/208721
Greiner, R., and Gregg, D. (2011). Farmers' intrinsic motivations, barriers to the adoption of conservation practices and effectiveness of policy instruments: empirical evidence from northern Australia. Land Use Policy 28, 257–265. doi: 10.1016/j.landusepol.2010.06.006
Hair, J. F., Anderson, R. E., Babin, B. J., and Black, W. C. (2010). Multivariate Data Analysis: A Global Perspective, Vol. 7. Upper Saddle River, NJ: Pearson.
Halbrendt, C., Wang, Q., Fraiz, C., and O'Dierno, L. (1995). Marketing problems and opportunities in mid-Atlantic seafood retailing. Am. J. Agric. Econ. 77, 1313–1318. doi: 10.2307/1243367
Hecht, J. S., Zia, A., Clemins, P. J., Schroth, A. W., Winter, J. M., Oikonomou, P. D., et al. (2022). Modeling the sensitivity of cyanobacteria blooms to plausible changes in precipitation and air temperature variability. Sci. Total Environ. 812:151586. doi: 10.1016/j.scitotenv.2021.151586
Helling, A. P., Conner, D. S., Heiss, S. N., and Berlin, L. S. (2015). Economic analysis of climate change best management practices in Vermont agriculture. Agriculture 5, 879–900. doi: 10.3390/agriculture5030879
Hou, D., O'Connor, D., Igalavithana, A. D., Alessi, D. S., Luo, J., Tsang, D. C., et al. (2020). Metal contamination and bioremediation of agricultural soils for food safety and sustainability. Nat. Rev. Earth Environ. 1, 366–381. doi: 10.1038/s43017-020-0061-y
Ice, G. (2004). History of innovative best management practice development and its role in addressing water quality limited waterbodies. J. Environ. Eng. 130, 684–689. doi: 10.1061/(ASCE)0733-9372(2004)130:6(684)
International Joint Commission (2020). Nutrient Loading and Impacts in Lake Champlain, Missisquoi Bay, and the Richelieu River. International Joint Commission. Available online at: https://www.ijc.org/en/lclm/nutrient-loading-and-impacts-lake-champlain-missisquoi-bay-and-lake-memphremagog (accessed April 6, 2022).
Januchowski-Hartley, S. R., Moon, K., Stoeckl, N., and Gray, S. (2012). Social factors and private benefits influence landholders' riverine restoration priorities in tropical Australia. J. Environ. Manage. 110, 20–26. doi: 10.1016/j.jenvman.2012.05.011
Kaijie, M. A., and Min, D. (2016). A study of statistical tests application to conjoint analysis. Int. J. Simul. Syst. Sci. Technol. 17, 6.1–6.6. doi: 10.5013/IJSSST.a.17.02.06
Kalish, S., and Nelson, P. (1991). A comparison of ranking, rating and reservation price measurement in conjoint analysis. Mark. Lett. 2, 327–335. doi: 10.1007/BF00664219
Kaye, J. P., and Quemada, M. (2017). Using cover crops to mitigate and adapt to climate change. A review. Agron. Sustain. Dev. 37:4. doi: 10.1007/s13593-016-0410-x
Kragt, M. E., and Robertson, M. J. (2014). Quantifying ecosystem services trade-offs from agricultural practices. Ecol. Econ. 102, 147–157. doi: 10.1016/j.ecolecon.2014.04.001
Lal, R., Smith, P., Jungkunst, H. F., Mitsch, W. J., Lehmann, J., Nair, P. R., et al. (2018). The carbon sequestration potential of terrestrial ecosystems. J. Soil Water Conserv. 73, 145A−152A. doi: 10.2489/jswc.73.6.145A
Li, H., Bennett, M. T., Jiang, X., Zhang, K., and Yang, X. (2017). Rural household preferences for active participation in “payment for ecosystem service” programs: a case in the miyun reservoir catchment, China. PLoS ONE 12:e0169483. doi: 10.1371/journal.pone.0169483
Liu, T., Bruins, R. J., and Heberling, M. T. (2018). Factors influencing farmers' adoption of best management practices: a review and synthesis. Sustainability 10:432. doi: 10.3390/su10020432
Lubell, M., and Fulton, A. (2008). Local policy networks and agricultural watershed management. J. Public Adm. Res. Theory 18, 673–696. doi: 10.1093/jopart/mum031
Marshall, D., Bridges, J. F., Hauber, B., Cameron, R., Donnalley, L., Fyie, K., et al. (2010). Conjoint analysis applications in health-how are studies being designed and reported? Patient Patient Centered Outcomes Res. 3, 249–256. doi: 10.2165/11539650-000000000-00000
Melchior, I. C., and Newig, J. (2021). Governing transitions towards sustainable agriculture-taking stock of an emerging field of research. Sustainability 13:528. doi: 10.3390/su13020528
Meyerding, S. G., Bauchrowitz, A., and Lehberger, M. (2019). Consumer preferences for beer attributes in Germany: a conjoint and latent class approach. J. Retail. Consum. Serv. 47, 229–240. doi: 10.1016/j.jretconser.2018.12.001
Morari, F., Berti, A., Dal Ferro, N., and Piccoli, I. (2019). “Deep carbon sequestration in cropping systems,” in Sustainable Agriculture Reviews 29, R. Lal and R. Francaviglia (Springer), 33–65. doi: 10.1007/978-3-030-26265-5_2
Motsinger, J., Kalita, P., and Bhattarai, R. (2016). Analysis of best management practices implementation on water quality using the soil and water assessment tool. Water 8:145. doi: 10.3390/w8040145
Næs, T., Kubberød, E., and Sivertsen, H. (2001). Identifying and interpreting market segments using conjoint analysis. Food Qual. Prefer. 12, 133–143. doi: 10.1016/S0950-3293(00)00039-2
Natural Resources Conservation Service (2017). Environmental Quality Incentives Program-Schedule of Payments. Natural Resources Conservation Service. Available online at: https://www.nrcs.usda.gov/wps/portal/nrcs/detail/national/programs/financial/?cid=nrcseprd1328416 (accessed January 15, 2022).
Natural Resources Conservation Service (2021). Environmental Quality Incentives Program-Schedule of Payments. Natural Resources Conservation Service. Available online at: https://www.nrcs.usda.gov/wps/portal/nrcs/detail/national/programs/financial/?cid=nrcseprd1328416 (accessed October 1, 2021).
Nguyen, T. T., Haider, W., Solgaard, H. S., Ravn-Jonsen, L., and Roth, E. (2015). Consumer willingness to pay for quality attributes of fresh seafood: a labeled latent class model. Food Qual. Prefer. 41, 225–236. doi: 10.1016/j.foodqual.2014.12.007
Norman, E. S., and Bakker, K. (2009). Transgressing scales: water governance across the Canada-US borderland. Ann. Assoc. Am. Geogr. 99, 99–117. doi: 10.1080/00045600802317218
Palm-Forster, L. H., Swinton, S. M., Lupi, F., and Shupp, R. S. (2016). Too burdensome to bid: transaction costs and pay-for-performance conservation. Am. J. Agric. Econ. 98, 1314–1333. doi: 10.1093/ajae/aaw071
Palm-Forster, L. H., Swinton, S. M., and Shupp, R. S. (2017). Farmer preferences for conservation incentives that promote voluntary phosphorus abatement in agricultural watersheds. J. Soil Water Conserv. 72, 493–505. doi: 10.2489/jswc.72.5.493
Parker, J. S., Moore, R., and Weaver, M. (2007). Land tenure as a variable in community based watershed projects: some lessons from the Sugar Creek Watershed, Wayne and Holmes Counties, Ohio. Soc. Nat. Resour. 20, 815–833. doi: 10.1080/08941920701460283
Paudel, K. P., Gauthier, W. M., Westra, J. V., and Hall, L. M. (2008). Factors influencing and steps leading to the adoption of best management practices by Louisiana dairy farmers. J. Agric. Appl. Econ. 40, 203–222. doi: 10.1017/S1074070800028066
Piñeiro, V., Arias, J., Dürr, J., Elverdin, P., Ibáñez, A. M., Kinengyere, A., et al. (2020). A scoping review on incentives for adoption of sustainable agricultural practices and their outcomes. Nat. Sustain. 3, 809–820. doi: 10.1038/s41893-020-00617-y
Poeplau, C., and Don, A. (2015). Carbon sequestration in agricultural soils via cultivation of cover crops-A meta-analysis. Agric. Ecosyst. Environ. 200, 33–41. doi: 10.1016/j.agee.2014.10.024
Power, A. G. (2010). Ecosystem services and agriculture: tradeoffs and synergies. Philos. Trans. R. Soc. B Biol. Sci. 365, 2959–2971. doi: 10.1098/rstb.2010.0143
Pradhananga, A. K., and Davenport, M. A. (2019). Predicting farmer adoption of water conservation practices using a norm-based moral obligation model. Environ. Manage. 64, 483–496. doi: 10.1007/s00267-019-01186-3
Prokopy, L. S., Floress, K., Arbuckle, J. G., Church, S. P., Eanes, F. R., Gao, Y., et al. (2019). Adoption of agricultural conservation practices in the United States: evidence from 35 years of quantitative literature. J. Soil Water Conserv. 74, 520–534. doi: 10.2489/jswc.74.5.520
Qi, G., Chen, S., Ke, L., Ma, G., and Zhao, X. (2020). Cover crops restore declining soil properties and suppress bacterial wilt by regulating rhizosphere bacterial communities and improving soil nutrient contents. Microbiol. Res. 238:126505. doi: 10.1016/j.micres.2020.126505
Rada, N. E., and Fuglie, K. O. (2019). New perspectives on farm size and productivity. Food Policy 84, 147–152. doi: 10.1016/j.foodpol.2018.03.015
Reimer, A. P., and Prokopy, L. S. (2014). Farmer participation in US Farm Bill conservation programs. Environ. Manage. 53, 318–332. doi: 10.1007/s00267-013-0184-8
Reimer, A. P., Weinkauf, D. K., and Prokopy, L. S. (2012). The influence of perceptions of practice characteristics: an examination of agricultural best management practice adoption in two Indiana watersheds. J. Rural Stud. 28, 118–128. doi: 10.1016/j.jrurstud.2011.09.005
Rockström, J., Williams, J., Daily, G., Noble, A., Matthews, N., Gordon, L., et al. (2017). Sustainable intensification of agriculture for human prosperity and global sustainability. Ambio. 46, 4–17.
Ryan, M., and Farrar, S. (2000). Using conjoint analysis to elicit preferences for health care. BMJ 320, 1530–1533. doi: 10.1136/bmj.320.7248.1530
Sanchez, M., and Gil, J. M. (1997). A conjoint analysis of quality wine: consumer preferences and market segmentation. J. Food Prod. Mark. 4, 63–78. doi: 10.1300/J038v04n02_05
Savage, J., and Ribaudo, M. (2016). Improving the efficiency of voluntary water quality conservation programs. Land Econ. 92, 148–166. doi: 10.3368/le.92.1.148
Sayadi, S., González-Roa, M. C., and Calatrava-Requena, J. (2009). Public preferences for landscape features: the case of agricultural landscape in mountainous Mediterranean areas. Land Use Policy 26, 334–344. doi: 10.1016/j.landusepol.2008.04.003
Schattman, R. E., Méndez, V. E., Merrill, S. C., and Zia, A. (2018). Mixed methods approach to understanding farmer and agricultural advisor perceptions of climate change and adaptation in Vermont, United States. Agroecol. Sustain. Food Syst. 42, 121–148. doi: 10.1080/21683565.2017.1357667
Sharpley, A. N., Daniel, T., Gibson, G., Bundy, L., Cabrera, M., Sims, T., et al. (2006). Best Management Practices to Minimize Agricultural Phosphorus Impacts on Water Quality, ARS-163. Washington, DC: USDA-ARS.
Sok, J., Borges, J. R., Schmidt, P., and Ajzen, I. (2021). Farmer behaviour as reasoned action: a critical review of research with the theory of planned behaviour. J. Agric. Econ. 72, 388–412. doi: 10.1111/1477-9552.12408
Tilman, D., Fargione, J., Wolff, B., D'antonio, C., Dobson, A., Howarth, R., et al. (2001). Forecasting agriculturally driven global environmental change. Science 292, 281–284. doi: 10.1126/science.1057544
U.S. Environmental Protection Agency Region 1 New England (2016). Phosphorus TMDLs for Vermont Segments of Lake Champlain. U.S. Environmental Protection Agency Region 1 New England. Available online at: https://www.epa.gov/tmdl/lake-champlain-phosphorus-tmdl-commitment-clean-water (accessed April 4, 2022).
Ulrich-Schad, J. D., Babin, N., Ma, Z., and Prokopy, L. S. (2016). Out-of-state, out of mind? Non-operating farmland owners and conservation decision making. Land Use Policy 54, 602–613. doi: 10.1016/j.landusepol.2016.02.031
US Bureau of Labor Statistics (2022). CPI Inflation Calculator. US Bureau of Labor Statistics. Available online at: https://www.bls.gov/data/inflation_calculator.htm (accessed April 6, 2022).
US Department of Agriculture National Agricultural Statistics Service (2019). Census of Agriculture 2017. US Department of Agriculture National Agricultural Statistics Service.
Varble, S., Secchi, S., and Druschke, C. G. (2016). An examination of growing trends in land tenure and conservation practice adoption: results from a farmer survey in Iowa. Environ. Manage. 57, 318–330. doi: 10.1007/s00267-015-0619-5
Wade, T., Claassen, R., and Wallander, S. (2015). Conservation-Practice Adoption Rates Vary Widely by Crop and Region. Economic Research Service USDA. Available online at: https://www.ers.usda.gov/publications/pub-details/?pubid=44030
Wang, Q., Thompson, E., and Parsons, R. (2015). Preferences for farmstead, artisan, and other cheese attributes: Evidence from a conjoint study in the Northeast United States. Int. Food Agribus. Manag. Rev. 18, 17–36. doi: 10.22004/ag.econ.204134
Wilson, R. S., Howard, G., and Burnett, E. A. (2014). Improving nutrient management practices in agriculture: the role of risk-based beliefs in understanding farmers' attitudes toward taking additional action. Water Resour. Res. 50, 6735–6746. doi: 10.1002/2013WR015200
Yoder, L., Ward, A. S., Dalrymple, K., Spak, S., and Lave, R. (2019). An analysis of conservation practice adoption studies in agricultural human-natural systems. J. Environ. Manage. 236, 490–498. doi: 10.1016/j.jenvman.2019.02.009
Zia, A., Bomblies, A., Schroth, A. W., Koliba, C., Isles, P. D., Tsai, Y., et al. (2016). Coupled impacts of climate and land use change across a river-lake continuum: insights from an integrated assessment model of Lake Champlain's Missisquoi Basin, 2000-2040. Environ. Res. Lett. 11:114026. doi: 10.1088/1748-9326/11/11/114026
Keywords: incentive designs, conjoint analysis, nutrient management practices, sustainable agriculture, watershed management
Citation: Ryan BEK, Shrum T and Zia A (2022) Assessing Farmer Incentives for Transitioning Toward Sustainable Agriculture and Provisioning of Clean Water. Front. Water 4:918035. doi: 10.3389/frwa.2022.918035
Received: 12 April 2022; Accepted: 23 May 2022;
Published: 01 July 2022.
Edited by:
Akhouri Pramod Krishna, Birla Institute of Technology, Mesra, IndiaReviewed by:
Suresh Chand Rai, University of Delhi, IndiaQiuqiong Huang, University of Arkansas, United States
Copyright © 2022 Ryan, Shrum and Zia. This is an open-access article distributed under the terms of the Creative Commons Attribution License (CC BY). The use, distribution or reproduction in other forums is permitted, provided the original author(s) and the copyright owner(s) are credited and that the original publication in this journal is cited, in accordance with accepted academic practice. No use, distribution or reproduction is permitted which does not comply with these terms.
*Correspondence: Benjamin E. K. Ryan, YmVyeWFuQHV2bS5lZHU=