 Charuka S. Meegoda
 Michael B. Waak
 Raymond M. Hozalski
 Taegyu Kim
 Cynthia Hallé
- 1Department of Civil and Environmental Engineering, Norwegian University of Science and Technology, Trondheim, Norway
- 2Water and Environment Group, Department of Infrastructure, SINTEF, Trondheim, Norway
- 3Department of Civil, Environmental, and Geo-Engineering, University of Minnesota, Minneapolis, MN, United States
Flushing is a common corrective action recommended by Legionella management guidelines to remove stagnant water and replenish disinfectant. Due to water age and different local regulations, buildings may receive water with low or no residual disinfectant. In such situations, the evidence for flushing efficacy is often anecdotal, and the benefits are poorly quantified. Using a pilot-scale premise plumbing system, flushed shower outlets were evaluated against non-flushed outlets during simulated periods of both active and low water demand. Water and biofilm concentrations of total bacteria, Legionella spp., and Vermamoeba vermiformis were quantified using real-time quantitative PCR. Even after all outlets returned to active water demand, flushed shower outlets continued to have lower quantities of Legionella compared to non-flushed outlets for several days, but the decrease was of little practical benefit (<0.5 log10[copies/L]). During prolonged periods of low water demand, however, there was no apparent benefit to flushing. Total bacteria grew to stationary phase within 3 ± 1 days, while Legionella spp. took 12 ± 6 days, regardless of whether the pipes had recently been flushed or not. Flushing with hot or cold water had little to no effect on the concentrations of total bacteria and Legionella in pipe wall biofilms. Flushing with cold water (9.6 and 13.2°C) decreased total bacteria concentrations in the water by 0.96 and 1.00 log10[copies/L], respectively and by 1.27 and 1.74 log10[copies/L] with hot water (49 and 60°C, respectively) but the difference in Legionella spp. concentrations between flushing with cold (1.55 log10[copies/L] for both) and hot water (1.32 to 1.88 log10[copies/L], respectively) was negligible. This suggests that hot water flushing, even at 60°C, provides little or no added benefit for managing Legionella in non-chlorinated building plumbing systems versus cold water flushing. Finally, the immediate benefits of flushing in terms of reductions in total bacteria and Legionella in the water were comparable as well as the rates at which those populations recovered during post-flush or post-shower stagnation.
1. Introduction
Several species of bacteria of the genus Legionella are well-known opportunistic pathogens that commonly occur in artificial and natural aquatic environments (Fliermans et al., 1981; Steinert et al., 2002). There is concern that Legionella present in natural water sources could pass through water treatment barriers and enter the drinking water distribution network, possibly with the help of free-living amoeba hosts such as Vermamoeba vermiformis (Thomas and Ashbolt, 2011; Boamah et al., 2017). Favorable conditions like warm temperatures and lack of disinfectant may facilitate the proliferation of Legionella in premise plumbing systems (Rhoads et al., 2016). Water users may then be at increased risk of exposure via inhalation of contaminated water droplets or aerosols, such as when showering (Bauer et al., 2008; Huang et al., 2020).
Legionella and especially L. pneumophila may cause legionellosis, including Legionnaires' disease, a severe form of pneumonia with a mortality rate of nearly 10 %, as well as the influenza-like Pontiac fever (Alarcon Falconi et al., 2018; Pereira et al., 2021). In recent years, legionellosis has been responsible for 1.5 to 2.0 deaths per 1 million people in developed countries (Pereira et al., 2021). In the United States, Legionella infections have increased by over 550 % since 2000 and now constitute the majority of waterborne disease outbreaks and associated deaths (Benedict et al., 2017; LeChevallier, 2019). Active planning and mitigation strategies are critical for protecting water users from legionellosis and other illnesses caused by opportunistic waterborne pathogens.
Though flushing is often prescribed as both a preventative and corrective action in many Legionella management guidelines, flushing procedures are inconsistent between guidelines and often insufficiently described (Van Kenhove et al., 2019). Common practices, however, include removing flow-impeding aerators and shower heads and running both cold and hot water at maximum velocity for at least 5 min (CDC, 2003). Legionella thrive at approximately 20 to 45°C but are vulnerable to various disinfectants (Kuchta et al., 1983; Huang et al., 2020; Zhang et al., 2021); thus, one rationale for preventative flushing is to replenish stagnant, lukewarm water devoid of disinfectant (e.g., due to decay) with “fresher” water containing disinfectant from the municipal distribution network (Hozalski et al., 2020).
Some buildings, however, may receive municipal drinking water with little or no residual disinfectant due to disinfectant demand in the distribution system (Li et al., 2019) or an operational decision to not use any residual disinfectant (Hydes, 1999; van der Kooij et al., 1999; Rosario-Ortiz et al., 2016). We are aware of only one study in the peer-reviewed literature concerning the effectiveness of flushing in a building supplied water without residual chlorine (Rhoads et al., 2022). The authors reported that flushing temporarily increased Legionella occurrence in the hot water, likely due to an influx of nutrients and detachment from the biofilm. As the bacteria are in a nutrient-limited environment (i.e., starvation) during stagnation (Chen et al., 2022), supplying nutrients via flushing might further deteriorate the microbiological water quality within the plumbing system, especially for water supplies that lack a residual disinfectant.
Furthermore, it is unclear whether a return to normal water usage in a formerly disused or stagnant building (e.g., showering, toilet flushing) is sufficient to restore microbiological water quality in the absence of flushing. In addition to the water and energy costs as well as personnel time and effort associated with flushing, recent work has suggested limited benefits to flushing for mitigating Legionella contamination (Greenwald et al., 2022; Rhoads et al., 2022).
Therefore, this study was performed to compare flushing and routine showering for mitigating Legionella in the absence of residual disinfectant. We simulated flushing and routine showering using a pilot-scale premise plumbing system in a controlled laboratory environment with different experimental conditions, including pipe material (copper vs. PEX-A) and hot water temperature (60 °C vs. 49 °C). Water and biofilm samples were collected from the pilot system and assessed via real-time quantitative polymerase chain reaction (qPCR) for selected genes targeting total bacterial biomass, Legionella spp., and V. vermiformis. Finally, growth of total bacteria and Legionella in unused pipes was modeled to estimate the time for these populations to reach stationary phase in both cold and hot water lines.
2. Materials and methods
2.1. Pilot system
A pilot-scale premise plumbing system was designed to study the effects of flushing on planktonic biomass in the bulk water and biomass adhered as biofilms to pipe surfaces. The pilot system consisted of two parallel rigs (rig 1 and rig 2), each with three full-scale shower installations (shower outlets A, B, and C) (Figure 1). The outlets included individual flow and temperature control knobs on wall-mounted shower mixers. All of the core piping in the system was comprised of copper pipe joined by compression fittings without solder.
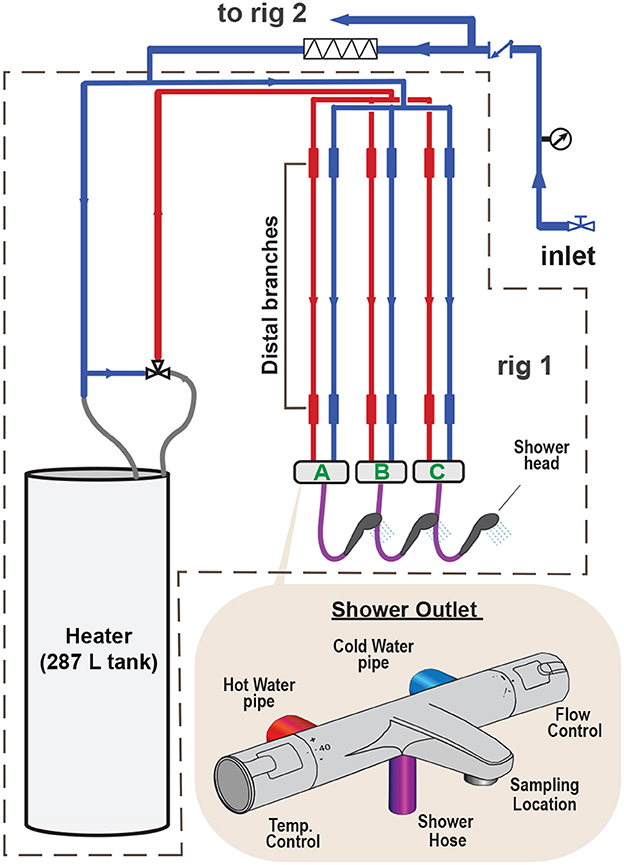
Figure 1. Conceptual schematic of the pilot-scale premise plumbing system, which consisted of two independent rigs in parallel.
The distal branches (Figure 1) were 1 m in length and 5/8 inch nominal diameter, comprised of either copper (rig 1; internal diameter 15.9 mm) or Uponor Aqua PEX-A (rig 2; internal diameter 12.5 mm). The pilot system was supplied with municipal drinking water (via the building cold water supply) from a 1 inch diameter copper pipe. A hygienic check valve (NS-EN 1717:2000, Category 5) was installed to prevent backflow into the building water supply. Each rig had an independent electric water heater with a capacity of 287 L. The water heaters were set to 85 °C to minimize the potential for Legionella spp. colonization of the heaters. The temperature of the hot water delivered to the rigs was controlled by a thermostatic mixing valve (ESBE VAT321, Sweden). The thermostatic mixing valves were set at either 60 °C or 49 °C, where hot water from the water heater (85 °C) was mixed with cold water (9.6 °C or 13.2 °C, respectively) at a ratio of 3:7 and 1:1 (hot: cold), respectively.
When performing a flush, the shower outlet hose was disconnected from the mixer, and the water was turned to the maximum flow rate (15.7 to 17.5 L/min). Hot and cold water lines were flushed independently for 5 min each. During a shower, the shower outlet hose and head were intact and the water temperature and flow rate were set to 40°C and 7.2 L/min, respectively. The shower duration was 8 min. During stagnation, no actions were performed (except for sample collection). Table 1 summarizes the experimental variables. Measured flow rates and calculated values of Reynolds number and wall shear stress are provided in Supplementary Table 5.
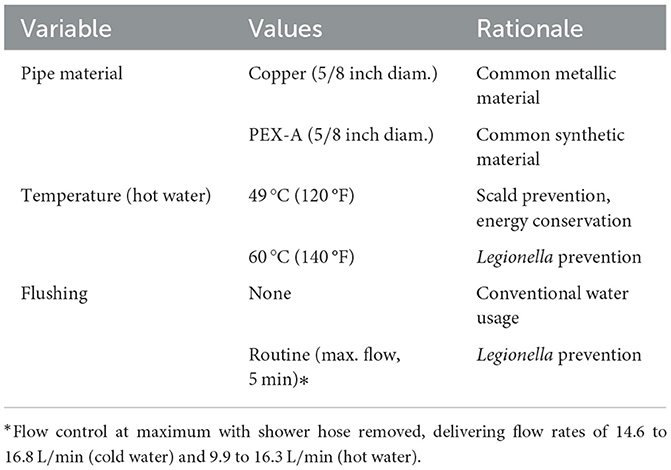
Table 1. Experimental variables.
The pilot system underwent an acclimation period of 4 months before experiments began. During this period dissolved copper concentration was monitored weekly (Supplementary Figure 1). The complete experimental plan is shown in Supplementary Figure 2. The two pipe materials (i.e., copper and PEX) were tested simultaneously using the parallel rigs while two hot water temperatures (i.e., 60 and 49 °C) were tested sequentially in phases 1 and 2, respectively.
During a phase, each combination of factors (i.e., pipe material, temperature, and flushing) was evaluated in three sequential experimental cycles. Each cycle started with an experimental event where one shower outlet was subjected to a flush, and the other two shower outlets acted as controls where one outlet experienced a shower (i.e., non-flushed) while the other outlet was inactive (i.e., stagnant) (Figure 2). After the experimental event, the flushed shower outlet and the non-flushed shower outlet were subjected to daily showering for the next 4 days (t= 4 d) to simulate a period of active water demand in a building. Then, the flushed and non-flushed shower outlets underwent a period of stagnation (10–21 days) to simulate low or no water demand. The stagnant control shower outlet was inactive throughout the experimental cycle except during sample collection.
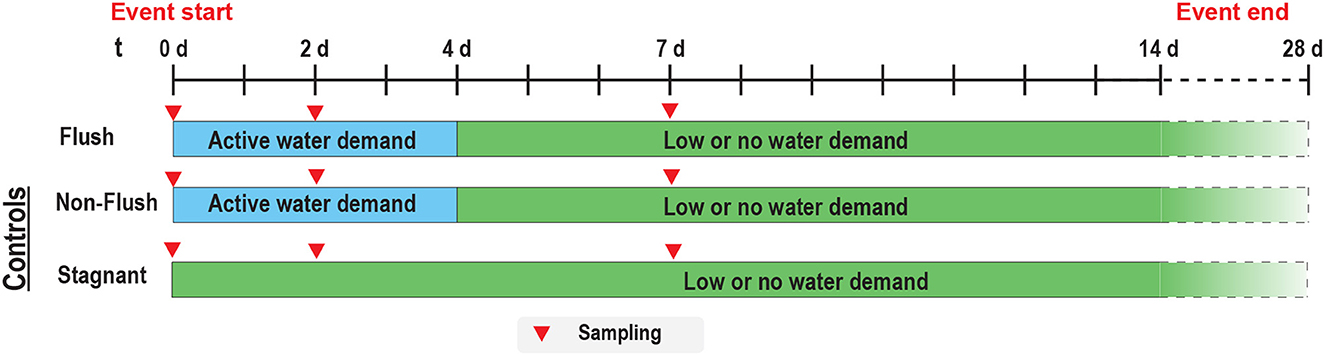
Figure 2. The timeline and sampling frequency for an experimental cycle for a shower outlet that was initially flushed (flush) and controls including a shower outlet subjected only to showering (non-flushed) and a shower outlet subjected only to sampling (stagnant).
2.2. Feed water
The pilot-scale plumbing system was supplied with treated surface water from a municipal drinking water system that does not maintain a disinfectant residual throughout the distribution network. Limited land use in the watershed of the drinking water reservoir contribute to consistently high quality raw water throughout the year. The intake is located at a depth of 50 m and water is hardened by passing through beds of granular limestone (i.e., calcium carbonate) for corrosion control, disinfected with free chlorine followed by medium-pressure ultraviolet light irradiation (40 mJ/cm2). The finished water contains a very low concentration of free chlorine (0.08±0.01 mg/L as Cl2). Final water quality is summarized in Table 2.
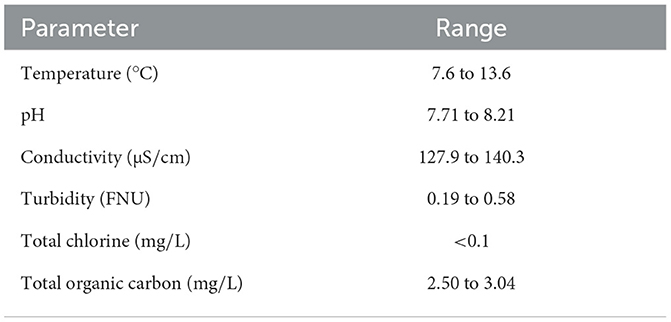
Table 2. Pilot feed water quality.
2.3. Sample collection
Water samples were aseptically collected from the pilot system in sterile Whirl-PakⓇ Stand-Up Bags (Nasco; Fort Atkinson, Wisconsin). At the start of an experiment (t= 0 d), hot and cold water samples (150 mL, n = 12) were collected from every outlet (Figure 2). For the flushed shower outlet, additional hot and cold water samples (1 L, n = 4) were collected immediately after flushing (t= 0 d). Additional water samples were collected from every shower outlet on t= 2 and 7 d (Figure 2) during an experimental cycle. On day 2 (t= 2 d in Figure 2), additional hot and cold water samples (1 L) were collected (n = 4) from the flushed shower outlet immediately after daily showering (sampling location shown in Figure 1). Immediately after water sample collection, aliquots were removed for measurement of pH, conductivity, total organic carbon (TOC), total chlorine, and temperature. The remainder was stored in the dark in a refrigerator at 4 °C until further processing. Additional sample collection details are provided in the Supporting Information.
Biofilm samples were collected 4–5 h after an experimental event (i.e., a flush or shower; t= 0 d in Figure 2). The biofilm sampling method is presented in Supplementary Figure 3. Briefly, an 8 cm2 piece of sterile POLYWIPE™ sponge was aseptically attached to a flame sterilized steel loop which was then inserted into an electric drill. The distal branches of the hot and cold water lines (n = 12) were drained and the bottom (i.e., shower outlet end) of each branch segment was detached from the copper feed line. The loop/sponge assembly was carefully inserted into the pipe and rotated for 30 s clockwise and then 30 s counterclockwise. The loop/sponge assembly was removed from the pipe and the sponge was immediately placed in a Whirl-PakⓇ bag containing 50 mL of sterile elution solution (0.1 g L sodium polyphosphate, 0.1 mL/L Tween™ 80, and 0.01 mL/L Y-30 antifoaming agent as described in Rhodes et al., 2012). The Whirl-PakⓇ was sonicated for 2 min, and the elution solution was released from the sponge by squeezing and then transferred to a new Whirl-PakⓇ bag. A second 50 mL aliquot of elution solution was added to the bag containing the sponge, again the sponge was squeezed, and the solution transferred to the other Whirl-PakⓇ bag. The entire volume of elution solution (100 mL) was processed as a water sample, as described below.
2.4. Sample processing
The microbial biomass was collected from the water samples in preparation for DNA extraction via vacuum filtration (0.22 μm pore size and 47 mm diameter mixed cellulose ester membrane filters; Millipore-Sigma; Burlington, Massachusetts). After filtration, the filter membranes were aseptically cut into 5 mm squares and placed in ZR BashingBead™ Lysis tubes containing 1.000 μL DNA/RNA Shield (Zymo Research Corp.; Irvine, California), and stored at -20 °C until DNA extraction. Negative control filters were prepared by filtering 1 L of autoclaved MilliQ water or 100 mL of eluting solution (for biofilm samples). DNA was extracted and preserved using ZymoBIOMICS DNA Miniprep kit (Zymo Research) as described in Meegoda et al. (2022).
2.5. Real-time qPCR
Marker genes were targeted by qPCR to quantify total bacteria (16S rRNA gene), genus Legionella (ssrA), L. pneumophila (mip), and V. vermiformis (18S rRNA gene) using reaction conditions and amplification protocols described previously (Meegoda et al., 2022) and summarized in Supplementary Table 2. Reference targets (Supplementary Table 3) used for standard curves were synthesized as gBlocks™ gene fragments (Integrated DNA Technologies, Inc.; Skokie, Illinois), and a summary of standard curves is shown in Supplementary Table 4.
For the 16S rRNA gene, the limit of quantification (LOQ) was defined as the sum of the mean and 10-times the standard deviation of the negative controls (n = 22, 1.9 × 10³ copies/reaction). For the other gene targets, the method LOQ was defined as the lowest concentration in the standard curve, 10 copies/reaction, normalized to the surface area (biofilms) or filtrate volume (water). A melt curve analysis was performed to filter out non-specific amplification of 18S rRNA gene targets using the qpcR package (Spiess, 2018). For V. vermiformis, 18S rRNA gene copy numbers were converted to number of cells using the factor reported by Kuiper et al. (2006) (1330 copies/cell).
2.6. Data analysis
The effects of flushing and stagnation on gene marker concentrations were determined using statistical packages in R such as stats, emmeans, tidyverse, and car. Statistical methods and hypotheses are provided in the Supplementary material. Biomass concentrations during periods of stagnation (i.e., low or no water demand) were fit to the Baranyi model (without lag phase) (Baranyi and Roberts, 1994) using the nlsMicrobio package in R (Baty and Delignette-Muller, 2014). Additional details are provided in the Supplementary material.
3. Results
3.1. Water quality
Water temperatures stabilized within 2 minutes of opening the shower mixing valves (Supplementary Figure 4). During flushing, water from the cold lines differed in temperature between the two phases (p < 0.001, ANOVA), stabilizing to 9.6 ± 1.9°C in phase 1 and 13.2 ± 0.3°C in phase 2 (mean ± SD) due to seasonal variation. Hot water stabilized at 59.9 ± 0.6°C (phase 1 target = 60 °C) and 47.5 ± 0.6°C (phase 2 target = 49 °C). During simulated showers, the blended cold/hot water stabilized at 41.0 ± 0.5°C (target = 40 °C; no difference between phases, p = 0.246 via ANOVA).
The pH statistically differed based on the pipe material (p = 0.012, ANOVA), water in contact with PEX-A had an average of 7.94±0.04, while water in contact with copper has a pH of 8.08±0.04. TOC ranged between 2.46 to 3.25 mg/L and was not affected by any experimental variable. The turbidity was below 1 FNU on average in the pilot system and was not affected by any experimental variable. However, turbidity decreased after showers (0.50 ± 0.03 FNU before vs. 0.29 ± 0.04 FNU after; p < 0.001). Similarly, conductivity was not affected by any experimental variable. However, the conductivity differed between the two phases (p < 0.001, ANOVA), stabilizing to 131.3 ± 0.2μS/cm in phase 1 and 137.3 ± 0.3μS/cm in phase 2.
3.2. Microbiological biomass in the pilot system water supplies
During the experimental period, total bacteria (16S rRNA genes) and Legionella spp. (ssrA) concentrations in the pilot feed water did not vary significantly during the study (7.93±0.10 and 4.68±0.20 log10[copies/L], respectively). Within the pilot system, there were often significant differences in gene target concentrations between the cold and hot water supplies. The total bacteria concentration in phase 1 hot water (target = 60 °C) was on average 0.75 log10[copies/L] lower than that for cold water (p < 0.001), and the total bacteria concentration for phase 2 hot water (target = 49 °C) was 0.31 log10[copies/L] lower than that for cold water (p < 0.001). Similarly, Legionella spp. were 0.92 log10[copies/L] lower in phase 1 hot water as compared to the cold water (p = 0.001), but during phase 2, the difference was not significant (p = 0.06; 4.57 log10[copies/L] in hot water vs. 4.74 log10[copies/L] in cold). Neither L. pneumophila (mip) nor V. vermiformis (18S rRNA genes) were detected by qPCR in any water samples.
3.3. Overview of microbiological biomass in the pilot system water
Suspended total bacterial and Legionella spp. concentrations in the water at the start of phase 2 and during the three active and low water demand cycles of a flushed and a non-flushed shower outlet are shown in Figures 3, 4, respectively. The results from experimental phase 1 are shown in Supplementary Figures 6, 7. Experimental variables (vertical axis of Figures 3, 4) included water supply (cold/unheated vs. hot [phase 1: 60°C; phase 2: 49°C]), pipe material of the distal pipe branch (copper vs. PEX-A), and preventative intervention (flush vs. non-flush). Each experimental cycle started with a flushing event, and then the water was monitored intermittently during active water demand (i.e., with a single 8 min shower per outlet per day). Monitoring included the stagnant/overnight water (water age = 1 d; top horizontal axis) and fresh water (water age = 0 d) after a shower. During each cycle's low water demand period (t > 4 d in Figure 5), stagnant water was collected with different water ages. The results from stagnant shower outlets are shown separately in Supplementary Figures 8, 9 as they experienced a different operation procedure relative to the other two shower outlets.
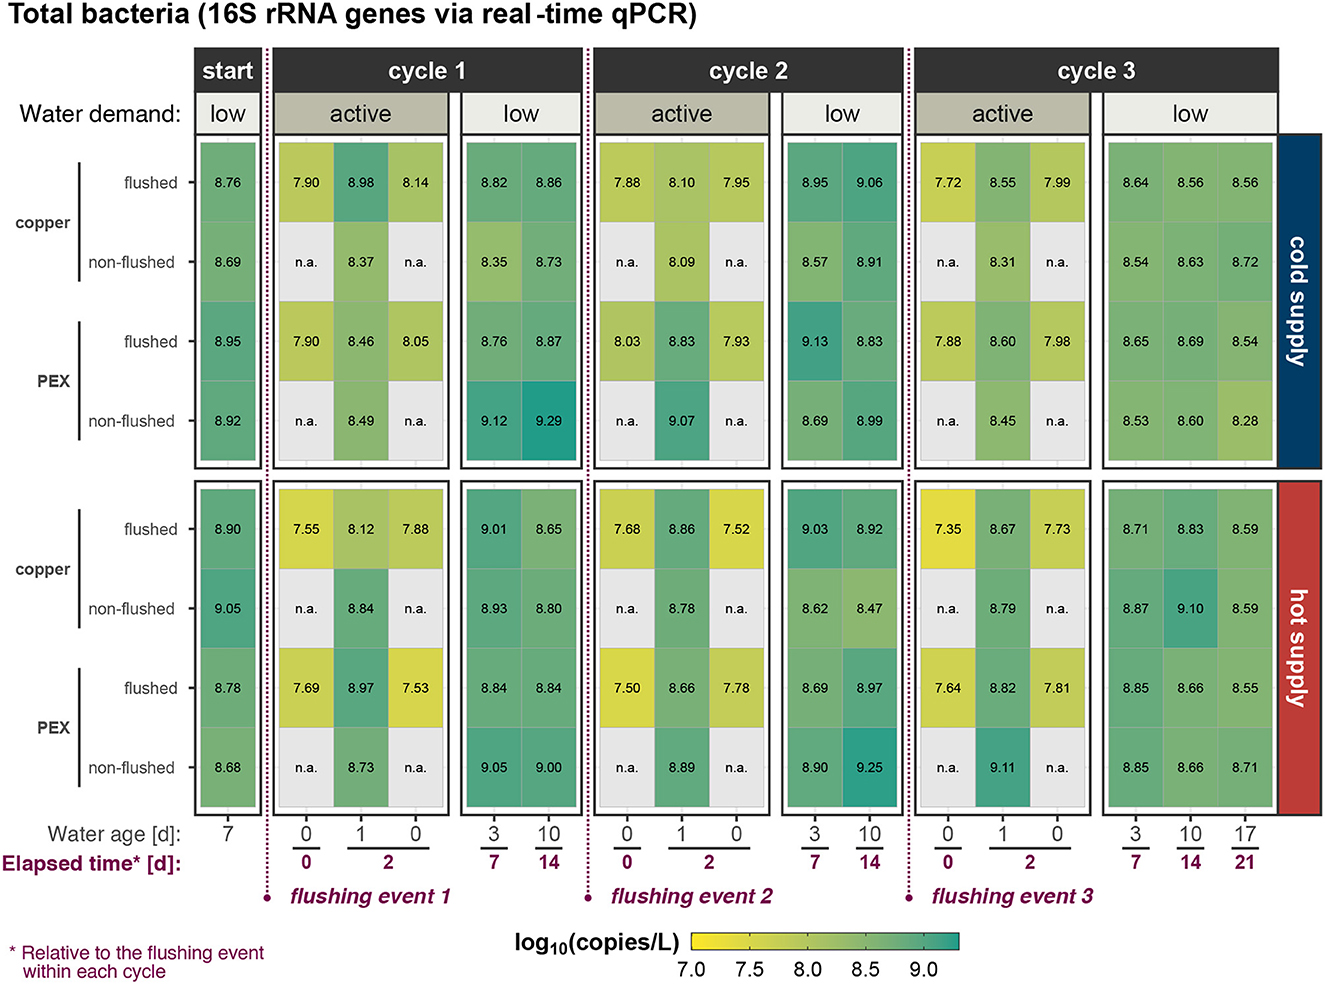
Figure 3. Suspended total bacterial concentration (measured as 16S rRNA genes) in water at phase start and during the three active/low water-demand cycles within experimental phase 2 in flushed and non-flushed pipes.
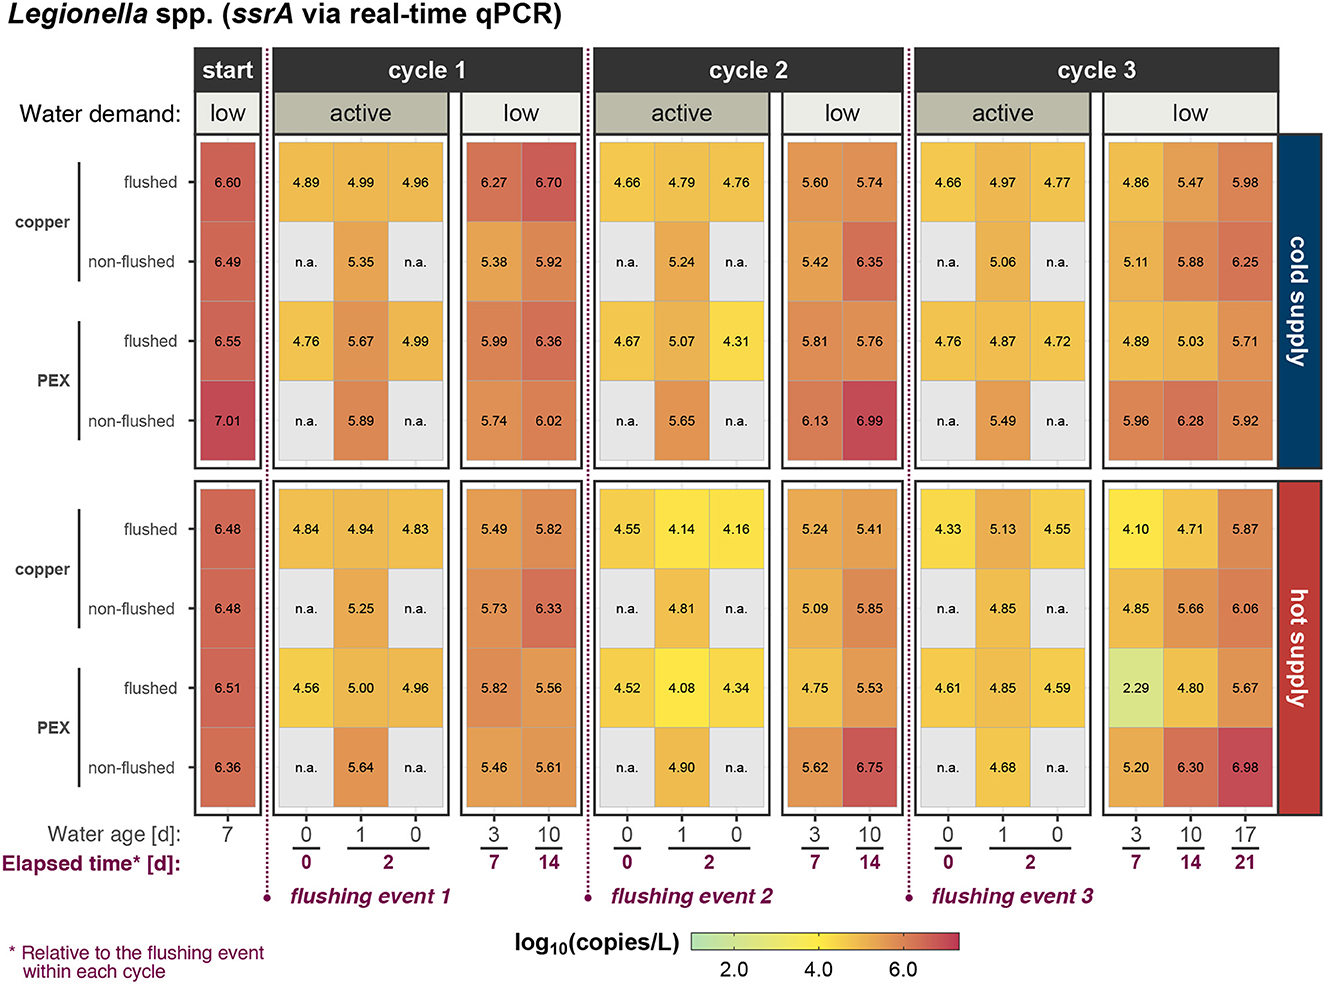
Figure 4. Suspended Legionella spp. concentration (measured as ssrA genes) in water at phase start and during the three active/low water-demand cycles within experimental phase 2.
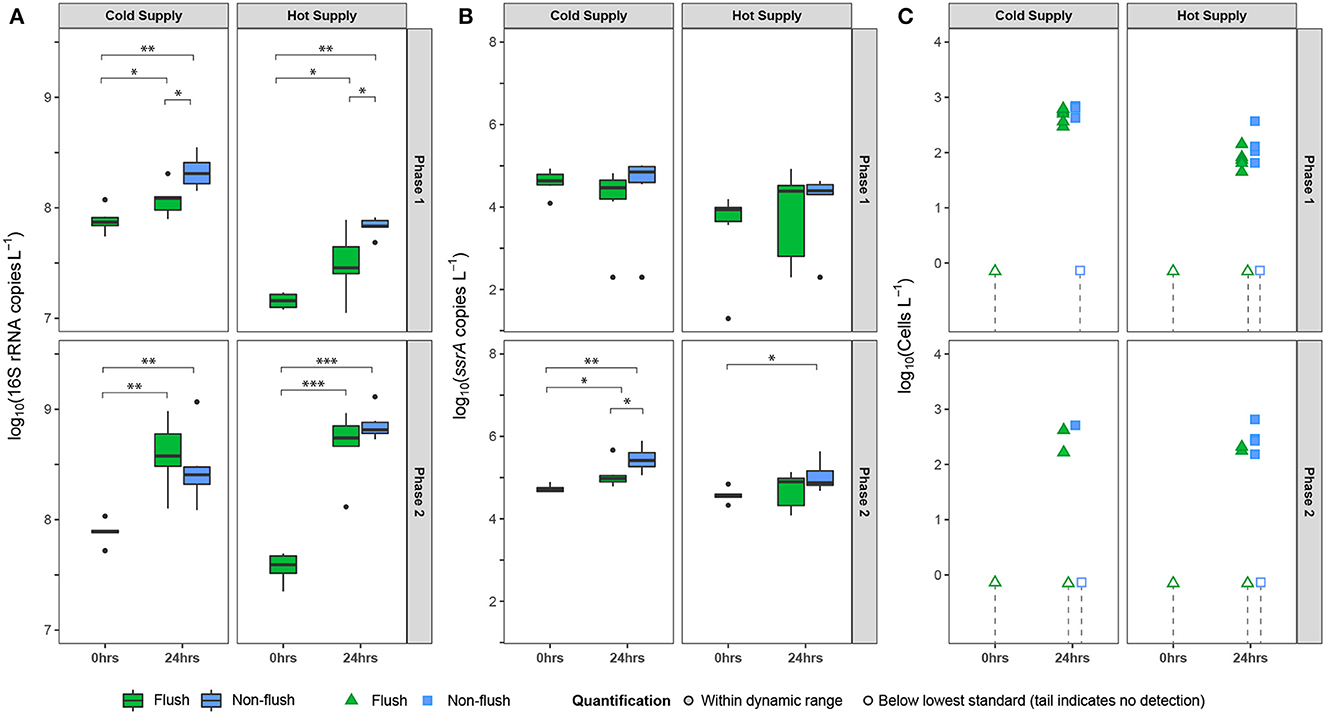
Figure 5. Gene markers (via qPCR) indicating water phase concentrations of (A) total bacteria (16S rRNA genes), (B) Legionella spp. (ssrA), and (C) V. vermiformis (18S rRNA converted to cells/L) in the cold- or hot-water supply of the pilot-scale premise plumbing system, immediately after operating the showers (0 h) and 24 h after operating the showers. Significance codes for p: “***” ≤ 0.001; “**” ≤ 0.01; “*” ≤ 0.05 shows the contrasts between flush and non-flush lines.
For both 16S rRNA and ssrA, a reduction of gene copies after a flushing event was observed. A detailed statistical analysis of the immediate effects of flushing is shown in section 3.4. During the period of active water demand, gene target concentrations were lower than during the low water demand period. The 16S rRNA gene concentration increased during the first few days (not shown) and then stabilized (Figure 3), while the ssrA gene concentration during the low water demand periods tended to increase with the water age (Figure 4). Detailed results of the active water demand and low water demand periods are discussed in Sections 3.5 and 3.6, respectively.
3.4. Immediate effects of flushing on suspended biomass
Flushing immediately reduced accumulated total bacteria and Legionella spp. concentrations in the pilot system water (Table 3). Flushing with cold water decreased total bacteria by about 1.0 log10[copies/L] in both experimental phases, equivalent to a reduction of 90 %. Similarly, Legionella spp. decreased by about 1.6 log10[copies/L] (97 %). Flushing with hot water decreased total bacteria by 1.7 and 1.3 log10[copies/L] while reductions of Legionella spp. were 1.9 and 1.3 log10[copies/L] during phase 1 (60 °C) and phase 2 (49 °C), respectively.
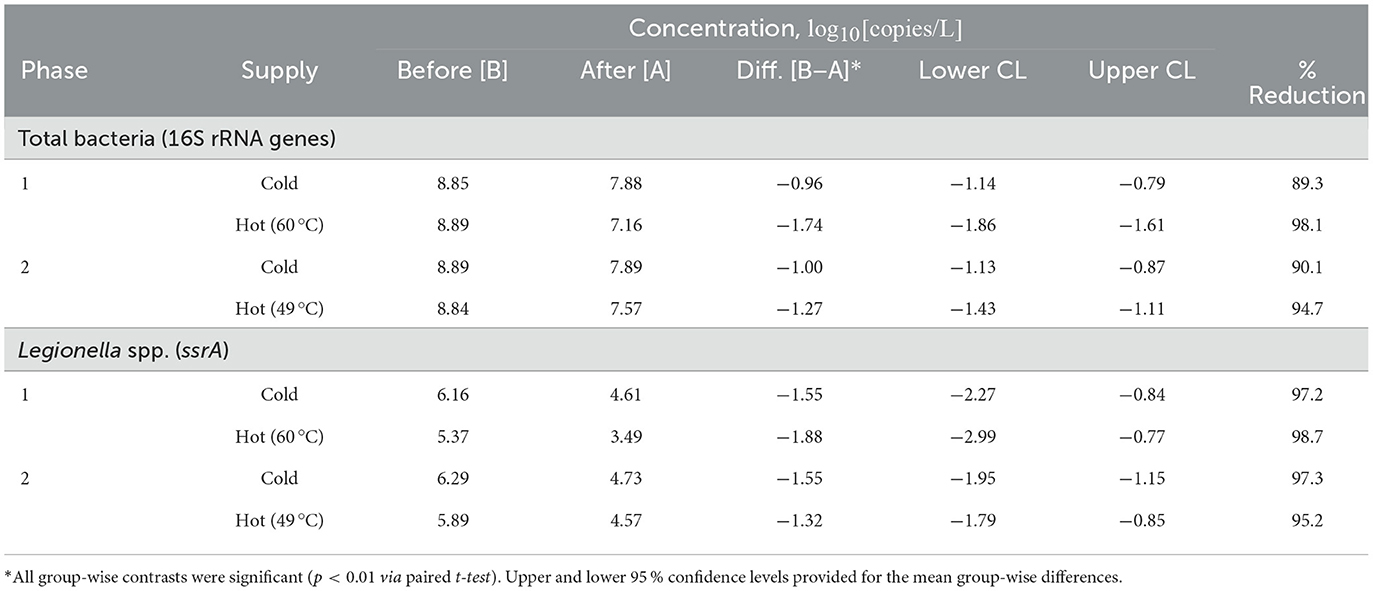
Table 3. Total bacteria and Legionella spp. concentrations in water before and immediately after flushing.
3.5. Period of active water demand
The active water demand period simulates shower outlets that are in active use and was investigated for both the flushed and non-flushed showers. The change in microorganism concentrations in the hot and cold water pipes over the 24 h stagnation period between showers is shown in Figure 5, and the data are summarized in Supplementary Table 7. No results for the stagnant shower outlets are shown in Figure 5 as there was no active water demand. The time 0 h and time 24 h samples were all collected at t = 2 d (in Figure 2), with the 24 h stagnation time sample collected first, followed by a shower, then the 0 h sample was collected. The time 0 h (i.e., no stagnation) gene target concentrations were stable during an experimental phase (Phase 1: Supplementary Figure 10 and Phase 2: Supplementary Figure 11).
The total bacteria concentration in the hot water supply at time 0 h (i.e., immediately after shower) was lower than that for the cold water supply in both Phase 1 and Phase 2 (Figure 5). In addition, the hot water total bacteria concentration at time 0 h was lower when the hot water was 60 °C (Phase 1) as compared to when the hot water was 49 °C (Phase 2), while the cold water concentrations at time 0 h were similar for both phases. As shown in Figure 5, time 0 h samples were only collected from the flushed showers. Nevertheless, total bacteria and Legionella spp. concentrations immediately after a flush (t = 0 in Figure 2) were statistically similar to concentrations in samples collected immediately after a shower at t = 2 d (p = 0.36 and 0.91 via ANOVA, Legionella spp. and total bacteria), suggesting that the concentrations for the time 0 h flushed and non-flushed lines, representing “fresher” water from the city water supply or hot water heater, are similar. After 24 h of stagnation, total bacteria concentrations in both the hot and cold water lines had significantly increased compared to 0 h (Figure 5).
The Legionella spp. concentration did not significantly increase after a short period of stagnation (24 h) in hot (flush: p = 0.64; shower: p = 0.31) and cold (flush: p = 0.27; shower: p = 0.69) water of both flushed and non-flushed pipes during phase 1 (Figure 5 and Supplementary Table 7). Similarly, in phase 2, the Legionella spp. concentration did not significantly increase in hot water of the flushed pipes (p = 0.55). However, Legionella spp. notably increased in both the hot and cold water of the non-flushed pipes (cold: p < 0.01; hot: p = 0.02) and in the cold water of the flushed pipes (p = 0.03) during phase 2. Moreover, the Legionella spp. accumulation in the cold water was lower in the flushed pipes (0.32 log10[copies/L]) than in the non-flushed pipes (0.71 log10[copies/L], p = 0.04). In the stagnant shower outlet, during phase 2, the Legionella spp. concentration significantly increased over the 48 h stagnation period (from t= 0–2 d) in the cold (0.91 log10[copies/L], p < 0.01) and the hot (0.78 log10[copies/L], p < 0.01) water lines.
V. vermiformis was never detected immediately after a shower. However, V. vermiformis was frequently detected in water samples before a shower (i.e., after 24 h of stagnation) during the active water demand period. The detection frequency was higher during phase 1 (19/24) than phase 2 (9/24). The lowest and highest detection frequencies were observed in the cold water during phase 2 (3/12) and phase 1 (10/12), respectively.
The total bacterial concentration was significantly lower in both cold and hot water of flushed pipes than the non-flushed pipes during phase 1 (Supplementary Table 8). The difference was more prominent in the hot water (shower − flush = 0.34 log10[copies/L], p = 0.019) than the cold water (shower − flush = 0.25 log10[copies/L], p = 0.014). However in phase 2, the total bacterial concentration was statistically similar between the flushed and controls in both hot (p = 0.87, ANOVA) and cold water (p = 0.92, ANOVA).
Legionella spp. concentrations in both flushed and non-flushed pipes were similar in both cold (p = 0.638) and hot (p = 0.64) water during phase 1. However, in phase 2, the Legionella concentration in the cold water-flushed pipes was significantly less than in the stagnant pipes (flush − stagnant = -0.59 log10[copies/L], p = 0.004) and the non-flushed pipes (flush − shower = -0.39 log10[copies/L], p = 0.042). For cold water, the difference in Legionella concentration between non-flushed and stagnant pipes was not significant (p = 0.267). For hot water, the Legionella concentration significantly differed between the flushed and the stagnant pipes (flushed − stagnant = -0.66 log10[copies/L], p = 0.009). However, the differences between the flushed vs. non-flushed and non-flushed vs. stagnant (p = 0.151) pipes were insignificant. Furthermore, routine flushing did not effect the V. vermiformis detection frequency (flushed: 15/24; non-flushed: 13/24; stagnant: 16/24).
3.6. Period of low or no water demand
The period of low or no water demand was used to simulate a time of building inactivity and lasted 14 days in phase 1 and 24 days in phase 2. For the flushed and non-flushed showers, this period started after 4 days of active water demand (i.e., t = 4 d in Figure 2). For the stagnant shower lines, the low water demand period started after biofilm sampling at t = 0 d. During this period of low or no water demand, the only withdrawal of water from the showers was for sampling. The initial concentrations of bacteria (16S rRNA genes) ranged between 7.97 and 7.17 log10[copies/L] and Legionella spp. (ssrA genes) between 4.62 and 3.91 log10[copies/L] (Figure 6). Concentrations of bacteria and Legionella spp. at the start of the low or no demand period were consistently lower in samples collected from the hot water lines than in samples from the cold water lines.
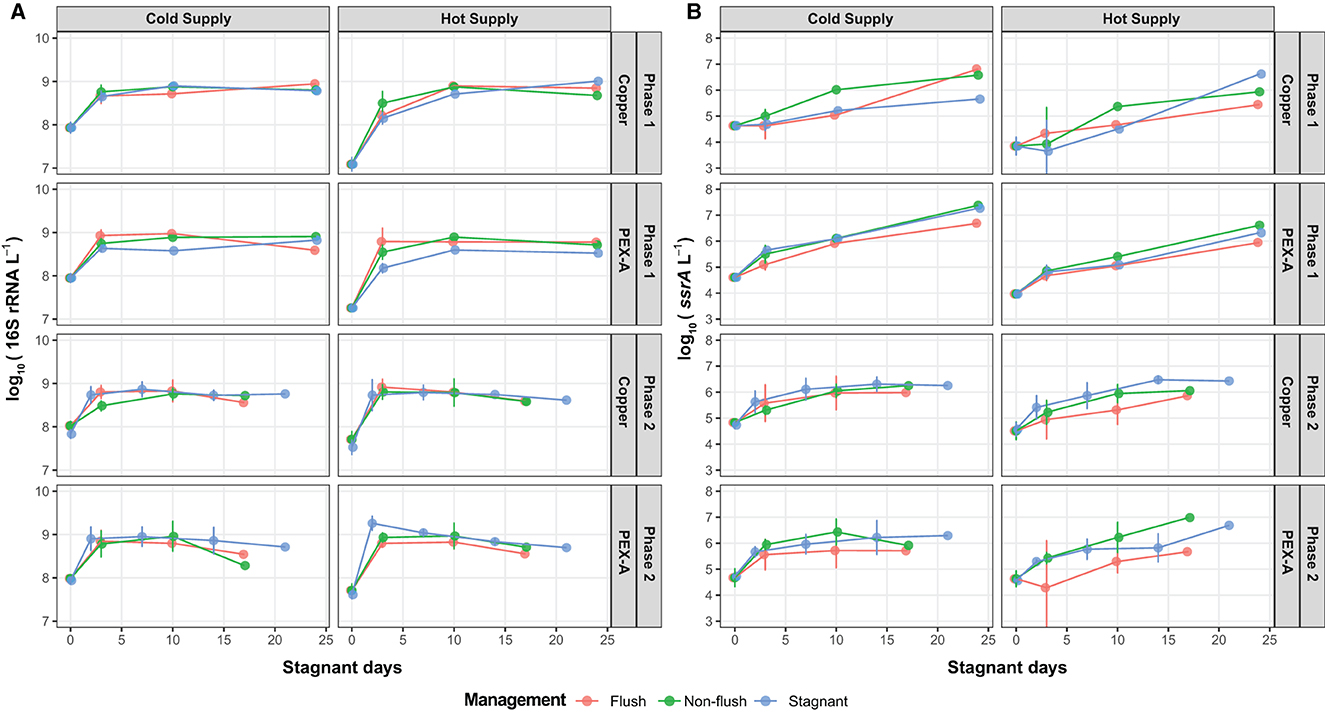
Figure 6. Genetic target concentrations (as log10[copies/L]) during the period of low water demand for routinely flushed pipes and non-flushed (conventional shower and stagnant) pipes: (A) Total bacteria (as 16S rRNA genes), (B) Legionella spp. (as ssrA genes).
Bacteria concentrations increased to reach stationary phase (i.e., the carrying capacity) between 8.60 and 8.90 log10[copies/L] within 10 days of stagnation. Then, the concentrations stabilized or decreased during the remainder of the stagnation period. Legionella spp. concentrations, however, increased steadily throughout the period of low water demand and never plateaued to indicate stationary phase. The growth models estimated a carrying capacity for Legionella spp. between 5.49 and 7.39 log10[copies/L] (Figure 6B).
During the periods of low or no water demand, the growth kinetics of total bacteria and Legionella spp. concentrations were modeled using the model of Baranyi and Roberts (1994)—without a lag phase, as no lag periods were apparent in the data. The estimated parameters (Table 4) included the initial concentration of biomass in the water phase (N0), maximum concentration at stationary phase (Nmax), and maximum specific growth rate (μmax). The mean μmax for total bacteria (1.30 day−1) was significantly greater than that for Legionella spp. (0.54 day−1) (p < 0.001, paired t-test).
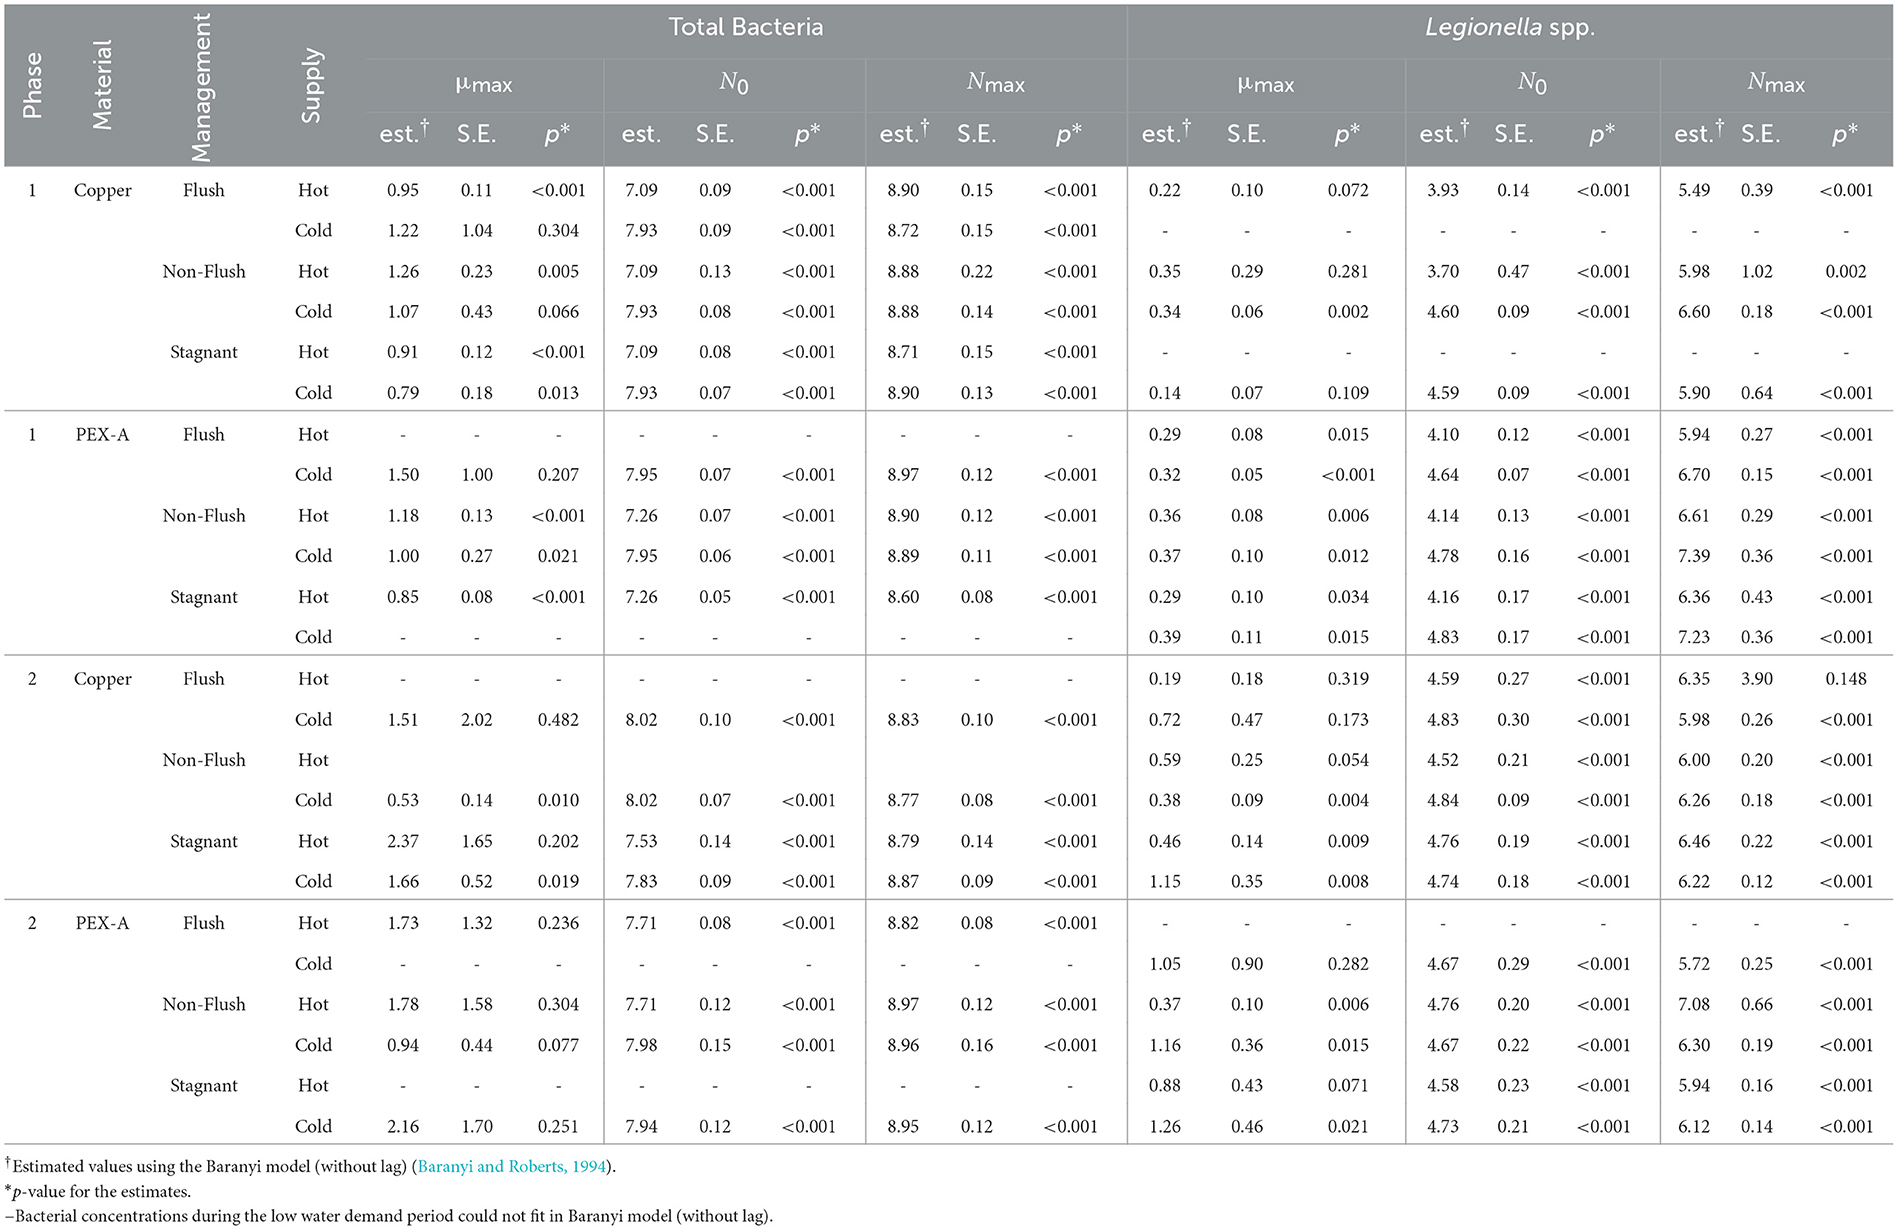
Table 4. Estimated maximum specific growth rate (μmax), starting concentration (N0), maximum accumulation of biomass in the water phase (Nmax) of total bacteria and Legionella spp. during the stagnation period.
The estimated kinetic parameters (μmax, N0, and Nmax) for total bacteria (Supplementary Table 9) and Legionella spp. (Supplementary Table 10) were similar regardless of whether the water samples were collected from the hot or cold water supplies and regardless of the hot water set temperature (60 °C vs. 49 °C) (Supplementary Table 12). Significant differences existed in the estimated growth parameters over the 3 shower outlets (flushed vs. non-flushed vs. stagnant) during some experimental combinations (Supplementary Table 11). However, post hoc tests on those combinations confirmed that variations between pairs of shower outlets (e.g., flushed vs. non-flushed) were not statistically significant. Similarly, pipe material (PEX-A vs. copper) did not appear to affect growth (Supplementary Table 13), with one exception—μmax for cold-water Legionella spp. in the non-flushed shower outlet during Phase 2 (Copper − PEX-A: difference = -0.78 log10[copies/L]; p = 0.03).
Due to the asymptotic estimation of Nmax, concentrations at 98 % or more of Nmax were considered at the stationary phase of bacterial growth. The estimated duration for total bacteria and Legionella to reach the stationary phase is summarized in Table 5. On average, Legionella spp. reached stationary phase in 12 ± 6 days. In contrast, total bacteria reached stationary phase in significantly less time (3 ± 1 days, Welch t-test p < 0.001). During phase 1, the time for total bacteria to reach stationary phase in the hot water lines (5 ± 1 days) was significantly longer than for that in the cold water lines (3 ± 1 days). However, such a difference was not observed in phase 2 between the two water supplies for total bacteria (p = 0.34). In contrast, the time for Legionella spp. to reach stationary phase was statistically similar for the cold and hot water lines for both phase 1 (p = 0.078) and phase 2 (p = 0.12). Similarly, the time for total bacteria to reach stationary phase in cold water was the same (3 days) during phases 1 and 2. However, in hot water, the time for total bacteria to reach stationary phase was significantly longer (p < 0.01) in phase 1 (5 days) than in phase 2 (2 days). In contrast, the time for Legionella spp. to reach stationary phase was significantly longer in phase 1 than in phase 2 for both the cold water lines (18 ± 1 days vs. 6 ± 3 days; p < 0.001) and hot water lines (19 ± 0 days vs. 10 ± 5 days; p = 0.03).
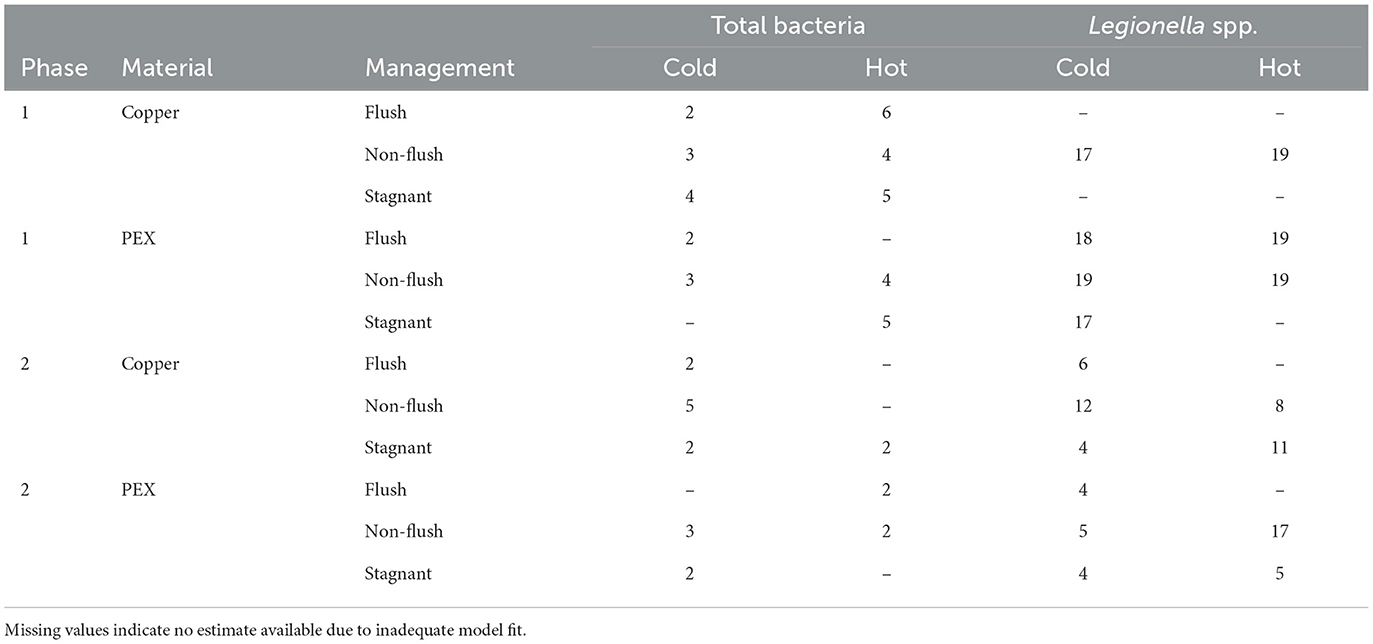
Table 5. Duration (days) for bacterial growth to reach stationary phase in cold and hot water supplies.
3.7. Effect of flushing on biofilms
Gene target concentrations in the biofilms retrieved from the pilot during 3 experimental events of phase 2 are summarized in Figure 7. Total bacteria concentrations in the biofilm varied between 4.58 to 6.18 log10[copies/cm2] (median = 5.86 log10[copies/cm2]) and 5.73 to 6.43 log10[copies/cm2] (median = 6.01 log10[copies/cm2]) in the copper and PEX lines, respectively. There was a significant difference in total bacteria concentration between the two pipe materials (PEX vs. copper: 0.39 log10[copies/cm2]; p = 0.003). On the other hand, water temperature 13 °C vs. 49 °C, in phase 2, did not influence the total bacteria concentration in the biofilms in either the copper or PEX lines. Furthermore, operating conditions (i.e., flushed vs. non-flushed vs. stagnant) did not significantly impact the total bacteria concentration in the biofilm (p = 0.56, ANOVA).
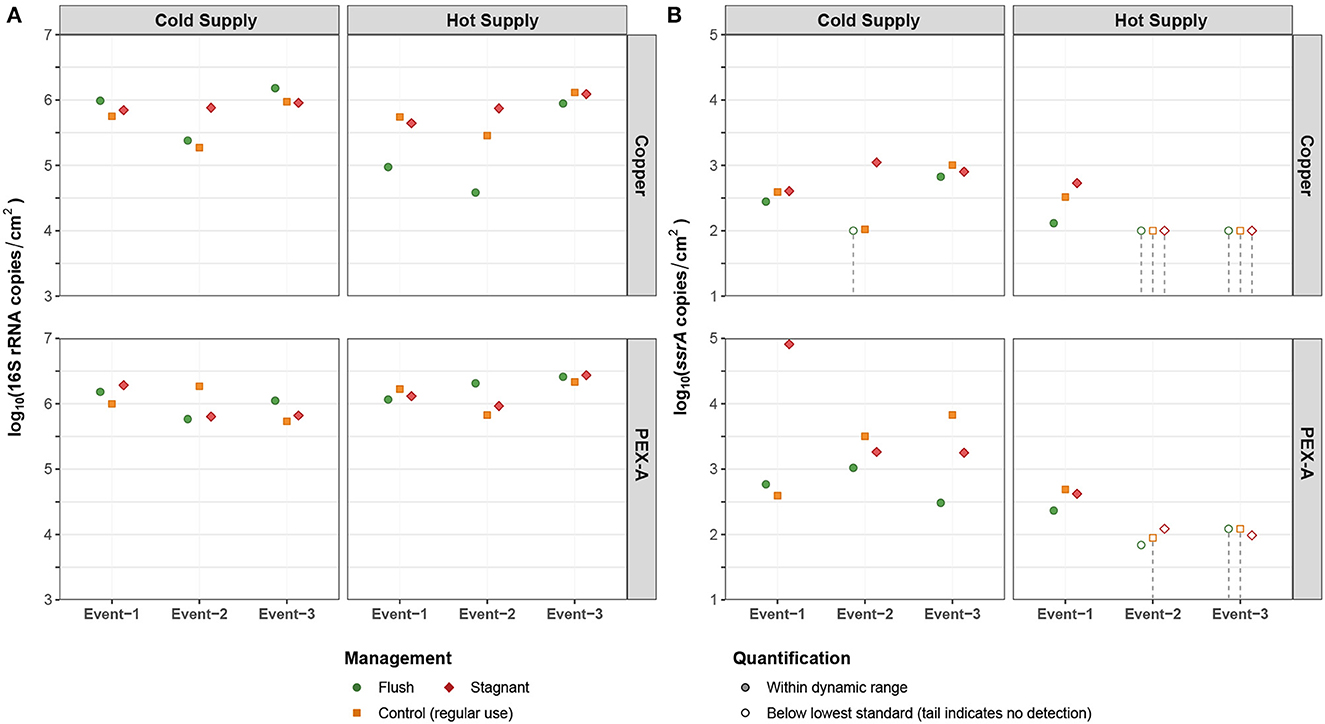
Figure 7. Gene markers (via qPCR) indicating biofilm concentrations of (A) total bacteria (16S rRNA genes) and (B) Legionella spp. (ssrA) in the cold- or hot-water supply distal ends of the pilot-scale premise plumbing system (either copper or PEX), during three successive sampling events of experimental phase 2 (2021-08-23 to 2021-09-20).
Legionella concentrations in the biofilm varied between 2.02 to 3.04 log10[copies/cm2] (median = 2.61 log10[copies/cm2]) and 1.84 to 4.91 log10[copies/cm2] (median = 2.68 log10[copies/cm2]) in the copper and PEX pipes, respectively. Overall, the occurrence of Legionella in the biofilm of the PEX pipes (cold water pipes 100 %; hot water pipes 66.7 %) was greater than that of the copper pipes (cold water pipes 88.9 %; hot water pipes 33.3 %) in both cold and hot water lines. The 18S rRNA genes of V. vermiformis were detected occasionally in the biofilm in both cold (11.1 %) and hot (22.2 %) water lines (both copper and PEX-A) and the concentration of V. vermiformis was less than 1 log10[cell/cm2].
4. Discussion
Several previous studies have investigated the benefits of flushing on microbiological water quality for buildings supplied with water containing free chlorine (Richard and Boyer, 2021) and chloramines (Hozalski et al., 2020; Greenwald et al., 2022) and we are aware of only one study concerning the effectiveness of flushing in a building supplied water without residual chlorine (Rhoads et al., 2022). To our knowledge, the present study is the first to investigate the effects of flushing water temperature and pipe material on total bacteria and Legionella levels in a controlled (pilot-scale) premise plumbing system for a water supply with no residual disinfectant.
In the present study, reductions of both total bacteria and Legionella in the hot water lines were observed immediately after a 5 min flush, with greater reductions at 60 °C than at 49 °C. During hot water flushing, the temporary heat shock as the water temperature suddenly increases from room temperature to the hot water set temperature can stress bacterial populations resulting in cell inactivation. Ji et al. reported that although a 30 min flush with water at 40 °C temporarily reduced total bacterial and L. pneumophila concentrations, it increased the relative abundance of L. pneumophila and V. vermiformis, which could lead to elevated L. pneumophila risk (Ji et al., 2018). However, in the present study, no significant difference in the abundance of Legionella in the pre- and post-flush samples was observed during the two phases. Also, the heat shock did not affect the total biomass in the biofilm, which may be due to the short duration of hot water exposure. Legionella spp. can survive at 49 °C, albeit with hindered growth. At 60 °C, Legionella can only survive for minutes to hours (Rhoads et al., 2015). Moreover, exposure to elevated temperatures could reduce the viability and culturability of Legionella (Allegra et al., 2008; Epalle et al., 2015; Bédard et al., 2016)—physiological states that were not assessed in this study.
In Norway, it is recommended to set the water heater temperature above 70 °C to make water heaters a hostile environment for Legionella (Pettersen, 2015; Rhoads et al., 2015). Therefore, most domestic and commercial water heaters sold in Norway come with a pre-set temperature of 75 °C (adjustable in the range of 60 to 90 °C) and are supplemented with a thermostatic mixing valve that is adjustable within the range of 45 to 80 °C (pre-set at 55 °C). In our pilot premise plumbing system, the water heater was set at 85 °C, which likely inactivated all Legionella in the hot water supply. At the thermostatic mixing valve, it was estimated that the hot water was blended with 30 and 50% cold water to achieve the desired hot water temperatures of 60 °C and 49 °C during phases 1 and 2, respectively. In addition, our pilot plumbing system did not consist of a re-circulation loop. Thus, our hot water pipes cooled down to room temperature within several hours after the water flow was turned off. Due to these system designs and operational differences, our hot water system may not be directly comparable with most of the previously studied hot water systems (Rhoads et al., 2015, 2022; Tolofari et al., 2022).
Most flushing studies reported in the literature have focused extensively on the hot water system (Rhoads et al., 2015, 2017; Ji et al., 2018); less emphasis is given to the cold-water system. However, the microbial concentration (total bacteria and Legionella) in the premise plumbing system is heavily influenced by the microbial concentration initially entering the cold-water supply from the distribution system. In the present study, total biomass and Legionella concentrations in the hot water were affected by the cold water mixing at the thermostatic mixing valve. The difference in mixing ratios during phase 1 and phase 2 might have affected the post-flush concentrations of total bacteria and Legionella spp.
Seasonal variations could affect bacterial counts in water distribution systems (Prest et al., 2016) which could result in variations in the premise plumbing system during water use and flushing. Ley et al. (2020) observed seasonal variations in the Legionella concentrations in both cold and hot water systems of a premise plumbing system. However, no seasonal variation in the Legionella concentration in the cold water supply was observed in this study. These results align with our previous study of Legionella in the water intakes to the treatment plants feeding our pilot system (Meegoda et al., 2022). Furthermore, the Legionella concentration range in this study matches well with a previous study by Wullings and van der Kooij (2006), which is also from a distribution system without residual disinfection. The Legionella spp. concentration at the pilot inlet (i.e., cold water supply) was, on average, 1.1 ± 0.33 log10[copies/L] and 1.28 ± 0.52 log10[copies/L] higher than the concentration at the raw water intake during phases 1 and 2, respectively; despite the use of disinfection during water treatment. The increase in the concentration of Legionella in the water distribution system could be due to detachment from biofilms (Waak et al., 2018) or to Legionella growth. In contrast, the total bacterial concentration at the pilot inlet was, on average, 0.53 log10[copies/L] less than that at the water intake (Meegoda et al., 2022). Thus, the relative abundance of Legionella increased from 0.001% (at the intake) to 0.05% (at the pilot inlet) of the total biomass in the distribution system.
In some respects, routine water use (e.g., showering) and flushing perform a similar function in terms of replacing stagnant water with water from the distribution system mains. Flushing, however, should provide additional benefits because of the time and effort involved. The added benefit comes from the higher flow velocities during flushing that create higher shear stress on the biofilm, increasing biofilm scour (Mathieu et al., 2014; Liu et al., 2017). In our experiments, the estimated shear stress varied from 4.8 to 14.0 N/m2 during a flush and 0.4 to 1.7 N/m2 during a shower. Despite this order of magnitude difference in shear stress between flushing and showering, there was no significant difference in total bacteria and Legionella spp. concentrations in the biofilms between the shower and flushed lines. The reasons for this lack of improved biofilm removal during flushing are unclear, but may be due to the short duration of the flush (5 min).
Pipe material plays a significant role in shaping the biofilm (Kerr et al., 1998; Lehtola et al., 2004; Liu et al., 2017). For example, plastic pipes were reported to have more biofilm growth and harbor higher L. pneumophila concentrations than metal pipes (Rogers et al., 1994). Despite the small sample size, a statistically significant (p = 0.003) yet slight difference of 0.35 log10[copies/cm2] was observed in total bacterial concentration between the biofilms in PEX-A and copper in the present study. Legionella occurrence was also higher in the PEX-A biofilms (83 %) than in the copper biofilms (61 %). Higher biofilm growth in PEX-A could be attributed to the leaching of organic carbon into the bulk water from the PEX-A during stagnation (Pelto-Huikko et al., 2021) and also to the antimicrobial properties of copper (Gomes et al., 2020). However, no effect of pipe material on planktonic microbe concentrations was observed during this study, likely because more than 90 % of the plumbing system was comprised of copper pipes except for the 1 m distal branches.
A significant accumulation of Legionella in both flushed and non-flushed lines during overnight stagnation in the active water demand period was observed in the cold water supply during phase 2, when the feed water temperature ranged from 13.0 to 13.4 °C (median = 13.2 °C) but not during phase 1, when the feed water temperature ranged from 8.4 to 10.4 °C (median = 9.1 °C). Legionella enters a viable but not culturable state at low temperatures (<15 °C) and under low nutrient conditions (Hussong et al., 1987; Paszko-Kolva et al., 1992; Steinert et al., 1997; Wullings and van der Kooij, 2006). However, some Legionella spp. have adapted to cold temperatures by multiplying within amoeba hosts (Ohno et al., 2003; Carvalho et al., 2008; Söderberg et al., 2008; Ramamurthy et al., 2014). V. vermiformis, a well-known free-living amoeba host of Legionella (Fouque et al., 2015; Delafont et al., 2018), was detected in biofilm and stagnant water samples, which could have supported the survival of Legionella at the lower temperatures.
Feed water entering the pilot system reached room temperature, a more favorable temperature for Legionella growth (Rhoads et al., 2015), within several hours, despite the initial 4 °C temperature difference in the feed water for the two phases. Still, the slight difference in the incoming feed water temperature appeared to affect Legionella accumulation during overnight stagnation in the active water demand period. Therefore, it could be hypothesized that the Legionella community required more time to change from the dormant state to the active state when the temperature was lower, and the transition became more rapid as the temperature increased. This hypothesis is consistent with the modeled maximum specific growth rate (μmax) of Legionella (Table 4) during the low water demand period. The average modeled μmax during phase 1 (0.35 d−1) was significantly lower than phase 2 (0.83 d−1). Also, the duration to reach the stationary phase (Nmax) was 18 and 6 days on average during phase 1 and phase 2, respectively. However, other factors such as Legionella host activity (Ohno et al., 2008), biofilm age (Chen et al., 2022), and differences in growth kinetics of different Legionella spp. (Sharaby et al., 2017) could also affect the difference in Legionella accumulation during stagnation.
In contrast, the modeled average maximum specific growth rate for the total bacterial population was statistically similar (p = 0.24) for both phase 1 (1.1 d−1) and phase 2 (1.0 d−1), and also the duration to reach stationary phase was similar for both phases (2 days). Interestingly, Legionella spp. required more time than the total bacterial community to reach stationary phase during the period of low water demand. Previous studies have shown that Legionella spp. isolated from tap water required nearly 35 to 42 days to reach the stationary phase when grown in tap water at room temperature (Wadowsky et al., 1985), but only 20 h within Legionella hosts such as Acanthamoeba (Moffat and Tompkins, 1992). However, our modeling results could not be directly compared with these previous growth studies because our estimations are based on quantification of ssrA and 16S rRNA gene targets in the bulk water, and detachment from pipe-wall biofilms could also influence our estimations. Yet, our estimations likely better reflect the accumulation of total bacteria and Legionella spp. in the bulk water during stagnation inside a plumbing system.
Legionnaires' disease remains one of the highest health burdens of all waterborne diseases in Europe (European Union, 2020; ECDC, 2022). Thus, the recent update of the European Union Drinking Water Directive (EUDWD), which entered into enforcement in January 2021, included Legionella in the risk assessment of domestic distribution systems (European Union, 2020). EUDWD requires testing for L. pneumophila, the species responsible for more than 95 % of Legionella outbreaks worldwide (Walker and McDermott, 2021), as well as Legionella spp. This has sparked an interesting dialogue among experts in the field about the necessity of testing for Legionella spp. instead of just L. pneumophila. Although L. pneumophila appears to be the causative agent in most human infections, there are still more than 19 non-pneumophila Legionella spp. linked to human infections (Walker and McDermott, 2021). Taking this into consideration, a “hybrid” approach to monitor for Legionella has been established in the Netherlands whereby Legionella spp. are monitored in buildings with people at higher risk of Legionella infections, such as hospitals and nursing homes, while in other buildings only L. pneumophila are tested for. Meanwhile, countries like Germany and France only test for L. pneumophila (Delaney et al., 2022). In this study, mip and ssrA genes were analyzed for L. pneumophila and Legionella spp., respectively using qPCR. Even though we did not detect mip genes in our pilot system, there is potentially still a threat to public health from the non-pneumophila species in the system. Therefore, more studies are needed to identify the Legionella spp. that occur in water systems and their possible role in causing disease in humans.
Data availability statement
The datasets presented in this study can be found in online repositories. The names of the repository/repositories and accession number(s) can be found in the article/Supplementary material.
Author contributions
CM, MW, CH, and RH contributed to the conception, design of the study, data analysis, and interpretation. CM and CH contributed to sample collection and processing. TK helped in qPCR analysis. CM wrote the first draft of the manuscript. All authors contributed to the manuscript revision and approved the final submission.
Funding
This research was made possible with support from the project WRF5033 funded by Water Research Foundation and from strategic internal funding from the Faculty of Engineering at the Norwegian University of Science and Technology.
Acknowledgments
The authors thank Trine Krakk, Rizza Ardiyanti, and Trine Hårberg Ness for their assistance in sample collection and analysis.
Conflict of interest
The authors declare that the research was conducted in the absence of any commercial or financial relationships that could be construed as a potential conflict of interest.
Publisher's note
All claims expressed in this article are solely those of the authors and do not necessarily represent those of their affiliated organizations, or those of the publisher, the editors and the reviewers. Any product that may be evaluated in this article, or claim that may be made by its manufacturer, is not guaranteed or endorsed by the publisher.
Supplementary material
The Supplementary Material for this article can be found online at: https://www.frontiersin.org/articles/10.3389/frwa.2023.1114795/full#supplementary-material
References
Alarcon Falconi, T. M., Cruz, M. S., and Naumova, E. N. (2018). The shift in seasonality of legionellosis in the USA. Epidemiol. Infect. 146, 1824–1833. doi: 10.1017/S0950268818002182
Allegra, S., Berger, F., Berthelot, P., Grattard, F., Pozzetto, B., and Riffard, S. (2008). Use of flow cytometry to monitor Legionella viability. Appl. Environ. Microbiol. 74, 7813–7816. doi: 10.1128/AEM.01364-08
Baranyi, J., and Roberts, T. A. (1994). A dynamic approach to predicting bacterial growth in food. Int. J. Food Microbiol. 23, 277–294.
Baty, F., and Delignette-Muller, M.-L. (2014). nlsMicrobio: Data Sets and Nonlinear Regression Models Dedicated to Predictive Microbiology. R package version 0.0-1.
Bauer, M., Mathieu, L., Deloge-Abarkan, M., Remen, T., Tossa, P., Hartemann, P., et al. (2008). Legionella bacteria in shower aerosols increase the risk of Pontiac fever among older people in retirement homes. J. Epidemiol. Community Health 62, 913–920. doi: 10.1136/jech.2007.063784
Bédard, E., Boppe, I., Kouamé, S., Martin, P., Pinsonneault, L., Valiquette, L., et al. (2016). Combination of heat shock and enhanced thermal regime to control the growth of a persistent Legionella pneumophila strain. Pathogens 5, 35. doi: 10.3390/pathogens5020035
Benedict, K. M., Reses, H., Vigar, M., Roth, D. M., Roberts, V. A., Mattioli, M., et al. (2017). Surveillance for waterborne disease outbreaks associated with drinking water—United States, 2013–2014. MMWR Morb. Mortal. Wkly Rep. 66, 1216–1221. doi: 10.15585/mmwr.mm6644a3
Boamah, D. K., Zhou, G., Ensminger, A. W., and O'Connor, T. J. (2017). From many hosts, one accidental pathogen: the diverse protozoan hosts of Legionella. Front. Cell. Infect. Microbiol. 7, 477. doi: 10.3389/fcimb.2017.00477
Carvalho, F. R. S., Nastasi, F. R., Gamba, R. C., Foronda, A. S., and Pellizari, V. H. (2008). Occurrence and diversity of Legionellaceae in polar lakes of the Antarctic Peninsula. Curr. Microbiol. 57, 294–300. doi: 10.1007/s00284-008-9192-y
CDC (2003). Guidelines for environmental infection control in health-care facilities: recommendations of CDC and the Healthcare Infection Control Practices Advisory Committee (HICPAC). MMWR Recomm. Rep. 52, 1–48.
Chen, J., Li, W., Tan, Q., Sheng, D., Li, Y., Chen, S., and Zhou, W. (2022). Effect of disinfectant exposure and starvation treatment on the detachment of simulated drinking water biofilms. Sci. Tot. Environ. 807, 150896. doi: 10.1016/j.scitotenv.2021.150896
Delafont, V., Rodier, M.-H., Maisonneuve, E., and Cateau, E. (2018). Vermamoeba vermiformis: a free-living amoeba of interest. Microb. Ecol. 76, 991–1001. doi: 10.1007/s00248-018-1199-8
Delaney, S., Arcari, T., and O'Connor, O. (2022). Legionella water testing and the EU Drinking Water Directive: could potentially harmful Legionella bacteria slip through the gaps? Biotechniques 72, 229–231. doi: 10.2144/btn-2022-0047
ECDC (2022). Legionnaires' Disease - Annual Epidemiological Report for 2020. European Centre for Disease Prevention and Control (ECDC), Stockholm.
Epalle, T., Girardot, F., Allegra, S., Maurice-Blanc, C., Garraud, O., and Riffard, S. (2015). Viable but not culturable forms of Legionella pneumophila generated after heat shock treatment are infectious for macrophage-like and alveolar epithelial cells after resuscitation on Acanthamoeba polyphaga. Microb. Ecol. 69, 215–224. doi: 10.1007/s00248-014-0470-x
EU (2020). Directive 2020/2184 of the European Parliament and of the Council of 16 December 2020 on the Quality of Water Intended for Human Consumption (recast) L 435. European Union, Luxembourg.
Fliermans, C. B., Cherry, W. B., Orrison, L. H., Smith, S. J., Tison, D. L., and Pope, D. H. (1981). Ecological distribution of Legionella pneumophila. Appl. Environ. Microbiol. 41, 9–16. doi: 10.1128/aem.41.1.9-16.1981
Fouque, E., Yefimova, M., Trouilhé, M. C., Quellard, N., Fernandez, B., Rodier, M. H., et al. (2015). Morphological study of the encystment and excystment of Vermamoeba vermiformis revealed original traits. J. Eukaryot. Microbiol. 62, 327–337. doi: 10.1111/jeu.12185
Gomes, I. B., Simões, M., and Simões, L. C. (2020). Copper surfaces in biofilm control. Nanomaterials 10, 2491. doi: 10.3390/nano10122491
Greenwald, H., Kennedy, L. C., Ehde, A., Duan, Y., Olivares, C. I., Kantor, R., et al. (2022). Is flushing necessary during building closures? A study of water quality and bacterial communities during extended reductions in building occupancy. Front. Water 4, 958523. doi: 10.3389/frwa.2022.958523
Hozalski, R. M., LaPara, T. M., Zhao, X., Kim, T., Waak, M. B., Burch, T., et al. (2020). Flushing of stagnant premise water systems after the COVID-19 shutdown can reduce infection risk by Legionella and Mycobacterium spp. Environ. Sci. Technol. 54, 15914–15924. doi: 10.1021/acs.est.0c06357
Huang, C., Shen, Y., Smith, R. L., Dong, S., and Nguyen, T. H. (2020). Effect of disinfectant residuals on infection risks from Legionella pneumophila released by biofilms grown under simulated premise plumbing conditions. Environ. Int. 137, 105561. doi: 10.1016/j.envint.2020.105561
Hussong, D., Colwell, R. R., O'Brien, M., Weiss, E., Pearson, A. D., Weiner, R. M., et al. (1987). Viable Legionella pneumophila not detectable by culture on agar media. Nat. Biotechnol. 5, 947–950.
Hydes, O. (1999). European regulations on residual disinfection. J. Am. Water Works Assoc. 91, 70–74. doi: 10.1002/j.1551-8833.1999.tb08570.x
Ji, P., Rhoads, W. J., Edwards, M. A., and Pruden, A. (2018). Effect of heat shock on hot water plumbing microbiota and Legionella pneumophila control. Microbiome 6, 30. doi: 10.1186/s40168-018-0406-7
Kerr, C. J., Osborn, K. S., Robson, G. D., and Handley, P. S. (1998). The relationship between pipe material and biofilm formation in a laboratory model system. J. Appl. Microbiol. 85, 29S–38S. doi: 10.1111/j.1365-2672.1998.tb05280.x
Kuchta, J. M., States, S. J., McNamara, A. M., Wadowsky, R. M., and Yee, R. B. (1983). Susceptibility of Legionella pneumophila to chlorine in tap water. Appl. Environ. Microbiol. 46, 1134–1139. doi: 10.1128/aem.46.5.1134-1139.1983
Kuiper, M. W., Valster, R. M., Wullings, B. A., Boonstra, H., Smidt, H., and van der Kooij, D. (2006). Quantitative detection of the free-living amoeba Hartmannella vermiformis in surface water by using real-time PCR. Appl. Environ. Microbiol. 72, 5750–5756. doi: 10.1128/AEM.00085-06
LeChevallier, M. W. (2019). Occurrence of culturable Legionella pneumophila in drinking water distribution systems. AWWA Water Sci. 1, e1139. doi: 10.1002/aws2.1139
Lehtola, M. J., Miettinen, I. T., Keinänen, M. M., Kekki, T. K., Laine, O., Hirvonen, A., et al. (2004). Microbiology, chemistry and biofilm development in a pilot drinking water distribution system with copper and plastic pipes. Water Res. 38, 3769–3779. doi: 10.1016/j.watres.2004.06.024
Ley, C. J., Proctor, C. R., Singh, G., Ra, K., Noh, Y., Odimayomi, T., et al. (2020). Drinking water microbiology in a water-efficient building: stagnation, seasonality, and physicochemical effects on opportunistic pathogen and total bacteria proliferation. Environ. Sci. Water Res. Technol. 6, 2902–2913. doi: 10.1039/D0EW00334D
Li, R. A., McDonald, J. A., Sathasivan, A., and Khan, S. J. (2019). Disinfectant residual stability leading to disinfectant decay and by-product formation in drinking water distribution systems: a systematic review. Water Res. 153, 335–348. doi: 10.1016/j.watres.2019.01.020
Liu, J.-Q., Luo, Z.-F., Liu, K., Zhang, Y.-F., Peng, H.-X., Hu, B.-L., et al. (2017). Effect of flushing on the detachment of biofilms attached to the walls of metal pipes in water distribution systems. J. Zhejiang Univ. Sci. A 18, 313–328. doi: 10.1631/jzus.A1600316
Mathieu, L., Bertrand, I., Abe, Y., Angel, E., Block, J. C., Skali-Lami, S., et al. (2014). Drinking water biofilm cohesiveness changes under chlorination or hydrodynamic stress. Water Res. 55, 175–184. doi: 10.1016/j.watres.2014.01.054
Meegoda, C. S., Waak, M. B., Kim, T., Hozalski, R. M., and Hallé, C. (2022). Variation of Legionella spp. with lake depth and season in two Norwegian drinking water sources. ACS ES&T Water. 2, 759–768. doi: 10.1021/acsestwater.1c00454
Moffat, J. F., and Tompkins, L. S. (1992). A quantitative model of intracellular growth of Legionella pneumophila in Acanthamoeba castellanii. Infect. Immun. 60, 296–301. doi: 10.1128/iai.60.1.296-301.1992
Ohno, A., Kato, N., Sakamoto, R., Kimura, S., and Yamaguchi, K. (2008). Temperature-dependent parasitic relationship between Legionella pneumophila and a free-living amoeba (Acanthamoeba castellanii). Appl. Environ. Microbiol. 74, 4585–4588. doi: 10.1128/AEM.00083-08
Ohno, A., Kato, N., Yamada, K., and Yamaguchi, K. (2003). Factors influencing survival of Legionella pneumophila serotype 1 in hot spring water and tap water. Appl. Environ. Microbiol. 69, 25402547. doi: 10.1128/AEM.69.5.2540-2547.2003
Paszko-Kolva, C., Shahamat, M., and Colwell, R. R. (1992). Long-term survival of Legionella pneumophila serogroup 1 under low-nutrient conditions and associated morphological changes. FEMS Microbiol. Lett. 102, 45–55. doi: 10.1111/j.1574-6968.1992.tb05794.x
Pelto-Huikko, A., Ahonen, M., Ruismäki, M., Kaunisto, T., and Latva, M. (2021). Migration of volatile organic compounds (VOCs) from PEX-a pipes into the drinking water during the first five years of use. Materials 14, 746. doi: 10.3390/ma14040746
Pereira, A., Silva, A. R., and Melo, L. F. (2021). Legionella and biofilms—Integrated surveillance to bridge science and real-field demands. Microorganisms 9, 1212. doi: 10.3390/microorganisms9061212
Pettersen, J. E. (2015). Forebygging av legionellasmitte - en veiledning. Technical report. Norwegian Institute of Public Health, Oslo.
Prest, E. I., Weissbrodt, D. G., Hammes, F., van Loosdrecht, M. C. M., and Vrouwenvelder, J. S. (2016). Long-term bacterial dynamics in a full-scale drinking water distribution system. PLoS ONE 11, e0164445. doi: 10.1371/journal.pone.0164445
Ramamurthy, T., Ghosh, A., Pazhani, G. P., and Shinoda, S. (2014). Current perspectives on viable but non-culturable (VBNC) pathogenic bacteria. Front. Public Health 2, 103. doi: 10.3389/fpubh.2014.00103
Rhoads, W. J., Ji, P., Pruden, A., and Edwards, M. A. (2015). Water heater temperature set point and water use patterns influence Legionella pneumophila and associated microorganisms at the tap. Microbiome 3, 67. doi: 10.1186/s40168-015-0134-1
Rhoads, W. J., Pruden, A., and Edwards, M. A. (2016). Convective mixing in distal pipes exacerbates Legionella pneumophila growth in hot water plumbing. Pathogens 5, 29. doi: 10.3390/pathogens5010029
Rhoads, W. J., Pruden, A., and Edwards, M. A. (2017). Interactive effects of corrosion, copper, and chloramines on Legionella and Mycobacteria in hot water plumbing. Environ. Sci. Technol. 51, 7065–7075. doi: 10.1021/acs.est.6b05616
Rhoads, W. J., Sindelar, M., Margot, C., Graf, N., and Hammes, F. (2022). Variable Legionella response to building occupancy patterns and precautionary flushing. Microorganisms 10, 555. doi: 10.3390/microorganisms10030555
Rhodes, E. R., Villegas, L. F., Shaw, N. J., Miller, C., and Villegas, E. N. (2012). A modified EPA method 1623 that uses tangential flow hollow-fiber ultrafiltration and heat dissociation steps to detect waterborne Cryptosporidium and Giardia spp. J. Vis. Exp. 4177. doi: 10.3791/4177
Richard, R., and Boyer, T. H. (2021). Pre-and post-flushing of three schools in Arizona due to COVID-19 shutdown. AWWA Water Sci. 3:e1239. doi: 10.1002/aws2.1239
Rogers, J., Dowsett, A. B., Dennis, P. J., Lee, J. V., and Keevil, C. W. (1994). Influence of plumbing materials on biofilm formation and growth of Legionella pneumophila in potable water systems. Appl. Environ. Microbiol. 60, 1842–1851. doi: 10.1128/aem.60.6.1842-1851.1994
Rosario-Ortiz, F., Rose, J., Speight, V., von Gunten, U., and Schnoor, J. (2016). How do you like your tap water? Science 351, 912–914. doi: 10.1126/science.aaf0953
Sharaby, Y., Rodríguez-Martínez, S., Oks, O., Pecellin, M., Mizrahi, H., Peretz, A., et al. (2017). Temperature-dependent growth modeling of environmental and clinical Legionella pneumophila multilocus variable-number tandem-repeat analysis (MLVA) genotypes. Appl. Environ. Microbiol. 83, e03295-16. doi: 10.1128/AEM.03295-16
Söderberg, M. A., Dao, J., Starkenburg, S. R., and Cianciotto, N. P. (2008). Importance of type II secretion for survival of Legionella pneumophila in tap water and in amoebae at low temperatures. Appl. Environ. Microbiol. 74, 5583–5588. doi: 10.1128/AEM.00067-08
Steinert, M., Emödy, L., Amann, R., and Hacker, J. (1997). Resuscitation of viable but nonculturable Legionella pneumophila Philadelphia JR32 by Acanthamoeba castellanii. Appl. Environ. Microbiol. 63, 2047–2053. doi: 10.1128/aem.63.5.2047-2053.1997
Steinert, M., Hentschel, U., and Hacker, J. (2002). Legionella pneumophila: an aquatic microbe goes astray. FEMS Microbiol. Rev. 26, 149–162. doi: 10.1111/j.1574-6976.2002.tb00607.x
Thomas, J. M., and Ashbolt, N. J. (2011). Do free-living amoebae in treated drinking water systems present an emerging health risk? Environ. Sci. Technol. 45, 860–869. doi: 10.1021/es102876y
Tolofari, D. L., Bartrand, T., Masters, S. V., Duarte Batista, M., Haas, C. N., Olson, M., et al. (2022). Influence of hot water temperature and use patterns on microbial water quality in building plumbing systems. Environ. Eng. Sci. 39, 309–319. doi: 10.1089/ees.2021.0272
van der Kooij, D., Hein, J., van Lieverloo, M., Schellart, J., and Hiemstra, P. (1999). Maintaining quality without a disinfectant residual. J. Am. Water Works Assoc. 91, 55–64. doi: 10.1002/j.1551-8833.1999.tb08568.x
Van Kenhove, E., Dinne, K., Janssens, A., and Laverge, J. (2019). Overview and comparison of Legionella regulations worldwide. Am. J. Infect. Control 47, 968–978. doi: 10.1016/j.ajic.2018.10.006
Waak, M. B., LaPara, T. M., Hallé, C., and Hozalski, R. M. (2018). Occurrence of Legionella spp. in water-main biofilms from two drinking water distribution systems. Environ. Sci. Technol. 52, 7630–7639. doi: 10.1021/acs.est.8b01170
Wadowsky, R. M., Wolford, R., McNamara, A. M., and Yee, R. B. (1985). Effect of temperature, pH, and oxygen level on the multiplication of naturally occurring Legionella pneumophila in potable water. Appl. Environ. Microbiol. 49, 1197–1205. doi: 10.1128/aem.49.5.1197-1205.1985
Walker, J. T., and McDermott, P. J. (2021). Confirming the presence of Legionella pneumophila in your water system: A review of current Legionella testing methods. J. AOAC Int. 104, 1135. doi: 10.1093/jaoacint/qsab003
Wullings, B. A., and van der Kooij, D. (2006). Occurrence and genetic diversity of uncultured Legionella spp. in drinking water treated at temperatures below 15°C. Appl. Environ. Microbiol. 72, 157–166. doi: 10.1128/AEM.72.1.157-166.2006
Keywords: pilot scale plumbing system, microbial growth kinetics, biofilms, pipe material, Vermamoeba vermiformis, total bacteria, water demand, building water quality
Citation: Meegoda CS, Waak MB, Hozalski RM, Kim T and Hallé C (2023) The benefits of flushing for mitigating Legionella spp. in non-chlorinated building plumbing systems. Front. Water 5:1114795. doi: 10.3389/frwa.2023.1114795
Received: 02 December 2022; Accepted: 14 February 2023;
Published: 21 March 2023.
Edited by:
Xubo Gao, China University of Geosciences Wuhan, ChinaReviewed by:
Vasiliki Syngouna, University of Patras, GreeceSihem Jebri, National Center for Nuclear Science and Technology, Tunisia
Copyright © 2023 Meegoda, Waak, Hozalski, Kim and Hallé. This is an open-access article distributed under the terms of the Creative Commons Attribution License (CC BY). The use, distribution or reproduction in other forums is permitted, provided the original author(s) and the copyright owner(s) are credited and that the original publication in this journal is cited, in accordance with accepted academic practice. No use, distribution or reproduction is permitted which does not comply with these terms.
*Correspondence: Cynthia Hallé, Y3ludGhpYS5oYWxsZUBudG51Lm5v