 Allen G. Hunt
 Behzad Ghanbarian
 Boris Faybishenko
- 1Department of Physics, Wright State University, Dayton, OH, United States
- 2Porous Media Research Lab, Department of Geology, Kansas State University, Manhattan, KS, United States
- 3Lawrence Berkeley Laboratory, Berkeley, CA, United States
Predicting the temporal and spatial evolution of the river network is part of the Earth's critical zone investigations, which has become an important endeavor. However, modeling integration of the river network and critical zone over millions of years is rare. We address the problem of how to predict integrated river length development as a function of time within a framework of addressing the critical zone depth as a function of time. In case of groundwater-river interaction, we find a non-linear spatio-temporal scaling relationship between time, t, and total river length L, given by t≈Lp with power p being near 1.2. The basis of our model is the presumption that groundwater flow paths are relevant to river integration. As river integration may proceed over disconnected basins with irregular relief, the relevant optimal subsurface flow paths are proposed to be defined within a 3D network, with optimal path exponent 1.43. Because the 2D model of the river length has already been shown to relate to a power of the Euclidean distance across a drainage basin with the predicted universal optimal path exponent from percolation theory, Dopt = 1.21, the optimal groundwater paths should relate to the surface river length with an exponent equaling the ratio 1.43/1.21 = 1.18. To define a predictive relationship for the river length, we need to use specific length and time scales. We assume that the fundamental specific length scale is a characteristic particle size (which is commonly used to define the pore scale flow network), and the fundamental time scale is the ratio of the particle size to the regional groundwater flow rate. In this paper, we consider cases of predicting spatio-temporal scaling of drainage organization in the southwestern USA–the Amargosa, Mojave, Gila (and its tributaries) and the Rio Grande, and Pecos Rivers. For the Mojave and Gila Rivers, theoretical results for time scales of river integration since ca. 10 Ma are quite predictive, though the predicted time scales exceed observation for the Rio Grande and Pecos.
1. Introduction
The organization of river drainage systems has an impact on many aspects of geology, geomorphology, and hydrology, including flood magnitude-frequency relations, the water cycle, tectonic response to erosion and its inverse, and so forth. Drainage organization is also key to the type of sediments that rivers deliver to sedimentary basins, since the spatial extent of the drainage basin also controls the sediment transport sources. Important factors limiting the volume of sediments transported are the rate of chemical weathering of bedrock and its conversion to soil (Dixon and Heimsath, 2009; DiBiase and Heimsath, 2012; Egli et al., 2018). DiBiase and Heimsath (2012), and the close relationship between soil erosion and soil production rates, which are mostly water flux-limited through chemical weathering (e.g., Egli et al., 2018), or, equivalently (Maher, 2010; Stolze et al., 2023), by residence times. Flow rates, of course, depend on specific drainage architecture as well as climatic variables. Thus, predicting the two-dimensional extent of a drainage system together with the rates of weathering of the bedrock and transport of sediments, is the foundation for predicting the total volume and kind of sediments ultimately delivered to sedimentary basins. Indeed, dates for a reorganization of drainage systems are frequently extracted by dating changes in the provenance of deltaic sediments (Matthews et al., 2001; Said et al., 2015; Fielding et al., 2018). Overall, water fluxes, surface and subsurface, can be viewed as primary agents of the evolution of both lateral and vertical dimensions of drainage basins.
Within a river basin, water drains through many smaller watersheds to a large river. Watershed forming factors are: tectonics, climate, vegetation cover, topography, shape, size, soil type, and land use in urban, agriculture, and natural areas (Rhoads, 2020). Beyond the rough descriptions named, characteristics of drainage system organization are quantified in many ways (Horton, 1932, 1945; Schumm, 1956; Strahler, 1964; Scheidegger, 1965; Shreve, 1967). In recognition of the statistical regularities in drainage form and architecture (Kirchner, 1993), a range of principles governing the structural features of river drainages has been proposed (Maritan et al., 1996; Rigon et al., 1996; Pelletier, 1999; Bejan and Errera, 2011). Specific drainage reorganization processes identified include headward erosion through spring sapping (Laity and Malin, 1986; Baker et al., 1990), capture (Young and Spamer, 2001), or basin fill and sill overtopping (Meek, 1989, 1990; Hilgendorf et al., 2020), or combinations of such mechanisms. The basis for such mechanisms lies in combinations of erosion processes; those driven by water can either be mostly chemical or physical in basis, surface or subsurface in location.
Following previous studies (Willgoose et al., 1991; Tucker and Bras, 2000; Gunnell and Harbor, 2010; Willett et al., 2014), we focus on tectonic and climatic drivers of basin (re)organization. Tectonic influences are assumed mainly to be disaggregating (i.e., breaking up), while the convergence of groundwater flow fields (and the flow rate) is assumed to be the ultimate “engineer” of organization. To illustrate the contrasting roles of tectonics and climate, development of surface structures such as mountains and faults can disrupt surface and subsurface flow fields. But subsurface flow fields can reorganize in response to changing regional subsurface gradients in a variety of ways, i.e., chemical dissolution and erosion, which are linked to the surface hydrological processes and organization (Petroff et al., 2013) through surface lowering, thereby influencing surface and subsurface convergence upstream; or through subsurface flow convergence and spring sapping (Laity and Malin, 1986; Baker et al., 1990); or through surface convergence further downgradient, the latter two of which both promote headward erosion. Another particular means by which groundwater flow affects surface erosion processes of a stream is detailed by Xiangjiang and Niemann (2006) below. In our work here, the influence of climate on drainage basin reorganization is expressed predominantly in groundwater flow rates, which are known to be proportional to the difference between precipitation and evapotranspiration (Maxwell et al., 2016).
As Xiangjiang and Niemann (2006) discuss, the river-groundwater interaction occurs primarily in two ways: streams can gain or lose water from inflow or outflow of groundwater through the streambed. In a gaining reach, the water table slopes down toward the stream, but in a losing reach, it slopes away from the stream. Therefore, in arid regions, erosional processes are favored for gaining reaches or streams, and depositional for losing reaches or streams (Grant, 1948). Basin fill is accordingly promoted in losing reaches. Thus, particularly in arid zones, where the surface runoff may be strongly elevation-dependent, both basin fill and sill erosion rates can be enhanced simultaneously, depending on groundwater flow rates. Even in areas where relief is insufficient to generate a climatic signal in groundwater flow rates, we note that in the opposite extreme of river impoundment by dams, failure, and thus reintegration, can occur at least as often by piping as by overtopping (Zhang et al., 2016).
For the above reasons, we model drainage (re)organization as controlled by the assembly of groundwater flow paths into optimal networks. Our present approach, which is scale-independent in concept, is based on a hypothesis quantifying the organization of optimal groundwater flow paths between two vertical planes – a divide and a river – and thus has most in common with Bejan and Errera's (2011) optimization of flow paths between a line and a point. However, our emphasis is on the organization of subsurface flow paths through a three-dimensional optimization. Our description may appear to situate our understanding as allied to headward erosion and capture (as opposed to basin fill and overtopping) as specific reorganization mechanisms, but we would only conclude that purely surface processes dominate integration rates when groundwater fluxes, as expressed in our proposed scaling relationship, do not generate the appropriate time scale for the organization. We, therefore, argue that such a concrete analytical formulation based on groundwater flow speeds may help distinguish when groundwater processes are the limiting process on drainage development and/or reorganization rates, regardless of whether the drainage reorganization is from the bottom up (Young and Spamer, 2001; Dickinson, 2015) or from the top down (Spencer et al., 2001; Repasch et al., 2017).
Our goal is to predict river lengths that can be integrated/achieved over a given time period of evolution which is initialized by tectonic triggers, such as onset of rifting or lateral shifting and mediated by groundwater flow field reorganization. As the surface expression of this organization, namely the river itself, is already known to be compatible with a river sinuosity controlled by the two-dimensional optimal path exponent (Hunt et al., 2021), the groundwater flow architecture, whose organization can extend to kilometer depths, is suggested to relate to the three-dimensional optimal path tortuosity. Our focus on a simple organizational principle does not deny influence of other factors; rather, we suggest a possible means to develop a hierarchy in the importance of influences on drainage basin evolution, on the basis of which it may be possible to more clearly identify anomalies and exceptions to trends. For example, wherever surface and subsurface flow networks do not integrate well, such as in karsts, our understanding may be less helpful.
The data addressed here derive from drainage basin changes between about 100Ma and 10ka; thus, anthropogenic effects such as agriculture and urbanization are considered negligible. Though the specific pattern of a drainage basin may have an influence on the spatio-temporal scaling of the network, we will neglect the potential impact of this factor at this time. Our initial assumption is that the primary influence of the variability that drainage patterns exert on changes in stream organization can be traced to their influence on subsurface flow paths and rates. It turns out that the dependence of the time for the organization on the fundamental length scale is very weak; therefore, on account of the universality assumed for the flow path tortuosity, it will be necessary only to account for the flow rate(s), when these can be identified.
2. Objectives
In this study, we aim to develop a model to predict a single characteristic of the (re)organization of drainage basins under conditions of climate (change) and tectonic driving forces, namely how overall stream lengths change through the process of stream capture, sapping, or other processes related to groundwater flow. The model developed is then applied to a range of observations to determine when it may, or may not, be accurate. The theoretical framework developed is based on our suggested principles of mostly tectonic triggers and the organization of the response through groundwater flow as influenced by climate. Our framework is generally consistent with previous work (Hunt, 2016a; Hunt et al., 2021), though some uncertainty in explanation is clarified. By comparing with observation, we attempt to diagnose the general means by which the drainage integration has proceeded.
3. Theory
3.1. Background
In this section, we develop the spatio-temporal scaling relationship, relating it to previous research. It has been claimed that the range of Hack's (1957) law exponents relating river length to drainage basin area is 0.57 – 0.6 (Maritan et al., 1996). Because it is known that the Euclidean length across drainage basins is proportional to the drainage basin area to the power of 0.5 (Church and Mark, 1980; Montgomery and Dietrich, 1992). It is logical to relate river sinuosity to optimal 2D percolation, so that the exponent in Hack's law becomes simply half the sinuosity exponent. In percolation theory, sinuosity exponent values range from 1.13 (Ghanbarian et al., 2013) for the simple tortuosity of a river assembled through random connections across a homogeneous substrate to 1.21 for the optimal path exponent (Porto et al., 1997) describing the tortuosity of the connected path of least resistance when the substrate is highly heterogeneous. The above cited relationship between area and Euclidean basin length then leads to a range of predicted Hack's law exponents from 0.565 to 0.605.
Here, we suggest that the optimal path exponent is the correct choice (producing Hack's law exponent 0.605, Rigon et al., 1996) and that the significant variability in conformance of real data to this prediction is possibly a consequence of climatic variability, though Hack's law may overpredict river sinuosity in large drainage basins. Nevertheless, if the interconnected paths for groundwater flow are not more tortuous than the surface paths followed by the streams, then we would predict that the stream assemblage process leads to a linear relationship of the stream length vs. time.
3.2. Model development
The model development is analogs to that used in the development of a model for predictions of the growth of plant roots as a function of time (Hunt, 2016b, 2017). The tortuosity of root growth was hypothesized to be governed by the optimal path exponent of percolation theory. This exponent describes the (fractal) tortuosity of the path through highly disordered 2D or 3D porous media, which produces the minimum total resistance (Porto et al., 1997). This model generates a preferred direction, from smaller orders to larger order, in accord with optimality concepts in energy, which has also been used in drainage basin development treatments (Maritan et al., 1996; Rigon et al., 1996; Bejan and Errera, 2011). Our theoretical development here addresses the organization of optimal flow paths in the subsurface and their effects on drainage reorganization. We suggest that, above a threshold length scale, the surface expression of these optimal flow paths is the drainage network. It is already known that, in Florida, features of stream bifurcation and channel initiation are related to the convergence of groundwater flow paths (Petroff et al., 2013). Furthermore, characteristics of amphitheaters on the Colorado Plateau can be traced to subsurface chemical weathering and erosion from groundwater flow (Laity and Malin, 1986; Baker et al., 1990). These results lend support to our theoretical development. It may still be surprising that the present theoretical development relates large-scale results to pore-scale processes.
We treat the subsurface as a complex network, with heterogeneity on a wide range of scales, from the pore, through the core and facies, and on through structural and landscape to the tectonic scale. At none of these scales do we consider any particular model of the heterogeneity; we simply assume that it exists and is large, adding orders of magnitude potential variability to local flow rates for a given pressure difference. When percolation concepts can be applied to find the dominant flow paths, the range of possible media that allow application of universal percolation results is wide (Hunt et al., 2014).
The second basic assumption is that the dominant surface flow paths are those for which the cumulative resistance is minimized – a quantification of the general concept that water chooses the path of least resistance. This optimization is assumed to be constrained to a thin, roughly horizontal layer; thus, we seek an optimal path in two dimensions (2D). For any Strahler stream order, we make the additional assumption that this path connects two lines; the next higher order stream and any divide. Under such assumptions, the actual length of a river, L from, e.g., a continental divide to its junction with streams of increasing order should be the following function of the (shortest) Euclidean connecting distance, d,
where 1.21 is the percolation theoretical value for the optimal path exponent in 2D (Porto et al., 1997), and C1 is an unknown constant. Because d is known to relate to drainage basin area A according to the simple relationship from Euclidean geometry (Montgomery and Dietrich, 1992; proportional to A1/2, Church and Mark, 1980), Eq. (1) (Hunt, 2016a) also yields the Hack-type relationship given by
with an acceptable value of Hack's exponent, sometimes considered to be between 0.57 and 0.6 (Gray, 1961; Maritan et al., 1996; Rigon et al., 1996).
Our fundamental new hypothesis is that the optimal 3D path model provides the tortuosity of the constructed interconnected groundwater flow paths with the lowest cumulative resistance. It is known that the length of such a path, s, connecting two perpendicular planes (the vertical extension of the two lines above) is proportional to the Euclidean separation of the planes, d, to the power Dopt, which in 3D is equal to 1.43 (Sheppard et al., 1999). Thus, s = . The magnitude of the constant, C2, is not important at this point (see the discussion in the next paragraph). As the stream length, L, is proportional to d 1.21, this makes s = C' L1.43/1.21 = C'L 1.18, with C' being another constant. In order to make this relationship predictive involving space and time, we need to include in a model fundamental length and time scales. In these choices we are guided by the analogy to the formulation of the scaling relationships for root growth in soil.
A spatio-temporal scaling relationship with similarity to Eq. (1) has been proposed to relate root length RL to root radial extent, RRE, with RL = K * RRE1.21 where K is a constant. In that case, the assumption that the root tip extension rate is constant in time leads to the spatio-temporal scaling equation (Hunt, 2017)
with t0 and x0 being fundamental time and length scales required by dimensional analysis. Reorganizing Eq. (3) yields,
Predictions using the non-linear relationships, such as Eqs. (3) and (4), require reference to particular scales, even though they are scale-free, at least over a wide range of spatial and temporal scales. Since the fractal nature of optimal paths in a heterogeneous medium extends from the pore scale to the maximum extent of the critical zone, we chose (Hunt et al., 2021) the typical, or median, particle size to define the fundamental length scale x0 in Eq. (4). A typical particle size was suggested to be the middle of the silt range, at about 0.00003 m, or 30 μm. Then, in Eq. (4), the ratio x0/t0 represents an annual mean vadose zone flow rate. If vadose zone flow is not limited by the hydraulic conductivity of the shallow soil, it is related to the difference between climatic variables – precipitation and evapotranspiration, i.e., it is strongly climate-dependent.
To take into account the vadose zone flow rate, we can rewrite Eq. (4) in the following form (Hunt, 2017):
Values of v0 ranged across Earth's climate systems from about 0.025 m/yr (near a minimum for appreciable growth of vascular plants) to about 25 m/yr. One can see that the predictions using Eq. (5) are sensitive to the flow rate, v0, but nearly insensitive to the fundamental length scale x0/(x0)0.83 = x0 0.17. Thus, an error in the choice of x0 of a factor of 1000, produces an error in L of a factor near 3.
Using Eq. (5) as an analogy for predicting the spatio-temporal scaling of river networks, retaining the fundamental spatial scale of about 30 microns, but with two distinctions, we can obtain a spatio-temporal scaling equation for the river length, L = (1/C')s1/1.18 = (1/C') (t/(x0/v0))1/1.18. One difference from Eq. (5) is in the exponent, which we proposed above should be derived from the quotient 1.43/1.21 = 1.18 (nearly the value, 1.21, for plant growth). The second change is that we employ results for regional groundwater flow rates, vG, instead of vadose zone mean flow rates, v0.
We access a result for a typical vG = 10 m yr−1 – 20m yr−1 for groundwater from Blöschl and Sivapalan (1995) with about an order of magnitude variability on either side, which would be something like 1.5m yr−1 to 150m yr−1. According to Bloemendal and Theo (2018) high groundwater flow velocity means vG > 25 m yr−1. And, as the US Geological Survey (2021) puts it “A velocity of 1 foot per day or greater is a high rate of movement for ground water, and ground-water velocities can be as low as 1 foot per year.” These latter range corresponds to a range of 0.3 m yr−1 up 110 m yr−1. We will take a somewhat narrower (and cleaner) range of 1 m yr−1 to 100 m yr−1 to characterize the common spread in these flow rates, a range nearly the same as suggested by Blöschl and Sivapalan (1995). For example, desert regions in both southern California (Kulongoski et al., 2003) and the Sudan (Gossel et al., 2004) have known groundwater flow rates of about 1 m yr−1. However, in Germany, typically reported values of groundwater flow velocities in the Rhein graben are closer to the upper limit cited by USGS, and can exceed that limit significantly (https://www.umwelt-online.de/regelwerk/cgi-bin/suchausgabe.cgi?pfad=/wasser/ltws/26b.htm&such=RdErl). Nevertheless, when the flow rate for a given system is known, that rate should be utilized, in order to apply Eq. (5) appropriately.
4. Data and sources
Our fundamental assumption is that basin reorganization is triggered by tectonic processes, such as the initiation of faulting due to plate collisions, extensional rifting, or strike-slip transpressional or transtensional strains. The interval is thus measured starting with the trigger event (may also be due to a previous stream capture) and ending with the integration of the drainage. Such length and time scales, while not arbitrary, are also not unambiguous, and considerable uncertainty is present. Frequently, neither the date of the initiation of the drainage basin change nor that of its equilibration is known accurately. For dates that were given in geologic terms, such as early Pleistocene, we used the standard mean of the stated interval. Dates of tectonic triggers are more broadly defined, while discrete steps of drainage integration (or disintegration) due to steam captures are sometimes more narrowly defined. Sometimes river lengths are not reported, but only annexed drainage basin areas are given. In such cases, Eq. (2), Hack's law (with constant 1.4, when expressed in miles, Rigon et al. (1996), but 2.24, when the constant is expressed in kilometers), could be applied to estimate a river length. Although we applied Hack's original deduced value for C in the two cases where it was necessary, the existence of additional influences on the sinuosity cannot be ruled out. Stream capture occurs by headward erosion of, typically, a second stream at a lower elevation or with greater flow. Such progressions are considered to be bottom up processes. In each type of reorganization, we consider that subsurface flow rates are crucial to the time scale of reorganization.
Because a number of river systems included here were already discussed in Hunt et al. (2021), only those drainages introduced or expanded on here are discussed in what follows.
4.1. Sources
4.1.1. General, at any scale
Two studies of Marshall et al. (2003) and of Mather et al. (2002), cited in Dorsey and Roering (2006), document headward erosion of streams in Costa Rica and Spain, respectively by distances 20 km and 80 km in times of 100 kyr and 320 kyr.
Struth et al. (2020) discussed the reorganization of the 170 km Suarez River basin in Colombia, including its piracy of additional smaller basins along its east side, over a 405 kyr period from its capture by the Magdalena. However, specific distances for the smaller events were not possible to extract. Fan et al. (2018) demonstrated the reorganization of the Daotang basin within 80 kyr of the capture of Yihe River by the Chaiwen, adding 25 km2 to the Yihe River drainage. Hack's law was used to generate a river length from the basin area.
Goudie (2005) notes that the river systems of Africa are some of the most ancient in the world, dating to the Mesozoic, but that Cenozoic reorganization of several has been important, in particular the Nile, the Niger, and the Limpopo/Zambezi system. The Blue Nile and Niger are discussed in Hunt et al. (2021). For the third system (Limpopo/Zambezi), Said et al. (2015) note that the southern Mozambique basin began filling with sediments much more rapidly about 25 Ma at both the Limpopo and Zambezi River deltas (Matthews et al., 2001; Said et al., 2015), but that superposed on that there was a dramatic shift of sediment volume from the Limpopo to the Zambezi at 5 Ma. This they interpret in terms of an onset of uplift at 25Ma and a capture of the upper Limpopo by the Zambezi at the latter date. The time interval Is 20 Myr, the site of capture is upstream of Victoria Falls, and the length of the Zambezi above there is about 1100 km.
We consider a brief discussion of the drainage reorganization of North America summarized by Wang et al. (2020). According to their Figure 1, drainage of most of the USA was to the north in the early Cretaceous (mean age 122Ma). By the late Paleocene (56Ma) the drainage from roughly the present USA Canada border was to the south, with a kind of paleo-Missouri-Mississippi system extending from Idaho through the middle of the continent, before turning south to the Gulf of Mexico. A model for the length of such a river is the present Missouri-Mississippi, which is 5950 km. By the Eocene (mean age 45Ma) a river drainage had formed parallel to the Rio Grande, which started in southern central present-day Arizona and flowed to the Gulf of Mexico, for which the present Rio Grande length (3016 km) is a reasonable model. Although other estimates could potentially be mined from the map, the relative uncertainty in the time frames for the shorter drainages will be higher, given the diminution of the detail of the recorded inferences.
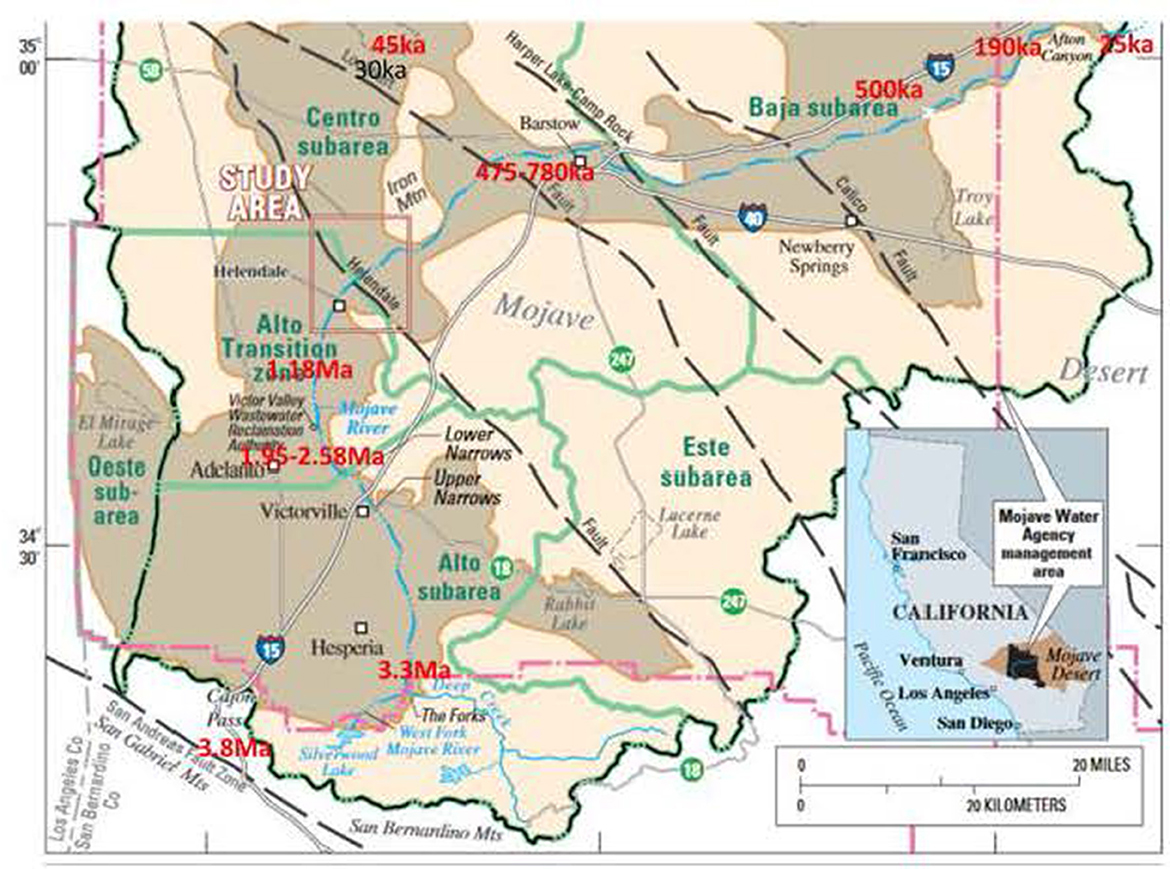
Figure 1. After Stamos et al. (2003) with temporal data superimposed from Hillhouse and Cox (2000), Reheis et al. (2012), Enzel et al. (2003), and Garcia et al. (2014). Boundaries of the Mojave River drainage are shown and the drainage area is shaded. Dates carry uncertainties, which are emphasized near Victorville and Barstow. Note that the placement of the date 3.8Ma is approximate, as it is outside the current drainage of the Mojave River (which has since been beheaded by the southeastward flowing Cajon Creek, Hillhouse and Cox, 2000).
4.1.2. The (semi-) arid southwestern USA
4.1.2.1. Rio Grande and Pecos
Repasch et al. (2017) describe the development of the Rio Grande in a top-down evolution starting in the San Juan range of southern Colorado at 8Ma. By about 5.7Ma, it had arrived in the lower San Luis Basin of New Mexico, by 5.3 Ma, Albuquerque, by about 4.5 Ma, the Palomas Basin, and by 3.1Ma, the Mesilla Basin near El Paso. The Rio Grande arrived at the Hueco Basin further southeast downstream by 2.06Ma and reached the already existing Pecos River and thus the Gulf of Mexico by 0.8Ma. Information for the Pecos comes from Figure 20 of Repasch et al. (2017) and the statements that at 5.3Ma, the Pecos was divided into two separate segments, one flowing eastward to the Ogallala aquifer and one flowing northwards from the border of Texas. These two had integrated as far south as Texas by 4.5Ma and the Pecos without the Rio Grande was fully integrated to the Gulf of Mexico by about 1.5Ma. An important trigger for the integration of the Pecos may have been the onset of the southwest monsoon at 6Ma.
According to Sanford et al. (2004), groundwater in the middle Rio Grande Basin, in Albuquerque, contains a thin veneer of water with source from the Rio Grande itself overlying groundwater from mountains on both the east and west sides of the Rio Grande rift. The layer immediately below the young water from the river itself has a source in the Jemez mountains, a little over 100 km to the north-northwest and a mean age of 19,000 yr. This value is consistent with a regional flow rate of ~6 m yr −1. That it may be reasonable to use such a value over much of the Rio Grande course is suggested by the review of McMahon et al. (2011), in which it is stated that late Pleistocene groundwater is common in the basins throughout the southwest and Great Plains, but exists further east only in confined aquifers. Any inference that Pleistocene groundwater flow rates may have been greater, as was the case for the Mojave River, was oblique, at best.
4.1.3. Mojave River and other inland southern California drainages
While the Mojave River was already addressed in Hunt et al. (2021), only two relevant data points were extracted there. The initiation of the Mojave River drainage system in California is considered to have occurred (Hillhouse and Cox, 2000) at about 3.8Ma and it became integrated to a length of 200 km by about 25ka. The Mojave River was dammed at Afton for 160 ky during pluvial climates before it finally breached the sill and advanced to the Soda Lake about 40 km downstream (Reheis et al., 2012). Less than 10kyr later, the Mojave River arrived in Dumont Lake, 50 km further, and likely reached Death Valley, nearly 150 km further downstream, but Holocene drying interrupted integration of this drainage system (Enzel et al., 2003). If the Pleistocene pluvial period had continued, its full integration to the distance of Death Valley would have been possible in the future.
The history of the Mojave River in southern California, northeast of the transverse ranges, has been studied by many authors, starting with Hillhouse and Cox (2000). Its known history begins at ~3.8Ma, and is associated with the uplift of the transverse ranges through transpression along the San Andreas fault. From these mountain ranges, the Mojave flows first north and then east to the eastern Mojave Desert. In this region of mostly disconnected, internal drainage systems, the climate is currently arid except in the mountains of the river's source. The Mojave River system currently is given as ~200 km in length, integrating several pluvial lake basins along its length. The specific process of integration cited is primarily basin fill and overtopping (Enzel et al., 2003). Times of the arrival of the Mojave River at various sites are mostly established by dating the bottom of lakebed sequences, or other deposits just below the lakebed sediments. A synthesis of research from various authors (Hillhouse and Cox, 2000; Enzel et al., 2003; Reheis et al., 2012; Garcia et al., 2014) allows us to place the approximate dates of arrival of the Mojave on the map in Figure 1.
Enzel et al. (2003) as well as Reheis et al. (2012) and Garcia et al. (2014) emphasize that the expansion of the Mojave River system to the northeast likely required a much wetter climate than currently, with rainfall much larger than at present. Overall, the evolutionary picture is of significant time periods with the Pacific storm track aimed either at northern California or even southern California (Enzel et al., 2003; Reheis et al., 2012). Kulongoski et al. (2003) give groundwater flow rates along the merged alluvial fans north of the transverse ranges as ca. 1m /yr over the last 20,000 years. However, Maxwell et al. (2016) observe that groundwater flow rates are proportional to the difference of P – ET (P = precipitation, ET evapotranspiration). Given rapidly decreasing flow rates with depth (e.g., Koltzer et al., 2019), higher flow rates are also associated with higher water tables. However, pluvial precipitation in the Mojave Desert has been estimated to have been 1.6 to 4 times higher than at present and temperatures 3 – 8 degrees lower (Harvey et al., 1999). An average of 1.6 and 4 is about 2.8, while the geometric mean is 2.53. The lower temperature likely increased the difference of P – ET further. Thus, groundwater flow rates during such Pleistocene climates with their higher precipitation are likely to have been higher than 1 m/yr by a factor 2–3 or more. Furthermore, Enzel et al. (2003) indicate: “Reducing modern rates of evaporation by 50%, and doubling modern rainfall would result in a full lake almost at the elevation of the Lake Mojave shoreline.”
4.1.4. Amargosa River
The Amargosa River rises in southwestern Nevada and flows southward through extreme eastern California before turning west, and then north into Death Valley. It is a mostly ephemeral stream. The Amargosa River in Nevada and California has a history of feeding different lakes in the same (Tecopa) basin multiple times before finally advancing as far as the bottom of Death Valley The discussion here is limited to a quote from the abstract of Reheis et al. (2020). “The High lake reached the highest level achieved in the Tecopa basin, and it may have briefly discharged southward but did not significantly erode its threshold. The High lake was followed by a long hiatus of as much as 300 k.y., during which there is evidence for alluvial, eolian, and groundwater-discharge deposition, but no lakes. We attribute this hiatus, as have others, to blockage of the Amargosa River by an alluvial fan (ca. 20 km) upstream near Eagle Mountain.” This discussion leaves us with an estimate for a data point 300k.y., 20 km. It is possible that, as the river system had previously been integrated below the fan, only the length of the segment related to the fan itself should be considered for the length. A better length scale might be 5 km, as the west side of Eagle Mountain is adjacent to the course of the Amargosa for about 5 km.
Over much of its length, the Amargosa River flows through a climate similar to that of the Mojave River drainage; as no additional information was found about groundwater flow rates, it was assumed that the values for the Mojave were probably reasonable first estimates for the Amargosa as well.
4.1.5. San Jacinto Mountains and River
Dorsey and Roering (2006) establish the adjustment of a drainage on the east (desert) side of the San Jacinto Mountains to the uplift. The advantage is in the analogy of its position to that of the Mojave River, on the lee side of the mountains bounding the coastal plain in Southern California, with strong similarity in climate, provenance, and relief. The measure involved is knick point migration, rather than drainage integration per se, which could be a disadvantage, as knick point migration incorporates a greater input from surface processes. From the authors, “The total distance of knick point migration is ~ 30 km as measured along the Clark fault from the pre-SJFZ drainage divide at Borrego Mt. to the area of active stream capture points at the south edge of Burnt Valley. This distance appears to be a minimum because rocks on the NE side of the Clark fault are moving SE toward Borrego Mt. (on the SW side of the fault). An alternate measurement, from the pre-SJFZ divide on the NE side of the Clark fault to the area of modern stream captures at the edge of Burnt Valley, gives an along-fault distance of ~ 44 km. These values are considered to bracket the total distance of knick point migration.”
We use the mean of these two values, 37 km, for the length scale. Assigning a time interval to the process adds uncertainty, in view of its connection with the uplift of the San Jacinto Mountains. The onset of the uplift of the San Jacinto Mountains in southern California is considered to have been triggered by the initiation of offset along the San Jacinto fault. This has been a challenge on account of the necessity to apportion offsets among many approximately parallel faults over the relatively recent geologic time scale of about 2.5 million years. While disagreement in the timing of the onset has persisted, with some inferring a 2.5 Ma onset (based on a smaller rate of relative motion) more recently the geophysical data have been more uniformly understood to imply ca. 1Ma, or perhaps a few hundred thousand years earlier (Langenheim et al., 2004; Janecke et al., 2010).
A second inference, with greater uncertainty, is available from the coastal side of the San Jacinto Mountains. The San Jacinto River flows through two lake basins to merge with the Santa Ana River 68 km downstream from its source. However, its flow is only rarely sufficient to fill either basin, the San Jacinto (Wang et al., 1995) or Lake Elsinore (3 times since 1900 and 20 times since 1769, Kirby et al., 2007), and reach the Santa Ana River and, thereby, the ocean. This combination suggests a relatively recent integration of the San Jacinto River through its length (68 km). Note that the climate on the coastal side of these mountain ranges is significantly wetter than on the desert side, though the San Jacinto Mountains overall are drier than the San Bernardino and San Gabriel ranges, where the headwaters of the Mojave River are located. Additionally, due to the rainshadow effect from the Santa Ana Mountains (reaching 1620 m), the San Jacinto basin is the driest inland valley in southern California.
4.1.6. Gila River and tributaries
The Gila River system represents the longest integrated drainage system within the state of Arizona, excluding the through flowing Colorado River. Its chief moisture source and permanent stream tributaries originate in the mountains of the Mogollon Rim extending northwest to southeast from Arizona to New Mexico. These streams include the Verde River, Tonto Creek, and the Salt River.
Larson et al. (2020) state that, “A ca. 2.5 Ma age for the initiation of top-down integration of the Verde River from the upper Verde Valley into what are now downstream basins is consistent with the presence of a 3.3 Ma volcanic tephra…” “The basins depicted here were formerly endorheic, but integrated within the last ~2.2–2.8 Ma. The integration of these basins resulted in the modern through-flowing drainage networks of the (320 km) Salt, (272 km) Verde, and Gila Rivers of central Arizona.” The same time frame was implicitly extended to the Salt River. However, the integration of the Gila River itself has been a much longer process, commencing between 15Ma and 12Ma (13.5Ma mean) near the lower Colorado River and continuing to the present, where headward erosion is still occurring and, in discrete steps, lengthening the drainage into disconnected basins nearer the continental divide (Dickinson, 2015). Its length is currently 1044km.
In the text, Dickinson (2015) describes initiation of the incision of Quiburis Basin at 5.75Ma, the Safford Basin at 3.5Ma, and the Duncan Basin at 2Ma, in the process of headward erosion of the Gila River. He also states that headward erosion of the Santa Cruz River was finished by 2Ma. These dates correspond fairly closely to dates given on his maps in his Figures 6 and 7, which yield two data points on the Santa Cruz, two on the San Simon, and five on the San Pedro River. Two important dates are, however, missing. These are the date associated with the bifurcation at the confluence of the San Pedro and Gila Rivers, as well as the corresponding date for a bifurcation near the confluence of the Santa Cruz and Gila Rivers. In neither case is it certain that the date is the same for the further evolution of both mainstem river and its tributary; however, it would be unjustified to assume two different dates. The date for the former bifurcation was estimated by extrapolation down the San Pedro from the last known date to find 7.5Ma, and the second by extrapolation down the Gila from the confluence with the San Pedro to find about 9.5Ma. The remaining dates are read off Dickinson's Figures 6 and 7. Upstream distances from the most recent dates given are also required. The distance from the site roughly midway between Duncan and Redrock to the Gila source was estimated at 300km.
For spring water emerging near the Mogollon Rim in the Verde River catchment, Beisner et al. (2018) find that the oldest ages were 4000-6000 years and those paths were traced to the southern slopes of the San Francisco peaks and the Flagstaff area, about 50 km to the north. This yields a flow rate of about 10 m/yr, but the aquifer is a fractured limestone, and the precipitation at the source is nearly the largest in the state. The same recharge area, located about 80 km from Grand Canyon Village, and somewhat further from Cataract Canyon, was determined to be a source for ancient (> 10,000 yr old) groundwater emerging from springs below the South Rim of the Grand Canyon (Solder et al., 2020). This ancient water mixed in various proportions, up to 100%, with local groundwater. This suggests a regional groundwater flow rate of < 8 m/yr.
Tucson groundwater has a wide range of ages. Remaining groundwater in the vicinity of Tucson has been getting older as pumping has drawn down the water levels (Kalin, 1994). Experiments from 1965 revealed ages < 2000 yr; by 1989, however, the maximum age had increased to over 6000 yr. In both cases, the greatest ages were found along the axis of the valley. The middle of the measured aquifer lies about 10 km from the recharge sources in the Tucson Mountains to the southwest and about 15 km from the Catalina and Rincon Mountains to the Northeast. Pertinent flow rates thus range from about 2 m yr−1 to about 10 m yr−1. Contours in Figure 77 of Kalin (1994) reveal flow rates near the center of the valley at of about 8 m yr −1. The relatively large flow rate under Tucson is consistent with its proximity to the Catalina Mountains, with maximum annual precipitation near the summit of nearly 90 cm (Whittaker and Niering, 1975).
Results are also available for groundwater flow rates in the middle San Pedro basin. According to Hopkins et al. (2014), “Groundwater in the lower basin fill aquifer (semi-confined) was recharged at high elevations in the fractured bedrock and has been extensively modified by water-rock reactions (increasing F and Sr, decreasing 14C) over long timescales (up to 35,000 years B.P.).” As these mountains are 15 km to 20 km from the San Pedro River (Cordova et al., 2015), this generates an estimate of the flow rate as ≥0.5m/yr. In the lower San Pedro river basin, further north, groundwater ages (Robertson, 1992) are closer to 8kyr B.P. to 15kyr B.P., but the mountain ridges are closer, too, at typical distances of 10 km to 15 km from the valley bottom. Thus, in this area, flow rates of about 1 m/yr are common, a value identical to what was measured in the upper Mojave watershed.
The wide range of flow rates is not completely unexpected in view of the range of P-ET values found across Arizona from south to north (Sanford et al., 2004) as well as the known proportionality of groundwater flow rates to P – ET (Maxwell et al., 2016). The region around Flagstaff, according to Sanford et al. (2004) has a net surplus of precipitation compared with ET of about 18cm/yr (63 cm/yr – 45 cm/yr), while the surplus in the San Pedro and Santa Cruz valleys is approximately 3 cm/yr (38 cm/yr−35 cm/yr). The value of the ratio of these two fluxes, 18/3 = 6, is highly uncertain because of the similarity of the terms 38 and – 35 the denominator. However, the finding of Maxwell et al. (2016), that groundwater flow rates are proportional to the difference of P and ET, would indicate that flow rates in southern Arizona should be a factor 6 smaller than in the vicinity of Flagstaff. The inferences from climate are in general accord with the data accessed, and imply a tendency for regional groundwater flow rates to decrease significantly from north to south across the Gila River catchment.
Finally, we mention a literature survey of groundwater ages in 34 alluvial basins in the Basin-and-Range Province and the Transition Zone of Arizona (Eastoe and Towne, 2018). Late Pleistocene water is known in 6 basins below the Mogollon Rim, from Golden Valley in the northwest through Wikieup, Wickenburg, and Phoenix, to Tucson, as well as in 3 basins along the next lineament northeast, Tonto, Safford, and Duncan. Safford and Duncan indeed lie along the Gila River. A Pleistocene age > 10ka, suggests broadly similar regional flow rates all along the dropped down margins of Arizona's topographic high at the Mogollon Rim.
4.2. Climatic summary
For purposes of comparison of world river basins, for which no detailed groundwater flow rates were found, climatic conditions for each drainage basin were assessed as humid, neutral, or dry (arid). Those river drainages integrated under wet or dry conditions are summarized in Table 1; unlisted river systems were considered neutral. Past conditions may not be equivalent to today. Specifically, although the Zambezi River drainage today is mostly rather humid, its past conditions are considered arid: “Some researchers extrapolate low denudation rates across the entire Cenozoic on the basis of the prevailing aridity of the climate and the lack of substantial uplift throughout that period…” (Said et al., 2015). While not all researchers agreed on effects of relatively low relief, there was no disagreement with the classification of the Zambezi basin paleoclimate as arid. While the Rio Grande of today is located in a mostly arid climatic regime, the paleodrainage referenced in Wang et al. (2020) was integrated under much wetter conditions than today.
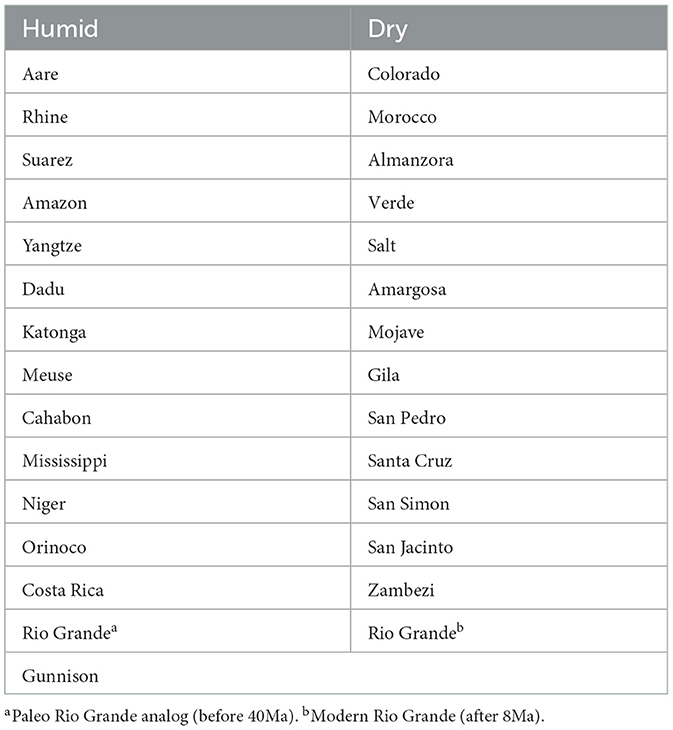
Table 1. General climatic conditions within river drainages.
Areas classified as neither “humid” nor” dry” include four rivers on the west side of India, the Blue Nile, rivers that drain the north side of the Tibetan Plateau (the Yellow River), a river in Italy and one of the river systems from Spain. The Almanzora River, however, assigned to “dry,” is located in what is currently the most arid region of Spain, its southeast. In some of these “neutral” river drainages, the headwaters are in humid climates, while the lower reaches are in arid climates. This particular combination is difficult to classify, though for southwestern USA rivers, our choice tended to the “dry” classification.
5. Results
5.1. Comparison across processes and across climates
In Figure 2, we include our new results for scaling of river lengths with time with existing plots of soil depth and root radial extent (RRE) as functions of time (Hunt, 2017). This figure clearly reveals a relationship between the scaling of river drainages and root systems. However, flow rates governing river lengths appear to be larger than for vegetation, in accord with the afore-mentioned comparisons of regional groundwater flow rates with vadose zone flow rates.
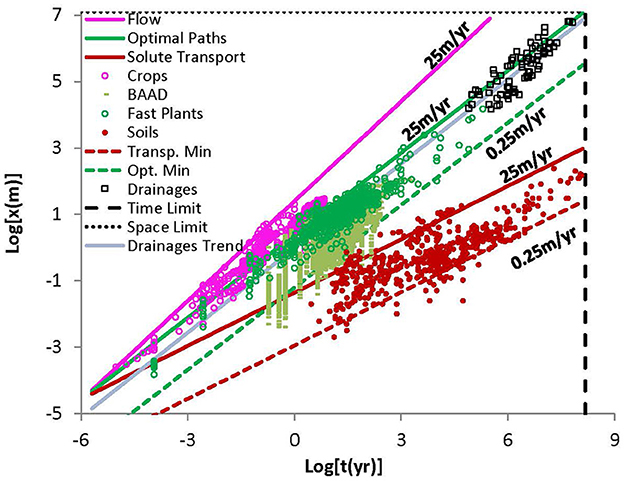
Figure 2. Plotted bilogarithmically are results for plant height or root radial extent (RRE) as a function of time for “fast plants,” (relatively rapidly growing tree species, such as Sequoias and Eucalypts), “BAAD,” (Biometric and Allometric Database), crop heights (without water or nutrient limitations), and soil depths, as well as predictions of equations analogous to Eq. (5), but with the exponent 1/1.87 appropriate to solute transport (soil predictions), 1 (appropriate for crop height predictions), or 1/1.21 (optimal paths or “biological transport”), appropriate for vegetation. The upper and lower bounds of 25 m/yr and 0.25 m/yr are reasonable for unsaturated zone flow, relevant for transpiration or infiltration, though the lower bound could be extended somewhat. Note that the scaling exponent for vegetation growth (1/1.21) is very similar to the power-law extracted from the data for drainage system development (1/1.18). Drainage basin data are consistent with a range of flow rates between 1 m/yr and 100 m/yr, as designated typical by the USGS. The designations “time limit” and “space limit” correspond to the period of a Wilson tectonic cycle and the linear extent of a supercontinent; thus, drainages have at most a time of about one Wilson cycle to develop, and can achieve a length that is, at most, about 1 supercontinent extent.
In Figure 3, we focus on the upper right-hand corner of Figure 2, in order to improve clarity and distinguish better between potential influences from climate and tectonics. Thus, we apply specifically the range of regional subsurface flow rates given by the USGS (1 m/yr to 100 m/yr) to generate minimum and maximum predictions for river length together with a linear spatio-temporal scaling relationship from tectonics. We also include a qualitative designation of climatic conditions. Thus, drainage basins were assessed as humid, neutral, or wet. Specific classifications are given in Table 1; unlisted river systems were considered neutral. Further investigations into paleoclimates may be warranted.
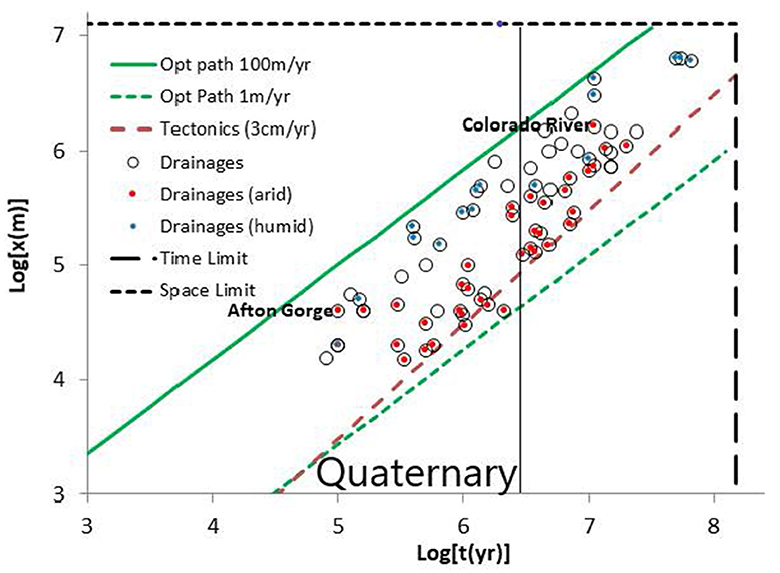
Figure 3. The upper right corner of Figure 2, with crops, vegetation and soil depth removed, but with limiting regional groundwater velocities taken from the US Geological Survey (2021). We distinguished between more arid and more humid climatic conditions in the corresponding river drainages according to the designations from Table 1. We also include a typical continental-scale tectonic rate of about 3 cm yr-1 and the designations “Time Limit” and “Space Limit.” The time limit of about 150 Ma represents the interval since the break-up of the supercontinent Pangaea, while the space limit of about 12,000 km represents the linear dimension of the land mass of Pangaea. An approximate median groundwater flow rate of about 20 m yr', a rapid tectonic rate of about 6 cm yr-1, and the regression line from the observed draines would all meet very nearly at the intersection of “time limit” and “space limit.”
Areas classified as neither “humid” nor “dry” include four rivers on the west side of India, the Blue Nile, rivers that drain the north side of the Tibetan Plateau (the Yellow River), a river in Italy and one of the river systems from Spain. The Almanzora River, assigned to “arid,” is located in what is currently the most arid region of Spain, its southeast. In some of these “neutral” river drainages, the headwaters are in humid climates, while the lower reaches in arid climates. This particular combination is difficult to classify, though for southwestern USA rivers, our choice tended to the “arid” classification. An additional complication is that changes in past climate, which were not considered, may render some of our classifications inaccurate.
Figure 3 suggests some potentially fundamental conclusions regarding river drainages. Arid drainages are found above, but mostly near, the tectonic rate, almost never below it. These arid drainages include the Gila River, its tributaries and the south-eastern California river drainages. Consider, e.g., that the Santa Cruz River does not really reach the Gila River (e.g., Dickinson, 2015). Moreover, a critical scarcity of water exists in the San Pedro drainage somewhat further east, while the Mojave River only reaches the end of its current drainage when rainfall in southern California is especially heavy, and even the Gila River rarely flows all the way to the Colorado River. These results are not purely due to an effect of the arid climate, as water impoundment for human use also plays an important role in current surface water depletion. At the time scales investigated, the rate of drainage integration for these rivers, measured as a spatial velocity, barely exceeds typical extensional tectonic velocities. Thus, the rate of integration is close to the rate at which basins can be pulled apart. In an even drier climate, subsurface flow rates would presumably be too small to accomplish the integration and the river drainages would disaggregate (become discontinuous). This argument does not incorporate the tendency for surface processes, such as wind transport of sand, or gravity-based elevation diffusion, to fill in channels. Consequently, it is not surprising that the Gila River, particularly its southern tributaries, as well as the Mojave and Amargosa Rivers from California, represent the slowest rates of basin integration that we found. At yet longer time scales in, e.g., the Sahara Desert, even river drainages that were once organized, disaggregate (McCauley et al., 1986; Ghoneim et al., 2005), particularly with the existing low flow rates (Gossel et al., 2004).
Second, we point out that several drainage basins located largely within regions of arid climate, the Pecos River, the Colorado River, and the Rio Grande (as well as, in particular, the Afton Gorge segment of the Mojave River), became integrated more rapidly than other drainages with similar aridity, and more rapidly than some in much more humid climates. This anomaly may be partly due to the locations of their sources in areas of significantly larger values of P – ET (the Rocky Mountains and the southern California transverse ranges). These factors may also contribute to a greater role of lake spillover in the process of drainage reorganization, which has been invoked in each case (Meek, 1989, 1990; Spencer et al., 2001; Crow et al., 2021). In these drainages, the oldest dates marking the position of the rivers are, indeed, found furthest upstream. However, this observation need not exclude alternate mechanisms of drainage integration in the same drainage basin predominantly due to subsurface flow. We expect that uncertainty may sometimes be resolved by considering the actual rates of drainage integration.
5.2. Mojave River and related southern and eastern California drainages
Because we have located more detailed data for both flow rates and drainage integration in the cases of the Mojave and Gila River drainages, we consider the two of them in greater detail. In Figure 4 we plot the lengths of the Mojave River sections that were integrated over particular time scales against those times. We use Eq. (5) for prediction and choose a value for the pore-scale flow rate of 2.5 m/yr, generally compatible with P – ET greater than current observations by at least a factor 2.5, as the known groundwater speeds are close to 1 m/yr. The predicted result, except for three data points, is in excellent agreement with observation. The two large discrepancies represent the time for the Mojave River to reach Lake Manix from the vicinity of Barstow, and the time required for the Mojave River to overtop the sill at Lake Afton and arrive downstream at Soda and Silver Lakes. As pointed out by several authors (Meek, 1989, 1990; Reheis et al., 2012), particularly the latter event is considered to have a completely different mechanism than what can be explained through groundwater flow. The overall development of the Mojave over the 3.8Myr time span is also somewhat faster than predicted, largely on account of the two counterexamples identified. This suggests a potential application of Eq. (5) for diagnosis of chief modes of drainage basin development. However, a potential confounding role of uncertainties in dating should also be considered, because a much earlier arrival of the Mojave River in the Barstow area than the mean of the range of the dates given is also possible, shifting the discrepancy between our prediction and observation upstream to the section between Victorville and Barstow.
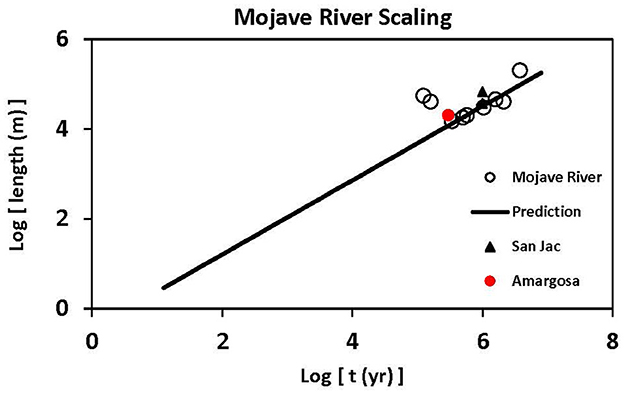
Figure 4. Mojave Desert River scaling of length vs. time. These California rivers are shown: The Mojave and the Amargosa. San Jac (with two data points) stands for two separate rivers flowing off the San Jacinto Mountains: a river flowing down the east side of the southern San Jacinto mountains toward Anza-Borrego Desert State Park and the San Jacinto River, on the west side of the San Jacinto Mountains. The first three examples are all in similar climates on the desert side of the southern California mountains. The fourth is in a somewhat wetter climate on the west side of the San Jacinto Mountains, but the desert side of the Santa Ana Mountains. In the case of the three Mojave River points that are well above the predicted power-law, we interpret the drainage integration below Barstow as having been driven primarily by surface processes with higher fundamental rates.
Note that the time scale for the upstream knickpoint migration on the desert side of the San Jacinto Mountains is also predicted nearly exactly from Eq. (5), although both the Amargosa evolution and the San Jacinto River development are both somewhat underestimated. The underestimation of the Amargosa River length may come from applying Eq. (5) to a prediction of the entire distance to Tecopa Lake from the alluvial fans at Eagle Mountain, instead of merely across the fan. The San Jacinto River drainage basin, on the coastal side of the California peninsular ranges, receives at least double the rainfall that is measured on the desert side and for the Mojave River drainage, which means that using the groundwater flow rates for the Mojave basin would be expected to lead to an underestimation by a factor on the order of 2.
Note that it is actually well-known that the rate of, e.g., upstream knickpoint migration, slows over time (Mather et al., 2002), though previously it has mostly been assumed that other phenomena, associated with surface erosion, are responsible.
5.3. Gila River and associated drainages; Rio Grande and Pecos
Figure 5 shows the scaling of drainage basin evolution in the desert southwest of the USA. The results appear in accord with the scaling law predicted by Eq. (5). Further, the fundamental flow rates that appear in the equation (2.5 m yr−1 for southern California and 6 m yr−1 for the Gila and its northern tributaries), which define time scales in terms of the basic network size and the flow rate, are reasonably in accord with a gradient in such flow rates from > 0.5 m/yr on the southern margins of the Gila Basin to 10 m/yr on the northern margins. As wetter climates in the Mojave during the Pleistocene were cited above to justify employing a subsurface flow rate of 2.5 m/yr, instead of the more recently observed 1 m/yr, it is important that there is also evidence for the existence of lakes in the enclosed basins of south-eastern Arizona over similar time frames (30,000ky B.P to 10,000ky B.P.) (Waters, 1989), in particular Lake Cochise in the Wilcox basin. Thus, application of a larger flow rate than is currently observed may be appropriate there as well. The Rio Grande, however, for which evidence cited above exists, that a 6 m yr−1 regional groundwater flow rate may be appropriate, lies well above the prediction. Any one or combination of the following three factors may play a role: (1) the orientation of the rift is more favorable to drainage basin expansion than in the Basin and Range province, where the principle relief lies athwart the drainages, (2) surface hydrologic processes had a greater relative importance, and (3) groundwater flow rates were higher at relevant times in the past.
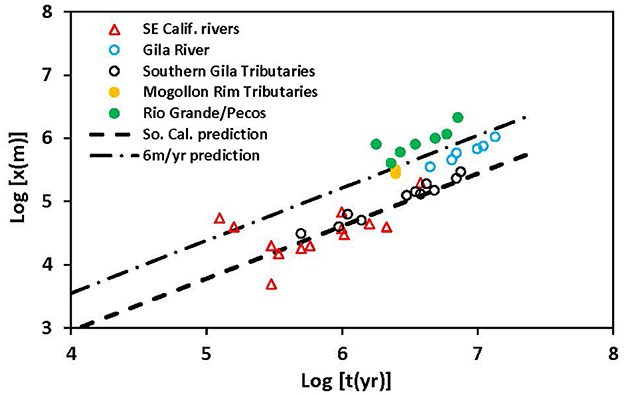
Figure 5. Gila and left and right (south and north) side drainage organization according to time scales. Note that the south side tributaries follow very nearly the same trend as the results of the Mojave River system. The north side tributaries and the Gila River itself are consistent with a scaling function that has the same exponent, but a somewhat larger flow rate, nearly 6 m yr-1, instead of 2.5 m yr-1. The Rio Grande and Pecos Rivers, however, are significantly above the 6 m yr-1 prediction.
We note that two of the data points for the Mojave River, which account for the advance of the Mojave from Barstow to Lake Manix, and from Afton Lake to Soda Lake, are well above the remaining points. These can, as already suggested, be associated with a different process of drainage reorganization, sill overtopping, promoted by Meek (1989, 1990) and supported by Reheis et al. (2012) and Hilgendorf et al. (2020). When we address the two northern tributaries of the Gila, the Salt and the Verde, however, their positions on the graph do not indicate a significant departure from the prediction by Eq. (5). Although they are slightly higher than the points for the mainstem Gila River, the present data do not allow for a definite distinction between overtopping and headward erosion, particularly since groundwater flow rates tend to increase toward the north. Dickinson (2015) and Skotnicki et al. (2021) raised questions regarding mechanisms of these processes, which may be more readily and certainly resolved, if: (1) the present theoretical framework is accurate enough, (2) paleodata to infer groundwater flow rates that are sufficiently precise can be obtained, or (3) more simply, though not necessarily conclusively, if geologic dating methods reveal progressions in age.
6. Conclusions
We propose a solution of a fundamental problem in geology and geomorphology, the spatio-temporal scaling of river basin organization, based on principles tested within the disciplines of soil physics, hydrology, and percolation theory. We seek a solution based on a physical definition of a principle of scale-independency of hydrological processes, in particular, the tendency of water to “seek” paths of least resistance, in order to apply results from the modern theory of percolation across scales (Hunt et al., 2014). In order to predict river length as a function of time subsequent to tectonic or other events triggering drainage basin reorganization, we use a spatio-temporal scaling relationship for transport time scales of mass transported along fractal paths of least resistance, the so-called optimal paths defined in percolation theory. The specific spatio-temporal scaling relationship used for drainage basins is suggested on the assumption of the analogy to the vegetation growth model, but based on using (a) regional groundwater flow rates to establish the relationship between fundamental length and time scales, and (b) the exponent given as the ratio of the 3D optimal path exponent for integration of groundwater flow paths to the 2D exponent that describes the surface expression of river drainage. The proposed relationship is consistent with Hack's law. Our range of predicted river lengths as a function of time, based on a summary of the range of subsurface groundwater flow rates available from the US Geological Survey, captures the observed variability fairly precisely, on time scales from about 10 ka to 100 Ma. In this comparison, drainages in humid climates (re)organized themselves as much as ten times more rapidly than in arid climates.
Using specific Pleistocene, rather than modern, estimates for regional groundwater flow rates, we generate accurate estimates of the temporal scaling of stream lengths for the Amargosa River, the Gila River main stem as well as its tributaries, and most of the Mojave River. However, we underestimate length segments in the Mojave River below Barstow, particularly in the Afton gorge area, as well as the entire Rio Grande and the Pecos River. For the Rio Grande and Pecos Rivers, it is likely that higher Pleistocene regional groundwater flow rates contribute to the discrepancies arising from our use of current flow rates. But probably the more favorable orientation of the geologic lineaments parallel to the evolving stream plays a part as well. In the case of the Mojave River below Barstow, however, the contrast between our prediction and field results seems to require a greater role of surface hydrological processes than our model incorporates. Our model also underpredicts the length of the Colorado River, even though groundwater flow has been recognized as an important contribution to downstream extension of the Colorado River below Lake Mead (Crossey et al., 2015).
We find that the quantitative treatment developed here may also help explain questions posed in the literature. For example, for time scales in the tens of millions of years and length scales beyond a thousand kilometers, river drainage integration may be restricted to groundwater flow rates that generate integration velocities larger than tectonic rates, as Figure 3 reveals an almost complete lack of drainage basin integration in the most arid climates at time scales beyond about 1 Myr. The implied increasing restriction on climates for which drainage basins can be integrated beyond a time scale of 1 Myr is also in agreement with Roberts' (2019) assertion of an increase in the universality of drainage basin features at time scales beyond about 1Ma “At large spatial (≥10 km) and temporal (≥1 Ma) scales drainage networks appear to have a synchronized response to uplift and erosional processes,” though the reorganization of major river basins need not occur gradually.
We note that confirmation of the relevance of fundamental, local-scale, groundwater flow rates to drainage basin evolution does not appear to restrict the validity of the predictions to either headward erosion or silting up basins and spilling over, though, certainly, not all individual locations are accurately treated with the method introduced here.
Because the distinction between surface and subsurface processes is different in submarine and subsurface environments, we suggest that establishment of the importance of such groundwater flow rates in fixing time scales for the development of connected subaerial drainages may also help distinguish subaerial and submarine channel development (Dobbs et al., 2019) in the geologic record.
Data availability statement
The raw data supporting the conclusions of this article will be made available by the authors, without undue reservation.
Author contributions
Concept development and text writing: AH. Text writing: BG and BF. All authors contributed to the article and approved the submitted version.
Funding
AH is grateful for special publication funds from Wright State University. BF work was partially supported by the SFA Watershed Project funded by the U.S. DOE Office of Sciences.
Conflict of interest
The authors declare that the research was conducted in the absence of any commercial or financial relationships that could be construed as a potential conflict of interest.
Publisher's note
All claims expressed in this article are solely those of the authors and do not necessarily represent those of their affiliated organizations, or those of the publisher, the editors and the reviewers. Any product that may be evaluated in this article, or claim that may be made by its manufacturer, is not guaranteed or endorsed by the publisher.
References
Baker, V. R., Kochel, R. C., Laity, J. E., and Howard, A. E. (1990). Spring sapping and valley network development. GSA Special Paper 252, 235. doi: 10.1130/SPE252-p235
Beisner, K. R., Gardner, W. P., and Hunt, A. G. (2018). Geochemical characterization and modeling of regional groundwater contributing to the Verde River, Arizona between Mormon Pocket and the USGS Clarkdale gage. J. Hydrol. 564, 99–114. doi: 10.1016/j.jhydrol.2018.06.078
Bejan, A., and Errera, M. (2011). Deterministic tree networks for fluid flow: geometry for minimal flow resistance between a volume and one point. Fractals 5, 685–695. doi: 10.1142/S0218348X97000553
Bloemendal, M., and Theo, O. (2018). ATES systems in aquifers with high ambient groundwater flow velocity. Geothermics 75:81–92.
Blöschl, G., and Sivapalan, M. (1995). Scale issues in hydrological modelling: a review. Hydrol. Proc. 9, 251–290. doi: 10.1002/hyp.3360090305
Church, M., and Mark, D. M. (1980). On size and scale in geomorphology. Prog. Phys. Geograph. 4, 302. doi: 10.1177/030913338000400302
Cordova, J. T., Dickinson, J. E., Beisner, K. R., Hopkins, C. B., Kennedy, J. R., and Pool, D. R. (2015). Hydrology of the Middle San Pedro Watershed, Southeastern Arizona, US Geological Survey, Scientific Investigations Report 2013–5040. Prepared in Cooperation With the Arizona Department of Water Resources. Menlo Park, CA: U.S. Department of the Interior U.S. Geological Survey U.S. Department of the Interior.
Crossey, L. C., Karlstrom, K. E., Dorsey, R., Pearce, J., Wan, E., Beard, L. S., et al. (2015). Importance of groundwater in propagating downward integration of the 6–5 Ma Colorado River system: Geochemistry of springs, travertines, and lacustrine carbonates of the Grand Canyon region over the past 12 Ma. Geosphere 11, 660–682. doi: 10.1130/GES01073.1
Crow, R. S., Schwing, J., Karlsrom, K. E., Heizler, M., Pearthree, P. A., House, P. K., et al. (2021). Redefining the age of the lower Colorado River, southwestern United States. Geology 49, 635–640. doi: 10.1130/GEOL.S.13530698.v1
DiBiase, R. A., and Heimsath, A. M. (2012). Hillslope response to tectonic forcing in threshold landscapes. Earth Surf. Proc. Landf. 289, 134–144. doi: 10.1002/esp.3205
Dickinson, W. R. (2015). Integration of the Gila River drainage system through the Basin and Range province of southern Arizona and southwestern New Mexico. Geomorphology 236, 1–24. doi: 10.1016/j.geomorph.2015.02.004
Dixon, J. L., and Heimsath, A. M. (2009). The critical role of climate and saprolite weathering in landscape evolution. Earth Surf. Proc. Landf. 34, 1507–1521. doi: 10.1002/esp.1836
Dobbs, S. C., McHargue, T., Malkowski, M. A., Gooley, J. T., Jaikla, C., White, C. J., et al. (2019). Are submarine and subaerial drainages morphologically distinct? Geology 47, 1093–1097. doi: 10.1130/G46329.1
Dorsey, R. J., and Roering, J. J. (2006). Quaternary landscape evolution in the San Jacinto fault zone, Peninsular Ranges of Southern California: transient response to strike-slip fault initiation. Geomorphology 73, 0169-555X. doi: 10.1016/j.geomorph.2005.06.013
Eastoe, C., and Towne, D. (2018). Regional zonation of groundwater recharge mechanisms in alluvial basins in Arizona: interpretation of isotope mapping. J. Geochem. Expl. 194, 134–145. doi: 10.1016/j.gexplo.2018.07.013
Egli, M., Hunt, A. G., Dahms, D., Raab, G., Derungs, C., Raimondi, S., et al. (2018). Prediction of soil formation as a function of age using the percolation theory approach. Front. Environ. Sci. 28, 108. doi: 10.3389/fenvs.2018.00108
Enzel, Y., Wells, S. G., and Lancaster, N. (2003). Late Pleistocene lakes along the Mojave River, southeast California. Geol. Soc. Am. Special Papers 368, 61–77. doi: 10.1130/0-8137-2368-X.61
Fan, N., Chu, Z., Jiang, L., Hassan, M. A., Lamb, M. P., Liu, X., et al. (2018). Abrupt drainage reorganization following a Pleistocene river capture. Nat. Commun. 9, 3756. doi: 10.1038/s41467-018-06238-6
Fielding, L., Najman, Y., Millar, I., Butterworth, P., Garzanti, E., Vezzoli, G., et al. (2018). The initiation and evolution of the river Nile. Earth Planet. Sci. Lett. 489, 166–178. doi: 10.1016/j.epsl.2018.02.031
Garcia, A. L., Knott, J. R., Mahan, S. A., and Bright, J. (2014). Geochronology and paleoenvironment of pluvial Harper Lake, Mojave Desert, California, USA. Quaternary Res. 81, 305–317. doi: 10.1016/j.yqres.2013.10.008
Ghanbarian, B., Hunt, A. G., Ewing, R. P., and Sahimi, M. (2013). Tortuosity in porous media: a critical review. Soil Sci. Soc. Am. 77, 1461–1477. doi: 10.2136/sssaj2012.0435
Ghoneim, E., Benedotti, M., and El-Baz, F. (2005). An integrated remote sensing and GIS analysis of the Kufrah paleoriver, eastern Sahara. Geomorphology 140, 242–257. doi: 10.1016/j.geomorph.2011.10.025
Gossel, W., Ebraheem, A. M., and Wycisk, P. (2004). A very large scale GIS-based groundwater flow model for the Nubian sandstone aquifer in Eastern Sahara (Egypt, northern Sudan and eastern Libya). Hydrogeol. J. 12, 698–713. doi: 10.1007/s10040-004-0379-4
Goudie, A. S. (2005). The drainage of Africa since the Cretaceous. Geomorphology 67, 437–456. doi: 10.1016/j.geomorph.2004.11.008
Grant, U. S. (1948). Influence of the water table on beach aggradation and degradation. J. Marine Res. 7, 655–660.
Gray, D. M. (1961). Interrelationships of watershed characteristics. J. Geophys. Res. 66, 1215–1223. doi: 10.1029/JZ066i004p01215
Gunnell, Y., and Harbor, D. J. (2010). Butte detachment: how pre-rift geological structure and drainage integration drive escarpment evolution at rifted continental margins. Earth Surf. Proc. Landforms 35, 1373–1385. doi: 10.1002/esp.1973
Hack, J. T. (1957). Studies of Longitudinal Profiles in Virginia and Maryland. Washington DC: USGS Professional Papers.
Harvey, A. M., Wigand, P. E., and Wells, S. G. (1999). Response of alluvial fan systems to the late Pleistocene to Holocene climatic transition: contrasts between the margins of pluvial Lakes Lahontan and Mojave, Nevada and California, USA. Catena 36, 255–281. doi: 10.1016/S0341-8162(99)00049-1
Hilgendorf, Z., Wells, G., Larson, P. H., Millett, J., and Kohout, M. (2020). From basins to rivers: Understanding the revitalization and significance of top-down drainage integration mechanisms in drainage basin evolution. Geomorphology 352, 107020. doi: 10.1016/j.geomorph.2019.107020
Hillhouse, J. W., and Cox, B. F. (2000). Pliocene and Pleistocene Evolution of the Mojave River, and Associated Tectonic Development of the Transverse Ranges and Mojave Desert, Based on Borehole Stratigraphy Studies. Victorville, CA: US Department of the Interior, US Geological.
Hopkins, C. B., McIntosh, J. C., Eastoe, C., Dickinson, J. E., and Meixner, T. (2014). Evaluation of the importance of clay confining units on groundwater flow in alluvial basins using solute and isotope tracers: the case of Middle San Pedro Basin in southeastern Arizona (USA). Hydrogeol. J. 22, 829–849. doi: 10.1007/s10040-013-1090-0
Horton, R. E. (1932). Drainage basin characteristics. Trans. Am. Geophys. Union 13, 350–361. doi: 10.1029/TR013i001p00350
Horton, R. E. (1945). Erosional development of streams and their drainage basins; hydrophysical approach to quantitative morphology. Geol. Soc. Am. Bull. 56, 275–370. doi: 10.1130/0016-7606(1945)56[275:EDOSAT]2.0.CO;2
Hunt, A., Faybishenko, B., and Ghanbarian, B. (2021). Non-linear hydrologic organization. Nonlin. Proc. Geophys. 28, 599–614. doi: 10.5194/npg-28-599-2021
Hunt, A. G. (2016a). Possible explanation of the values of Hack's drainage basin, river length scaling exponent. Non-Lin. Proc. Geophys. 23, 91–93. doi: 10.5194/npg-23-91-2016
Hunt, A. G. (2016b). Spatio-temporal scaling of vegetation growth and soil formation from percolation theory. Vadose Zone J. 15, 1–15. doi: 10.2136/vzj2015.01.0013
Hunt, A. G. (2017). Spatiotemporal scaling of vegetation growth and soil formation: explicit predictions. Vadose Zone J. 16, 1–12. doi: 10.2136/vzj2016.06.0055
Hunt, A. G., Ewing, R. P., and Ghanbarian, B. (2014). Percolation Theory for Flow in Porous Media, Lecture Notes in Physics. Berlin: Springer.
Janecke, S. U., Dorsey, R. J., Forand, D., Steely, A. N., Kirby, S. M., Lutz, A. T., et al. (2010). High geologic slip rates since early pleistocene initition of the San Jacinto and San Felipe fault zones in the San Andreas fault system: Southern California, USA. The Geol. Soc. Am. Spec. Paper 25, 4752010. doi: 10.1130/2010.2475
Kalin, R. M. (1994). The Hydrogeochemical Evolution of the Groundwater of the Tucson Basin With Application to 3-Dimensional Groundwater Flow Modelling. Arizona: University of Arizona.
Kirby, M., Lund, S., Anderson, M., and Bird, B. (2007). Insolation forcing of Holocene climate change in Southern California: a sediment study from Lake Elsinore. J. Paleolimnol. 38, 395–417. doi: 10.1007/s10933-006-9085-7
Kirchner, J. W. (1993). Statistical inevitability in Horton's laws and the apparent randomness of stream channel networks. Geology 21, 591–594. doi: 10.1130/0091-7613(1993)021<
Koltzer, N., Scheck-Wenderoth, M., Cacace, M., Frick, M., and Bott, J. (2019). Regional hydraulic model of the Upper Rhine Graben. Adv. Geosci. 49, 197–206. doi: 10.5194/adgeo-49-197-2019
Kulongoski, J. T., Hilton, D. R., and Izbicki, J. A. (2003). Helium isotope studies in the Mojave Desert, California: implications for groundwater chronology and regional seismicity. Chem. Geol. 202, 95–113. doi: 10.1016/j.chemgeo.2003.07.002
Laity, J. E., and Malin, M. (1986). Sapping processes and the development of theater headed valley networks on the Colorado Plateau. GSA Bulletin 96, 203–217. doi: 10.1130/0016-7606(1985)96<
Langenheim, V. E., Jachens, R. C., Morton, D. M., Kistler, R. W., and Matti, J. C. (2004). Geophysical and isotopic mapping of preexisting crustal structures that influenced the location and development of the San Jacinto fault zone. GSA Buletin 116, 1143–1157. doi: 10.1130/B25277.1
Larson, P. H., Dorn, R. I., Skotnicki, J., Seong, Y. B., Jeong, A., Deponty, J., et al. (2020). Impact of drainage integration on basin geomorphology and landform evolution: A case study along the Salt and Verde rivers, Sonoran Desert, USA. Geomorphology 371 107439 doi: 10.1016/j.geomorph.2020.107439
Maher, K. (2010). The dependence of chemical weathering rates on fluid residence time. Earth Planet. Sci. Lett. 294, 101–110. doi: 10.1016/j.epsl.2010.03.010
Maritan, A., Rinaldo, A., Rigon, R., Giacometti, A., and Rodriguez-Iturbe, I. (1996). Scaling laws for river networks. Phys. Rev. E 53, 1510–1515. doi: 10.1103/PhysRevE.53.1510
Marshall, J. S., Idleman, B. D., Gardner, T. W., and Fisher, D. M. (2003). Landscape evolution within a retreating volcanic arc Costa Rica. Central Am. Geol. 31, 419–4222. doi: 10.1130/0091-7613(2003)031<0419:LEWARV>2.0.CO;2
Mather, A. E., Stokes, M., and Griffiths, J. S. (2002). Quaternary landscape evolution: a framework for understanding contemporary erosion. Spain Land Deg. Dev. 13, 89–109. doi: 10.1002/ldr.484
Matthews, A., Lawrence, S. R., Mamad, A. V., and Fortes, C. (2001). Mozambique basin may have bright future under new geological interpretation. Oil Gas. J. 2, 70–76.
Maxwell, R., Condon, L. E., Kollet, S. J., Maher, K., Haggerty, R., Forrester, M. M., et al. (2016). The imprint of climate and geology on the residence times of groundwater. Geophys. Res. Lett. 43, 701–708. doi: 10.1002/2015GL066916
McCauley, J. F., Breed, C. S., Schaber, G. G., McHugh, W. P., Bahayissawi, C. V., Haynes, V., et al. (1986). Paleodrainages of the Eastern Sahara, the radar rivers revisited, (SIR-A / B Implicatins for a Mid-Tertiary rans-African drainage system). IEEE Trans. Geosci. Remote Sensing. 24, 678. doi: 10.1109/TGRS.1986.289678
McMahon, P. B., Plummer, L. N., Böhlke, J. K., Shapiro, S. D., and Hinkle, S. R. (2011). A comparison of recharge rates in aquifers of the United States based on groundwater-age data. Hydrogeol. J. 19, 779–800. doi: 10.1007/s10040-011-0722-5
Meek, N. (1989). Geomorphologic and hydrologic implications of the rapid incision of afton canyon, mojave desert. Geology 12, 7–10. doi: 10.1130/0091-7613(1989)017<0007:GAHIOT>2.3.CO;2
Meek, N. (1990). Late Quaternary geochronology and geomorphology of the Manix Basin, San Bernardino County, California [Ph.D. thesis] Los Angeles, CA: University of California.
Montgomery, D. R., and Dietrich, W. E. (1992). Channel initiation and the problem of landscape scale. Science 255, 826–830. doi: 10.1126/science.255.5046.826
Pelletier, J. D. (1999). Self-organization and scaling relationships of evolving river networks. J. Geophys. Res. 104, 7359–7375. doi: 10.1029/1998JB900110
Petroff, A. P., Devauchelle, O., Seybold, H., and Rothman, D. H. (2013). Bifurcation dynamics of natural drainage networks. Philos. Trans. Royal Soc. 371, 365. doi: 10.1098/rsta.2012.0365
Porto, M., Havlin, S., Schwarzer, S., and Bunde, A. (1997). Optimal path in strong disorder and shortest path in invasion percolation with trapping. Phys. Rev. Lett. 79, 4060–4062. doi: 10.1103/PhysRevLett.79.4060
Reheis, M. C., Bright, J., Lund, S. P., and Miller, D. M. (2012). A half-million year record of paleoclimate from the Lake Manix core, Mojave Desert, California. Palaeogeograph. Palaeoclim. Palaeoecol. 366, 11–37. doi: 10.1016/j.palaeo.2012.09.002
Reheis, M. C., Caskey, J., Bright, J., Paces, J. B., Mahan, S., Wan, E., et al. (2020). Pleistocene lakes and paleohydrologic environments of the Tecopa basin, California: constraints on the drainage integration of the Amargosa River. GSA Bulletin 132, 1537–1565. doi: 10.1130/B35282.1
Repasch, M., Karlstrom, K., Heizler, M., and Pecha, M. (2017). Birth and evolution of the Rio Grande fluvial system in the past 8Ma: progressive downward integration and the influence of tectonics, volcanism, and climate. Earth Sci. Rev. 168, 113–164. doi: 10.1016/j.earscirev.2017.03.003
Rhoads, B. (2020). The Dynamics of Drainage Basins and Stream Networks. River Dynamics: Geomorphology to Support Management. Cambridge: Cambridge University Press, 15–46.
Rigon, R., Rinaldo, A., Rodriguez-Iturbe, I., Bras, R. L., and Ijjasz-Vasquez, E. (1996). Optimal channel networks: a framework for the study of river basin morphology. Water Resources Res. 29, 1635–1646. doi: 10.1029/92WR02985
Roberts, G. (2019). Scales of similarity and disparity between drainage networks. Geophys. Rese. Lett. 46, 3781–3790. doi: 10.1029/2019GL082446
Robertson, F. N. (1992). Radiocarbon dating of a confined aquifer in southeast Arizona. Radiocarbon 34, 664–676. doi: 10.1017/S0033822200063955
Said, A., Moder, C., Clark, S., and Ghorba, B. (2015). Creatceous-Cenozoic sedimentary budgets of the southern Mozambique Basin: Implications for uplift history of the South African Plateau. J. African Earth Sci. 109, 1–10. doi: 10.1016/j.jafrearsci.2015.05.007
Sanford, W. E., Plummer, L. N., McAda, D. P., Bexfield, L. M., and Anderholm, S. K. (2004). Hydrochemical tracers in the middle Rio Grande Basin, USA:2. Calibration of a groundwater-flow model. Hydrogeol. J. 12, 389–407. doi: 10.1007/s10040-004-0326-4
Scheidegger, A. E. (1965). The algebra of stream order numbers. US Geol. Survey Prof. Paper 52, 187–189.
Schumm, S. A. (1956). Evaluation of drainage system and slopes in badlands at Perth Amboy, New Jersey. Geol. Soc. Am. Bull 67, 597–646. doi: 10.1130/0016-7606(1956)67[597:EODSAS]2.0.CO;2
Sheppard, A. P., Knackstedt, M. A., Pinczewski, W. V., and Sahimi, M. (1999). Invasion percolation: new algorithms and universality classes. J. Phys. 32, L521. doi: 10.1088/0305-4470/32/49/101
Shreve, R. L. (1967). Infinite topologically random channel networks. The J. Geol. 75, 178–186. doi: 10.1086/627245
Skotnicki, S. J., Seong, Y. B., Dorn, R. I., Larson, P. H., DePonty, J., Jeong, A., et al. (2021). Drainage integration of the Salt and Verde rivers in a Basin and Range extensioal landscape, central Arizona, USA. Geomorphology 374, 107512. doi: 10.1016/j.geomorph.2020.107512
Solder, J. E., Beisner, K. R., Anderson, J., and Bills, D. J. (2020). Rethinking groundwater flow on the South Rim of the Grand Canyon, USA: characterizing recharge sources and flow paths with environmental tracers. Hydrogeol. J. 28, 1593–1613. doi: 10.1007/s10040-020-02193-z
Spencer, J. E., Pearthree, P. A., Young, R. A., and Spamer, E. E. (2001). Headward erosion versus closed-basin spillover as alternative causes of Neogene capture of the ancestral Colorado River by the Gulf of California. Colorado River 12, 215–219.
Stamos, C. L., Cox, B. F., Izbicki, J. A., and Mendez, G. O. (2003). Geologic Setting, Geohydrology and Ground-Water Quality near the Helendale Fault in the Mojave River Basin, San Bernardino County, California, Prepared in cooperation with the Mojave Water Agency, Sacramento, Water-Resources Investigations Report 03-40697208-24. Washington, DC: U.S. Department of the interior, U.S. Geological Survey.
Stolze, L., Arora, B., Dwivedi, D., Steefel, C., Li, Z., Carrero, S., et al. (2023). Aerobic respiration controls on shale weathering. Geochimica et Cosmochimica Acta 340, 172–188. doi: 10.1016/j.gca.2022.11.002
Strahler, A. N. (1964). “Geology. Part II. Quantitative geomorphology of drainage basins and channel networks,” in Handbook of Applied Hydrology, ed V.T. Chow (McGraw-Hill: Wiley), 4–76.
Struth, L., Giachetta, E., Willett, S. D., Owen, L. A., and Teson, E. (2020). Quaternary drainage network reorganization in the Colombian eastern cordillera plateau. Easrth Surf. Process. Landforms 45, 1789–1804. doi: 10.1002/esp.4846
Tucker, G. E., and Bras, R. L. (2000). A stochastic approach to modeling the role of rainfall variability in drainage basin evolution. Water Resources Res. 36, 1953–1964. doi: 10.1029/2000WR900065
US Geological Survey. (2021). General Facts and Concepts About Ground Water. Available online at: https://pubs.usgs.gov/circ/circ1186/html/gen_facts.html (accessed April 3, 2021).
Wang, C., Mortazavi, B., Liang, W. K., Sun, N. Z., and Yeh, W. W. -G. (1995). Model development for conjunctive use study of the San Jacinto Basin California, Paper No. 93148 of the water resources bulletin. J. Am. Water Res. Assoc. 31, 227–241. doi: 10.1111/j.1752-1688.1995.tb03376.x
Wang, H., Gurnis, M., and Skogseid, J. (2020). Continent-wide drainage reorganization in North America driven by mantle flow. Earth Planet. Sci. Letters 530 115910. doi: 10.1016/j.epsl.2019.115910
Waters, M. R. (1989). Late Quaternary lacustrine history and palaeoclimatic significance of pluvial Lake Cochise, southeastern Arizona. Quat. Res. 32, 1–11. doi: 10.1016/0033-5894(89)90027-6
Whittaker, R. H., and Niering, W. A. (1975). Vegetation of the Santa Catalina Mountains Arizona, V. Biomass, production, and diversity along the elevation gradient. Ecology 56, 71–90. doi: 10.2307/1936291
Willett, S. D., McCoy, S. W., Perron, J. T., Goren, L., and Chen, C.-Y. (2014). Dynamic reorganization of river basins. Science 343, 1248765. doi: 10.1126/science.1248765
Willgoose, G., Bras, R. L., and Rodriguez-Iturbe, I. (1991). Results from a new model of river basin evolution. Earth Surf. Proc. Landforms 16, 237–254. doi: 10.1002/esp.3290160305
Xiangjiang, H., and Niemann, J. D. (2006). Modelling the potential impacts of groundwater hydrology on long-term drainage basin evolution. Earth Surf. Proc. Landforms 31, 1802–1823. doi: 10.1002/esp.1369
Young, R. A., and Spamer, E. E. (2001). The Colorado River: Origin and Evolution. Grand Canyon, AZ: Grand Canyon Association Monograph.
Keywords: river, network, scaling, fractals, percolation, drainage
Citation: Hunt AG, Ghanbarian B and Faybishenko B (2023) A model of temporal and spatial river network evolution with climatic inputs. Front. Water 5:1174570. doi: 10.3389/frwa.2023.1174570
Received: 26 February 2023; Accepted: 07 August 2023;
Published: 14 September 2023.
Edited by:
Ronald Erwin Pöppl, University of Vienna, AustriaReviewed by:
Jonathan Phillips, East Carolina University, United StatesAnthony Parsons, The University of Sheffield, United Kingdom
Copyright © 2023 Hunt, Ghanbarian and Faybishenko. This is an open-access article distributed under the terms of the Creative Commons Attribution License (CC BY). The use, distribution or reproduction in other forums is permitted, provided the original author(s) and the copyright owner(s) are credited and that the original publication in this journal is cited, in accordance with accepted academic practice. No use, distribution or reproduction is permitted which does not comply with these terms.
*Correspondence: Boris Faybishenko, YmFmYXliaXNoZW5rb0BsYmwuZ292