 Inna Kurganskaya1,2*
 Andreas Luttge1,2,3
- 1Geoscience Department (FB5), University of Bremen, Bremen, Germany
- 2MAPEX, Center for Materials and Processes, University of Bremen, Bremen, Germany
- 3MARUM-Center for Marine Environmental Sciences, Bremen, Germany
The correct quantification of mineral dissolution rates is a critical task for macroscopic reactive transport modeling. Previous studies showed a substantial rate variability of about two orders of magnitude, which cannot be explained by variance of external environmental parameters alone. If the rate cannot be predicted as a constant parameter, then the critical question is whether it can be predicted as a stable reproducible probability distribution. Although a large variety of factors may contribute to the overall variance across the scales, the effect of defect density and defect spatial distribution can be considered as one of the key variance sources. Here, we tested the reproducibility of probability distributions for Kossel crystals with a different amount and spatial configurations of lattice dislocations. We ran several tests on systems with the same configurations and calculated the probabilities of material flux. Surprisingly, we discovered that the density of dislocations has minimal impact on the probability distributions. However, the spatial location of dislocations has a substantial influence on the rate distributions reproducibility. In cases where multiple etch pits operate simultaneously, reproducible rate distributions are found regardless of the number of dislocations. In cases where dislocations formed clusters, one large etch pit controlled the entire surface, and sets of reproducible probability distributions were detected. Then, more complex statistical behavior is expected, since the result is path-dependent. These results have serious consequences for the implementation of rate distributions in reactive transport models. Further studies, however, are needed to provide clear guidance on relating surface morphologies, dislocation distributions, and dissolution rate variance. The role of material-specific properties, such as crystallographic structure and bonding, in rate distributions, should be additionally addressed. The role of grain boundaries, crystal size and crystal habit, including nanoparticulate forms, in rate variance, also should be addressed for practical applications.
1. Introduction
The growing demand of modern societies for reliable and predictable numerical models of critical geochemical processes can now be fulfilled with computational power. The ideas to solve important environmental problems, e.g., CO2 sequestration (Balashov et al., 2013; Daval et al., 2013; Hellmann et al., 2013; Jun et al., 2013, 2017; Smit, 2016; Arif et al., 2017; Daval, 2018; Wild et al., 2019; Loganathan et al., 2020; Deng et al., 2022; Shabani et al., 2022; Urych et al., 2022), water cleaning (Bhattacharyya and Gupta, 2007; Barry et al., 2021), soil enrichment and remediation from pollution (Aredes et al., 2012; Björneholm et al., 2016; Niazi et al., 2023), prediction of oil and gas reservoir behavior (Browning and Murphy, 2003; Steefel et al., 2015), or the safety of nuclear waste repositories (Payne et al., 2013; Kalinichev et al., 2017; Leal et al., 2017; Vinograd et al., 2018; Androniuk and Kalinichev, 2020; Wieland et al., 2020; Cygan et al., 2021; Claret et al., 2022; Liu et al., 2022), geothermal resource modeling (Wilson et al., 2001; Yapparova et al., 2014, 2019, 2023; Whitaker and Frazer, 2018; Lamy-Chappuis et al., 2022), in silico via computer simulations seem to be both promising and economically efficient. Understanding the process-controlling reactions at mineral surfaces, i.e., dissolution, adsorption, nucleation, and crystal growth, constitutes a milestone in geochemical process modeling (Brantley et al., 2008; Lichtner et al., 2018; Xiao et al., 2018; Poonoosamy et al., 2021; Prill et al., 2021; Deng et al., 2022). The combination of such models with sophisticated experimental techniques and complementary field studies propels us into a new era of multidisciplinary science. Communication between the communities of geochemists, physicists, chemists, environmental engineers, and applied mathematicians, to name only a few, becomes especially important in this perspective.
The ideas of pioneers such as Vernadsky and Goldschmidt (Müller, 2014) presented all natural processes on Earth as perpetual movement of chemical elements between geochemical reservoirs: the Earth mantle and crust, soils, rivers, watersheds, swamps, lakes, and oceans. Each reservoir is characterized by their own predominant thermodynamic and kinetic mechanisms of material production (nucleation and growth) and destruction (mechanical decomposition and dissolution). Each location within the respective reservoir is a complex chemical microcosm powered by fundamental physical forces operating at different scales, i.e., gradients in temperature and pressure, gravity, chemical potentials, and electrostatic interactions. The fundamental laws of interactions, such as Newtonian equations of kinetic motion, or Coulomb interactions, alone cannot always capture the complex chemical machinery of chemical element conversion and transport from immobile (solids) to mobile (ions in fluids) forms. However, we note that classical chemical kinetics providing reaction rates for very simple molecular processes in many practical applications cannot be considered as a reliable choice for macroscopic modeling of geochemical processes (Lüttge et al., 2013; Luttge et al., 2019). A vast variety of molecular reactions taking place at solid-fluid interfaces of complex solid materials may happen in such systems (Brantley et al., 2008). Material transport is another factor that adds complexity to reaction mechanisms at different scales. The fundamental problem is, thus, how to model geochemical processes across the scales taking into account the complexity of geochemical reactions and material transport (Zhu, 2009).
It is necessary to obtain data about a reactive solid-fluid system at a variety of scales, i.e., from the molecular scale via molecular modeling (Kubicki, 2016) and spectroscopic techniques (Hawthorne, 2018), to the reservoir scale via modeling porosity networks and making massive CT scans (Lichtner et al., 2018). This comprehensive approach provides knowledge about geochemical reaction mechanisms, although the process of data collection is tedious and expensive. The critical issue related to such studies is transferability of knowledge obtained for each process of interest at a specific location to other similar processes at other locations. A remarkable example of geochemical process complexity is an intrinsic variance of mineral dissolution rates, which cannot be attributed to the variance of external environmental conditions (Arvidson et al., 2003; Fischer et al., 2012, 2014; Lüttge et al., 2013; Luttge et al., 2019). The intrinsic rate variance is reported to be as large as two orders of magnitude and attributed to variance of reactive surface site density and reactivity of different surface features (Arvidson et al., 2003; Fischer et al., 2012; Levenson and Emmanuel, 2013; Lüttge et al., 2013; Noiriel et al., 2018). The full description of variance sources is a non-trivial task: thus, molecular scale controls, such as water exchange frequency at different sites (Wolthers et al., 2013), different crystallographic face orientations (Godinho et al., 2012, 2014), different crystal habits (Bouissonnié et al., 2021), or etch pit morphology evolution (Brantley et al., 1986; Bandstra and Brantley, 2008; Pollet-Villard et al., 2016).
The underlying work hypothesis is the intrinsic stochasticity of the dissolution rates. A fundamental problem of practical importance is how to predict dissolution rates for macroscopic scale modeling (Li et al., 2006; Balashov et al., 2013, 2015; Lugo-Méndez et al., 2015; Steefel et al., 2015; Liu et al., 2017; Lichtner et al., 2018; Erfani et al., 2019; Agrawal et al., 2021; Poonoosamy et al., 2021; Prill et al., 2021). The fundamental question is thus if we cannot model geochemical processes in a deterministic way, is a probabilistic approach the alternative?
A probabilistic approach that assumes an ensemble of possible events with related probabilities of their occurrences is widely used in physics, physical chemistry, and geosciences. There are two well-known probabilistic algorithms, the Metropolis Monte Carlo (Frenkel and Smith, 2002; Binder and Heermann, 2010) and Kinetic Monte Carlo algorithms (Blum and Lasaga, 1987; Jansen, 2012; Andersen et al., 2019). The Metropolis Monte Carlo algorithm is a standard tool of statistical physics that allows direct statistical sampling over energetic states which have different occurrence probabilities. In this way important macroscopic parameters, such as systems' energy, can be calculated. The Kinetic Monte Carlo (KMC) algorithm relates reaction rates in a reactive ensemble with probabilities of their occurrences (Gillespie, 1977; Gilmer, 1980; Cheng, 1993; Voter, 2007; Hess and Over, 2017). Estimation of mineral resources employ geostatistics, which relies on random sampling approaches and implies a careful separation of a meaningful signal from stochastic noise. The microscopic complexity of any system is an inherent property that cannot be ignored, but instead can be used to quantify and predict the macroscopic behavior if a proper stochastic model of a process and related statistical sampling approach are established.
The first question of practical interest is whether there is a reproducible probability distribution of dissolution rates which can be directly implemented into macroscopic scale models, e.g., reactive transport at the pore scale. Probabilities in many cases can be approximated by counting and normalizing event frequencies. In this manuscript we deliver the statistical results of numerical KMC experiments on a simple Kossel cubic crystal with screw dislocations, where we counted frequencies of dissolution rate occurrences. We compared rate distributions and dissolution surface features, i.e., etch pits, which generate these distributions. We then arrive at the conclusion regarding statistical behavior of dissolving surfaces depending on spatial location of dislocations.
2. Methods
We used the standard Kinetic Monte Carlo simulation algorithm as it was developed originally for Kossel crystals by Gilmer and Bennema (1972), Gilmer (1976, 1980). A Kossel crystal has simple cubic lattice structure and atomic units are represented by cubic blocks (Kossel, 1927; Stranski, 1928). Kossel crystals are commonly used as a generic Terrace-Ledge-Kink representation of crystalline solid surfaces (Mutaftschiev, 2001) (Figure 1A). If a bulk crystal (coordination number, CN = 6) is cut in two halves along a, b, or c crystallographic axes, atomically flat terrace sites with five neighbors (number of neighbors N = 5) are formed. Atomic rows parallel to the other two axes form ledge sites (N = 4) which are adjacent to the terrace sites and form atomic steps. Removal of atoms from ledge sites generate kink sites (N = 3) which are self-reproducing units if removed sequentially from the same atomic row. In a numerical procedure, filled positions can take value 1 and unfilled value 0, so the entire crystal can be represented as a 3-D array of 0/1 values, or, alternatively, as a 2-D array of surface heights for solid-on-solid models (SOS) where overhangs are excluded. We used the SOS model in the present study.
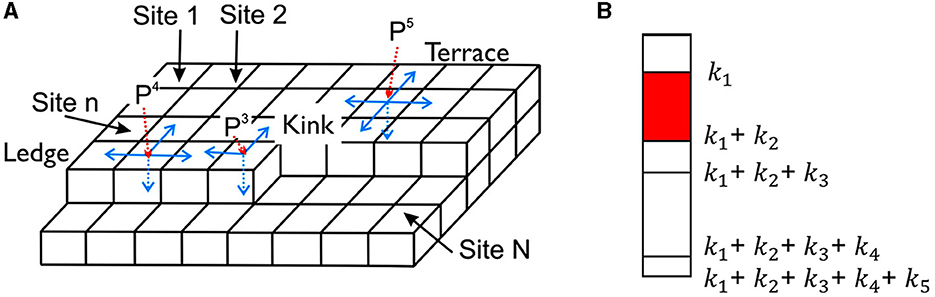
Figure 1. A basic framework for crystal dissolution simulations by the Kinetic Monte Carlo method. (A) Surface of Kossel crystals (bulk coordination number CN = 6) with surface sites: terrace (N = 5), ledge (N = 4), and kink (N = 3) sites. Each surface site has an associated dissolution probability depending on its dissolution rate ki. (B) Construction of the running sum for the divide-and-conquer (Meakin and Rosso, 2008) or BKL (Bortz et al., 1975) algorithm. The sum of rates for all sites is divided into intervals which lengths corresponds to dissolution rates. Sites with higher rates are selected more frequently than the sites with lower rates.
The KMC algorithm normalizes probabilities for dissolution rates for surface sites with different dissolution rates according to a simple relation (Bortz et al., 1975):
where M is the total number of possible reactive events, ki is the reaction rate for dissolution event of an atom with i neighbors (Figure 1A), Ni is the number of sites with i neighbors, φ is a bond breaking activation energy, β = kT is the Boltzmann parameter, where k is the Boltzmann constant, T is the temperature. We used β = 6 in this study, as a parameter providing straight steps which emerge in the majority of mineral-fluid systems. This parameter can be used to model dissolution of calcium carbonate (Kurganskaya and Luttge, 2016), one of the best studied minerals with regard to its dissolution kinetics (Morse et al., 2007).
The rejection-free algorithm, known as divide-and-conquer (Meakin and Rosso, 2008) or BKL (Bortz-Kalos-Lebowitz) algorithm (Bortz et al., 1975) is used in this study as it is indicated in the right hand side of the Equation (1). According to this algorithm, a type of reaction is chosen first, then a site where reaction is performed is chosen at random. The running sums (Voter, 2007; Meakin and Rosso, 2008) are constructed as sequential sums of dissolution rates ki, and a random number falling into an interval (ki; ki+ ki+1) is used to decide upon a reaction type i (Figure 1B).
The time step between reactive events is calculated as follows (Voter, 2007):
where r is a random number. Surface dissolution rates for rate distribution analysis (n data points per distribution) were calculated as an inverted time Tn required to dissolve axb surface sites, where a is the length and b is the width of the simulated system. In this study a = b = 200 atomic units:
Screw dislocations were placed into the crystal model as opened hollow cores according to the procedure discussed in previous publications (Meakin and Rosso, 2008; Fischer et al., 2014; Kurganskaya and Luttge, 2016). The location of screw dislocations were chosen at random and then simulations were run at the same dislocation configuration five times in independent runs. We run simulations on systems with two, three, five, ten, twenty, thirty, and forty dislocations. An independent test study for dislocations placed on a regular 5 × 5 grid was performed to assess the role of dislocation positioning. Surface height maps in this study are shown as colormaps where each color represents an atomic layer at a constant height.
Bin size was chosen in the same way in each simulation run, where the representative rate interval was chosen between (2ab)/k3 and (0.5ab)/k3 and the total number of bins is 50, so the bin size equals to (0.03ab)/k3. Rate frequencies falling into these bins were calculated for simulation trajectories equals to 2•107 atomic dissolution events. This binning approach provides ~500 data points for each rate distribution curve.
3. Results and discussion
3.1. Surface configurations
3.1.1. Interaction of two stepwave sources
Presence of screw dislocations at mineral surfaces normally result in opening of etch pits if a system of interest is not close to equilibrium (Lasaga and Blum, 1986; Lasaga, 1998; Lasaga and Luttge, 2001; Lüttge, 2006). Lasaga and Luttge developed a model of crystal dissolution based on etch-pit opening process and formation of concentric step trains, so-called stepwaves (Lasaga and Luttge, 2001; Lasaga and Lüttge, 2003). The stepwaves are constantly generated at the outcrops of screw dislocation hollow cores. Each stepwave travels across the surface and dissolves the crystal layer-by-layer. The stepwaves can collide into each other and form curved steps which propagate significantly faster than the straight rectangular stepswaves (Jordan et al., 2001; Vinson and Lüttge, 2005). Kinetic Monte Carlo simulations of Kossel crystals with multiple screw dislocations demonstrated that the peak-and-valley surface morphology stems from interaction between the etch pits and the stepwaves they emit (Meakin and Rosso, 2008). Curved steps are in general more reactive in comparison to the straight steps. The contribution of curved steps into the overall dissolution rate, as well as variance in their reactive properties were usually not discussed. In general, two diagonally opposite curved steps form when two straight steps emanating from different sources d1 and d2 collide at any point on a d1-d2 line if we assume square-shaped stepvawes (Figure 2). If the stepwaves are rectangular, which may accidentally happen, they may collide at any point within a square which diagonal is d1-d2 line.
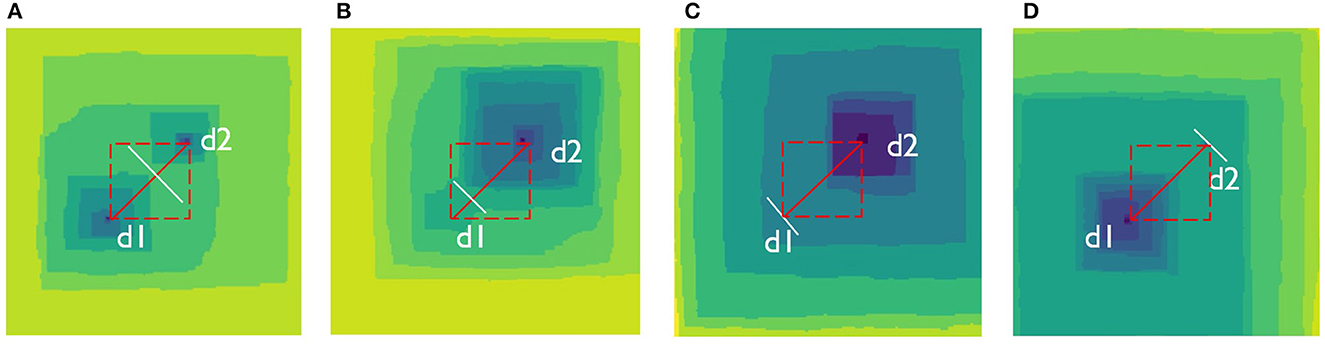
Figure 2. Possible etch pit configurations arising in the same simulated Kossel crystal with fixed positions of two screw dislocations, system size: 200 × 200 atomic units. Labels d1 and d2 indicate locations of the hollow cores. (A) Stepawaves from two dislocations coalesce at some point around a line connecting dislocation centers. Two etch pits define dynamics of the dissolution process; (B) Stepawaves from two dislocations coalesce close to the d1 hollow core. The etch pit around d2 starts to dominate process dynamics; (C) Etch pit around d1 completely disappears because its stepwaves become eradicated by the stepwaves coming from the d2 source. The pit around d2 is the only one pit present on the surface; (D) The same dynamics as in (C), but the only one present pit is formed around d1 instead of d1 following the same mechanism.
The location at which curved steps form is never precisely defined because each stepwave velocity varies stochastically locally. As a result, each new couple of circular steps may form at a new location. Depending upon this location, reactivity of these steps varies due to the different densities of kink sites they bear. This variance contributes to the overall dissolution rate variance. If two stepwaves meet closer to d1 dislocation, the upper etch pit dominates the surface (Figure 2A), while if they meet closer to d2 dislocation, the lower pit will dominate the surface (Figure 2B). In the cases when the stepwaves from one of the sources slow down, they can be overridden by the stepwaves from another source. As a result, one of the sources becomes inactive and only one of the etch pits is functioning (Figures 2C, D). If screw dislocations are long enough, these two situations can randomly reverse to I and II. Overall, the system fluctuates between all possible configurations I–IV thus giving temporal rate variance. The system shown on Figure 2 evolves in time from the configuration I to the configuration IV via configurations II and III.
3.1.2. Interaction of scattered stepwave sources
The interaction between multiple stepwave sources is analogs to the interaction of the two stepwave sources presented above. The only difference is that the possible number of etch pits and possible surface morphologies vary to a greater extent. Thus, for a system with ten sources (Figure 3) any number of etch pits between one and ten may form: five major pits (Figure 3A), three major pits (Figure 3E), two major pits (Figures 3B, F), and one major pit (Figures 3C, D). The system gradually evolves from configuration I to configuration VI, but other sequences may randomly occur.
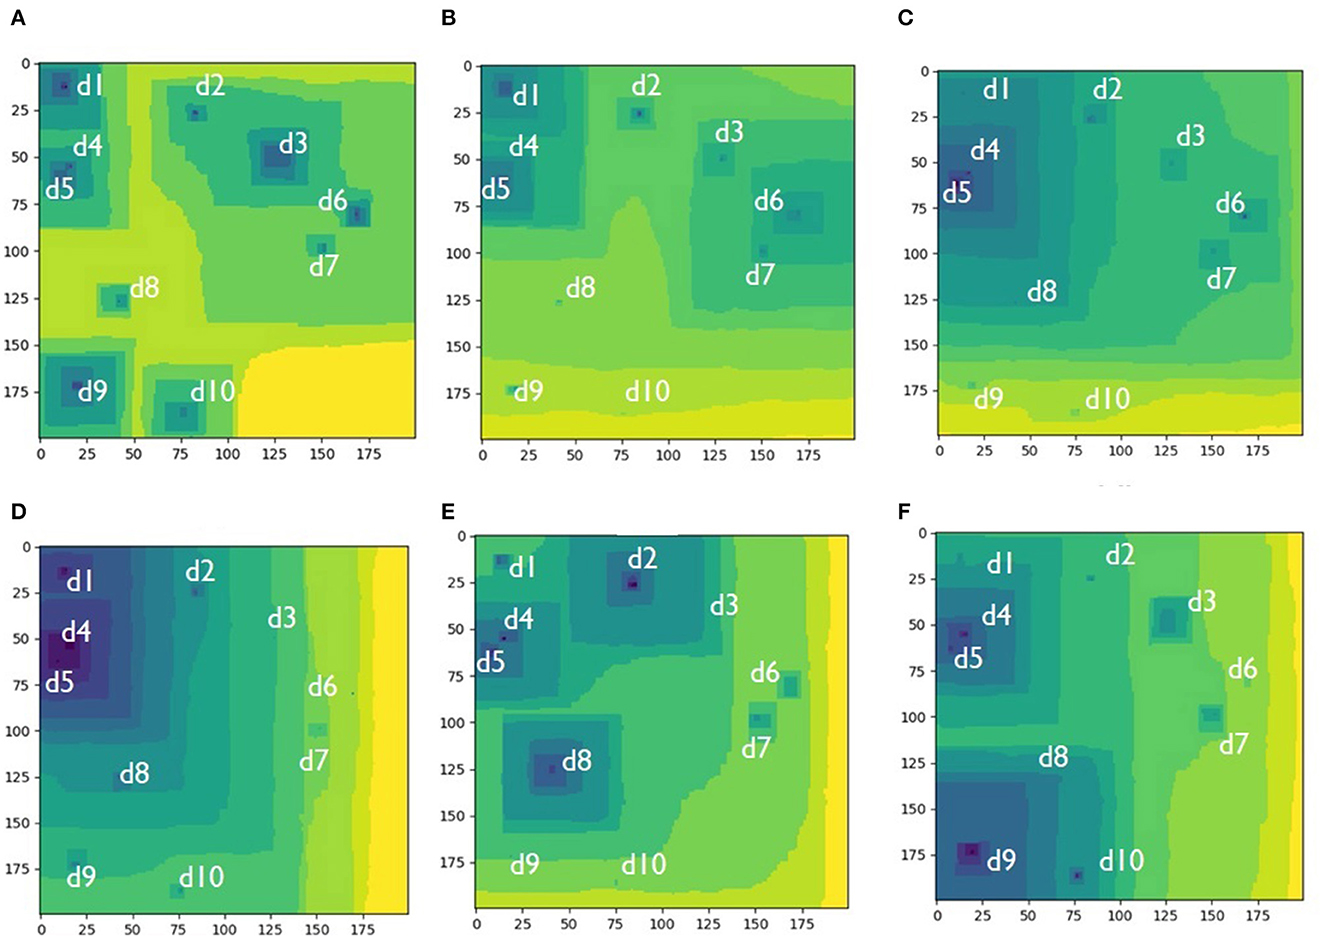
Figure 3. Different etch pit configurations arising in the same simulated Kossel crystal with fixed positions of ten randomly placed screw dislocations, system size: 200 × 200 atomic units. Labels di indicate locations of the hollow cores. (A) Five etch pits control the dissolution process; (B) Two major etch pits control the process; (C) One major etch pit with a few suppresed pits controls the process; (D) The cluster of d1-d4-d5 dislocations form one dominating pit; (E) Three etch pits merging into one larger pit control the dissolution process; (F) Two interacting etch pits control the process.
The mechanism for different configurations emergence is the same as for the system with two dislocations competition between the arrival times for stepwaves coming from different sources at the same location. In general, the number of pits is usually smaller than the number of dislocations. The number of etch pits forming depends on the geometrical arrangements of the dislocation sources. Thus, closely spaced dislocations have more chances to form a dominating pit because the arrival time for the stepwaves for their mutual collision is shorter than the arrival times for the more distance sources. The game seems to be defined in the very beginning (Figures 3A–D): three major reactivity zones—(1) d1-d4-d5, (2) d2-d3-d6-d7, and (3) d8-d9-d10—are initiated at the very beginning based on relative distances between the dislocations (Figure 3A). Then the third zone (d8-d9-d10) run out of the game because the stepwaves emanating from it get wiped out by the major stepwaves coming from the other two zones (Figure 3B). Finally, the first zone (d1-d4-d5) wins the game because it produces faster traveling major stepwaves which wipe out the second zone (d2-d3-d6-d7) (Figure 3C). One dominating pit occupies the surface (Figure 3D). This situation seems to be final, but it spontaneously reverses to formation of a new zone (d1-d2-d3-d4-d5) which competes with a zone formed by d8 solely (Figure 3E). In the next step these two zones completely disappear with the two new competing zones to be established: d1-d4-d5 and d8-d9-d10. As we can see from this example, coalescence of etch pits into a one major etch pit is in principle reversible into a multiple etch pit regime, but it is not possible to predict exactly which of the screw dislocations will become new major stepwave sources.
3.1.3. Interaction of clustered stepwave sources
The systems with ten or more screw dislocations showed a distinctly different behavior (Figure 4): the dissolution process started as normal from formation of multiple pits around screw dislocation hollow cores (Figure 4A). The major pit on the right started to take over the entire surface due to larger local density of dislocations (Figures 4A, B).
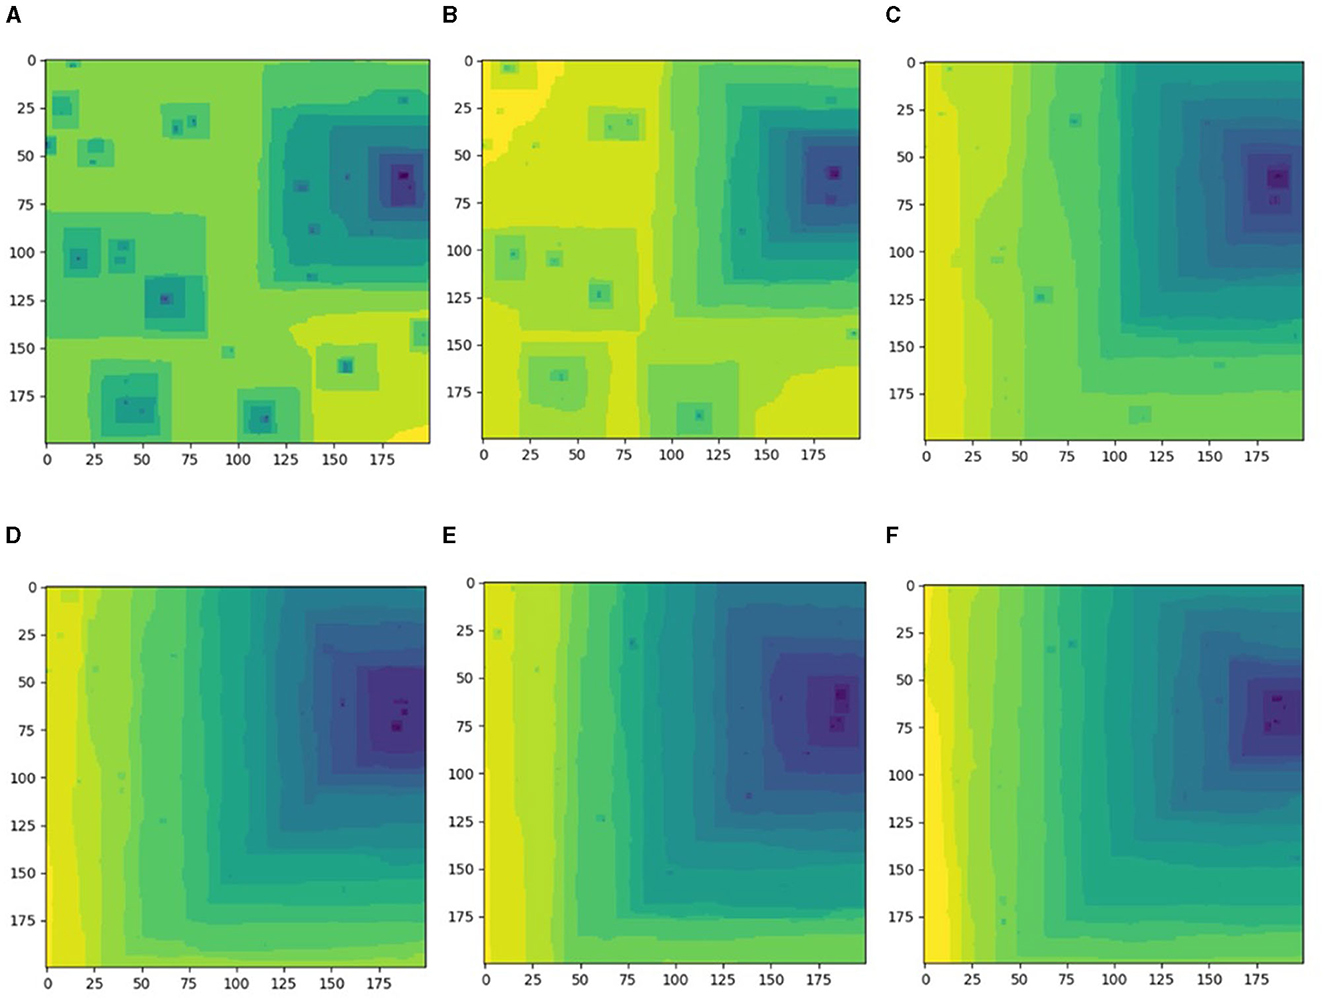
Figure 4. Different etch pit configurations arising in the same simulated Kossel crystal with fixed positions of thirty randomly placed screw dislocations, system size: 200 × 200 atomic units. The configurations are shown as time sequence corresponding to n*105 iteration steps; (A) n = 2; (B) n = 4; (C) n = 10; (D) n = 12; (E) n = 106; (F) n = 188.
The process of major right pit dominance continued, where other sources formed short-living tiny pits on terraces emanating from the major pit's source (Figure 4C). The system is stacked in this one major pit configuration (Figures 4D, F). The width and the density of the straight step trains varied over time thus contributing to the overall rate variance.
3.2. Rate distributions
Dissolution rate frequencies showed quite stable reproducible distributions between the runs for systems with the number of dislocations ranging from two to five (Figures 5A, B). Systems with ten dislocations typically exhibited stable distributions (Figure 5C), but some systems can occasionally exhibit a deviant distribution in a new run (Figure 5D). The systems with twenty dislocations (Figures 5E, F) showed multiple sets of stable distributions depending on a dislocation configuration: the configuration set 1 produced three distinct distributions in five simulation runs (Figure 5E), while the configuration set 2 produced two distinct distributions in five runs (Figure 5F). The same behavior is observed for the systems with thirty dislocations (Figure 5G), while the system with forty dislocations exhibited stable distributions again (Figure 5H).
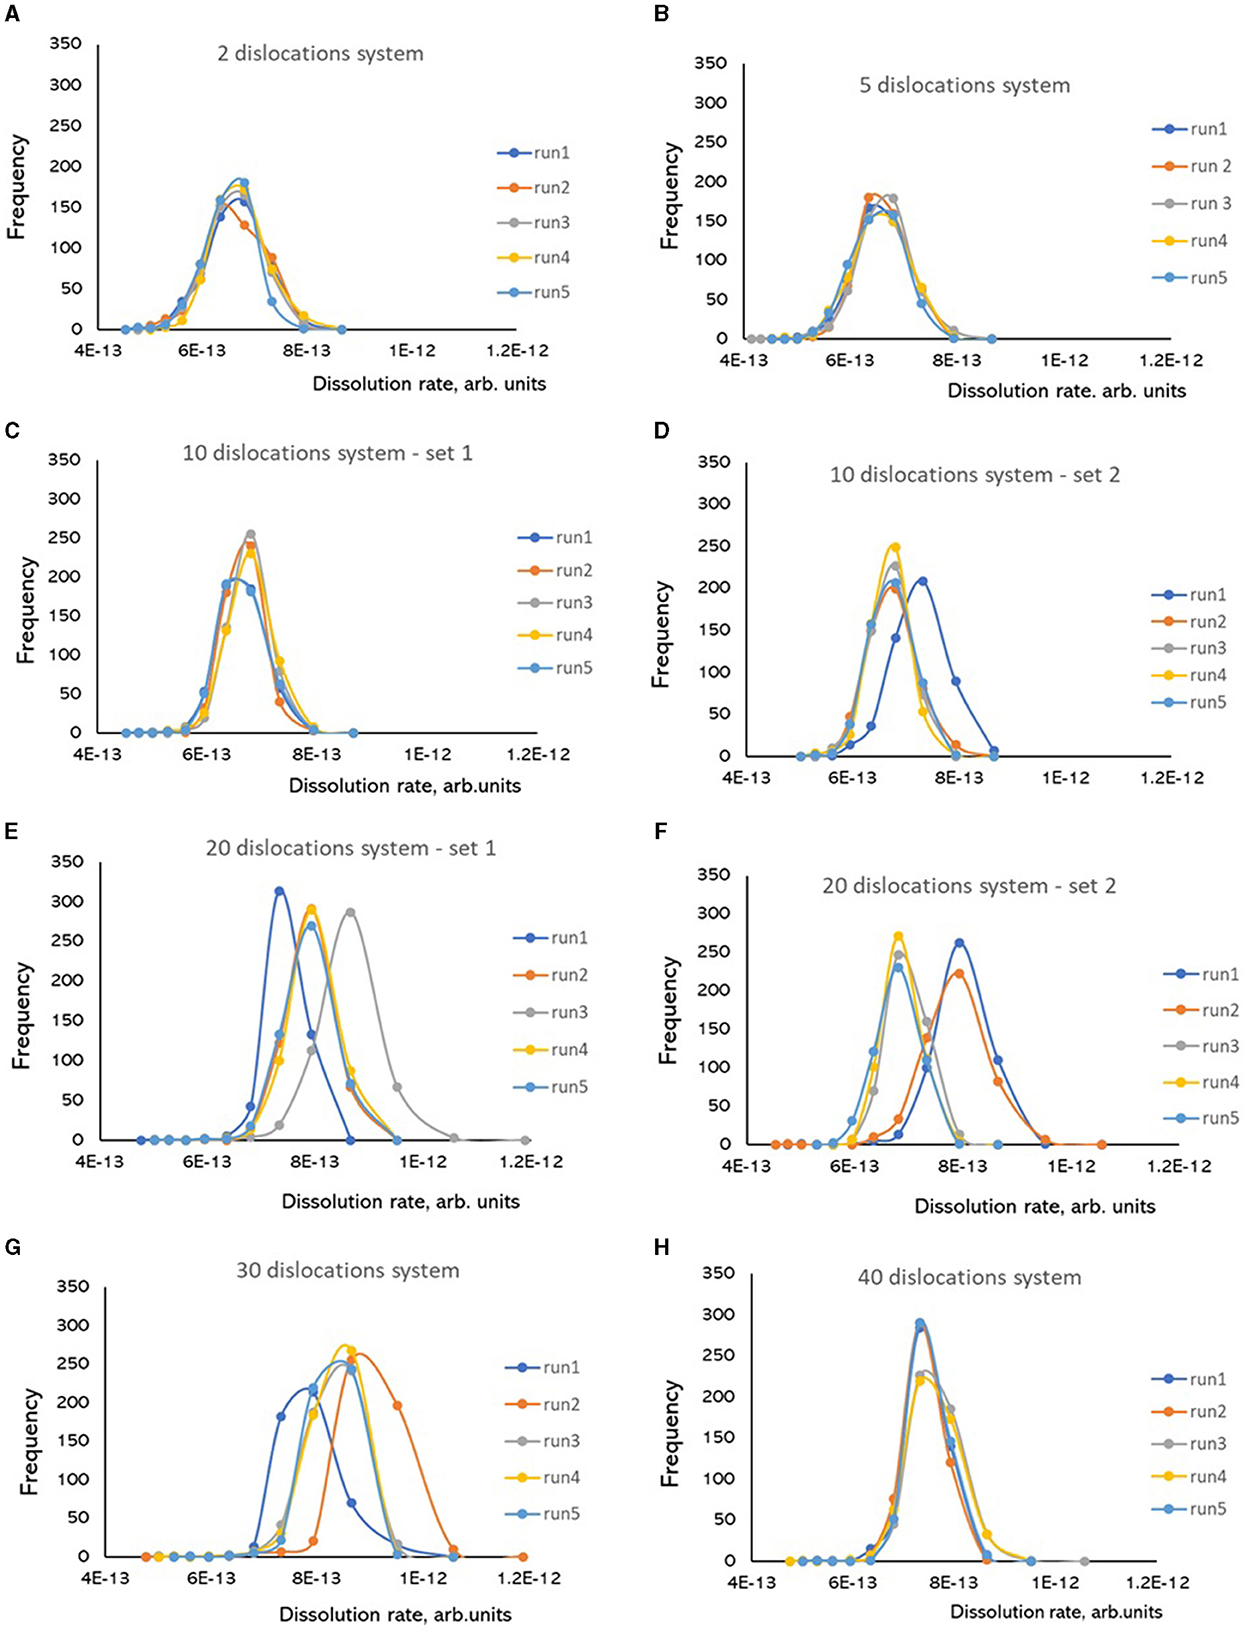
Figure 5. Frequencies of dissolution rates calculated as inverted time steps required to dissolve one atomic layer (1/Δt) in Kinetic Monte Carlo simulations of Kossel crystal dissolution. Each simulation was run five times for the same configuration of screw dislocations. System size in each simulation is 200 × 200 atomic units. (A) 2 dislocations; (B) 5 dislocations; (C) 10 dislocations, configuration set 1; (D) 10 dislocations, configuration set 2; (E) 20 dislocations, configuration set 1; (F) 20 dislocations, configuration set 1; (G) 30 dislocations; (H) 40 dislocations.
The comparison of rate variance amongst systems with different dislocation configurations (Figure 6) showed that dislocation density has a very non-trivial influence on rate distributions. Roughly, there are two types of dislocation configurations which result in different behavior of rate distributions: (1) “low” density where multiple etch pits operate simultaneously on the surface. Rate distributions are stable, reproducible, and there is no or very weak dependence of rate values from the number/density of dislocations. This result is counterintuitive because it may seem that higher dislocation density should result in higher dissolution rates due to greater extent of pitting. We observed this regime for the systems with two, three, five, and ten (set 1) dislocations; (2) “high” density (from 20 to 40 dislocations) where etch pit clustering effect results in formation of a one dominating kinetic feature and the rest of dislocations do not develop into independent pits. In this case rate distributions may significantly vary from run to run, thus introducing an overall variance about half of order of magnitude. As we can see from this result, the enhanced dissolution at larger density of dislocations does not stem from larger number of pits, as it may seem intuitively. Instead, a surface dominating pit from a dislocation cluster defines rate distributions which show a fluctuating behavior. The overall fluctuations in rate distributions and difference in average or modal rate values largely depend on relative distances between the dislocations as etch pit sources, instead of dislocation density as a number of defects per unit area.
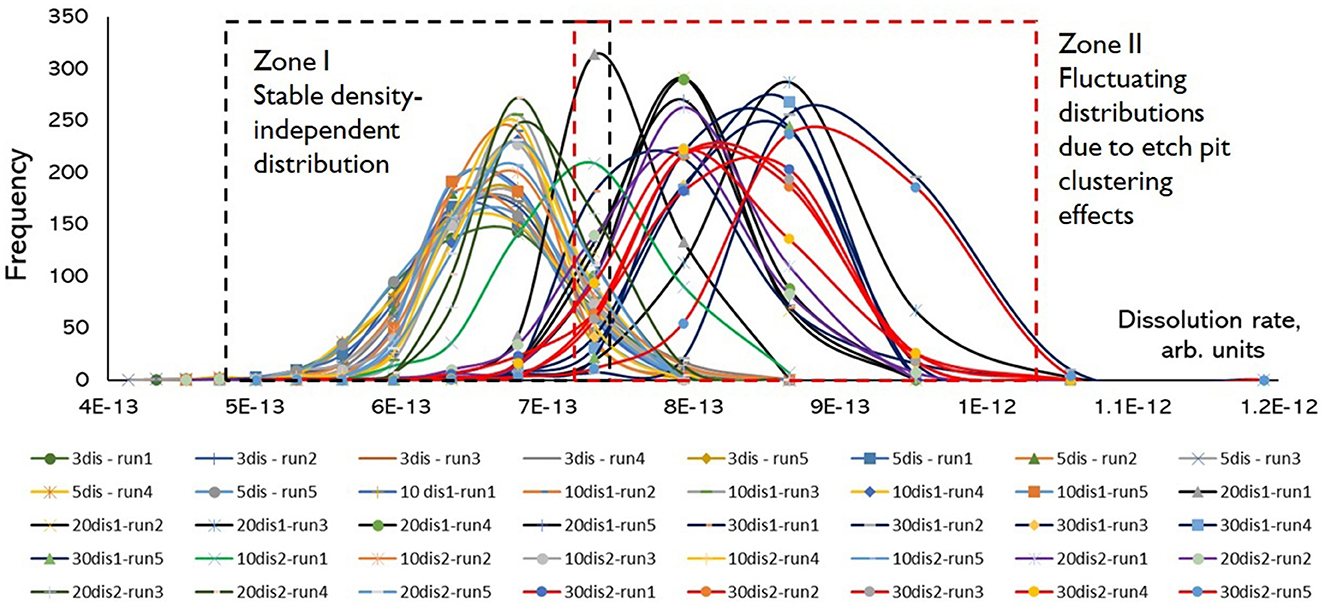
Figure 6. Compilation of synthetic rate probability distributions for systems with different numbers of screw dislocations, KMC simulations of Kossel crystals, the system size is 200 × 200 atomic units.
3.3. The influence of surface feature organization on rate distribution
As we can see from the data on Figures 5, 6, the efficiency of material removal by a couple of pits is almost identical to the efficiency of tens of pits operating simultaneously. Similar efficiency, however, is valid only for “steady-state” systems where all stepwaves from different sources came into contact with each other. The reason of similar efficiency is simple: the cumulative amount of kink sites is quantitatively similar for a large number of “small” curved steps and a few “large” curved steps formed as a result of straight step interaction (see Figures 2, 3) operating simultaneously on the surface. This number of sources, however, largely controls local rate variance. The global rate variance is controlled by the amount of material flux coming from the entire surface. Therefore, smaller number of dislocations is overcompensated by the larger reactive features. This situation changes when one large structure, such as etch pit, controls the entire surface. In each new run the etch pit sets itself at one of possible probability distributions. A possible explanation is the existence of long-range correlations between propagation of the atomic step trains. The observed convergence of rate distributions at substantially large dislocation density as it is shown on Figure 5H indicates that this density is capable of breaking these long-range correlations. As a result, the system returns to a unimodal distribution regime.
To make sure that this result is not a random artifact, we ran an independent test on a system with 25 dislocations placed on a regular grid and compared it with a system with 20 randomly placed dislocations (Figure 7). The system with regularly spaced dislocations generated reproducible rate distributions as systems with smaller number of dislocations shown above. A large variety of possible etch pit configurations were formed (Figure 7A1), but the probability distributions were stable between the runs (Figure 7A2). On contrast, the system with 20 randomly placed dislocations formed a process-dominating pit (Figure 7B1) with three distinct probability distributions appeared in five independent runs (Figure 7B2). This result indicates ultimate importance of screw dislocation positioning: clustered dislocations have great chances to become a dominant etch pit formation center, while the other dislocations will be not active as step sources.
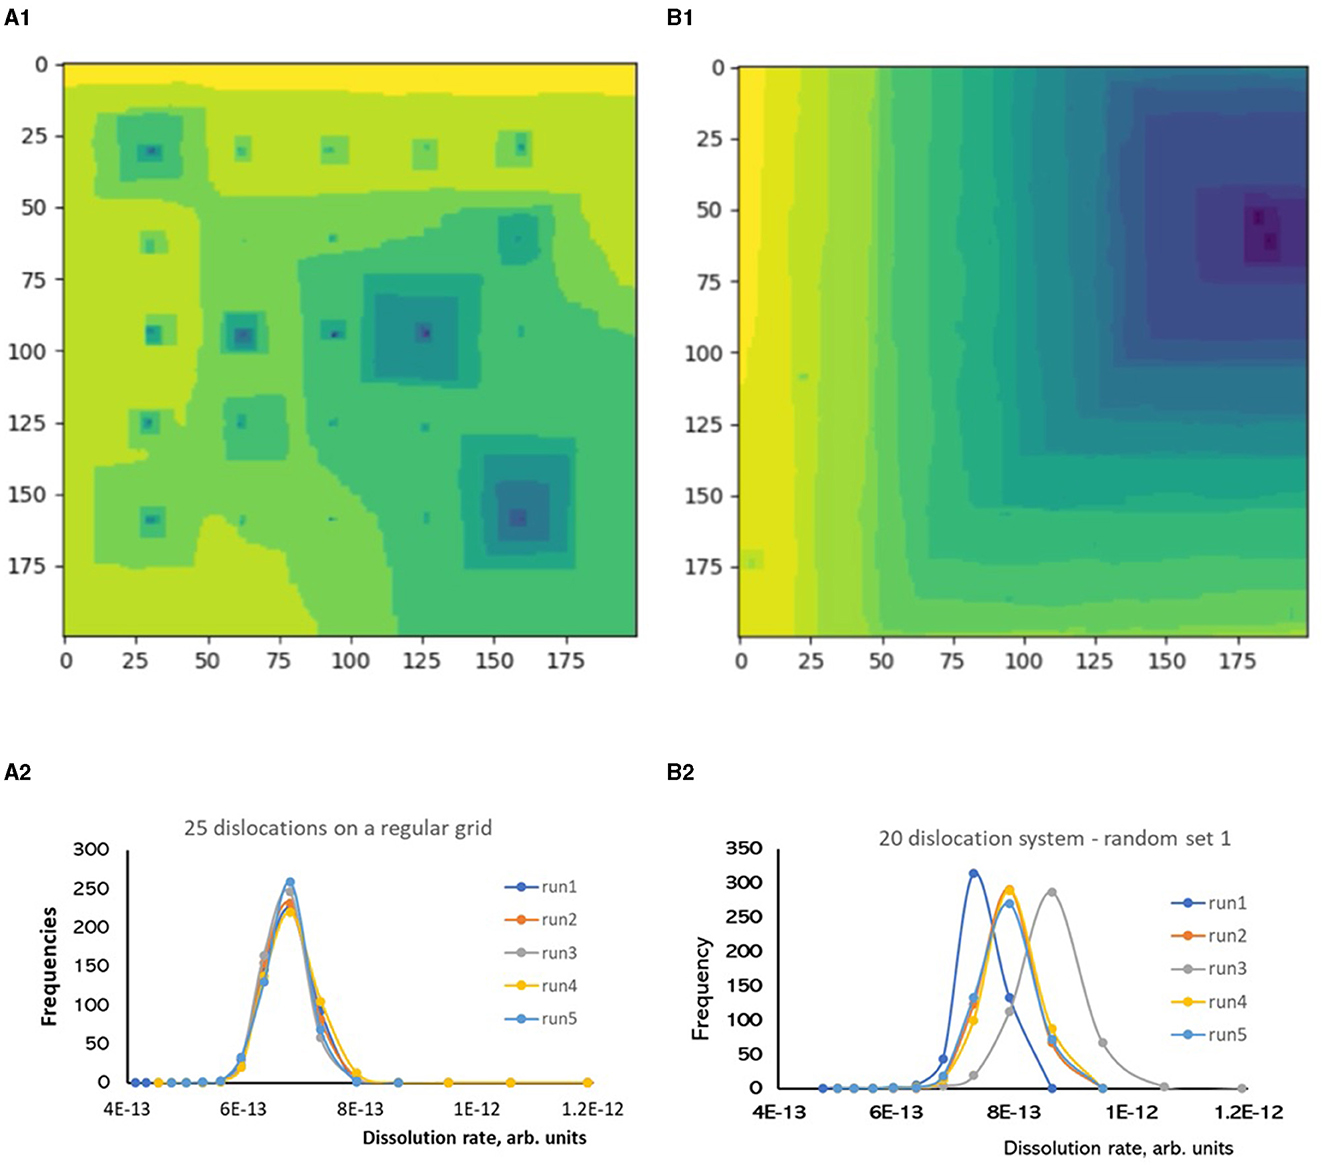
Figure 7. The influence of surface organization on rate distributions, KMC simulations of Kossel crystals with screw dislocations, the system size is 200 × 200 atomic units. Regular grid of 25 dislocations, (A1) surface map, (A2) rate distributions for five independent runs. Randomly spaced 20 dislocations, (B1) surface map, (B2) rate distributions for five independent runs.
3.4. Comparison to experimental data
Direct comparison between data sets shown in the present study and experimentally measured rate distributions is difficult because our system is simple and idealistic. In general, crystal lattice, molecular structure of mineral-water interface, chemical composition of reacting fluid, and other details, may influence onto the results. Most experimental studies for rate distributions were done for calcite (calcium carbonate) crystals, which have anisotropy in step velocities affecting etch pit morphology and statistics for atomic step interactions. The rate spectra collected for single crystals in many cases have mixed sources of variance: dislocations and grain edges. Grain edges dissolve crystal according to a different mechanism: they generate rough steps with enhanced reactivity. Reactivity of these steps is similar to reactivity of circular rough steps discussed in Section 3.1. The source is different, and their statistical behavior also can be different. The contribution to the overall rate distributions from this source is significant because these features are large and very reactive. Another issue is the absence of reproducibility control for systems with identical locations of dislocations. Despite these issues, some aspects relevant to this study can be discussed.
The first aspect is stability of measured rate distributions over time for single crystals where dissolution is controlled by etch pits (Brand et al., 2017; Bibi et al., 2018; Noiriel et al., 2018; Guren et al., 2023). On contrast, calcite with micritic or poly-grain structures showed distributions changing in time (Bollermann and Fischer, 2020; Guren et al., 2023). Limited time of experiments and scale/resolution limitations do not allow us to ensure the eternal stability of rate distributions for those systems. Important information can be obtained by comparison of modal values for rate distributions obtained in different laboratories using different samples and analytical techniques at different scales for single crystals with etch pits. Thus, the values 0.1–0.2 × 10⁻⁶ mol m−2s−1 were obtained by Brand et al. (2017) and Bibi et al. (2018) for pH 7, and values 5–8 × 10⁻⁶ mol m−2s−1 by Noiriel et al. (2018), Noiriel et al. (2020), and Guren et al. (2023) for pH 4. The values for pH 4 are expected to be higher because carbonate dissolve faster in acidic water. The samples they used also contained macrofeatures, e.g., macrosteps and crevices, obtained from mechanical cleaving of single crystals. Their probability distributions for pitted surfaces appear to be quite reproducible as well, taking into account possible differences in microfeature reactivity.
The second aspect is occurrence of surface morphologies with process-controlling pits formed around dislocation clusters and with competing etch pits of similar sizes (as two contrasting cases on the Figure 7). Both cases are common on dissolving surfaces especially for calcite which bonding topology is the same as for Kossel crystal. Formation of large pits around pit's clusters is commonly observed, e.g., in studies by Callagon et al. (2014), Noiriel et al. (2020), and Guren et al. (2023), as well as etch pit morphologies controlled by many pits, e.g., in Arvidson et al. (2003), Fischer et al. (2012), and Brand et al. (2017). If these two contrasting cases indeed result in different, but reproducible rate distributions in one case, and a finite set of reproducible distributions in the other, the issue of defect density and location becomes indeed solvable in the statistical sense.
4. Conclusions
The reproducibility of dissolution rates is the fundamental problem of practical importance for applications involving reactive transport modeling. Intrinsic rate variance issues in macroscopic models can be addressed by using probabilistic approaches in cases when statistical behavior of rates is well-known. Reproducibility and robustness of rate probability distributions in this scope becomes a fundamentally important question, where the influence of dislocation density need to be clarified. As we established in this study, at least for simple Kossel crystals, the numbers or density of dislocations has little relevance to probability distributions. Instead, their spatial locations, or geometric arrangements, have critical influence on overall reactive system dynamics and rate reproducibility. In this study we addressed rate variance generated by different surface morphologies stemming from various etch pit geometric superpositions. We discovered that in cases when multiple etch pits controls surface reactivity, a stable probability distribution can be expected. In cases when dislocations form clusters, formation of one giant macro-pit is expected. In these cases several possible stable distributions can be observed due to the possible existence of long-range correlations in movement of atomic step trains. This result has a remarkable implication for understanding rate variance issues and for quantitative predictions of dissolution rates for modeling of geochemical processes. In particular, long-term behavior of etch pit clusters of various geometric arrangements should be better understood, as well as possible rate distributions they generate for time trajectories of different length. The good news is that despite inherent randomness, the surface dynamics follows some clear trends predictable to some extent in the statistical sense. The issues of local rate variability vs. global temporal variance of material flux should be investigated in more detail. The role of mineral crystallographic structure and bonding in determining etch pit interactions and corresponding rate distributions should be carefully evaluated, as well as the influence of “extrinsic” parameters saturation state, pH, transport, leached layers on silicates, etc., on the kinematics of atomic steps and etch pits. Grain boundaries, crystal size, and crystal habit, including nanoparticulate forms, constitute another important source of rate variance relevant to practical applications. The dominant sources of rate variance should be determined before practical implementations of rate distributions.
Data availability statement
The raw data supporting the conclusions of this article will be made available by the authors, without undue reservation.
Author contributions
IK: conceptualization, programming, data collection and analysis, and manuscript writing. AL: conceptualization, manuscript editing, and proofreading. All authors contributed to the article and approved the submitted version.
Funding
We would like to acknowledge the Bundesministerium für Bildung und Forschung (BMBF) under Grant No. 03G0900B within the joint project ResKin_Move.
Acknowledgments
We thank Ricarda D. Rohlfs for her enthusiastic scientific discussions, as well as Cornelius Fischer and Rolf S. Arvidson for their discussions and inspiring previous publications on the rate variance issue.
Conflict of interest
The authors declare that the research was conducted in the absence of any commercial or financial relationships that could be construed as a potential conflict of interest.
Publisher's note
All claims expressed in this article are solely those of the authors and do not necessarily represent those of their affiliated organizations, or those of the publisher, the editors and the reviewers. Any product that may be evaluated in this article, or claim that may be made by its manufacturer, is not guaranteed or endorsed by the publisher.
References
Agrawal, P., Bollermann, T., Raoof, A., Iliev, O., Fischer, C., and Wolthers, M. (2021). The contribution of hydrodynamic processes to calcite dissolution rates and rate spectra. Geochim. Cosmochim. Acta 307, 338–350. doi: 10.1016/j.gca.2021.05.003
Andersen, M., Panosetti, C., and Reuter, K. (2019). A Practical Guide to Surface Kinetic Monte Carlo Simulations. Front. Chem. 7, 202. doi: 10.3389/fchem.2019.00202
Androniuk, I., and Kalinichev, A. G. (2020). Molecular dynamics simulation of the interaction of uranium (VI) with the C–S–H phase of cement in the presence of gluconate. Appl. Geochem. 113, 104496. doi: 10.1016/j.apgeochem.2019.104496
Aredes, S., Klein, B., and Pawlik, M. (2012). The removal of arsenic from water using natural iron oxide minerals. J. Clean. Prod. 29, 208–213. doi: 10.1016/j.jclepro.2012.01.029
Arif, M., Lebedev, M., Barifcani, A., and Iglauer, S. (2017). CO2 storage in carbonates: Wettability of calcite. Int. J. Greenhouse Gas Control 62, 113–121. doi: 10.1016/j.ijggc.2017.04.014
Arvidson, R. S., Ertan, I. E., Amonette, J. E., and Luttge, A. (2003). Variation in calcite dissolution rates:: A fundamental problem? Geochim. Cosmochim. Acta 67, 1623–1634. doi: 10.1016/S0016-7037(02)01177-8
Balashov, V. N., Guthrie, G. D., Hakala, J. A., Lopano, C. L., Rimstidt, J. D., and Brantley, S. L. (2013). Predictive modeling of CO2 sequestration in deep saline sandstone reservoirs: Impacts of geochemical kinetics. Appl. Geochem. 30, 41–56. doi: 10.1016/j.apgeochem.2012.08.016
Balashov, V. N., Guthrie, G. D., Lopano, C. L., Hakala, J. A., and Brantley, S. L. (2015). Reaction and diffusion at the reservoir/shale interface during CO2 storage: Impact of geochemical kinetics. Appl. Geochem. 61, 119–131. doi: 10.1016/j.apgeochem.2015.05.013
Bandstra, J. Z., and Brantley, S. L. (2008). Surface evolution of dissolving minerals investigated with a kinetic Ising model. Geochim. Cosmochim. Acta 72, 2587–2600. doi: 10.1016/j.gca.2008.02.023
Barry, E., Burns, R., Chen, W., De Hoe, G. X., De Oca, J. M. M., de Pablo, J. J., et al. (2021). Advanced materials for energy-water systems: the central role of water/solid interfaces in adsorption, reactivity, and transport. Chem. Rev. 121, 9450–9501. doi: 10.1021/acs.chemrev.1c00069
Bhattacharyya, K. G., and Gupta, S. S. (2007). Adsorptive accumulation of Cd(II), Co(II), Cu(II), Pb(II), and Ni(II) from water on montmorillonite: influence of acid activation. J. Colloid Inter. Sci. 310, 411–424. doi: 10.1016/j.jcis.2007.01.080
Bibi, I., Arvidson, R. S., Fischer, C., and Lüttge, A. (2018). Temporal evolution of calcite surface dissolution kinetics. Minerals 8, 256. doi: 10.3390/min8060256
Binder, K., and Heermann, D. W. (2010). Monte Carlo Simulation in Statistical Physics: An Introduction. Berlin, Heidelberg: Springer doi: 10.1007/978-3-642-03163-2
Björneholm, O., Hansen, M. H., Hodgson, A., Liu, L.-M., Limmer, D. T., Michaelides, A., et al. (2016). Water at interfaces. Chem. Rev. 116, 7698–7726. doi: 10.1021/acs.chemrev.6b00045
Blum, A. E., and Lasaga, A. C. (1987). “Monte Carlo simulations of surface reaction rate laws,” in Aquatic Surface Chemistry; Chemical Processes at the Particle-Water Interface, ed. W. Stumm (New York: Wiley), 255–292.
Bollermann, T., and Fischer, C. (2020). Temporal evolution of dissolution kinetics of polycrystalline calcite. Am. J. Sci. 320, 53–71. doi: 10.2475/01.2020.04
Bortz, A. B., Kalos, M. H., and Lebowitz, J. L. (1975). A new algorithm for Monte Carlo simulation of Ising spin systems. J. Comput. Phys. 17, 10–18. doi: 10.1016/0021-9991(75)90060-1
Bouissonnié, A., Daval, D., and Ackerer, P. (2021). Dissolution anisotropy of pyroxenes: role of edges and corners inferred from stochastic simulations of enstatite dissolution. J. Phys. Chem. C 125, 7658–7674. doi: 10.1021/acs.jpcc.0c11416
Brand, A. S., Feng, P., and Bullard, J. W. (2017). Calcite dissolution rate spectra measured by in situ digital holographic microscopy. Geochim. Cosmochim. Acta 213, 317–329. doi: 10.1016/j.gca.2017.07.001
Brantley, S., Kubicki, J., and White, A. (2008). Kinetics of Water-Rock Interaction. New York: Springer-Verlag. doi: 10.1007/978-0-387-73563-4
Brantley, S. L., Crane, S. R., Crerar, D. A., Hellmann, R., and Stallard, R. (1986). Dissolution at dislocation etch pits in quartz. Geochim. Cosmochim. Acta 50, 2349–2361. doi: 10.1016/0016-7037(86)90087-6
Browning, L., and Murphy, W. M. (2003). Reactive transport modeling in the geosciences. Comput. Geosci. 29, 245. doi: 10.1016/S0098-3004(03)00002-5
Callagon, E., Fenter, P., Nagy, K. L., and Sturchio, N. C. (2014). Incorporation of Pb at the calcite (104)–water interface. Environ. Sci. Technol. 48, 9263–9269. doi: 10.1021/es5014888
Cheng, V. K. W. (1993). A Monte Carlo study of moving steps during crystal growth and dissolution. J. Crystal. Growth 134, 369–376. doi: 10.1016/0022-0248(93)90147-O
Claret, F., Dauzeres, A., Jacques, D., Sellin, P., Cochepin, B., Windt, L. D., et al. (2022). Modelling of the long-term evolution and performance of engineered barrier system. EPJ Nuclear Sci. Technol. 8, 41. doi: 10.1051/epjn/2022038
Cygan, R. T., Greathouse, J. A., and Kalinichev, A. G. (2021). Advances in Clayff Molecular Simulation of Layered and Nanoporous Materials and Their Aqueous Interfaces. J. Phys. Chem. C 125, 17573–17589. doi: 10.1021/acs.jpcc.1c04600
Daval, D. (2018). Carbon dioxide sequestration through silicate degradation and carbon mineralisation: promises and uncertainties. NPJ Mater. Degrad. 2, 1–4. doi: 10.1038/s41529-018-0035-4
Daval, D., Hellmann, R., Saldi, G. D., Wirth, R., and Knauss, K. G. (2013). Linking nm-scale measurements of the anisotropy of silicate surface reactivity to macroscopic dissolution rate laws: New insights based on diopside. Geochim. Cosmochim. Acta 107, 121–134. doi: 10.1016/j.gca.2012.12.045
Deng, H., Poonoosamy, J., and Molins, S. (2022). A reactive transport modeling perspective on the dynamics of interface-coupled dissolution-precipitation. Appl. Geochem. 137, 105207. doi: 10.1016/j.apgeochem.2022.105207
Erfani, H., Joekar-Niasar, V., and Farajzadeh, R. (2019). Impact of microheterogeneity on upscaling reactive transport in geothermal energy. ACS Earth Space Chem. 3, 2045–2057. doi: 10.1021/acsearthspacechem.9b00056
Fischer, C., Arvidson, R. S., and Lüttge, A. (2012). How predictable are dissolution rates of crystalline material? Geochim. Cosmochim. Acta 98, 177–185. doi: 10.1016/j.gca.2012.09.011
Fischer, C., Kurganskaya, I., Schäfer, T., and Lüttge, A. (2014). Variability of crystal surface reactivity: What do we know? Appl. Geochem. 43, 132–157. doi: 10.1016/j.apgeochem.2014.02.002
Frenkel, D., and Smith, B. (2002). Understanding Molecular Simulation. New York: Elsevier doi: 10.1016/B978-012267351-1/50005-5
Gillespie, D. T. (1977). Exact stochastic simulation of coupled chemical reactions. J. Phys. Chem. 81, 2340–2361. doi: 10.1021/j100540a008
Gilmer, G. H. (1976). Growth on imperfect crystal faces: I. Monte-Carlo growth rates. J. Crystal Growth 36, 15–28. doi: 10.1016/0022-0248(76)90209-8
Gilmer, G. H. (1980). Computer models of crystal growth. Science 208, 355–363. doi: 10.1126/science.208.4442.355
Gilmer, G. H., and Bennema, P. (1972). Computer simulation of crystal surface structure and growth kinetics. J. Crystal Growth 13, 148–153. doi: 10.1016/0022-0248(72)90145-5
Godinho, J. R. A., Piazolo, S., and Evans, L. (2014). Simulation of surface dynamics during dissolution as a function of the surface orientation: Implications for non-constant dissolution rates. Earth Planet Sci. Lett. 408, 163–170. doi: 10.1016/j.epsl.2014.10.018
Godinho, J. R. A., Piazolo, S., and Evins, L. Z. (2012). Effect of surface orientation on dissolution rates and topography of CaF2. Geochim. Cosmochim. Acta 86, 392–403. doi: 10.1016/j.gca.2012.02.032
Guren, M. G., Renard, F., and Noiriel, C. (2023). Dissolution rate variability at carbonate surfaces: 4D X-ray micro-tomography and stochastic modeling investigations. Front. Water 5, 1185608. doi: 10.3389/frwa.2023.1185608
Hawthorne, F. C. (2018). Spectroscopic Methods in Mineralogy and Geology. Washington, DC: Walter de Gruyter GmbH & Co KG.
Hellmann, R., Daval, D., and Wirth, R. (2013). Formation of amorphous silica surface layers by dissolution-reprecipitaton during chemical weathering: implications for CO2 uptake. Proc. Earth Planet. Sci. 7, 346–349. doi: 10.1016/j.proeps.2013.03.154
Hess, F., and Over, H. (2017). Rate-determining step or rate-determining configuration? The Deacon reaction over RuO2 (110) studied by DFT-based KMC simulations. ACS Cataly. 7, 128–138. doi: 10.1021/acscatal.6b02575
Jansen, A. P. J. (2012). An Introduction to Kinetic Monte Carlo Simulations of Surface Reactions. Berlin Heidelberg: Springer-Verlag. doi: 10.1007/978-3-642-29488-4_3
Jordan, G., Higgins, S. R., Eggleston, C. M., Knauss, K. G., and Schmahl, W. W. (2001). Dissolution kinetics of magnesite in acidic aqueous solution, a hydrothermal atomic force microscopy (HAFM) study: step orientation and kink dynamics. Geochim. Cosmochim. Acta 65, 4257–4266. doi: 10.1016/S0016-7037(01)00729-3
Jun, Y.-S., Giammar, D. E., and Werth, C. J. (2013). Impacts of Geochemical Reactions on Geologic Carbon Sequestration. Environ. Sci. Technol. 47, 3–8. doi: 10.1021/es3027133
Jun, Y.-S., Zhang, L., Min, Y., and Li, Q. (2017). Nanoscale chemical processes affecting storage capacities and seals during geologic CO2 sequestration. Acc. Chem. Res. 50, 1521–1529. doi: 10.1021/acs.accounts.6b00654
Kalinichev, A. G., Loganathan, N., Wakou, B. F. N., and Chen, Z. (2017). Interaction of ions with hydrated clay surfaces: computational molecular modeling for nuclear waste disposal applications. Proc. Earth Planet. Sci. 17, 566–569. doi: 10.1016/j.proeps.2016.12.144
Kubicki, J. D. (2016). Molecular Modeling of Geochemical Reactions: An Introduction. New York: Wiley. Available online at: https://www.wiley.com/en-us/Molecular+Modeling+of+Geochemical+Reactions%3A+An+Introduction-p-9781118845080 (accessed January 14, 2019).
Kurganskaya, I., and Luttge, A. (2016). Kinetic Monte Carlo approach to study carbonate dissolution. J. Phys. Chem. C 120, 6482–6492. doi: 10.1021/acs.jpcc.5b10995
Lamy-Chappuis, B., Yapparova, A., and Driesner, T. (2022). Advanced well model for superhot and saline geothermal reservoirs. Geothermics 105, 102529. doi: 10.1016/j.geothermics.2022.102529
Lasaga, A. C. (1998). Kinetic Theory in the Earth Sciences. Princeton, NJ: Princeton University Press. Available online at: https://www.jstor.org/stable/j.ctt7zvgxm (accessed May 22, 2019).
Lasaga, A. C., and Blum, A. E. (1986). Surface chemistry, etch pits and mineral-water reactions. Geochim. Cosmochim. Acta 50, 2363–2379. doi: 10.1016/0016-7037(86)90088-8
Lasaga, A. C., and Luttge, A. (2001). Variation of crystal dissolution rate based on a dissolution stepwave model. Science 291, 2400–2404. doi: 10.1126/science.1058173
Lasaga, A. C., and Lüttge, A. (2003). A model for crystal dissolution. Eur. J. Mineral. 15, 603–615. doi: 10.1127/0935-1221/2003/0015-0603
Leal, A. M. M., Kulik, D. A., Smith, W. R., and Saar, M. O. (2017). An overview of computational methods for chemical equilibrium and kinetic calculations for geochemical and reactive transport modeling. Pure Appl. Chem. 89, 597–643. doi: 10.1515/pac-2016-1107
Levenson, Y., and Emmanuel, S. (2013). Pore-scale heterogeneous reaction rates on a dissolving limestone surface. Geochim. Cosmochim. Acta 119, 188–197. doi: 10.1016/j.gca.2013.05.024
Li, L., Peters, C. A., and Celia, M. A. (2006). Upscaling geochemical reaction rates using pore-scale network modeling. Adv. Water Resour. 29, 1351–1370. doi: 10.1016/j.advwatres.2005.10.011
Lichtner, P. C., Steefel, C. I., and Oelkers, E. H. (2018). Reactive Transport in Porous Media. Washington, DC: Walter de Gruyter GmbH & Co KG.
Liu, M., Shabaninejad, M., and Mostaghimi, P. (2017). Impact of mineralogical heterogeneity on reactive transport modelling. Comput. Geosci. 104, 12–19. doi: 10.1016/j.cageo.2017.03.020
Liu, X., Tournassat, C., Grangeon, S., Kalinichev, A. G., Takahashi, Y., and Marques Fernandes, M. (2022). Molecular-level understanding of metal ion retention in clay-rich materials. Nat. Rev. Earth Environ. 3, 461–476. doi: 10.1038/s43017-022-00301-z
Loganathan, N., Yazaydin, A. O., Bowers, G. M., Ngouana-Wakou, B. F., Kalinichev, A. G., and Kirkpatrick, R. J. (2020). Role of cations in the methane/carbon dioxide partitioning in nano- and mesopores of illite using constant reservoir composition molecular dynamics simulation. J. Phys. Chem. C 124, 2490–2500. doi: 10.1021/acs.jpcc.9b10051
Lugo-Méndez, H. D., Valdés-Parada, F. J., Porter, M. L., Wood, B. D., and Ochoa-Tapia, J. A. (2015). Upscaling diffusion and nonlinear reactive mass transport in homogeneous porous media. Transp. Porous. Med. 107, 683–716. doi: 10.1007/s11242-015-0462-4
Lüttge, A. (2006). Crystal dissolution kinetics and Gibbs free energy. J. Electr. Spectr. Relat. Phen. 150, 248–259. doi: 10.1016/j.elspec.2005.06.007
Lüttge, A., Arvidson, R. S., and Fischer, C. (2013). A stochastic treatment of crystal dissolution kinetics. Elements 9, 183–188. doi: 10.2113/gselements.9.3.183
Luttge, A., Arvidson, R. S., Fischer, C., and Kurganskaya, I. (2019). Kinetic concepts for quantitative prediction of fluid-solid interactions. Chem. Geol. 504, 216–235. doi: 10.1016/j.chemgeo.2018.11.016
Meakin, P., and Rosso, K. M. (2008). Simple kinetic Monte Carlo models for dissolution pitting induced by crystal defects. J. Chem. Phys. 129, 204106. doi: 10.1063/1.3021478
Morse, J. W., Arvidson, R. S., and Lüttge, A. (2007). Calcium carbonate formation and dissolution. Chem. Rev. 107, 342–381. doi: 10.1021/cr050358j
Müller, A. (2014). Viktor Moritz Goldschmidt (1888–1947) and Vladimir Ivanovich Vernadsky (1863–1945): The father and grandfather of geochemistry? J. Geochem. Explor. 147, 37–45. doi: 10.1016/j.gexplo.2014.02.006
Mutaftschiev, B. (2001). The Atomistic Nature of Crystal Growth. Berlin, Heidelberg: Springer-Verlag. doi: 10.1007/978-3-662-04591-6
Niazi, N. K., Bibi, I., and Aftab, T. (2023). Global Arsenic Hazard: Ecotoxicology and Remediation. Cham: Springer International Publishing. doi: 10.1007/978-3-031-16360-9
Noiriel, C., Oursin, M., and Daval, D. (2020). Examination of crystal dissolution in 3D: A way to reconcile dissolution rates in the laboratory? Geochim. Cosmochim. Acta 273, 1–25. doi: 10.1016/j.gca.2020.01.003
Noiriel, C., Oursin, M., Saldi, G., and Haberthür, D. (2018). Direct determination of dissolution rates at crystal surfaces using 3D X-ray microtomography. ACS Earth Space Chem. 3, 100–108. doi: 10.1021/acsearthspacechem.8b00143
Payne, T. E., Brendler, V., Ochs, M., Baeyens, B., Brown, P. L., Davis, J. A., et al. (2013). Guidelines for thermodynamic sorption modelling in the context of radioactive waste disposal. Environ. Model. Softw. 42, 143–156. doi: 10.1016/j.envsoft.2013.01.002
Pollet-Villard, M., Daval, D., Fritz, B., Knauss, K. G., Schäfer, G., and Ackerer, P. (2016). Influence of etch pit development on the surface area and dissolution kinetics of the orthoclase (001) surface. Chem. Geol. 447, 79–92. doi: 10.1016/j.chemgeo.2016.09.038
Poonoosamy, J., Wanner, C., Alt Epping, P., Águila, J. F., Samper, J., Montenegro, L., et al. (2021). Benchmarking of reactive transport codes for 2D simulations with mineral dissolution–precipitation reactions and feedback on transport parameters. Comput. Geosci. 25, 1337–1358. doi: 10.1007/s10596-018-9793-x
Prill, T., Fischer, C., Gavrilenko, P., and Iliev, O. (2021). Implementing the variability of crystal surface reactivity in reactive transport modeling. Transp. Porous. Med. 140, 535–557. doi: 10.1007/s11242-021-01697-w
Shabani, B., Lu, P., Kammer, R., and Zhu, C. (2022). Effects of hydrogeological heterogeneity on CO2 migration and mineral trapping: 3D reactive transport modeling of geological CO2 storage in the Mt. Simon Sandstone, Indiana, USA. Energies 15, 2171. doi: 10.3390/en15062171
Smit, B. (2016). Carbon Capture and Storage: introductory lecture. Faraday Discuss. 192, 9–25. doi: 10.1039/C6FD00148C
Steefel, C. I., Appelo, C. A. J., Arora, B., Jacques, D., Kalbacher, T., Kolditz, O., et al. (2015). Reactive transport codes for subsurface environmental simulation. Comput. Geosci. 19, 445–478. doi: 10.1007/s10596-014-9443-x
Stranski, I. N. (1928). Zur Theorie des Kristallwachstums. Zeitschrift Physikalische Chem. 136, 259–278. doi: 10.1515/zpch-1928-13620
Urych, T., Chećko, J., Magdziarczyk, M., and Smoliński, A. (2022). Numerical simulations of carbon dioxide storage in selected geological structures in North-Western Poland. Front. Energy Res. 10, 827794. doi: 10.3389/fenrg.2022.827794
Vinograd, V. L., Kulik, D. A., Brandt, F., Klinkenberg, M., Weber, J., Winkler, B., et al. (2018). Thermodynamics of the solid solution - Aqueous solution system (Ba,Sr,Ra)SO4 + H2O: I. The effect of strontium content on radium uptake by barite. Appl. Geochem. 89, 59–74. doi: 10.1016/j.apgeochem.2017.11.009
Vinson, M. D., and Lüttge, A. (2005). Multiple length-scale kinetics: an integrated study of calcite dissolution rates and strontium inhibition. Am. J. Sci. 305, 119–146. doi: 10.2475/ajs.305.2.119
Voter, A. F. (2007). “Introduction to the kinetic Monte Carlo Method,” in Radiation Effects in Solids, eds. K. E. Sickafus, E. A. Kotomin, and B. P. Uberuaga (Dordrecht: Springer Netherlands) 1–23. doi: 10.1007/978-1-4020-5295-8_1
Whitaker, F., and Frazer, M. (2018). “Process-based modelling of syn-depositional diagenesis,” in Reactive Transport Modeling: Applications in Subsurface Energy and Environmental Problems, eds. Y. Xiao, F. Whitaker, T. Xu, and C. I. Steefel (Oxford, United Kingdom: John Wiley and Sons, Ltd.) 107–155. doi: 10.1002/9781119060031.ch3
Wieland, E., Kosakowski, G., Lothenbach, B., and Kulik, D. A. (2020). Geochemical modelling of the effect of waste degradation processes on the long-term performance of waste forms. Appl. Geochem. 115, 104539. doi: 10.1016/j.apgeochem.2020.104539
Wild, B., Daval, D., Micha, J.-S., Bourg, I. C., White, C. E., and Fernandez-Martinez, A. (2019). Physical properties of interfacial layers developed on weathered silicates: a case study based on labradorite feldspar. J. Phys. Chem. C 123, 24520–24532. doi: 10.1021/acs.jpcc.9b05491
Wilson, A. M., Sanford, W., Whitaker, F., and Smart, P. (2001). Spatial patterns of diagenesis during geothermal circulation in carbonate platforms. Am. J. Sci. 301, 727–752. doi: 10.2475/ajs.301.8.727
Wolthers, M., Tommaso, D. D., Du, Z., and de Leeuw, N. H. (2013). Variations in calcite growth kinetics with surface topography: molecular dynamics simulations and process-based growth kinetics modelling. Cryst. Eng. Comm. 15, 5506–5514. doi: 10.1039/c3ce40249e
Xiao, Y., Whitaker, F., Xu, T., and Steefel, C. I. (2018). Reactive Transport Modeling: Applications in Subsurface Energy and Environmental Problems. John Wiley and Sons Ltd. doi: 10.1002/9781119060031
Yapparova, A., Lamy-Chappuis, B., Scott, S. W., Gunnarsson, G., and Driesner, T. (2023). Cold water injection near the magmatic heat source can enhance production from high-enthalpy geothermal fields. Geothermics 112, 102744. doi: 10.1016/j.geothermics.2023.102744
Yapparova, A., Matthäi, S., and Driesner, T. (2014). Realistic simulation of an aquifer thermal energy storage: Effects of injection temperature, well placement and groundwater flow. Energy 76, 1011–1018. doi: 10.1016/j.energy.2014.09.018
Yapparova, A., Miron, G. D., Kulik, D. A., Kosakowski, G., and Driesner, T. (2019). An advanced reactive transport simulation scheme for hydrothermal systems modelling. Geothermics 78, 138–153. doi: 10.1016/j.geothermics.2018.12.003
Keywords: Kinetic Monte Carlo (KMC), probabilistic approach, rate variability, etch pits, stochastic, upscaling, simulations
Citation: Kurganskaya I and Luttge A (2023) Probability distributions of mineral dissolution rates: the role of lattice defects. Front. Water 5:1225837. doi: 10.3389/frwa.2023.1225837
Received: 19 May 2023; Accepted: 07 September 2023;
Published: 28 September 2023.
Edited by:
Jenna Poonoosamy, Forschungszentrum Juelich, GermanyReviewed by:
James David Kubicki, The University of Texas at El Paso, United StatesArnaud Bouissonnié, University of California, Los Angeles, United States
Copyright © 2023 Kurganskaya and Luttge. This is an open-access article distributed under the terms of the Creative Commons Attribution License (CC BY). The use, distribution or reproduction in other forums is permitted, provided the original author(s) and the copyright owner(s) are credited and that the original publication in this journal is cited, in accordance with accepted academic practice. No use, distribution or reproduction is permitted which does not comply with these terms.
*Correspondence: Inna Kurganskaya, aW5uYS5rdXJnYW5za2F5YUB1bmktYnJlbWVuLmRl