 Justice Lin
 Chhayly Sreng
 Emma Oare
 Feras A. Batarseh
- 1Bradley Department of Electrical and Computer Engineering, Virginia Tech, Arlington, VA, United States
- 2Department of Biological Systems Engineering, Virginia Tech, Blacksburg, VA, United States
Flood events have the potential to impact every aspect of life, economic loss and casualties can quickly be coupled with damages to agricultural land, infrastructure, and water quality. Creating flood susceptibility maps is an effective manner that equips communities with valuable information to help them prepare for and cope with the impacts of potential floods. Flood indexing and forecasting are nonetheless complex because multiple external parameters influence flooding. Accordingly, this study explores the potential of utilizing artificial intelligence (AI) techniques, including clustering and neural networks, to develop a flooding susceptibility index (namely, NeuralFlood) that considers multiple factors that are not generally considered otherwise. By comparing four different sub-indices, we aim to create a comprehensive index that captures unique characteristics not found in existing methods. The use of clustering algorithms, model tuning, and multiple neural layers produced insightful outcomes for county-level data. Overall, the four sub-indices' models yielded accurate results for lower classes (accuracy of 0.87), but higher classes had reduced true positive rates (overall average accuracy of 0.68 for all classes). Our findings aid decision-makers in effectively allocating resources and identifying high-risk areas for mitigation.
1. Introduction and motivation
The dangers of flooding are widespread and can leave communities vulnerable within a few hours of occurrence (Smith, 2023). In the United States alone, $177.9 billion has been lost to inland flooding events that exceed $1 billion in cost from 1980 to 2022 (Smith, 2023). These statistics disregard the costs of less severe floods that can still cause harm to human health and infrastructure (Environmental Protection Agency, 2022). Every aspect of a community's lifestyle is at risk during flooding events. On agricultural land, flooding can cause the loss of crops, equipment, and valuable soil quality (Warner et al., 2017). In urban settings, household items, electrical utilities, and public transportation services can be damaged or destroyed (Micu, 2022). The sediment, bacteria, and pesticides captured inside cities can be transported to neighboring water-bodies and ecosystems, potentially carrying pollution to water with both anthropogenic and natural uses. On a societal level, besides causing fatalities, flooding can introduce high-stress levels among individuals that continue after the disaster (Stanke et al., 2012). Relationships and welfare suffer even after the water recedes.
In recent years, flood events have experienced changes in frequency and severity. In the United States, river and stream flooding have grown in magnitude in the Northeast and Midwest regions (Mallakpour and Villarini, 2015). Similarly, the Northeast, Pacific Northwest, and Northern Great Plains have experienced more frequent large floods. Other regions, such as the West, southern Appalachia, and northern Michigan, have had less flooding frequencies, thus further bolstering the coincidence of floods fluctuations with changes in heavy rainfall events. Overall, flooding disasters have increased by 134% since 2000 compared to the two previous decades (World Meteorological Organization, 2021). The dangers of climate change are evident–flood risks are predicted to increase with each degree of global warming (IPCC, 2021). If these trends continue, communities will require novel strategies for preparing for flooding disasters.
Flood susceptibility maps can be invaluable tools for understanding an individual's possibility of experiencing a flood event based on their geographic location. Most flood maps (i.e., indices) that are readily available to the public will show “risk” zones and indicate that risk from “low” to “high,” such as the National Risk Index (NRI) from the Federal Emergency Management Agency (FEMA, 2023). Some maps consider the effects of climate change on disaster events, like the First Street Foundation Flood Model (Bates et al., 2021). However, the issue stands that these maps can take monumental effort, time, and funding. As the public searches for accurate (and data-driven) flood risk maps, confusion can grow about which source presents the most accurate results. Each published mapping system utilizes different qualities and quantities of data, as well as different modeling strategies. Maps can utilize only hydrological data, including Digital Elevation Models (DEMs), river hydrology networks, and land cover, or they can also include community data, like population density and wealth factors. The final challenge lies in accurately analyzing the numerous data.
1.1. The need for AI
The power of artificial intelligence (AI) has proven invaluable as the technology has advanced (Batarseh and Freeman, 2022). As emphasized by Batarseh and Kulkarni, integrating explainable AI into the water sector is crucial. In contrast to other models, AI models can (1) use increasing amounts of data (i.e., big data) and (2) identify patterns and correlations between data where humans cannot. Many researchers have agreed and even experienced the difficulties of using AI for the geo-sciences. Mainly, data collection and validity limitations create obstacles (Batarseh and Freeman, 2022). Nevertheless, as data improve and grow, the discovery of geo-science data relationships using AI technologies could have significant results. AI has already begun to establish a foothold in designing flood susceptibility maps (Tien Bui et al., 2016; Rahman et al., 2019; Priscillia et al., 2021). This study applies an Artificial Neural Network (ANN) to three hydrologically independent states in the United States: Kansas, Nevada, and Virginia; to produce a flood susceptibility index map. By considering locations with three different geographies, land uses, hydrology networks, and population densities, the model is tested for its ability to transfer classification accurately. In previous literature, AI was mainly applied to case studies, generally a watershed or sub-watershed. In doing so, the data collected must be more detailed and, thus, generally more time-consuming to collect and clean. In contrast, the data collected for this study are on a county-level scale to expedite the data collection rate and examine how coarser data will affect the output susceptibility map results. Although precise susceptibility maps ideally require data and information obtained at spatial resolutions finer than that of counties, our model operates based on data availability (public sources). Given the accessibility of county-level data, the model is designed to leverage this information for its data-driven approach. Given the input boundaries, the outputs were determined within counties. The output flood susceptibility map was then presented as an index using the historical flood events. During validation, the results were analyzed against the NRI riverine flooding risk indices due to FEMA's quality of methodology and ability to reach the public.
1.2. Flooding indices
In the past decades, the introduction of remote sensing (RS), GIS, and data-driven tools technology have created an irreplaceable set of tools in analyzing flood susceptibility and modeling (Hapuarachchi et al., 2011). Using open-source data, researchers have used RS and GIS to study natural disasters. According to Duan et al. (2022) studies of flood susceptibility assessments experienced an upward trend beginning in 2007. Many of the same variables used in this study were included in these models, such as land use, precipitation, and slope. Nevertheless, difficulties arose in the validity of the data and the appropriate statistical model to use for accurate results (Collier, 2007). As RS capabilities have improved with machine learning (ML) assistance and aerospace technology advancement, various statistical methods for producing flood susceptibility maps have emerged (Wu et al., 2019). After discussing the literature that utilizes statistical probability strategies, models that use AI are presented.
A wide range of statistical models have been developed to produce flood susceptibility maps. Rahmati et al. (2016) proposed a flood hazard zoning technique that used multi-criteria decision analysis. A case study of a river basin was again used, but only four parameters were included–distance to channels, land use, elevation, and slope. Hydrologists reclassified and weighted the four factors, producing a normalized rate based on the sum of rates. This normalized rate resulted in a flood hazard map. Additionally, the Hydrologic Engineering Center River Analysis System (HEC-RAS) was used with the DEM to produce 50- and 100-year floods. Thus, validation was performed by visually overlaying the flood hazard map with the flood inundation maps from HEC-RAS. The results from validation indicated a similarity between the flood hazard map and the inundation maps, indicating that the four factors included in the model hold significance. However, both the constraints of a case study and the absence of numerical validation are to be considered.
In contrast to case studying, Sampson et al. (2015) produced a global flood hazard model. Using globally available data at 90-kilometer spatial resolution, a near-automated model using regression-based GIS functions was used to merge the results from the hydraulic engine to create a flood hazard map. The results were validated using performance metrics of Hit Rate, False Alarm Ratio, and Critical Success Index. Given the flood extents from benchmark Canada and United Kingdom (UK) datasets, the model captured 66–75% of the area at risk. Also, as data resolution increased, the success rates increased significantly. Given the success rates of the study, factors such as land cover, hydrology networks, and community factors (i.e., population density) were established as critical variables in considering flood susceptibility. Nonetheless, the processing time for a 100 x 100 grid was estimated to reach 2,000 hours if using a conventional CPU processor (not a GPU). Other concerns include the coarseness of data used and the validation techniques that only considered climates within Canada and the UK.
Cao et al. (2016) introduced a flood susceptibility mapping approach using frequency ratio (FR) and statistical index (SI) methods in 2016 that similarly used geographic data in a case study. However, additional factors such as stream power index (SPI), topographic wetness index (TWI), and heavy rain events were included in the parameters. FR and SI used 70% of the flooding locations in the study area for training, while the other 30% was used for validation. Based on the validation techniques, the FR model was more appropriate for the study area, presumably because the FR method better reflected the geographic anomalies of the area. Since the classification of each parameter was used, as in the previously mentioned literature, the researchers considered the benefits of each classification method, concluding that the natural break method reduced variance within classes and between classes. In 2018, the Chicago Metropolitan Agency for Planning (CMAP) developed a regional flooding susceptibility index to evaluate urban and river flooding in Illinois. After carefully evaluating various methodologies, CMAP chose the frequency ratio approach as the most suitable statistical model (Chicago Metropolitan Agency for Planning, 2018). This approach allows for examining relationships between the distribution of flooding sites and relevant factors contributing to flooding. Once the index was formulated, CMAP conducted tests using a random sample of reported flood locations. The results demonstrated a strong correlation between the highest index levels and the actual occurrence of flooding in those locations, indicating the potential effectiveness of the developed index.
In 2020, a publicly available flood susceptibility map was released by Bates et al. The First Street Foundation Flood Model (FSF-FM) resulted from a combined model of fluvial, pluvial, and coastal flood risks, considering the present and future climate changes. The FSF-FM's arrival was coupled with multiple flood modeling innovations. First, researchers used the flood frequency analysis method rather than rainfall-driven hydrological models. In doing so, it was possible to use regionalization methods to predict the characteristics of un-gauged locations. Second, the modifications of flooding events caused by anthropogenic infrastructure were modeled through “gray” and “green” infrastructure. The “gray” infrastructure simulated levees, dams, ditches, etc., while the “green” infrastructure simulated constructed wetlands, living shorelines, etc. The categorization of flood adaptation infrastructure allowed for more accurate infiltration and flow rates. Finally, the FSF-FM used cumulative statistics that combined the fluvial and pluvial hazard layers with weights unique to each basin based on historical analysis. Given the amount of incoming data and computational layers in the study, not every hazard layer could be specifically calculated. Thus, a non-linear logarithmic relationship was applied to the given data. Although the FSF-FM yielded Critical Success Index values of 0.69–0.82 when compared to other high-quality models, the project again required a large team of experts, without considering multiple geographical areas (such as the difference between coasts, cities, and rural towns).
1.3. Using AI for flood indices—A brief review
The potential benefits of applying AI to the water sector have grown immensely (Batarseh and Kulkarni, 2023). In 2016, an AI algorithm based on a neural fuzzy inference system and metaheuristic optimization was designed for flood susceptibility modeling (Tien Bui et al., 2016). In the case study, Tien Bui et al. examined the Tuong Duong district of Vietnam, an area with a consistent tropical cyclone season. Ten variables were chosen as data inputs which were all compiled in a GIS database, including slope, elevation, rainfall, and other hydrologic factors. The model consisted of a five-layered feed-forward neural fuzzy network. Evolutionary Genetic optimization and Particle Swarm optimization were then used to search for the best values of antecedent and consequent parameters in the network. The Pearson correlation with a 10-fold cross-validation process was also used to analyze the predictive power of the ten variables, resulting in elevation producing the highest predictive power and curvature producing the lowest predictive power. By combining the neural fuzzy network and the two optimization algorithms, a relatively accurate flood susceptibility map was constructed with high statistical success. Nonetheless, the drawbacks of the case study are evident and the validation techniques did not include a comparison against other flood maps, and the method only considers one data source.
A different technique using ML and multi-criteria decision analysis was proposed by Rahman et al. (2019). The flood-independent variables–DEM, soil tract map, and land use map–were collected for the country of Bangladesh. Unlike the previously mentioned model, flood-dependent variables were included by calculating flood inundation maps using RS data. The study compared the application of an ANN, analytical hierarchy process (AHP), logistic regression (LR), and frequency ratio (FR). Since weak points have been observed in individual models, an integrated model was also designed based on the validation results of the prior methods. Overall, the LR model produced the highest prediction rate, followed by the FR model. Eleven integrated model maps were created and generally presented better predictions. As in Tien Bui et al.'s research, the value of integrated models is emphasized. Further testing using the highest-performing model in different locations could identify any need for optimization.
Though the power of integrated models was demonstrated by Rahman et al., the efficacy of an individual ANN model in flood susceptibility assessments was later exhibited by Priscillia et al. The study compares three models: ANN, k-Nearest Neighbors (k-NN), and Support Vector Machines (SVM). As in previous works, hydrologic inputs such as elevation, slope, land cover, soil type, and precipitation are used. After training the models, the validation process involved using environmental factors alongside satellite imagery to back-predict historical flood events. The Synthetic Minority Oversampling Technique (SMOTE) balanced both flooded and non-flooded conditions due to the infrequency of flooded events (Chawla et al., 2002). Validation was evaluated through classifiers using Precision, Recall, and the F1-score to account for the shortage of flood instances.
Based on the validation techniques, the ANN model performed the highest. Despite the ANN model performing the best, the imbalanced dataset produced poor results. Since the researchers were basing success on the ability of the susceptibility assessment to predict which villages would be affected by a flood event in the next month, factors such as position in the monsoon cycle may have affected the results. Overall, the study emphasized the importance of rebalancing the dataset but failed to consider multiple geographical locations or include multiple external factors, as we present in the models built into the NeuralFlood index.
1.4. Research questions
Our contribution via this study incorporates numerous novel factors (twelve) and variables (thirty) into AI models. We leverage clustering and deep learning to create flooding susceptibility indices that provide insight for helping policy and decision-making, emergency response, and identifying high-risk geographical areas and watersheds.
In this study, the following research questions are formulated:
• RQ#1: How do multiple factors of flooding events contribute to a neural networks-based flooding susceptibility index?
• RQ#2: Will neural network model(s) have accurate flood indexing results when applied between three hydrological unique study areas (i.e., geographical contexts)?
Those two questions are answered via the NeuralFlood workflow; the experimental design and data used for evaluation are introduced next.
2. Experimental setup
This section presents the empirical process that we used to evaluate NeuralFlood.
2.1. Data sources and descriptions
The data collected for the AI model resulted in 11 variables used as inputs (independent variables). All data are publicly available (i.e., open access) in the United States. Data used in this study were collected from the National Oceanic and Atmospheric Administration (NOAA), the United States Geological Survey (USGS), and the United States Department of Agriculture (USDA). Although most of the inputs were geographic data, some factors, including population density, were societal data. For data that are not time-bound, such as elevation, slope degree, and so on, the most recent available source was used. The earliest data are from 2019. For time-bound data, collections ranged from 2010 to 2022. Each impact factor includes monthly data, average (μ), standard deviation (std), range, 90th percentile (Pct90), total (sum), anomalies (anomaly), and county ranking (rank), density and area. Table 1 illustrates the factors inputted into the model, the description, the source, and the data format. Regarding the data format, spatial and non-spatial data distinguish between data derived from a raster or GIS file vs. a flat, 2-dimensional source.
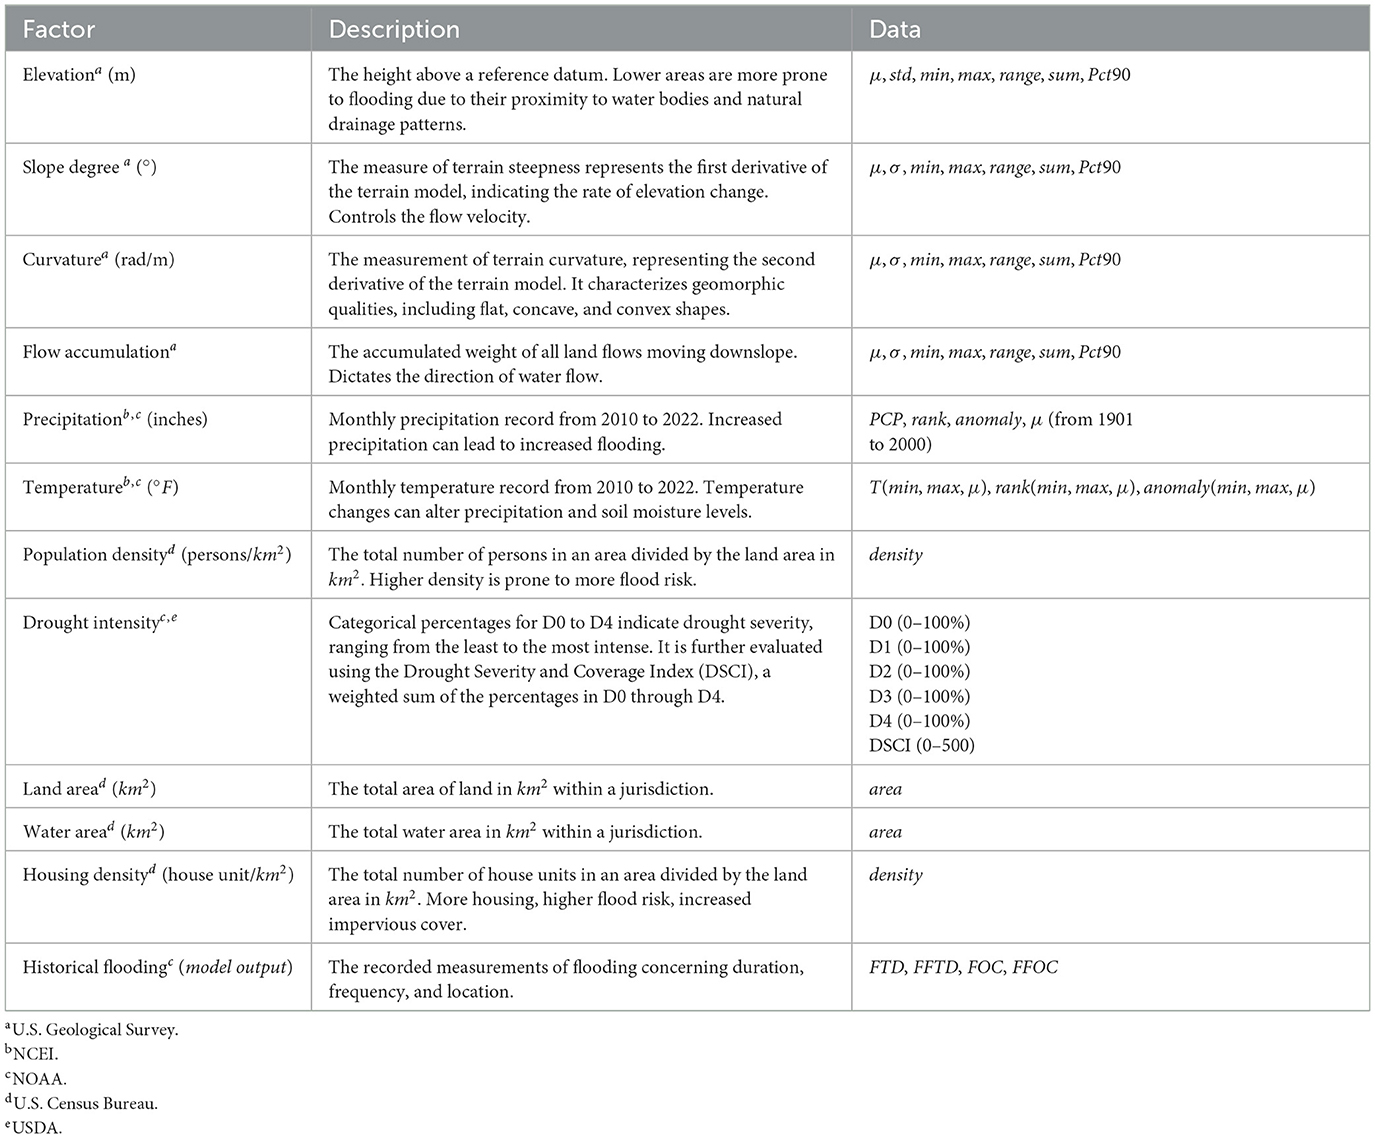
Table 1. NeuralFlood variables (used for modeling) with corresponding descriptions.
The DEMs are downloaded from USGS; they are provided by the 3D Elevation Program (3DEP). 3DEP data serves as an elevation dataset that consists of seamless layers and a high-resolution layer that scientists use for hydrologic modeling. The USGS data download website is open access and available to all users.1 A 1-arc second-resolution, ~30-meter-resolution, is used, for dates between 2019 to 2022. Data manipulations applied to the original DEM files included: merging and trimming datasets to fit their respective states. Slope degree, curvature, and flow accumulation were derived from the DEMs using ArcGIS Pro. All spatial data were stored as raster files that are then analyzed. The county boundary shapefiles were downloaded from the 2023 TIGER/Line dataset available through the Census Bureau.2 The shapefiles represent the 118th Congressional District legal boundaries. Since spatial data are provided in a format intended for GIS use, all spatial data are first processed using ArcGIS Pro and its respective functions. After processing in ArcGIS Pro, spatial data are converted into a tabular CSV format with county-level numeric values to be later fed to the model.
2.2. Data preprocessing
Data preprocessing involves the utilization of three primary techniques: correlation analysis, resampling, and scaling.
2.2.1. Pearson correlation
In this analysis, the p-value is employed to assess the significance of the relationship between variables, particularly in the context of flood vulnerability. Utilizing a significance level of 0.05, the p-value helps determine whether the link between factors like topography, soil type, land use, precipitation, and flood susceptibility is statistically significant. By calculating the Pearson correlation coefficient and examining the associated p-value for each factor, the analysis gauges the strength of these relationships. A lower p-value indicates stronger evidence of a meaningful association. In building index models, any variable with a p-value below 0.05 is excluded from consideration as an input for that specific index model.
2.2.2. Imbalanced datasets
Imbalanced datasets can pose a challenge for machine learning models since they tend to favor the majority class, leading to poor performance in predicting the minority class. In the case of flooding, a model may be effective at classifying non-flood events (class 0) but not as effective at classifying flood events (class 1). A flooding index should be developed in a manner that can identify all ranges and variations of floods. To address this issue, we use both oversampling and undersampling techniques to balance the dataset, recognizing that larger-scale floods are relatively infrequent compared to smaller ones (Chawla et al., 2002). We consider this aspect in our experimental design.
2.2.3. Standardization scaling
All data are normalized using standardization before feeding to the ANN model. Standardization assists in removing the effects of different data scales. When features in a dataset have different scales, the model may give more weight to features with larger values. This can cause biased predictions and inaccurate results. Standardizing the data ensures that each feature has equal importance when feeding the model.
The objective standardization scaling function is:
Here, μ is set to 0 and σ is set to 1. This ensures that each data point, denoted as x, is scaled to have both a zero mean and unit variance. The next section presents this paper's main contribution, NeuralFlood.
3. Methodology: NeuralFlood
The diagram in Figure 1 illustrates the high-level procedural overview of the methodology. NeuralFlood consists of three main pillars: data-driven indexing, using clustering for labeling, and deep learning. NeuralFlood consists of four sub-indices, two for regular and flash flood time durations (FTD and FFTD), and two for regular and flash flood occurrence counts (FOC and FFOC). We adopt the definitions the National Weather Service (NWS) described: floods last longer than flash floods. Flooding can go on for days or even weeks. On the other hand, a flash flood occurs when there is a high volume of heavy rain in a short span, usually <6 h (National Weather Service, n.d).
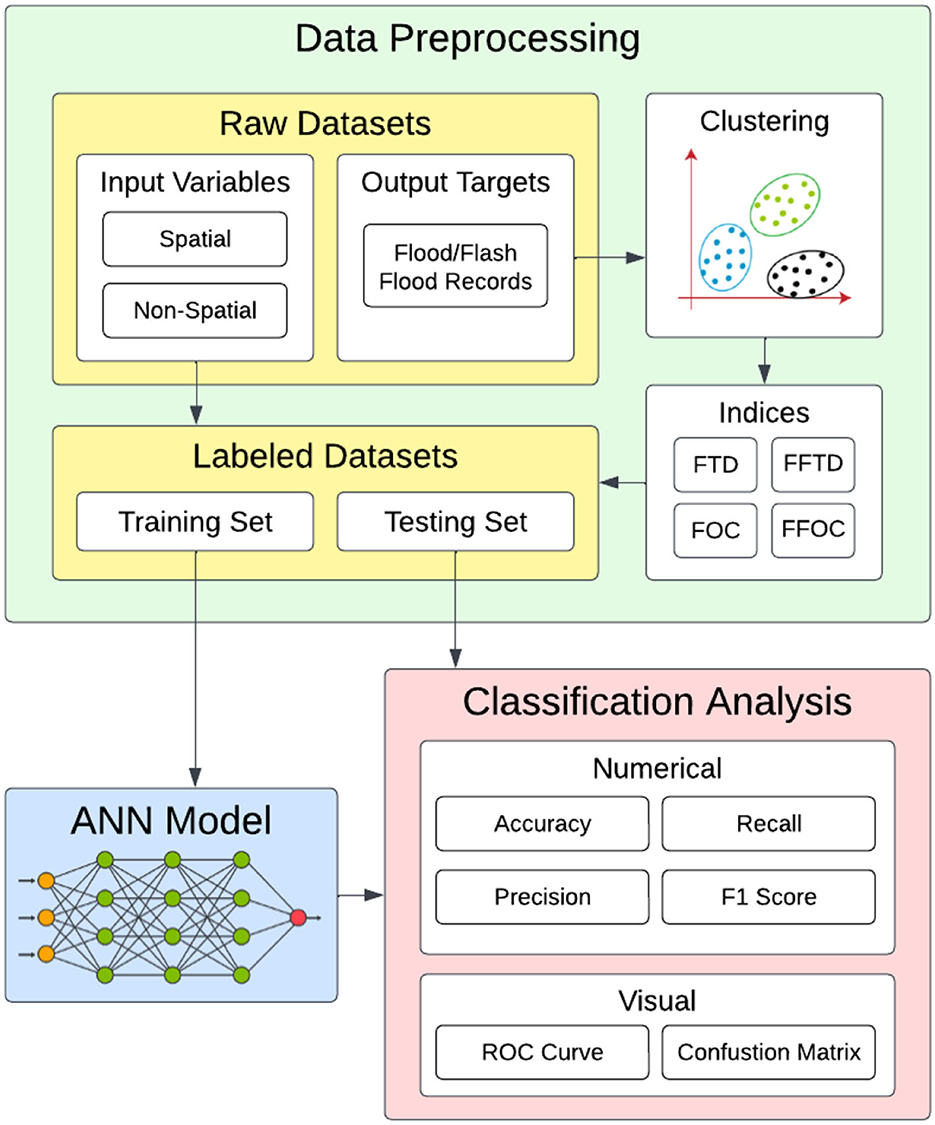
Figure 1. Procedural pipeline for NeuralFlood.
3.1. Flood susceptibility indexing
The flood history, often referred to as the disaster experience, suggests that areas with a significant flood history possess a certain level of adaptation capacity. As a result, these areas also exhibit a higher probability of experiencing future flood events (Zong and Tooley, 2003; Chang and Chen, 2016). In this study, the number of flood occurrences and total duration in minutes within a month are used to label flood susceptibility using K-means clustering.
Previous research in the study areas exclusively employed binary variables (Bui et al., 2018; Darabi et al., 2019) to determine the presence or absence of floods as dependent variables. In contrast, our study deviates from this approach by employing the number of flooding occurrences and the total duration of flooding to determine the flood susceptibility index.
3.2. K-means clustering
The K-means clustering method is advantageous in identifying regions with similar flood patterns and duration (Zhang, 2022). By pinpointing these areas, we can prioritize flood prevention measures and allocate resources to the most vulnerable regions. Once the k-means clustering has been performed, we can use the resulting clusters (as labels) to create a Flood Susceptibility Index. An effective method could include assigning each cluster a score based on the frequency or severity of flood occurrences in that cluster.
The objective K-means clustering function is:
where wik = 1 for datapoint xi if it belongs to cluster k. wik is otherwise equal to 0. The centroid of the cluster is μk. The technique involves minimizing J with respect to the other variables, assigning the data point xi to the closest cluster based on its sum of squared distance from the cluster's centroid.
3.3. ANN for flooding indices
ANNs are a type of deep learning algorithm that are well-suited for modeling complex, nonlinear relationships between variables, such as the case at hand (Mijwel, 2018). In the context of flooding, in our study, ANN is used to create a flood index by predicting the likelihood of flooding based on the listed 12 factors. The indices range from 1 to 7 (occurrence count) and 1 to 5 (total duration). Additionally, ANN can be trained on large datasets and can incorporate new data or features as they become available, allowing for continuous improvement of the flooding index over time.
To use ANN for finding a flooding index, we first need to gather data on the variables that affect flood occurrences (Khoirunisa et al., 2021). These data are used to train the ANN, which involves feeding the algorithm a set of input data along with the corresponding output, the flood susceptibility index. The ANN then learns to map the input data to the output, adjusting its parameters in response to the training data. Once the ANN has been trained, it can be used to classify unseen data.
However, there are some potential challenges to using ANN for finding a flood index (Bentivoglio et al., 2022). One challenge is that the algorithm may overfit the training data, meaning that it performs well on the training data but poorly on new data.
4. Experimental results
This section presents the outcomes of our NeuralFlood study. Each index demonstrates distinct and strong correlations with specific factors, leading to the inclusion or exclusion of different sets of factors in each index.
Before performing k-means clustering on the number of occurrences and total flood duration, we used an elbow diagram to determine the suitable number of clusters for the dataset. In the elbow diagram, the inertia represents the sum of squared distances of samples to their closest cluster center. It is a measure of how compact the clusters are. A lower inertia indicates better clustering. We used a logarithmic scale instead of a normal scale for the elbow diagram to better visualize the differences in inertia scores.
The results of the elbow diagrams in Figure 2, indicated that having seven clusters achieved the best score for the flooding susceptibility index using the occurrence count, while having five clusters yielded the best score for the flooding susceptibility index using the total flood duration. The k-means algorithm silhouette scores are as follows: 0.7667 for FTD, 0.7991 for FFTD, 0.9426 FOC, and 0.9 for FFOC. To further analyze the results, we created tables that define the range of the number of occurrences and total flood duration falling into each flooding susceptibility index. Tables 2, 3 provide a clear understanding of how the different indices are categorized.
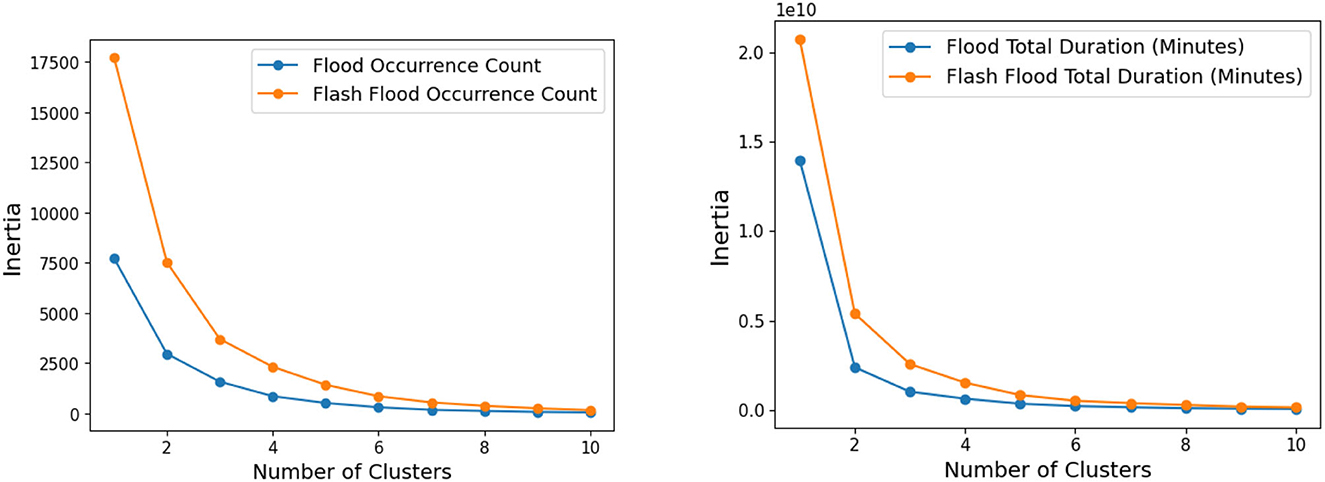
Figure 2. Two elbow diagrams: (left) occurrence count and (right) total duration.
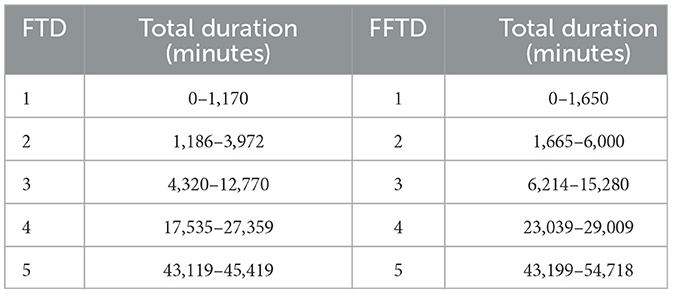
Table 2. Flood and flash flood susceptibility index based on total duration (FTD, FFTD).
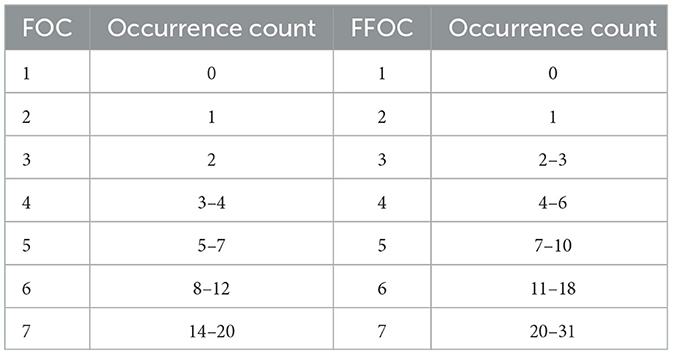
Table 3. Flash flood and flood susceptibility index based on occurrence count (FOC, FFOC).
The four index models vary in architecture performance. FTD model utilized five layers with varying units (416, 160, 96, 192, and 320) alongside a rectified linear unit (relu) activation function and a learning rate of 0.01. FOC model, with five layers and units distributed as (192, 256, 352, 320, and 64), also employed a relu activation function and a learning rate of 0.01. FFTD Model, comprising three layers with units (256, 32, and 32), utilized a relu function and a lower learning rate of 0.001. Lastly, FFOC model featured five layers with units (288, 32, 512, 416, and 128) while using a relu function and a learning rate of 0.001. Therefore, the FTD and FFTD indices ranged from Indices 1 to 5. The FOC and FFOC indices ranged from Indices 1 to 7.
Furthermore, we evaluated the performance of the four flooding susceptibility indices using metrics such as accuracy, precision, recall, and F1 score. It was observed that the index utilizing the number of occurrences for flash floods outperformed the others in terms of precision and recall (see Table 4).
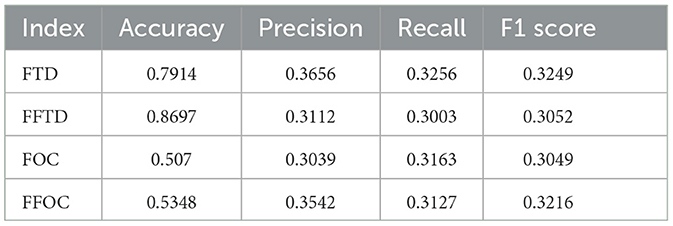
Table 4. NeuralFlood ANN model results.
The ROC graph in Figure 3 was plotted to assess the performance of the flood susceptibility indices. For FTD, it performs moderately well for indices 1, 2, and 3, with AUC values ranging from 0.67 to 0.78. However, index 4 lacks an AUC value (nan), making its performance interpretation impossible. Index 5 exhibits a comparatively lower AUC value of 0.57, indicating weaker discrimination ability compared to the other indices.
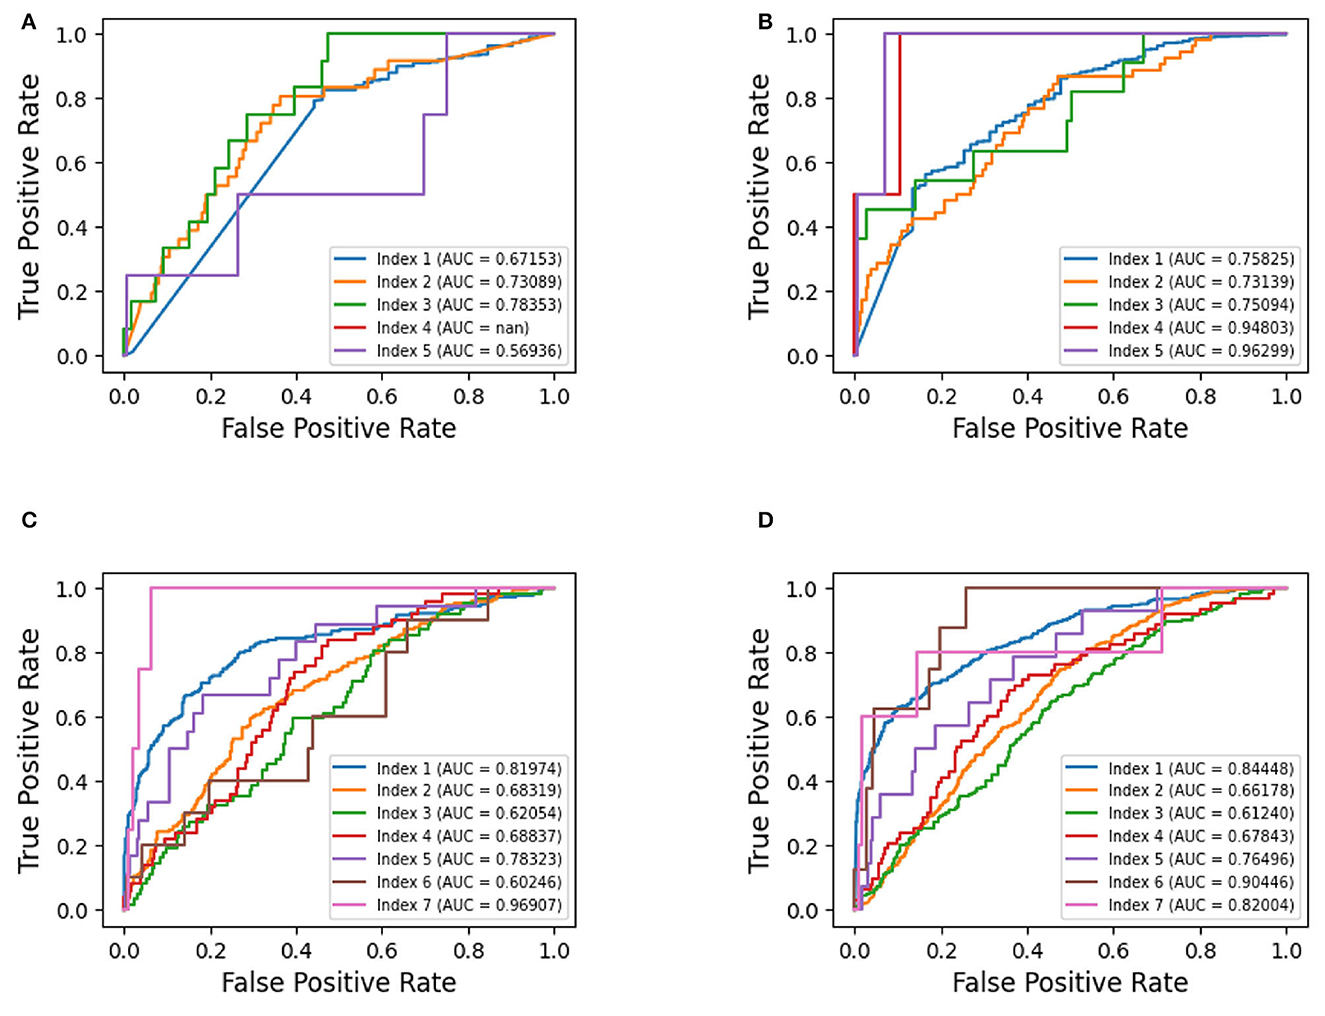
Figure 3. Receiver operating characteristic curves—per index: (A) FTD, (B) FFTD, (C) FOC, and (D) FFOC.
As for FFTD, it consistently performs well across all indices, achieving AUC values ranging from 0.73 to 0.96. All indices demonstrate strong discrimination ability with high AUC values. Notably, indices 4 and 5 stand out with exceptionally high AUC values of 0.95 and 0.96, signifying excellent classification performance.
In the case of FOC, its performance varies across different indices. Indices 1, 5, and 7 showcase relatively higher AUC values, ranging from 0.78 to 0.96, indicative of strong discrimination ability. Conversely, indices 2, 3, 4, and 6 exhibit AUC values ranging from 0.60 to 0.69, suggesting weaker performance in classification tasks.
Similarly, for FFOC, performance varies across different indices. Indices 1, 5, 6, and 7 demonstrate relatively higher AUC values, ranging from 0.76 to 0.90, indicating effective discrimination ability. Conversely, indices 2, 3, and 4 display AUC values ranging from 0.61 to 0.68, suggesting weaker performance in classification tasks.
In the context of the flood susceptibility index, the confusion matrix would display the distribution of true positives (TP), true negatives (TN), false positives (FP), and false negatives (FN) for each of the five classes. According to Figure 4, the first two classes appear to have a good number of true positives, while the remaining classes show relatively lower true positive rates.
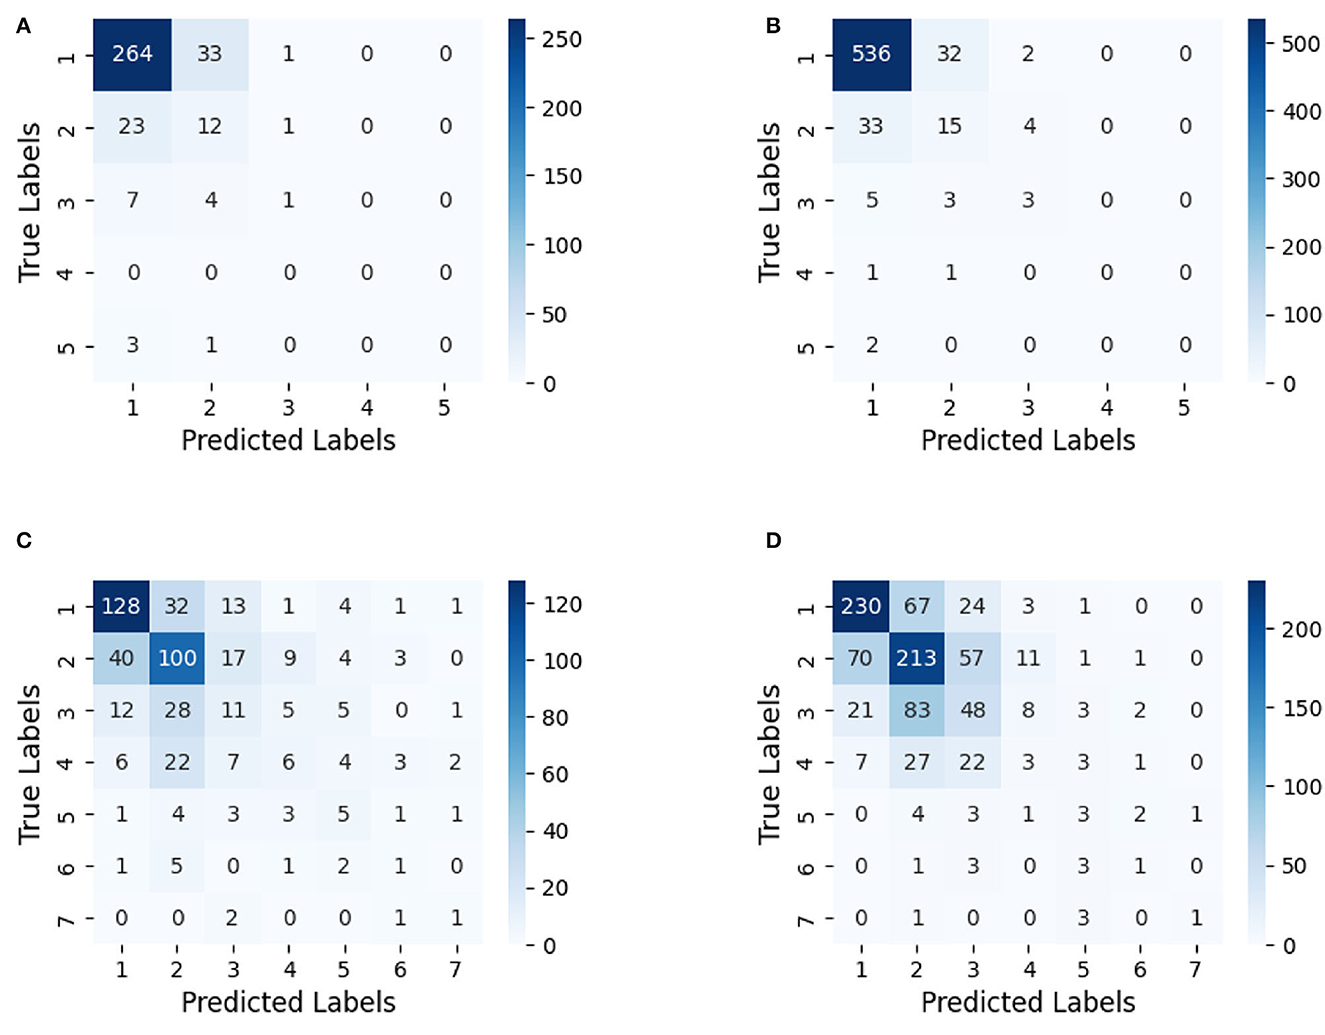
Figure 4. Confusion matrices—per index: (A) FTD, (B) FFTD, (C) FOC, and (D) FFOC.
It is important to note that the goal of NeuralFlood is not to predict floods, rather to be able to classify flooding maps/indices in a more accurate manner. In consideration of multiple contextual factors (pointing back to RQ#1), deep learning can provide a viable solution. The occurrence of a flood, or a high susceptibility score, is considered to be an outlier since floods are not statistically common, even in commonly flooding regions. Additionally, if one observes the performance of the ANN across different sub-indices, the variety is a strong indicator that not all flood indices should be created equal, especially when applied across different geographical contexts (pointing back to RQ#2).
Overall, the results of the NeuralFlood experiment provide insightful information about the flood susceptibility index. The research highlights the effectiveness of certain variables and clustering techniques in assessing flood-prone areas in a data-driven manner.
5. Conclusion and discussions
In this study, we explored the potential use of AI methods in developing a flooding susceptibility index. We employed various techniques, including clustering and deep learning, and provided four different sub-indices. Our motivation for using AI was rooted in the fact that it is a data-driven approach capable of extracting patterns and relationships from large datasets. We present an index (NeuralFlood) that has distinct characteristics not present in existing indices. To implement our approach, we increased the number of variables and utilized clustering technique and multiple layers in ANN while fine-tuning parameters through a trial-and-error process. We also incorporated the total duration time and the number of occurrences of flooding as key factors for creating the indices.
By selecting three U.S. states with different geographical aspects (VA, KS, NV), we leveraged the high variability in our deep learning model. This approach allowed us to capture the diverse factors contributing to flooding susceptibility in each state. While other indices are more geographically specific, our index is intended to provide more general insights, making it a helpful tool for decision support at the federal level, standardized across the country (Huang et al., 2021). Furthermore, we believe that our findings can be extended to other regions, such as the west and east coasts, by considering their unique characteristics. For instance, we can draw examples from the flooding challenges faced by cities like Miami, FL, where rising sea levels pose a significant threat.
Nonetheless, the analysis of our study indicates that the application of AI techniques in developing flooding susceptibility indices still requires further improvement. For instance, it seems the first two classes (Index values 1 and 2) in the four developed sub-indices (FTD, FFTD, FOC, and FFOC) have a good number of true positives while the remaining classes (high susceptibility; 3 through 7) show relatively lower true positive rates. Accordingly, collecting more data from highly flood-prone areas is expected to improve the quality of NeuralFlood. Furthermore, carefully validating the model on independent datasets and using techniques such as regularization can mitigate overfitting or underfitting. Additional sensors in different locations, alternative AI models, and more variables can be also tested to increase the overall robustness of AI-driven indexing.
In conclusion, our study showcased the effectiveness of employing AI techniques, including clustering and deep learning, to create a flooding susceptibility index. NeuralFlood can assist in comprehending and mitigating flooding risks. Additionally, our findings can be extended to other regions, considering their unique geographical aspects. Rising sea levels pose challenges not only to land-based infrastructure but also to maritime assets, pointing to the importance of incorporating such factors into comprehensive and universal AI-driven flooding susceptibility models. Flooding has both immediate and long-term economic implications, as it can disrupt infrastructure and property while also stimulating economic activity through reconstruction efforts. This index enables first responders to identify vulnerable areas and allocate resources more effectively, enhancing overall readiness and resilience.
5.1. Future work
As part of future work, exploring the variation in results across different states would be valuable. Research advances could involve a comprehensive analysis of how the outcomes differed between states, potentially uncovering patterns or trends that might not be evident at a broader level of analysis. Surveying relevant experts and operators might aid in providing outcomes in a more translatable manner; additionally, experimenting with other AI models and investigating the impact of aggregating spatial data into county-level resolutions could provide further insights. Understanding the implications of this aggregation could contribute to more nuanced interpretations of the dataset and its overall significance. Lastly, further experimentation with AI assurance (Batarseh and Freeman, 2022), such as building explainability (i.e., XAI) measures could increase NeuralFlood's user adoption and overall trustworthiness.
Data availability statement
The datasets presented in this article are not readily available because they are sourced from multiple state and government open repositories. Requests to access the datasets should be directed to YmF0YXJzZWhAdnQuZWR1.
Author contributions
FB: Conceptualization, Supervision, Validation, Writing—review & editing. JL: Data curation, Formal analysis, Investigation, Resources, Validation, Visualization, Writing—original draft. CS: Conceptualization, Data curation, Investigation, Methodology, Validation, Visualization, Writing—original draft. EO: Methodology, Resources, Writing—review & editing.
Funding
The author(s) declare that no financial support was received for the research, authorship, and/or publication of this article.
Conflict of interest
The authors declare that the research was conducted in the absence of any commercial or financial relationships that could be construed as a potential conflict of interest.
Publisher's note
All claims expressed in this article are solely those of the authors and do not necessarily represent those of their affiliated organizations, or those of the publisher, the editors and the reviewers. Any product that may be evaluated in this article, or claim that may be made by its manufacturer, is not guaranteed or endorsed by the publisher.
Footnotes
References
Batarseh, F. A., and Freeman, L. (2022). AI Assurance: Towards Trustworthy, Explainable, Safe, and Ethical AI. Academic Press.
Batarseh, F. A., and Kulkarni, A. (2023). AI for water. Computer 56, 109–113. doi: 10.1109/MC.2022.3231142
Bates, P., Quinn, N., Sampson, C., Smith, A., Wing, O., Savage, J., et al. (2021). Combined modeling of US fluvial, pluvial, and coastal flood hazard under current and future climates. Water Resour. Res. 57, e2020WR028673. doi: 10.1029/2020WR028673
Bentivoglio, R., Isufi, E., Jonkman, S. N., and Taormina, R. (2022). Deep learning methods for flood mapping: a review of existing applications and future research directions. Hydrol. Earth Syst. Sci. 26, 4345–4378. doi: 10.5194/hess-26-4345-2022
Bui, D. T., Panahi, M., Shahabi, H., Singh, V. P., Shirzadi, A., Chapi, K., et al. (2018). Novel hybrid evolutionary algorithms for spatial prediction of floods. Sci. Rep. 8, 15364. doi: 10.1038/s41598-018-33755-7
Cao, C., Xu, P., Wang, Y., Chen, J., Zheng, L., and Niu, C. (2016). Flash flood hazard susceptibility mapping using frequency ratio and statistical index methods in coalmine subsidence areas. Sustainability 8, 948. doi: 10.3390/su8090948
Chang, H., and Chen, T. (2016). Spatial heterogeneity of local flood vulnerability indicators within flood-prone areas in taiwan. Environ. Earth Sci. 75, 1484. doi: 10.1007/s12665-016-6294-x
Chawla, N. V., Bowyer, K. W., Hall, L. O., and Kegelmeyer, W. P. (2002). SMOTE: synthetic minority over-sampling technique. J. Artif. Intell. Res. 16, 321–357. doi: 10.1613/jair.953
Chicago Metropolitan Agency for Planning (2018). Flood Susceptibility Index Appendix. Availbal online at: https://stargishub01.blob.core.windows.net/cmap-arcgis-hub01-blob/Open_Data/FloodSusceptibilityIndex_CMAP.zip (accessed May 10, 2023).
Collier, C. G. (2007). Flash flood forecasting: what are the limits of predictability? Q. J. R. Meteorol. Soc. 133, 3–23. doi: 10.1002/qj.29
Darabi, H., Choubin, B., Rahmati, O., Torabi Haghighi, A., Pradhan, B., and Kløve, B. (2019). Urban flood risk mapping using the garp and quest models: a comparative study of machine learning techniques. J. Hydrol. 569, 142–154. doi: 10.1016/j.jhydrol.2018.12.002
Duan, L., Liu, C., Xu, H., Huali, H., Liu, H., Yan, X., et al. (2022). Susceptibility assessment of flash floods: a bibliometrics analysis and review. Remote Sens. 14, 5432. doi: 10.3390/rs14215432
Environmental Protection Agency (2022). Flooding. Available online at: https://www.epa.gov/natural-disasters/flooding (accessed May 10, 2023).
FEMA (2023). National Risk Index Technical Documentation. Federal Emergency Management Agency. Available online at: https://www.fema.gov/sites/default/files/documents/fema_national-risk-index_technical-documentation.pdf (accessed May 10, 2023).
Hapuarachchi, H. A. P., Wang, Q. J., and Pagano, T. C. (2011). A review of advances in flash flood forecasting. Hydrol. Process. 25, 2771–2784. doi: 10.1002/hyp.8040
Huang, C.-H., Batarseh, F. A., Boueiz, A., Kulkarni, A., Su, P.-H., and Aman, J. (2021). Measuring outcomes in healthcare economics using artificial intelligence: with application to resource management. Data Policy 3, e30. doi: 10.1017/dap.2021.29
IPCC (2021). “Climate change 2021: the physical science basis,” in Contribution of Working Group I to the Sixth Assessment Report of the Intergovernmental Panel on Climate Change, eds V. Masson-Delmotte, P. Zhai, A. Pirani, S. L. Connors, C. Péan, S. Berger, N. Caud, Y. Chen, L. Goldfarb, M. I. Gomis, M. Huang, K. Leitzell, E. Lonnoy, J. B. R. Matthews, T. K. Maycock, T. Waterfield, O. Yelekçi, R. Yu, and B. Zhou (Cambridge; New York, NY: Cambridge University Press), 2391.
Khoirunisa, N., Ku, C.-Y., and Liu, C.-Y. (2021). A gis-based artificial neural network model for flood susceptibility assessment. Int. J. Environ. Res. Public Health 18, 1072. doi: 10.3390/ijerph18031072
Mallakpour, I., and Villarini, G. (2015). The changing nature of flooding across the central united states. Nat. Clim. Chang. 5, 250–254. doi: 10.1038/nclimate2516
Micu, E.-A. (2022). Transport Infrastructure Damaged by Floods has a Detrimental Impact on Recovery - the Irish Experience - aa-Floods. Available online at: https://aafloods.eu/transport-infrastructure-damaged-by-floods-has-a-detrimental-impact-on-recovery-the-irish-experience
Mijwel, M. M. (2018). Artificial Neural Networks Advantages and Disadvantages. Available online at: https://www.linkedin.com/pulse/artificial-neuralnetWork,21
National Weather Service (n.d.). Flood Flash Flood Definitions. Available online at: https://www.weather.gov/mrx/flood_and_flash (accessed August 25 2023).
Priscillia, S., Schillaci, C., and Lipani, A. (2021). Flood susceptibility assessment using artificial neural networks in indonesia. Artific. Intell. Geosci. 2, 215–222. doi: 10.1016/j.aiig.2022.03.002
Rahman, M., Ningsheng, C., Islam, M. M., Dewan, A. M., Iqbal, J., Washakh, R. M. A., et al. (2019). Flood susceptibility assessment in bangladesh using machine learning and multi-criteria decision analysis. Earth Syst. Environ. 3, 585–601. doi: 10.1007/s41748-019-00123-y
Rahmati, O., Zeinivand, H., and Besharat, M. (2016). Flood hazard zoning in Yasooj region, Iran, using GIS and multi-criteria decision analysis. Geomat. Nat. Haz. Risk 7, 1000–1017. doi: 10.1080/19475705.2015.1045043
Sampson, C. C., Smith, A. M., Bates, P. D., Neal, J. C., Alfieri, L., and Freer, J. E. (2015). A high-resolution global flood hazard model. Water Resour. Res. 51, 7358–7381. doi: 10.1002/2015WR016954
Smith, A. B. (2023). 2022 U.S. Billion-Dollar Weather and Climate Disasters in Historical Context. Available online at: https://www.climate.gov/news-features/blogs/beyond-data/2022-us-billion-dollar-weather-and-climate-disasters-historical (accessed May 10, 2023).
Stanke, C., Murray, V., Amlôt, R., Nurse, J., and Williams, R. (2012). The effects of flooding on mental health: outcomes and recommendations from a review of the literature. PLoS Curr. 4, e4f9f1fa9c3cae. doi: 10.1371/4f9f1fa9c3cae
Tien Bui, D., Pradhan, B., Nampak, H., Bui, Q.-T., Tran, Q.-A., and Nguyen, Q.-P. (2016). Hybrid artificial intelligence approach based on neural fuzzy inference model and metaheuristic optimization for flood susceptibility modeling in a high-frequency tropical cyclone area using gis. J. Hydrol. 540, 317–330. doi: 10.1016/j.jhydrol.2016.06.027
Warner, B. P., Schattman, R. E., and Hatch, C. E. (2017). Farming the floodplain: ecological and agricultural tradeoffs and opportunities in river and stream governance in New England's changing climate. Case Stud. Environ. 1, 1–18. doi: 10.1525/cse.2017.sc.512407
Wu, X., Xiao, Q., Wen, J., You, D., and Hueni, A. (2019). Advances in quantitative remote sensing product validation: overview and current status. Earth Sci. Rev. 196, 102875. doi: 10.1016/j.earscirev.2019.102875
Zhang, Y. (2022). “Urban flood disaster prediction based on k-means clustering and gru network,” in 2022 6th Annual International Conference on Data Science and Business Analytics (ICDSBA) (Changsha: IEEE), 83–88.
Keywords: AI-driven index, Artificial Neural Network (ANN), clustering, deep learning, flood susceptibility index
Citation: Lin J, Sreng C, Oare E and Batarseh FA (2023) NeuralFlood: an AI-driven flood susceptibility index. Front. Water 5:1291305. doi: 10.3389/frwa.2023.1291305
Received: 08 September 2023; Accepted: 03 October 2023;
Published: 27 October 2023.
Edited by:
Isa Ebtehaj, Laval University, CanadaReviewed by:
Babak Mohammadi, Lund University, SwedenAmir Hossein Salimi, Laval University, Canada
Hamed Azimi, Memorial University of Newfoundland, Canada
Copyright © 2023 Lin, Sreng, Oare and Batarseh. This is an open-access article distributed under the terms of the Creative Commons Attribution License (CC BY). The use, distribution or reproduction in other forums is permitted, provided the original author(s) and the copyright owner(s) are credited and that the original publication in this journal is cited, in accordance with accepted academic practice. No use, distribution or reproduction is permitted which does not comply with these terms.
*Correspondence: Feras A. Batarseh, YmF0YXJzZWhAdnQuZWR1