 Solange Uwamahoro1,2,3
 Tie Liu1,2,3,4,5*Vincent Nzabarinda1,2,3Zheng yang Li1,2,3Adeline Umugwaneza1,2,3Albert Poponi Maniraho1,2,3Patient Mindje Kayumba1,2,3Aminjon Gulakhmadov1,2,5Bao Anming1,2,3,4,5Farkhod Abdullaev1,2,3
- 1State Key Laboratory of Desert and Oasis Ecology, Xinjiang Institute of Ecology and Geography, Chinese Academy of Sciences, Urumqi, China
- 2Key Laboratory of GIS and RS Application Xinjiang Uygur Autonomous Region, Urumqi, China
- 3Department of Cartography & GIS, University of Chinese Academy of Sciences, Beijing, China
- 4China-Pakistan Joint Research Center on Earth Sciences, CAS-HEC, Islamabad, Pakistan
- 5Research Center for Ecology and Environment of Central Asia, Chinese Academy of Sciences, Urumqi, China
Lake Issyk-Kul is an endorheic lake in arid Central Asia that is vital to the region's ecological sustainability and socio-economic development. Climate change and anthropogenic water consumption led to fluctuations in the lake's water level, which affected the water resource. The goal of this study was to examine the impacts of climate change and human activities on the Issyk-Kul water balance by combining the Coupled Model Intercomparison Project Phase 6 (CMIP6) scenarios with hydrological modeling. The Soil and Water Assessment Tool (SWAT) model was used to incorporate signals of future precipitation and temperature changes. According to the scenarios, the total discharge of the three catchments showed an overall increasing trend with a maximum value of 28.02%. The snow and ice-melt water from March to August was revealed, and the increasing trends only occurred from March to May, with the snow and ice melting peak variations ranging from 0.5% to 2%. The high increase in change appeared in northern catchment of the lake. There was an exceptional upward precipitation trend over the northern catchment, with annual increases ranging from 0.7 to 14.5%, and an average annual temperature of 1.72°C. With slight similarities, the total runoff would increase for all catchments, with an average annual value of 10.6%. The northern catchment was significantly more sensitive to precipitation and warming than the southeastern catchments. Under land use land cover change, average annual discharge decreased with agricultural expansion, with discharge differences ranging from −0.005 to −1.06 m3/s. The findings are useful for decision-makers addressing the challenges of climate change mitigation and local water resource management.
1 Introduction
The impact of global climate change on water supplies is still a major concern in modern science, economics, and ecosystems and manifests to have an indirect and direct impact on natural hydrological (Sarker, 2022) and climatic circulation (Arnell and Gosling, 2013) through changes in rainfall patterns, runoff, and sea level (Honings, 2018). These changes are of great concern as the world's population grows and the current high demand for water is stressed (Vörösmarty et al., 2000), and they affect environmental integrity (Standen et al., 2022). The impact of water diversions (Gao et al., 2022) on lakes for irrigated agriculture and urban use (Wine and Laronne, 2020) has been widely exposed. In addition, rising temperatures, changing precipitation patterns (Singhal et al., 2023), and changes in extreme frequency events increase the likelihood of flooding (Sarker, 2023; Singhal et al., 2023), alter seasonal water supply (Mertz et al., 2009), and water level (Dusini et al., 2009; Yuan et al., 2015) and, as a result, have an impact on nutrient transport (Alifujiang et al., 2020). Climate change drivers such as area, location, and elevation contribute to similarities and differences, and few studies have been conducted to account for them (Lan et al., 2011). Climate and human activities influence the water balance of Lake Issyk-Kul (Romanovsky, 2002) as important ecosystem indicators and water sources in Kyrgyzstan (Matuzeviciute et al., 2018). Other recent studies, such as Alifujiang et al. (2002), Romanovsky (2002) and uulu Salamat et al. (2015), claim that the lake is experiencing water level instability. The water-level fluctuations (Alymkulova et al., 2016; Alifujiang et al., 2017) were identified by unexpected changes in runoff (Alifujiang et al., 2002) and seasonal flooding (Duan et al., 2020). For the local society, simulation of hydrological components (Uwamahoro et al., 2021), accurate forecasting of seasonal variations in the water level of Issyk-Kul Lake under various scenarios, and anthropogenic activities are essential.
Indeed, Global Circulation Model (GCMs) play an important role in predicting future climate change (Yao et al., 2020). However, due to unknown data, the interpolation of Global Circulation Model (GCM) data is required, and they must be thoroughly analyzed and verified. One way to estimate values between known data points is through interpolation (Hamed et al., 2022; Prathom and Champrasert, 2023). It entails estimating climate data values for a particular site. The interpolation methods of climate change scenarios have been widely used in climate predictions (Markovic et al., 2014), and the model simulation provides the more accurate prediction (Lee et al., 2014). Utilizing predictions under various scenarios, the Global Circulation Model (GCM) is a model used to determine the future climate situation (Chokkavarapu and Mandla, 2019). However, only at a low spatial resolution (250–600 km) does the GCM produce predictions (Kaini et al., 2020). The location of the catchment plays a role in conducting unsampled data selection and bias correction methods to determine the accuracy of hydrological modeling. The study uses a model ensemble, which is able to lower a single model's uncertainty. When creating data, interpolation is crucial in the unsampled area or in predictions by applying mathematical techniques, both geostatistical and non-geostatistical (Huerta et al., 2023). Inverse Distance Weight IDW data's performance is a non-geostatistical spatial interpolation and heavily dependent on the season (Chae et al., 2022; Adelodun et al., 2023). IDW is a well-liked interpolation technique because of its low complexity (Zhu et al., 2022). According to the literatures, the effectiveness of different spatial interpolation techniques, such as IDW, in estimating climate data demonstrates that the interpolated error values' low-level error by IDW is not significantly different from that of the other approaches (Meng et al., 2019; Tan et al., 2021; Liu et al., 2022). Therefore, our reasoning for selecting IDW is strengthened by its ability to capture local patterns and user-controlled parameters. Furthermore, Coupled Model Intercomparison Project Phase 6 (CMIP6) builds on previous CMIP simulations to address a wide range of specific questions and fill scientific gaps identified in previous CMIP phases (Eyring et al., 2016). The Model Intercomparison Project (MIP) promotes CMIP6, the so-called Shared Socioeconomic Pathways (SSPs), in order to provide more reasonable and accurate data (Voldoire et al., 2019; Tokarska et al., 2020; Zelinka et al., 2020). SSP119 is a brand-new scenario, while SSP585 is an updated version of Representative Concentration Pathway (RCP) scenarios from CMIP5 (Qing, 2012; Riahi et al., 2017). These climate scenarios may provide the most accurate and practical future projections. The SSP119 aims to keep global warming below 1.5°C in order to meet the Paris Agreement's goals (Su et al., 2002). The scenario 119 focuses on consumption with a low material growth rate and a lower resource and energy intensity (Riahi et al., 2017). Thus, because Kyrgyzstan is a landlocked country (Akiner, 2016; Rovenskaya et al., 2018) with relatively low industrialization and agriculture (Rodrik, 2017; Lee and Mah, 2020), scenario 119 was chosen to examine climate change in this study. And also, as the country is surrounded by developed countries such as China and Kazakhstan (Kembayev, 2020) with fossil-fueled development (Yang, 2010), SSP545 is recommended since it focuses on fossil-fuel production (Riahi et al., 2017).
Previous climate researches have focused on regional trends of climate patterns (Fontaine et al., 2001; Stone et al., 2001; Jha et al., 2006; Cousino et al., 2015). Most of existing climate effect studies and discharge prediction models are limited in extent and focus on specific, small locations (Fontaine et al., 2001; Stone et al., 2001; Jha et al., 2006; Cousino et al., 2015). Limited studies have examined the impacts of climate change associated with differences in elevation, location, latitude, area, slope (Luo et al., 2019b), and human activities (Alifujiang et al., 2002). However, the influence of human activities and climate change on hydrological components has yet to be recognized. Thus, there is a lack of understanding of the local impacts of climate on water resources in smaller watersheds, as well as how these small watersheds respond to changes caused by elevations, locations, latitude, and area differences, as well as anthropogenic activities. Discharge differences are influenced by the agriculture change ratio (Juahir et al., 2010). In fact, there is a link between the population and their activities (Mahmoud and Gan, 2018), which lead to increased water consumption, especially for irrigation. In a variety of catchments, the Soil and Water Assessment Tool (SWAT) has been used to forecast discharge (Abbaspour et al., 2007; Baker and Miller, 2013; Grusson et al., 2015). We used the SWAT model in this study with the general objective of quantifying the effects of climate change and land use change on total water resources based on the capacity revealed by previous researchers using this model. The specific objectives of this research are to: (1) simulate total discharges from these catchments for the period 2020–2100 based on two scenarios of greenhouse gas emissions, SSP119 and SSP585; (2) quantify the effects of climate change on water resources in the three selected catchments around Lake Issyk-Kul; and (3) use the Markov matrix and the regression model to show historical and future changes in LULC due to human activities and climate change for the periods (1992–2003), (2003–2015), and (2015–2100).
2 Materials and methods
2.1 Study area and used data
2.1.1 Study area
The Issyk-Kul Lake basin is located between 42°250 N and 77°150 E (Figure 1) at an altitude of 1,606 m above sea level (a.s.l.), on the northern slopes of the Tian-Shan Mountains in Kyrgyzstan, part of arid Central Asia (Ferronskii et al., 2003). Issyk-Kul Lake, Central Asia's largest high-altitude lake, is the continent's fourth-deepest reservoir, an endogenous mountain lake, and one of the world's highest saline lakes (Romanovsky, 2002). It is surrounded by high mountains like the Teskey Ala-Too range to the south, with peaks exceeding 4,808 m, and the Kungey Ala-Too range to the north, with peaks exceeding 4,648 m. Its watershed covers an area of 22,080 km2, and all major branches of the Issyk-Kul originate from 834 glaciers with a volume of 48 km3 and a total glacial area of 650 km2 (Shabunin and Shabunin, 2002; uulu Salamat et al., 2015). The area around Issyk-Kul Lake is one of Kyrgyzstan's most densely populated areas. The population of its oblast increased from 177,300 in 1940 to 448,000 in 2012, with an average annual growth rate of 1.84% (Alifujiang et al., 2017). The climate in the Issyk-Kul basin is moderately warm, making it ideal for cereals, crops, and gardening (Propastin, 2013; Alymkulova et al., 2016). The temperature in the basin reaches 19–20°C in July and does not fall below 2–3°C in January, with precipitation ranging from 12.3 to 35 mm (Alymkulova et al., 2016). Because of the basin's unusually mild climate, intensive agriculture has developed throughout the lake basin (Romanovsky et al., 2013). Anthropogenic activities in the region have influenced hydrological processes in the basin, including agricultural irrigation, land use, and water-soil conservation, and the spatial and temporal distribution of water resources has shifted (Dong et al., 2016; Wu et al., 2017). Therefore, the main focus of this study is the variation in water levels at Issyk-Kul. Thus, we selected three catchments in the vicinity of Issyk-Kul Lake: the two catchments (a) and (c) to the southeast and catchment (b) to the north of the lake. The catchments' areas for (a), (b), and (c) are 332.08, 98.15, and 206.01 km2, respectively.
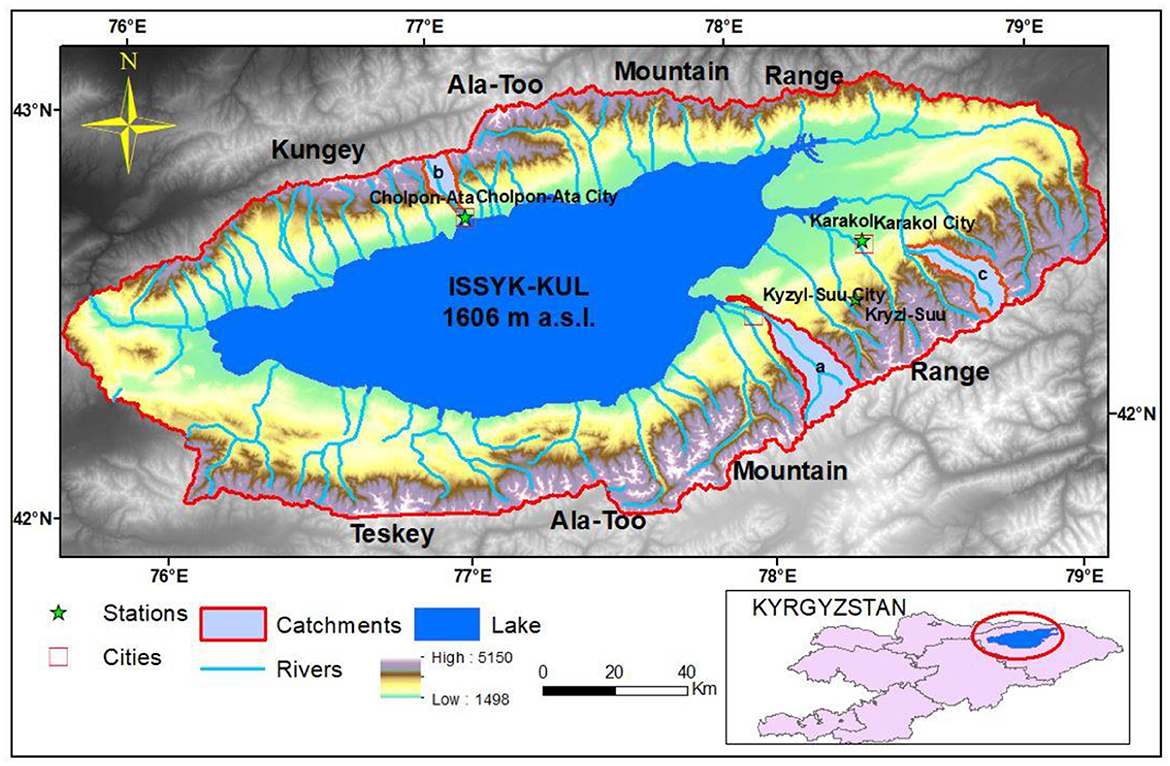
Figure 1. The location of the three selected catchments around Issyk-Kul Lake in Kyrgyzstan.
2.2 Metrological, observed discharge, and GCM data
To model the hydrologic process in the watershed, SWAT combined weather and climate, spatial/terrestrial land surface, hydrological data. Kyzyl-Suu, Cholpon-Ata, and Karakol stations provided daily precipitation, maximum and minimum temperatures ranging from 1988 to 2019 and monthly observed discharge data for the catchments (a), (b), and (c), respectively. Humidity, wind speed, and solar radiation were collected from the Meteorological Service of Canada (MSC) and can be downloaded free online at https://www.canada.ca/en/environment-climate-change/services/climate-change/canadian-center-climate-services/display-download.html.
Interpolation of the GCM data to the site (Lima et al., 2021) and then correcting the data with the station data is the better way to increase the climate models' accuracy. In this study, values were estimated at a specific site (catchmenst a, b, and c) through the interpolation of GCM data. Afterwards, adjust the estimates with real observed data from the catchments to improve them. The process ensures that simulated data closely resembles real-world dimensions and helps to increase the accuracy of climate models. The climate models such as CanESM5, IPSL- CM6A-LR, MIROC6, and ACCESS-CM2, all of which are available in CMIP6, were selected via variant r1i1p1f1, and the historical simulation was successfully performed, and the more detail was mentioned (Table 1). The future emission scenarios for the Shared Socioeconomic Pathways (SSP) reflecting the respective medium and high emission scenarios were considered for this study, and then the downscaled data were used in the Soil and Water Assessment Tool (SWAT) model. In addition, the characteristics and fluctuation of LULC for the years 1992, 2003, and 2015 were determined using a recent and consistent land cover map from the European Space Agency (ESA) Climate Change Initiative (CCI) project, which was downloaded from the online open access portal (https://www.esa-landcover-cci.org).
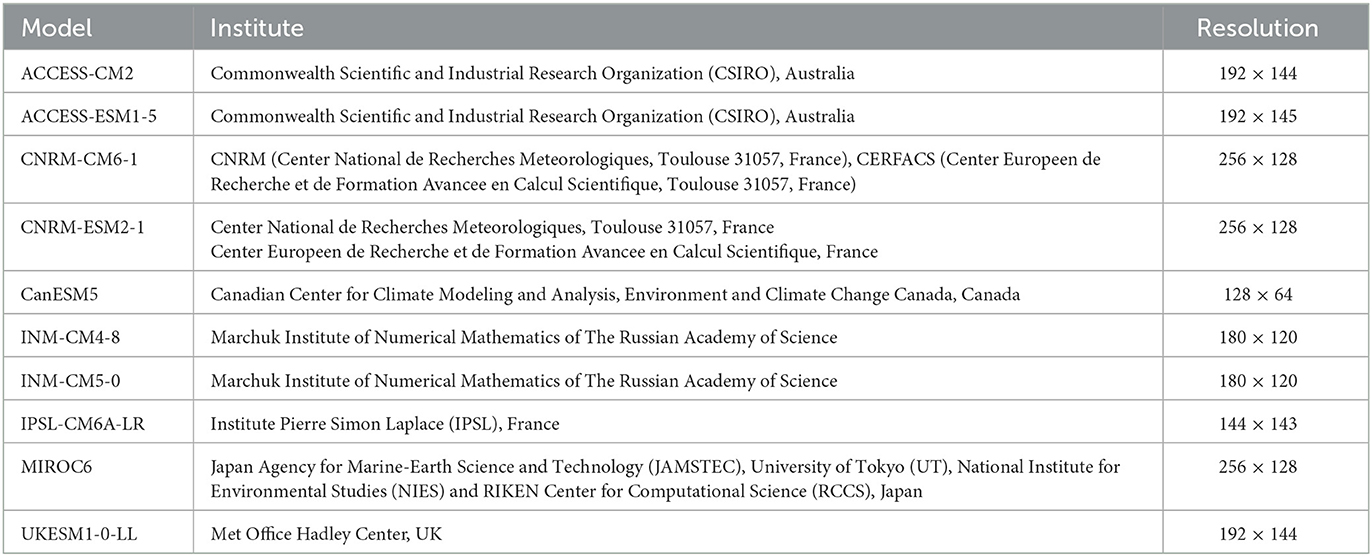
Table 1. GCMs used and information.
2.3 Methods
2.3.1 Pre-processing of the data
The GCM outputs were interpolated against the observation grid data. Interpolation which creates values between known data points, the historical relationship analysis, which aims to calibrate the prediction by capturing the relationship between observed data and prediction output was considered.
• Interpolation:
Following the preprocessing of the data, Inverse Distance Weight (IDW) was used to raise the spatial resolution to 1 km and create new data points between the preexisting data. Each existing point was assigned a weight in order to estimate the value of the new point, taking into account the spatial distance to the new one. The point that was closest to the new point, that is the point with the least amount of spatial separation, would be given more weight than the other points. Furthermore, the climate change signals obtained from the GCM models were averaged, and values other than 0.5 standard deviations were removed.
They were corrected using observed data for the period from 2000 to 2015. The corrected parameters were then used to predict the future climate for the period 2020–2100.
2.3.2 Hydrologic modeling using SWAT model
SWAT is a daily operating semi-distributed basin-scale water balance model that requires the following daily meteorological data: maximum and minimum temperatures, precipitation, solar radiation, wind speed, and relative humidity. Furthermore, Digital Elevation Model (DEM) with resolution of 30 m from Shuttle Radar Topography Mission (SRTM); (http://srtm.csi.cgiar.org/), LULC from https://www.esa-landcover-cci.org, and soil maps from the Food and Agriculture Organization (FAO) and the International Institute for Applied Systems Analysis (IIASA) were used in the model. This model simulates a large basin with catchments divided into different zones based on elevation. On the basis of the DEM map, all necessary information of each band was calculated in this study. Every catchment was calibrated and validated using observed discharge time series. Sequential Uncertainty fitting 2 (SUFI-2) is linked by SWAT Calibration and Uncertainty Program (SWAT-CUP) (Sao et al., 2020). SUFI-2 was used to set the sensitive parameters and their ranges, with 95% Prediction Uncertainty (95PPU). The SWAT model was used to simulate the three selected catchments' hydrological processes. The hydrological model's performance in these catchments was evaluated in terms of monthly discharges in m−3s−1. For model calibration and validation, the monthly discharge values were used. To simulate the snow melt, the model used spatial data which includes snow cover. The climate inputs were the critical data for snow melt estimation in the watersheds.
The input data were from January 1, 1988, to December 31, 2019, with the first two years of 1988 and 1989 serving as a warmup period. The remaining years with the corresponding observed discharge were divided into segments, which are calibration periods for the catchments ranging from 1990 to 1995, 1990 to 2000, 2013 to 2014, and validation periods for catchments (a), (b), and (c), respectively, ranging from 1996 to 2001, 2001 to 2011, and 2015 to 2016. The calibration parameters were adjusted and set to the best possible values (Table 2).
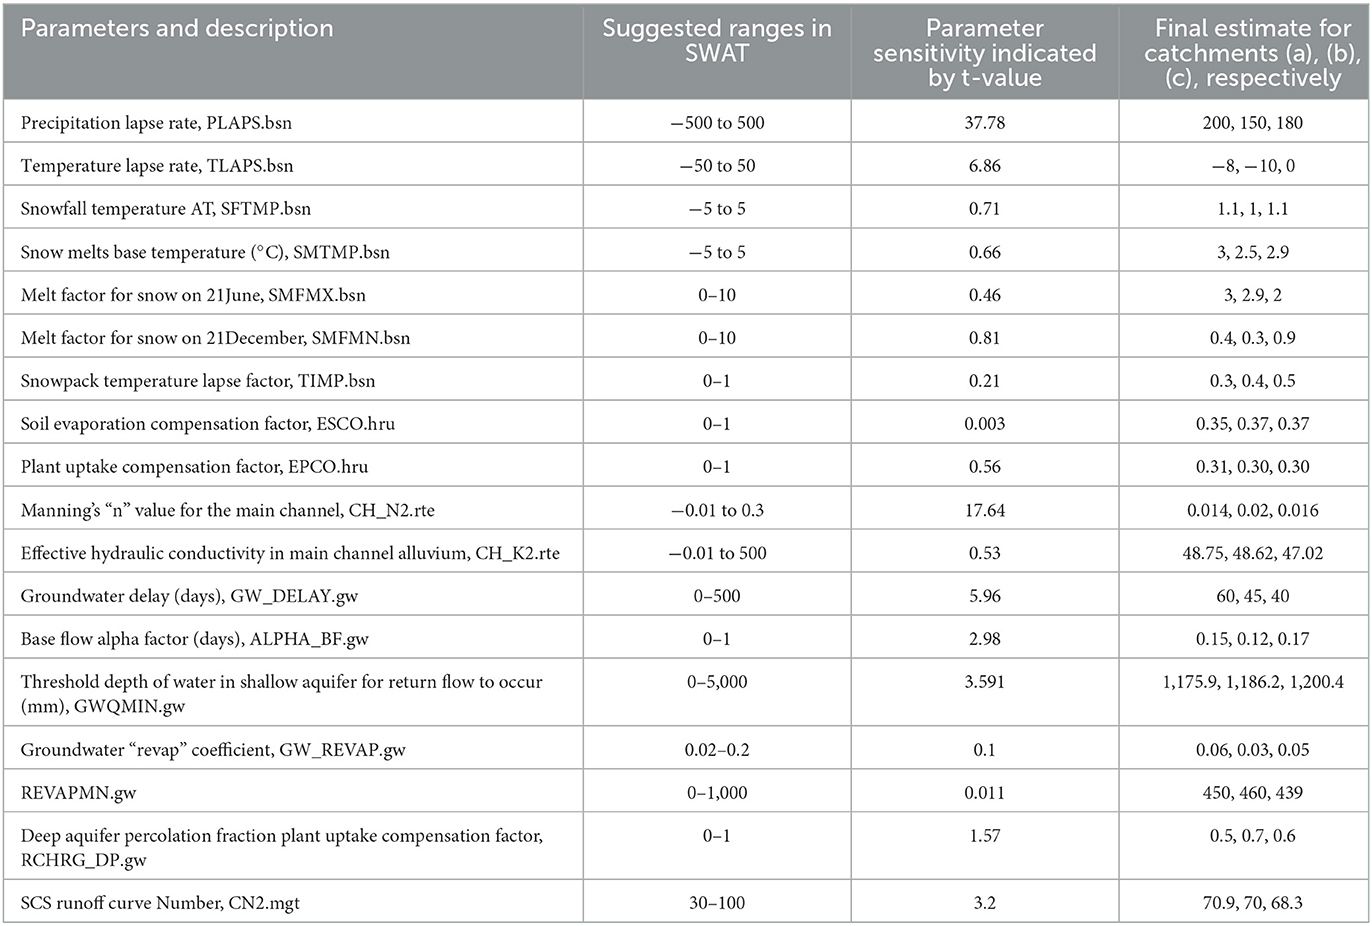
Table 2. Calibration parameter adjustments.
The (Eq. 1) goodness-of-fit test (R2) and the (Eq. 2) Nash-Sutcliffe efficiency coefficient (NSE) were used to assess the modeling results' accuracy as follows:
Where Qsi and Qoi are the simulated and observed discharges, respectively, and and correspond to their mean values.
2.3.3 Precipitation and temperature
The weather station data, including precipitation and temperature were used in the SWAT model, and then GCMs were downscaled to sites (catchments a, b, and c) via IDW. Interpolated to the site via the IDW. A model ensemble is used in the study, which can reduce the uncertainty of a single model (Willcock et al., 2020; Gholami et al., 2023). The following procedures were conducted:
• Extract grid data: the determination of meteorological stations located in the catchments a, b and c was first conducted, then retrieve the relevant grid data was first retrieved from the Global Circulation Model (GCM).
• Calculate change signals: utilizing the extracted grid data, the change signal for every meteorological station was determined.
• Obtain multiple change signals: since there are several models being used, each model will produce a unique set of change signals.
• Identify bias: for each change signal, determine the outliers by comparing the values to the mean. Outliers are defined as values that exceed three standard deviations above or below the mean.
• Remove bias: from each set of change signals, the identified bias is removed to ensure that the data is more representative of the general trend.
• Calculate average change signal: after outlier removal, calculation of the average of the remaining change signals across all models was carried out to obtain a consolidated change signal.
• Signal values of SSP119 and SSP585: the precipitation and temperature values were computed as monthly ratios; it was simple to reintroduce them into the model for the purpose of predicting future hydrological components.
2.3.3.1 Predictions by SWAT model and sensitivity analysis
The most straightforward (Figure 2) method for obtaining climate-modified hydrologic results to analyze the impact of climate change on water resources is to run future climate data through a hydrologic model (Steele-Dunne et al., 2008). This study looked at the differences between future (2020–2100) and historical (1988–2019) time series to estimate the effect of climate change on runoff. Climate change signals were also added to the SWAT baseline model to predict hydrological processes under future emission scenarios.
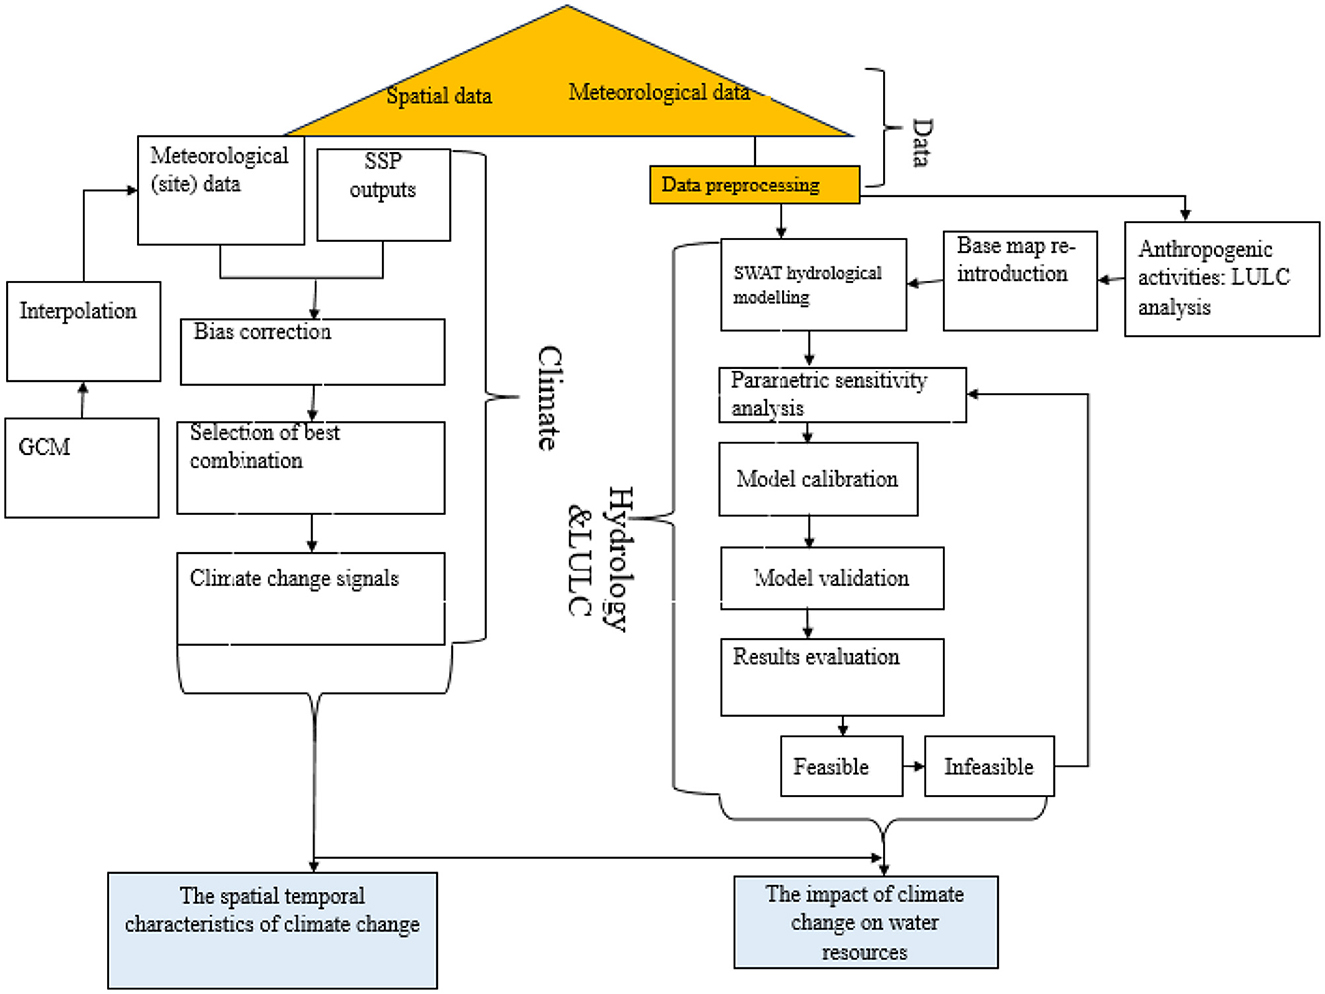
Figure 2. Methodological flow chart of the study assessment.
Water resource sensitivity to climate change reflects the degree to which a particular hydrological component responds to changes in a climate variable or emission scenario (Watson et al., 1996). The hydrological component, such as discharge, has been taken into account and can be expressed in the following way (Eq. 3):
Where HC and CV are the current period's hydrological component values and a climate variable, respectively; CΔ+V denotes the value of a climate variable adjusted based on some emission scenarios; and HΔ+C denotes the value that corresponds to the variation of a climate parameter with the hydrological component. Following a sensitivity analysis, the significance of each climate variable in the evolution of water resources can be understood (Lan et al., 2011).
2.3.4 Land use land cover analysis for the catchments
Changes in LULC were assessed using first and second order Markov chains (Aaviksoo, 1995). For the three selected catchments, a Markov matrix and regression model were used to show historical and future changes in LULC caused by human activities and climate change. The study focuses on the impact of agricultural changes on total catchments' discharge. Markov chains represent a dynamic system of specific classes represented by symmetric matrices with transition probabilities (Luenberger, 1979; Logofet and Lesnaya, 2000; López et al., 2001). The goal of studying LULC changes caused by human activities was to figure out what was causing the abrupt changes in streamflow. A standard digital tablet was used to digitize the interpreted and field-verified aerial photographs for land—cover (1992, 2004, and 2015) corresponding to the all of each catchment and landforms. The landscape was described using a terrain analysis approach that combined landforms and land—cover (Verstappen et al., 1991; López et al., 2001), with geometric correction performed in ArcMap 10.3. The position accuracy and marking have been put to the test following Bocco and Riemann (1997). Moreover, Markov matrices and regression analysis were used to predict the change in LULC over the next 85 years. The shift in LULC were assessed using first and second order Markov chains for the periods (1992–2003) and (2003–2015). The future LULC was estimated and predicted using regression analysis up to the year 2100. The results of the statistical analysis of the matrix tables for all catchments were presented in the form of figures in this study. In addition, the impact of LULC changes on total discharge stream flow was investigated by incorporating LULC (agriculture) changes into the SWAT model.
3 Results
3.1 Hydrological modeling
The model discharge calculations for the catchments (a), (b), and (c) were compared to the observed discharge from the corresponding gauging stations. For all catchments, the model calculation results include R2 values ranging from 0.81 to 0.95 and Nash-Sutcliffe efficiency (NSE) values ranging from 0.75 to 0.96 (Table 3). The model underestimated the peak flow and slightly overestimated the base flow before calibration, and after manual calibration, the parameters were set to different values based on the behavior of the models. Both peak and base flows were successfully simulated by the model. Overall, the calibration and validation went well, as shown in Figure 3, which also shows the goodness of fit.
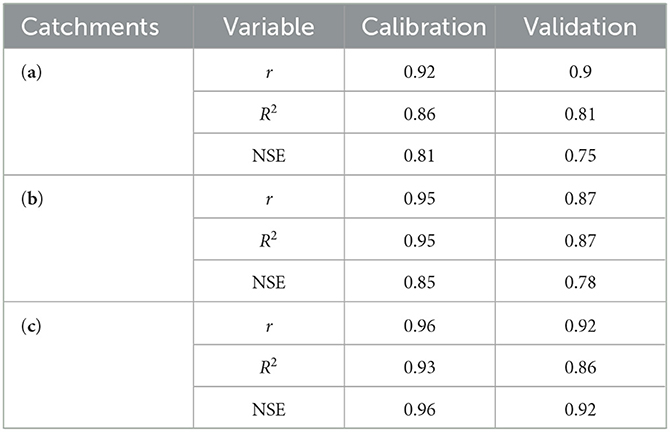
Table 3. Statistics used to evaluate the SWAT models' performances for the three catchments based on observed monthly discharges.
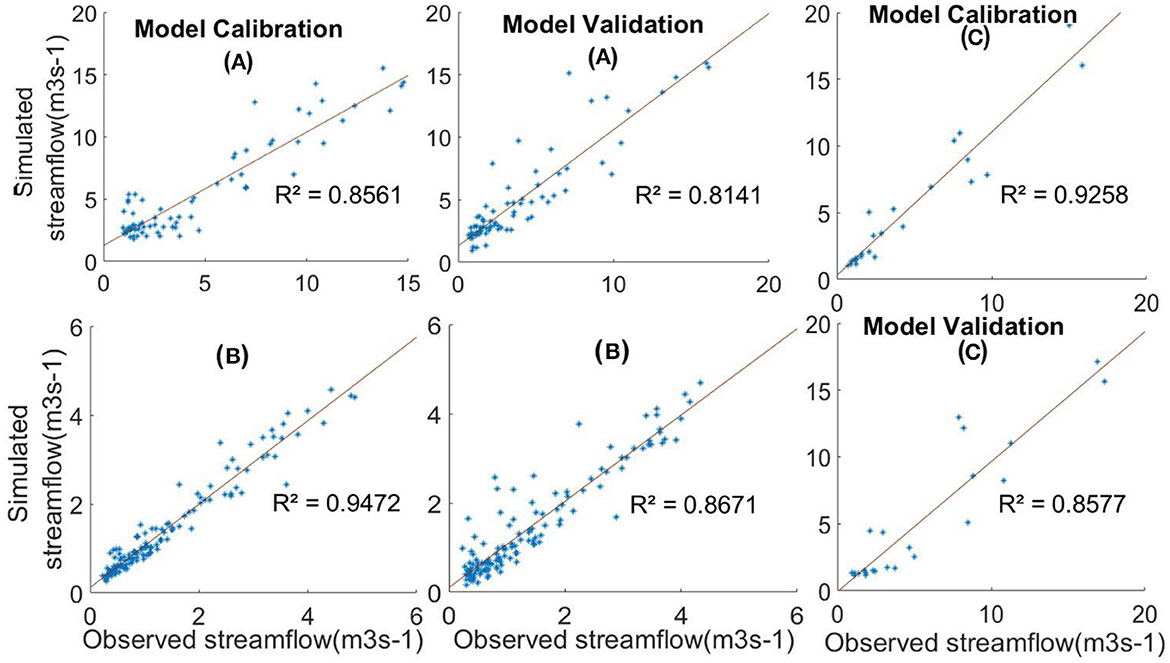
Figure 3. A comparison of observed and simulated monthly streamflow for catchments (A–C). The calibration periods were 1990 to 1995, 1990 to 2000, 2013 to 2014, and the validation periods were 1996 to 2001, 2001 to 2011, and 2015 to 2016 for the catchments (A–C), respectively.
3.2 Annual simulated discharge contributed by each catchment
In the Figure 4 below, all catchments were analyzed. The catchment (b) has the smallest amount of water available. In all of the simulated periods, the years 1996, 1999, and 2013 had very little water. On catchment (a), a high level of variability in stream flow was observed, as well as a significant contribution of water to the catchment (c).

Figure 4. The simulated discharge contributed by each catchment (m3s−1).
3.3 The effects of climate change on water resources
3.3.1 Variation of driving factors to climate change
Figure 5 depicts the seasonal and annual variation in precipitation under SSP119 and SSP585 in accordance with the IDW. Under the SSP119, annual precipitation increased more for all catchments. Under SSP119 and SSP585, the annual average increases in precipitation for the three catchments (a), (b), and (c) are 7.4% (0.7–14.5%) and 5.7% (−0.3 to 13%), respectively. The following year, all seasons showed different changes, especially in catchment (b) in the Issyk-Kul basin's north. The catchments (a) and (c) in the southeastern part of the lake showed slight similarities in precipitation change; all of the catchments' increase trend occurs in the spring (March to May), and the onset of decrease occurs in summer (June to August). For (a) and (c), a significant decrease occurs in autumn (September to November) and winter (December to February), whereas for the catchment (b), the rate of change tends to be negative in autumn under SSP585. Summer precipitation shows an upward trend in catchment (b) near Kungey Ala-Too Mountain, as well as catchments (a) and (c) near TeskeyAla-Too Mountain. Moreover, the catchment (b) shows less precipitation than the catchments (a) and (c).
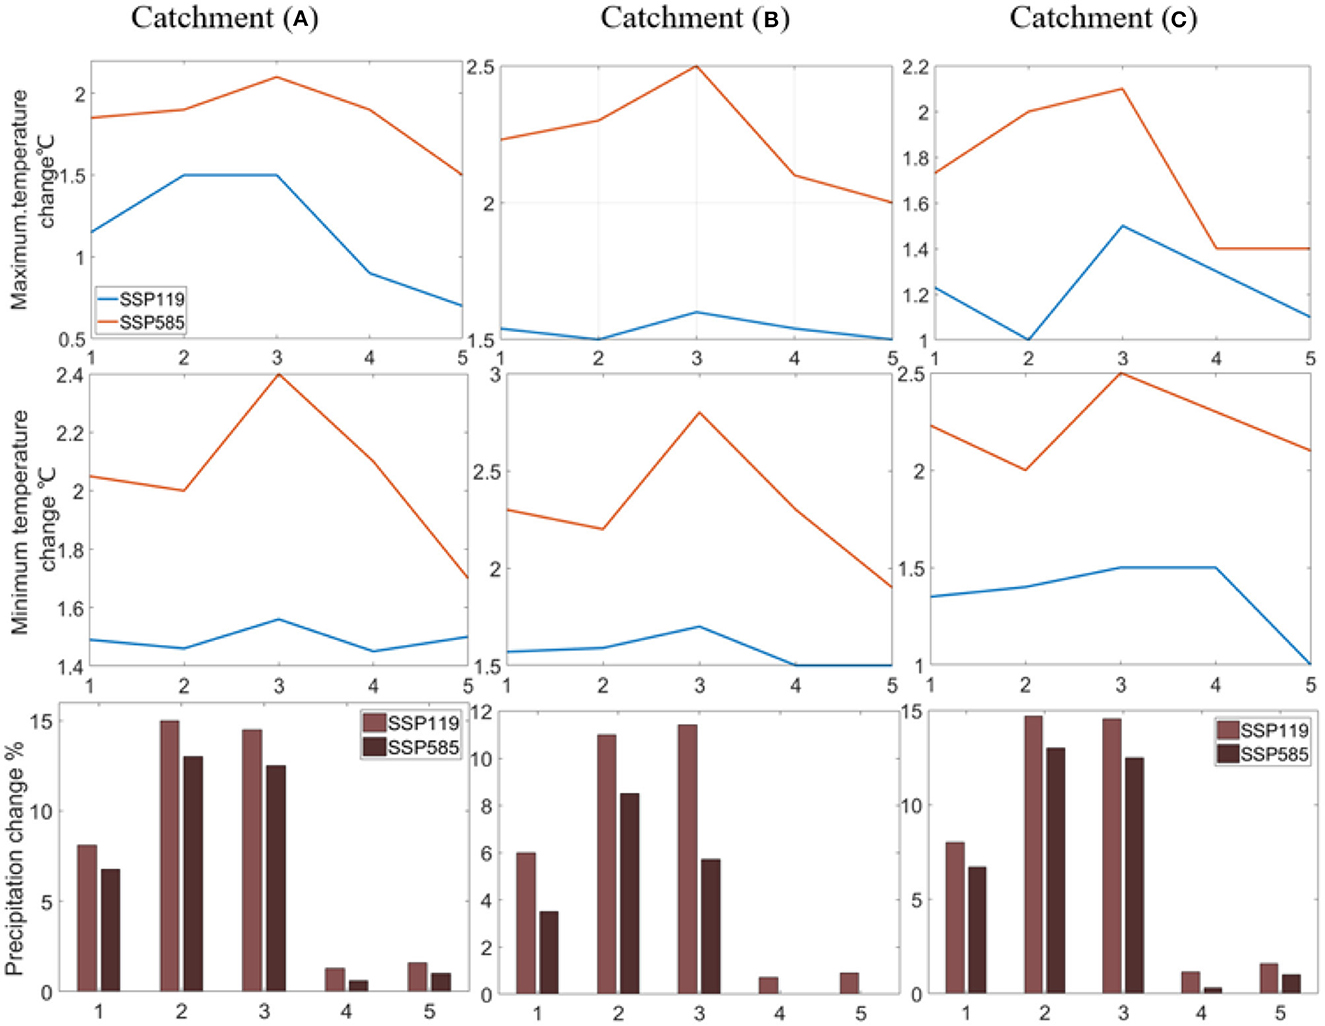
Figure 5. The projected maximum temperature, minimum temperature, and precipitation changes for the period 2020–2100 under SSP119 and SSP585 scenarios compared to the historical period (1988–2019) for the catchments (A–C). Vertically, the bars represent the range of changes calculated using various projected models, while horizontally, the annual average season are represented.
On annual and seasonal temperatures, the interpolated projections for the three catchments revealed a significant warmin g rate (Figure 7). Under SSP119, the average annual maximum temperature would rise by 1.38°C (1.35–1.5°C) and by 1.9°C (1.7–2°C) under SSP585. The minimum temperature rises more with an average annual minimum temperature of 1.5°C (1–1.5°C) under SSP119 and 2.1°C (1.9–2.2°C) under SSP585. In both scenarios, catchment (b) identified the most warming compared to (a) and (c), which experienced similar slight warming. The expected large warming is less than the maximum temperature, which under SSP585 for catchment (b) ranges from 1.9 to 2.1°C. Under the SSP119 for catchment (c), the minimum temperature ranges from 0.7 to 1.4°C. The results show that the highest warming will occur in the summer and minimum temperature in the winter. Because of the warming of the snow that accumulated over the winter and precipitation from the high mountains in the three catchments, discharge will be significant.
3.3.2 Simulated hydrological responses under climate change scenarios
3.3.2.1 Simulated discharge under climate change
Figure 6 depicts the results of annual and seasonal discharges through the three catchments studied. The combined effects of changes in precipitation and temperature were clarified under various future emission scenarios. In the three selected catchments, the total annual discharge increased as a result of climate change. Over all selected catchments, the annual average values are 10.6% (1.8–28%) for SSP119 and 8.1% (1.4–26%) for SSP585. The catchments (a) and (c) show slightly similar discharge, with spring being the highest percentile, followed by summer. Autumn and winter show very low water discharge, particularly in winter: 1.4, and 1.8% under SSP585 and SSP119, respectively. Under both scenarios, the declining trend in total discharge begins in the summer and ends in the winter for all selected catchments. The findings show that catchments will display water discharge as a function of precipitation and the temperature leading up to snowmelt.
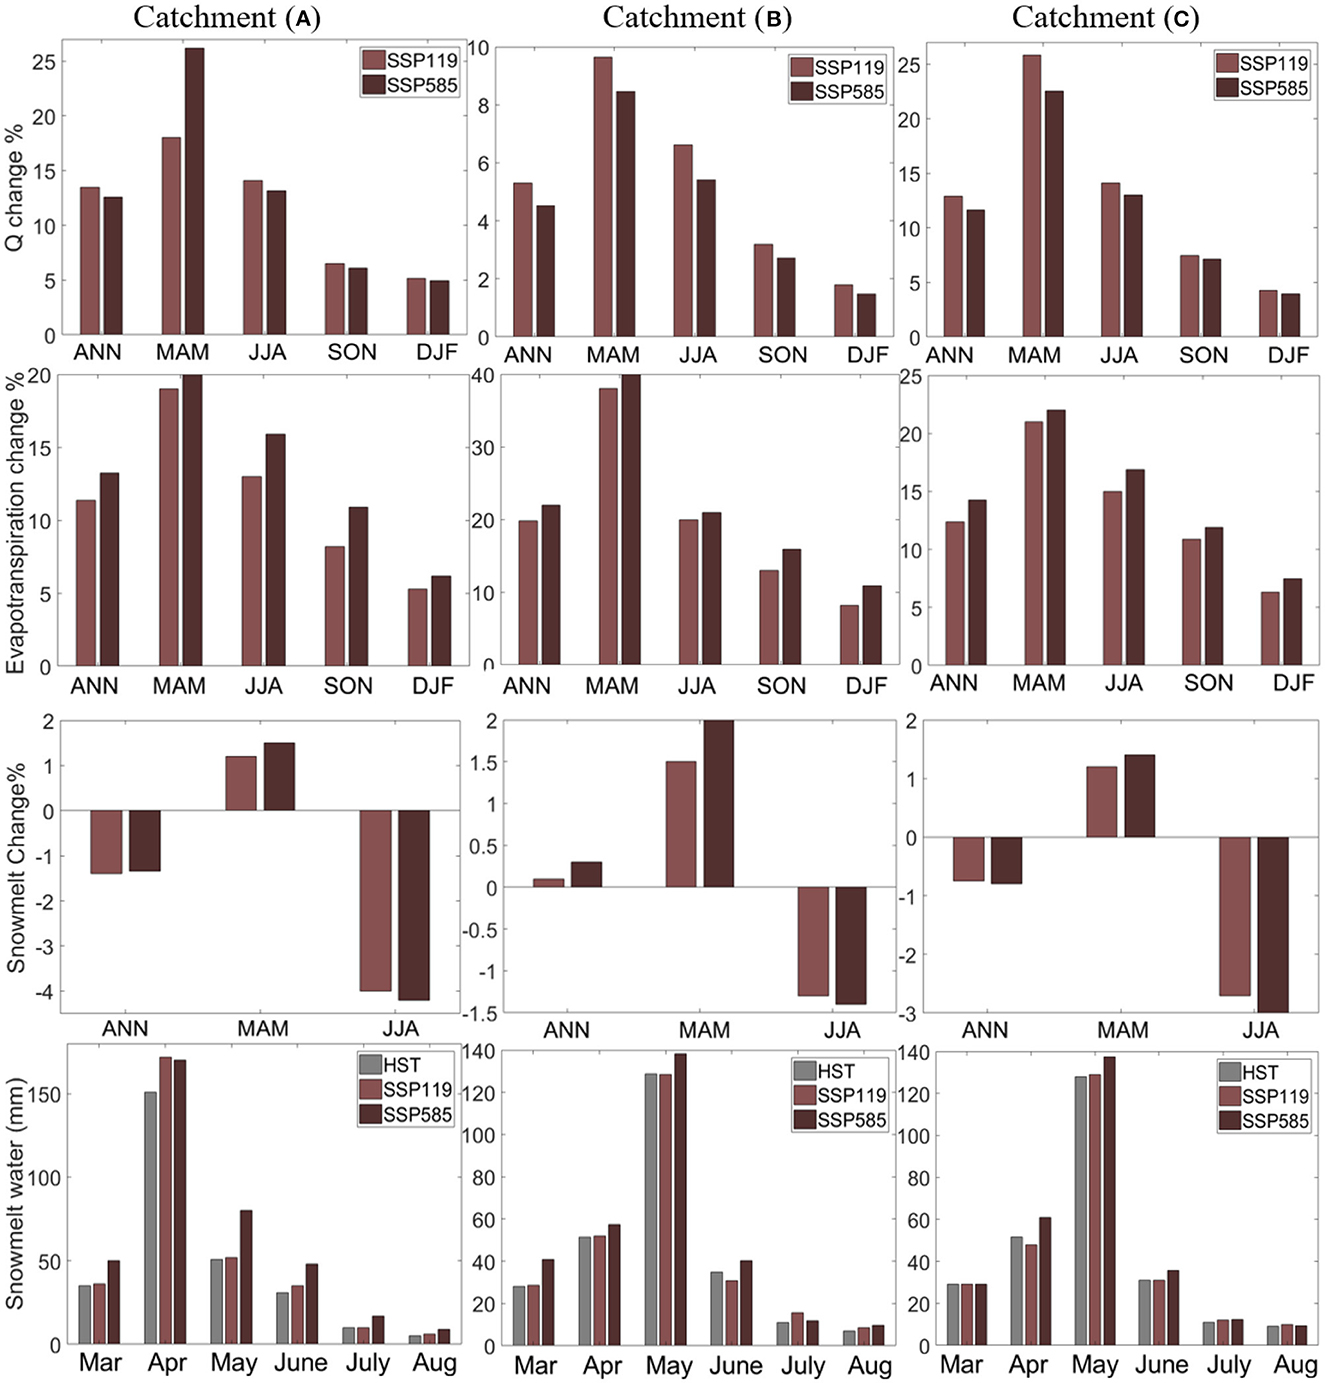
Figure 6. From right to left, are catchments (A–C). From top to bottom are the projected discharge change, evapotranspiration change, and snow melt change for the period 2020–2100 under SSP119 and SSP585 scenarios relating to the historical period (1988–2019) and the average snow melt for the three selected catchments (A–C) under historical SSP119 and SSP585 scenarios. Vertical bars represent the range of changes calculated by IDW. The X-axis of snow and ice-melt water is indicated in months, from March to August.
3.3.2.2 The differences in discharge under climate change
The total discharge change caused by climate change varies by catchment. In general, total discharge in catchments (a) and (c) will be significantly higher than in catchment (b). By 2020–2100, the average changes in water discharge for the catchments (a) and (c) are 13.2, 12.3, and 4.9% for the catchment (b).
3.3.2.3 Evapotranspiration change under climate change
The evapotranspiration response to projected climate change at annual and seasonal measures is increasing for all catchments (Figure 6). Under SSP119, the increasing trends range from 5.3 to 38%, while under SSP585, the increasing trends range from 6.2 to 40%, with an average value of 15.5% (11.38–21.95%). Under SSP585, the increase in evapotranspiration is more pronounced, which explains why these catchments have low precipitation (<14.5%) and high evapotranspiration (>13%) during the summer, especially catchment (b). During the summer, these two changes are expected to cause a drier condition in the catchments.
The melting of snow under SSP119 and SSP585 was investigated (Figure 6). For the catchments surrounding Issyk-Kul Lake and the basin itself, ice-snow melting is an essential resource of water. In this study, the highest increase in snowmelt water caused by ice-snow melting was observed in the spring. Snow and ice melt mainly in the spring and summer. Figure 6 depicts the snow and ice-melt water from March to August. The increasing trends were only revealed from March to May, with the snow and ice melting peak variations ranging from 0.5 to 2%. The high increase change occurred in catchment (b).
3.4 Statistical analyses in land use/cover change
3.4.1 Land-use land -cover changes in catchments
The LULC over the study area was analyzed for the periods (1992–2003) and (2003–2015) (Figure 7). In the different LULC classes, the analysis revealed a modification of small significant and large changes. Agriculture, bare area, forest, grassland, snow/ice, and sparse vegetation changes in catchment (a) from 1992 to 2003 were 0.96, −0.32, 7.71, −6.52, −1.87, and 0.03 km2, and from 2003 to 2015 were 1.45, 1.31, −9.91, 8.10, −1.89, and 0.12 km2, respectively. During both periods, there was no water in this catchment, and agriculture took over a large portion of the forest and grassland.
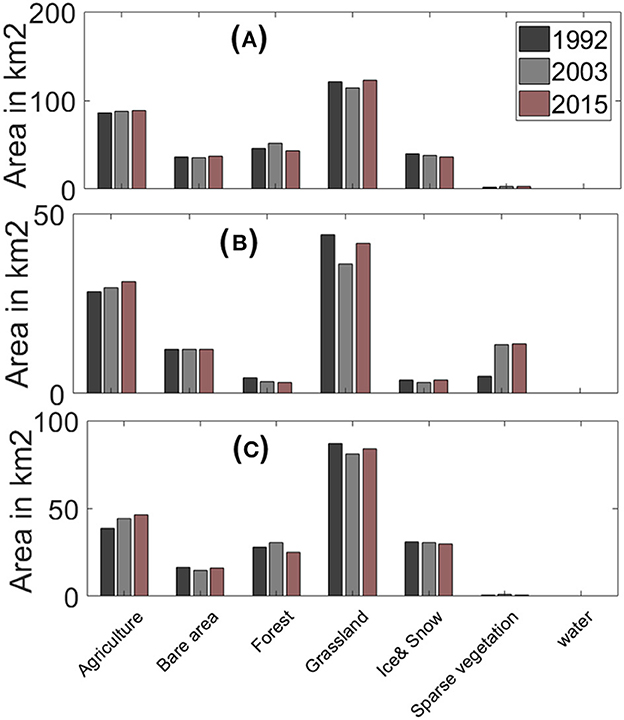
Figure 7. The total change in LULC for the catchments (A–C) from 1992 to 2015. The vertical bars represent area in square kilometers, while horizontal bars represent LULC class names.
From 1992 to 2003, the changes in the catchment (b) in LULC were 1.01, 0, −0.87, −8.27, −0.61, 8.69, and 0.04 km2, and from 2003 to 2015, they were 1.69, −0.05, 0.46, 5.76, 0.46, 0.33, and −0.09 km2 for Agriculture, Bare area, forest, grassland, Snow and ice, sparse vegetation and water, respectively. The bare area did not change from 1992 to 2003, while sparse vegetation indicated significant increase. During this period, sparse vegetation occupied large portion of grassland, whereas water occupied a small part for both periods.
From 1992 to 2003, the LULC changes of catchment (c) for Agriculture, Bare area, forest, grassland, Snow/ice and sparse vegetation were 5.6, −1.64, 2.39, −5.96, −0.59, 0.2 km2, and from 2003 to 2015, they were 1.94, 1.13, −5.40, 3.03, −0.68, −0.11 km2, respectively. Agriculture expanded in this catchment during both periods, occupying a large part of the forest and grassland, and there was no water.
3.4.2 Prediction of LULC for all the catchments
The LULC was predicted by regression analysis up to 2100 in the study, and the results were presented as percentage differences (Table 4). Agriculture will increase in all catchments; while the decrease in snow and ice will only affect the catchment (b). Furthermore, while there is no evidence of water on catchments (a) and (c), the water that was present on catchment (b) will vanish completely in 2100, replaced by agriculture.
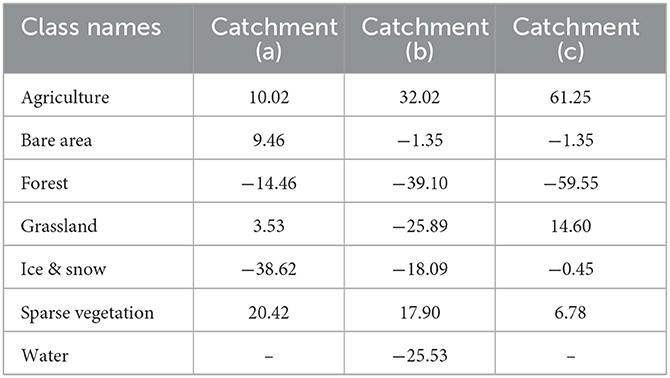
Table 4. Predicted percentages of LULC classes.
3.4.3 Land use and land cover change and its impact on stream flow
Due to good topography and the availability of water for irrigation, an increase in agriculture was seen downstream of the watersheds. Other land use classes showed changes as well, but in non-uniform patterns (increase and decrease) over the study period. Agriculture displayed one-of-a-kind behavior, with an increase ratio of 2.8, 9.5, and 19.5% in catchments (a), (b), and (c), respectively. We compared the total discharge due to LULC by introducing ratio changes of agriculture for the period 1992–2015 to indicate a changes in total discharge, using the results of the 1992 simulation as a baseline. Because each sub-basin has different characteristics of a hydrologic process due to different aspects, such as LULC, changes in water flow are visible.
The annual differences in total discharge due to agricultural changes for the period 1992–2015 indicate negative trends in all catchments studied (Figure 8). The future behavior of streamflow as a result of agricultural changes has not been computed.
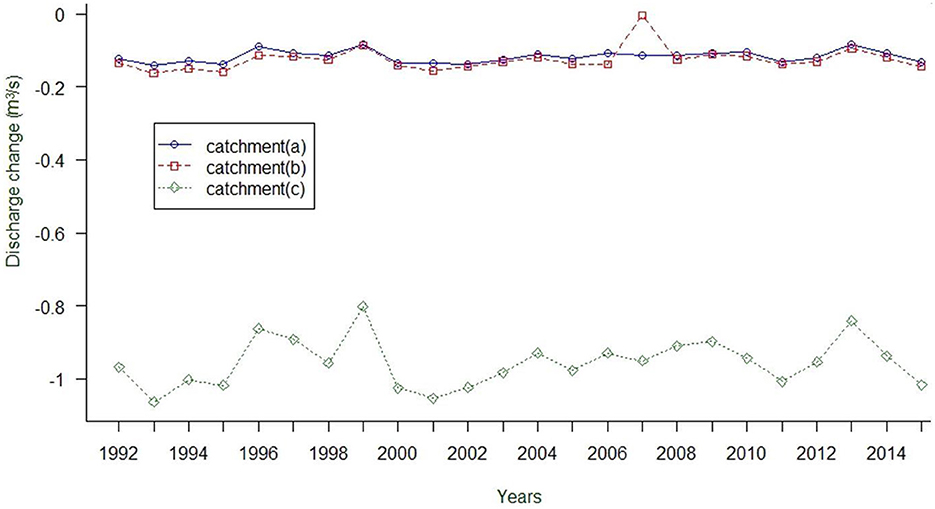
Figure 8. The average annual discharge changes under agriculture increases of catchments (a), (b), and (c).
4 Discussion
4.1 Spatiotemporal characteristics under climate change and sensitivity transformation
Climate change has a broad impact on Issyk-Kul water balance across the basin, with the variations visible in the catchments that feed the lake (Alifujiang et al., 2002; Shabunin and Shabunin, 2002). The lake is surrounded by many catchments (Savvaitova and Petr, 1992; Klerx and Imanackunov, 2002). However, based on the most densely populated areas and problematic issues (lack of observed discharge), three catchments were selected (Figure 1). The main source of water for the lake is the catchments around it (Wang et al., 2013; Guo et al., 2014), and the water barriers in the catchments to the lake have an indirect impact on the basin's water level. Overall, the climate effect of the three selected catchments around Issyk-Kul Lake shows significant spatiotemporal heterogeneities. With the exception of catchment (b), which showed significant temperature differences from the other two catchments, particularly in the summer and autumn, these catchments experienced significant climate warming and wetting (Figure 5). The lake, fed by glacier water and snowmelt, is obviously affected by temperature and precipitation. Our findings are consistent with those of Luo et al. (2018) and Uwamahoro et al. (2021), who recorded decreases in summer precipitation. The catchments (a) and (c), which receive water from the glacier melt on mountain peaks such as TeskeyAla-Too Mountain, have shown less warming than the catchment (b) in the basin's north, and this is in line with Uwamahoro et al. (2021), which has shown a temperature increase (Figure 5). The altitude and elevation differences and similarities reported by Lan et al. (2011) help to clarify this. This is also consistent with previous studies (Hu et al., 2014; Luo et al., 2019b), which suggest that temperature change will be more noticeable at higher altitudes and elevations. In high peaks, the average elevation of the two catchments (a) and (c) shows slight differences (Figure 1) and thus slight warming similarities (Figure 5), whereas the catchment (b), which is~200 m lower in elevation than the two catchments, is identified differently (Figures 1, 5). The effect of altitude on warming is less than that of elevation. Moreover, our results show that minimum temperatures are rising faster than maximum temperatures, confirming observations from the world's most terrestrial regions (Donat et al., 2013; Morak et al., 2013; Feng et al., 2018). Increased vapor and aerosol content in the air is expected to allow for greater changes in minimum temperature than in maximum (Ma et al., 2013). This can influence specific outcomes according to regional and local factors.
This analysis reveals that the selected catchments experienced a strong increase in total discharge under the SSP119 scenarios and slight increase in total discharge under the SSP585 scenarios (Figure 6). Because temperature influences not only the form of precipitation but also the volume of snowmelt water in the catchments around the Issyk-Kul basin, the overall runoff is more vulnerable to rising temperatures than rising precipitation. The same situation has been observed in other catchments, such as alpine catchments in Karakoram (Liu et al., 2017a). In fact, for all the catchments (a), (b), and (c), the increases in temperature and precipitation result in an increase in total discharge under SSP119 and SSP585 (Figures 5, 6). Under SSP585, however, when the temperature rises to a very high level, the total discharge decreases (Figures 5, 6). This is in line with some studies that found a significant decrease in total discharge in some watersheds, such as Kaidu catchment in Xinjiang (Fang et al., 2015) and Athabasca catchment in Canada (Shrestha et al., 2017). The findings revealed that the rise in discharges in the study area is not sustainable. If the temperature continues to rise, the total discharge will be reduced in the future, as predicted by Fang et al. (2015). According to our results, critical temperatures exist under SSP585 for the catchments surrounding Issyk-Kul Lake. Therefore, temperature changes always have a negative impact on total discharge in catchments throughout the basin.
4.2 Variations in the impact of climate change caused by the differences in catchment characteristics
Climate change has different impacts on the overall discharge in each of the three catchments. In general, the two catchments located to the southeast of Issyk-Kul Lake would undergo greater changes in overall discharge than the catchment to the north. Under SSP119 scenario, the average variations in total discharge by 2020–2100 are 13.5, 5, and 12% for catchments (a), (b) and (c), respectively (Figure 6). These differences can be qualified depending on the location and area. The result revealed that small low-lying catchments are less vulnerable to climate change. This is demonstrated by the fact that catchment (b) has smaller average discharge changes (5%) than catchment (a) (13.5%), which is located to the Southeast near Teskey Ala-Too with the highest peak. Differences in elevation and surface area result in changes in the southeastern catchments. Our result is consistent with previous studies reported that high alpine catchments would experience the greatest hydrological changes due to the important role of glacier and snow in the water balance (Nijssen et al., 2001; Beniston et al., 2003; Lan et al., 2011).
Sensitivities were observed in the two catchments as a result of precipitation and temperature variations. The findings suggest that the slope aspect of a catchment can influence its response to climate change. In our study, the windward sloping catchments of the highest peak of Teskey Ala-Too and Kungey Ala-Too are more sensitive to climate change than the downwind sloping catchments, probably because of water vapor source, land cover, and other factors (Luo et al., 2019b). SSP119 and SSP585 both showed a downward trend in snow melt from June to August (Figure 6). This was due to the catchments' differing elevations and temperatures. Under SSP119 and SSP585, evapotranspiration is proportional to precipitation and temperature increases (Figures 5, 6). For the three catchments, the reaction of evapotranspiration in discharge changes is greater compared to those in precipitation.
4.3 Land use/cover under human activities and climate change
A historical Markov analysis of the change in LULC over the study region for the periods (1992–2003) and (2003–2015) revealed minor and major changes in LULC in three watersheds (Figure 7). Agriculture showed an increasing trend in catchments over time, with the exception for catchment (b) in the north of the Lake, which showed a decline during the periods (1992 to −2003) and (2003–2015). The big part of agriculture expanded to grasslands. Agriculture was located at a lower elevation in the catchments, and cultivation was one of the major reasons for this expansion, especially in the area near Karakol City. Furthermore, irrigation is deliberately necessary for agriculture in these areas (Alymkulova et al., 2016). Previous studies have found that water use decreased between 1990 and 2014 (Alifujiang et al., 2002). During 1980–1989, 1990–1999, and 2000–2014, agriculture water use decreased from 2029 × 106 m3yr−1 to 981 × 106 m3yr−1 and 461 × 106 m3yr−1, respectively. Human activities, such as agricultural irrigation, land use, and water-soil conservation, have transformed the spatial and temporal distribution of water resources, indirectly affecting the hydrological processes of the basins (Dong et al., 2016; Wu et al., 2017).
In general, the results showed that agriculture area increased in our study due to population food needs. For all periods in Southeast, downward changes were mainly in snow and ice, whereas the catchment (b) showed a very slight increase in snow and ice for all periods (Figure 7). Furthermore, when water leaves mountain outlets, runoff is significantly affected by anthropogenic activities, particularly agriculture that requires irrigation. Our results clearly demonstrated that the little runoff has LULC changes impacts, which is consistent with the findings of other researchers (Li and Wang, 2009). The results of this study revealed that catchment (c) had the greatest change in total discharge, especially in 1993 (−1.06 m3/s) and 2001 (−1.05 m3/s), and catchment (b) had the smallest change (−0.005 m3/s) in 2007. The results revealed that water consumption for irrigation is higher in catchment (c) than in catchments (a) and (b) due to increase in proportion of people engaged in agriculture in Karakol City (Figure 8). In comparison to the northern catchment, the southeast catchments (a) and (c) of the basin appear to have a large decrease in total discharge.
Predictions for the period 2015–2100 revealed an increase and decrease in the percentiles of LULC classes in this study (Table 4). Agriculture experienced the greatest increase, followed by bare land, with the exception of catchment (c) in the southeast of the basin. Forest had the highest decreasing percentiles (−59%), followed by grassland (−25.89%). The study of land cover changes revealed a high increase (61.25%) in agriculture on catchment (c), which is due to human activities of the population near the catchments.
4.4 Climate change and anthropogenic activities on streamflow
In hydrological science, the assessment of climate change and human activities is a critical issue. However, because of the use of different techniques (parameters) and reference periods, different locations have different impacts (Liu et al., 2020). With respect to this declaration, the catchment to the north of the lake had less human influence than the catchments to the south-east. In comparison to the two Southeast catchments, the catchment (c) showed the greatest impact of human activities. From region to region, the nuanced significance of climate and human impacts varies (Liu et al., 2017b). Similarly, when hydrological components were compared, the water discharge in catchment (b) was lower than in catchments (a) and (c). This obviously leads to the conclusion that, compared to human activities, climate change has a greater impact on the selected catchments and greatly affects Lake Issyk-Kul. This agrees with Alifujiang, Abuduwaili (Alifujiang et al., 2017), who concluded that climate change was the main factor disturbing the Issyk-Kul Lake's water levels. Similar to Cheng et al. (2016) argued that climate change was the main contributor to the reduction in runoff, accounting for 64% of the change in runoff. Topography and land use land cover change influence the discharge in catchments (de Magalhães et al., 2022; Zhang et al., 2022). Discharge on catchment c was smaller because of its physical characteristics indicated by its topography and LULC indicated by a considerable amount of impermeable which lowered infiltration and a more regulated runoff. Thus, leading to a smaller relative change in discharge.
5 Conclusions
This study assessed the impact of climate change and human activities on the three selected catchments around Issyk-Kul Lake using the SSP119 and SSP585 emission scenarios. According to the scenarios, the total discharge of the three catchments showed an overall increasing trend (1.48–28.02%). Sensitivities to climate change and human impacts on the Issyk-Kul Lake are highly dependent on the surface area, elevation, and slope behavior of the catchments. The SWAT model performed well, and model discharge calculations for catchments (a), (b), and (c) were compared to observed discharge from the corresponding gauging stations. The model showed similar changes in precipitation over the two catchments (a) and (c) under the SSP119 and SSP585 scenarios, as well as slight changes over the catchment (b). The warming projection change for the three catchments revealed a significant warming rate for annual and seasonal temperatures (1.35–2.1°C). As the temperature increases, the catchments (a) and (c) that receive water from the glacier melt of mountain peaks such as TeskeyAla-Too Mountain have shown less warming compared to the catchment (b) located in the basin's north. This can be clarified by the differences and similarities in altitude and elevation. Evapotranspiration increases by (5.3–40%), positive climate change impacts occur during spring snowmelt, while negative impacts (−1.3 to −4.5%) are expected for summer snowmelt for all catchments. The increase in agriculture reduced the catchment's streamflow (−0.005 to −1.06 m3/s). In general, depending on the location of the catchments, water resource sustainability is unreliable. Land policy and climate change mitigation are both needed, according to the scenarios Studied.
Data availability statement
The original contributions presented in the study are included in the article/supplementary material, further inquiries can be directed to the corresponding author.
Author contributions
SU: Methodology, Writing – original draft, Writing – review & editing. TL: Funding acquisition, Writing – original draft, Supervision. VN: Conceptualization, Software, Writing – review & editing. ZL: Validation, Writing – original draft. AU: Conceptualization, Writing – original draft. AM: Conceptualization, Writing – original draft, Writing – review & editing. PK: Conceptualization, Writing – review & editing. AG: Conceptualization, Writing – original draft. BA: Resources, Writing – original draft. FA: Conceptualization, Writing – original draft.
Funding
The author(s) declare financial support was received for the research, authorship, and/or publication of this article. This study was supported by the K. C. Wong Education Foundation (Grant No. GJTD-2020-14), the Provincial Key Program of Research and Development (Grand No. 2022B03021), the Key Program of National Natural Science Foundation of China (Grant No. 42230708), the Third Xinjiang Scientific Expedition Program (Grant No. 2021XJKK1400/2022xjkk0700), and the Tianshan Talent Training Program of Xinjiang Uygur Autonomous region (Grant No. 2022TSYCLJ0011).
Acknowledgments
Authors acknowledge the United States Geological Survey and the NASA team, the ESA CCI Land Cover project, the Food and Agriculture Organization (FAO), the Meteorological Service of Canada (MSC) for providing the necessary data. We also thank the World Climate Research Program coupled modeling working group for the production and provision of their model output for the completion this project. In addition, the authors would like to thank the Chinese government, the Xinjiang Institute of Ecology and Geography and the University of the Chinese Academy of Sciences (UCAS) for their financial assistance and laboratory facilities. Special acknowledgment goes to China-Pakistan Joint Research Center on Earth Sciences, which supported the implementation of this study.
Conflict of interest
The authors declare that the research was conducted in the absence of any commercial or financial relationships that could be construed as a potential conflict of interest.
Publisher's note
All claims expressed in this article are solely those of the authors and do not necessarily represent those of their affiliated organizations, or those of the publisher, the editors and the reviewers. Any product that may be evaluated in this article, or claim that may be made by its manufacturer, is not guaranteed or endorsed by the publisher.
References
Aaviksoo, K. (1995). Simulating vegetation dynamics and land use in a mire landscape using a Markov model. Landsc. Urban Plan. 31, 129–142. doi: 10.1016/0169-2046(94)01045-A
Abbaspour, K. C., Yang, J., Maximov, I., Siber, R., Bogner, K., and Mieleitner, J., et al. (2007). Modelling hydrology and water quality in the pre-alpine/alpine Thur watershed using SWAT. J. Hydrol. 333, 413–430. doi: 10.1016/j.jhydrol.2006.09.014
Adelodun, B., Ahmad, M. J., Odey, G., Adeyi, Q., and Choi, K. S. (2023). Performance-Based evaluation of CMIP5 and CMIP6 global climate models and their multi-model ensembles to simulate and project seasonal and annual climate variables in the Chungcheong region of South Korea. Atmosphere 14:1569. doi: 10.3390/atmos14101569
Akiner, S. (2016). Kyrgyzstan 2010: Conflict and Context. 2016: Central Asia. Sweden: Caucasus Institute.
Alifujiang, Y., Abuduwaili, J., Groll, M., and Issanova, G. (2002). Changes in intra-annual runoff and its response to climate variability and anthropogenic activity in the Lake Issyk-Kul Basin, Kyrgyzstan. Catena 198:104974. doi: 10.1016/j.catena.2020.104974
Alifujiang, Y., Abuduwaili, J., Ma, L., Samat, A., and Groll, M. (2017). System dynamics modeling of water level variations of Lake Issyk-Kul, Kyrgyzstan. Water 9:989. doi: 10.3390/w9120989
Alifujiang, Y., Abuduwaili, J., Maihemuti, B., Emin, B., and Groll, M. (2020). Innovative trend analysis of precipitation in the Lake Issyk-Kul Basin, Kyrgyzstan. Atmosphere 11:332. doi: 10.3390/atmos11040332
Alymkulova, B., Abuduwaili, J., Issanova, G., and Nahayo, L. (2016). Consideration of water uses for its sustainable management, the case of Issyk-Kul Lake, Kyrgyzstan. Water 8:298. doi: 10.3390/w8070298
Arnell, N. W., and Gosling, S. N. (2013). The impacts of climate change on river flow regimes at the global scale. J. Hydrol. 486, 351–364. doi: 10.1016/j.jhydrol.2013.02.010
Baker, T. J., and Miller, S. N. (2013). Using the Soil and Water Assessment Tool (SWAT) to assess land use impact on water resources in an East African watershed. J. Hydrol. 486, 100–111. doi: 10.1016/j.jhydrol.2013.01.041
Beniston, M., Keller, F., and Goyette, S. (2003). Snow pack in the Swiss Alps under changing climatic conditions: an empirical approach for climate impacts studies. Theor. Appl. Climatol. 74, 19–31. doi: 10.1007/s00704-002-0709-1
Bocco, G., and Riemann, H. (1997). Quality assessment of polygon labeling. Photogramm. Eng. Remote Sens. 63, 393–395.
Chae, S. T., Chung, E.-S., and Jiang, J. (2022). Robust siting of permeable pavement in highly urbanized watersheds considering climate change using a combination of fuzzy-TOPSIS and the VIKOR method. Water Resour. Manag. 36, 951–969. doi: 10.1007/s11269-022-03062-y
Cheng, J. X., Xu, L. G., Tan, Z. Q., Yu, Q. W., and Fan, H. X., et al. (2016). The research of runoff responses to climate change and human activities in the Dongting Lake catchment. J. Agro Environ. Sci. 35, 2146–2153.
Chokkavarapu, N., and Mandla, V. R. (2019). Comparative study of GCMs, RCMs, downscaling and hydrological models: a review toward future climate change impact estimation. SN Appl. Sci. 1:1698. doi: 10.1007/s42452-019-1764-x
Cousino, L. K., Becker, R. H., and Zmijewski, K. A. (2015). Modeling the effects of climate change on water, sediment, and nutrient yields from the Maumee River watershed. J. Hydrol. 4, 762–775. doi: 10.1016/j.ejrh.2015.06.017
de Magalhães, S. F. C., de Moura Barboza, C. A., Mai, M. B., and Molisani, M., M. (2022). Influence of land cover, catchment morphometry and rainfall on water quality and material transport of headwaters and low-order streams of a tropical mountainous watershed. Catena 213:106137. doi: 10.1016/j.catena.2022.106137
Donat, M., Alexander, L. V., Yang, H., Durre, I., Vose, R., Dunn, R. J. H., et al. (2013). Updated analyses of temperature and precipitation extreme indices since the beginning of the twentieth century: The HadEX2 dataset. J. Geophys. Res. 118, 2098–2118. doi: 10.1002/jgrd.50150
Dong, X., Wang, Y., Ding, Y., Wang, C., Sun, H., Qin, X., et al. (2016). “Assessment of impact of unbalancing power allocation on calculating maximum loading point,” in 2016 IEEE PES Asia-Pacific Power and Energy Engineering Conference (APPEEC) (New York, NY: IEEE).
Duan, Y., Liu, T., Meng, F., Yuan, Y., Luo, M., Huang, Y., et al. (2020). Accurate simulation of ice and snow runoff for the mountainous terrain of the kunlun mountains, China. Remote Sens. 12:179. doi: 10.3390/rs12010179
Dusini, D. S., Zeng, G., Liang, J., Huang, L., Hua, S., and Li, F. (2009). The effect of Lake Erie water level variations on sediment resuspension. J. Great Lakes Res. 35, 1–12. doi: 10.1016/j.jglr.2008.04.001
Eyring, V., Bony, S., Meehl, G. A., Senior, C. A., Stevens, B., Stouffer, T. J., et al. (2016). Overview of the Coupled Model Intercomparison Project Phase 6 (CMIP6) experimental design and organization. Geosci. Model Dev. 9, 1937–1958. doi: 10.5194/gmd-9-1937-2016
Fang, G., Yang, J., Chen, Y., Zhang, S., Deng, H., Liu, H., et al. (2015). Climate change impact on the hydrology of a typical watershed in the Tianshan Mountains. Adv. Meteorol. 2015:960471. doi: 10.1155/2015/960471
Feng, R., Yu, R., Zheng, H., and Gan, M. (2018). Spatial and temporal variations in extreme temperature in Central Asia. Int. J. Climatol. 38, e388–e400. doi: 10.1002/joc.5379
Ferronskii, V., Polyakov, V. A., Brezgunov, V. S., Vlasova, L. S., Karpychev, Y. A., Bobkov, A. F., et al. (2003). Variations in the hydrological regime of Kara-Bogaz-Gol Gulf, Lake Issyk-Kul, and the Aral Sea assessed based on data of bottom sediment studies. Water Resour. 30, 252–259. doi: 10.1023/A:1023826011601
Fontaine, T., Klassen, J. F., Cruickshank, T. S., and Hotchkiss, R. H. (2001). Hydrological response to climate change in the Black Hills of South Dakota, U. S. A. Hydrol. Sci. J. 46, 27–40. doi: 10.1080/02626660109492798
Gao, Y., Sarker, S., Sarker, T., and Olkeba Tolessa, L., et al. (2022). Analyzing the critical locations in response of constructed and planned dams on the Mekong River Basin for environmental integrity. Environ. Res. Commun. 4:101001. doi: 10.1088/2515-7620/ac9459
Gholami, H., Lotfirad, M., Mohammad Ashrafi, S., Mostafa Biazar, S., and Singh, V. P., et al. (2023). Multi-GCM ensemble model for reduction of uncertainty in runoff projections. Stoch. Environ. Res. Risk Assess. 37, 953–964. doi: 10.1007/s00477-022-02311-1
Grusson, Y., Sun, X., Gascoin, S., Sauvage, S., Raghavan, S., Anctil, F., et al. (2015). Assessing the capability of the SWAT model to simulate snow, snow melt and streamflow dynamics over an alpine watershed. J. Hydrol. 531, 574–588. doi: 10.1016/j.jhydrol.2015.10.070
Guo, Y., Li, Z., Amo-Boateng, M., Deng, P., and Huang, P. (2014). Quantitative assessment of the impact of climate variability and human activities on runoff changes for the upper reaches of Weihe River. Stoch. Environ. Res. Risk Assess. 28, 333–346. doi: 10.1007/s00477-013-0752-8
Hamed, M. M., Nashwan, M. S., and Shahid, J. (2022). A novel selection method of CMIP6 GCMs for robust climate projection. Int. J. Climatol. 42, 4258–4272. doi: 10.1002/joc.7461
Honings, J. (2018). Modeling Climate Change Impacts on Water Balance Components of the Mackinaw River Watershed, Central Illinois. Ann Arbor: ProQuest LLC.
Hu, Z., Zhang, C., Hu, Q., and Tian, H. (2014). Temperature changes in Central Asia from 1979 to 2011 based on multiple datasets. J. Clim. 27, 1143–1167. doi: 10.1175/JCLI-D-13-00064.1
Huerta, A., Aybar, C., Imfeld, N., Correa, K., Felipe-Obando, O., Rau, P., et al. (2023). High-resolution grids of daily air temperature for Peru-the new PISCOt v1. 2 dataset. Sci. Data 10:847. doi: 10.1038/s41597-023-02777-w
Jha, M., Arnold, J. G., Gassman, P. W., Giorgi, F., and Gu, R. R. (2006). Climate change sensitivity assessment on upper Mississippi river basin streamflows using SWAT 1. J. Am. Water Resour. Assoc. 42, 997–1015. doi: 10.1111/j.1752-1688.2006.tb04510.x
Juahir, H., Zain, S. M., Aris, A. Z., Yusof, M. K., Samah, M. A. A., and Mokhtar, M. B. (2010). Hydrological trend analysis due to land use changes at Langat River Basin. Environ. Asia 3, 20–31.
Kaini, S., Nepal, S., Pradhananga, S., Gardner, T., and Sharma, A. K., et al. (2020). Representative general circulation models selection and downscaling of climate data for the transboundary Koshi river basin in China and Nepal. Int. J. Climatol. 40, 4131–4149. doi: 10.1002/joc.6447
Kembayev, Z. (2020). Development of China–Kazakhstan cooperation: building the silk road of the twenty-first century? Probl. Post Commun. 67, 204–216. doi: 10.1080/10758216.2018.1545590
Klerx, J., and Imanackunov, B. (2002). Lake Issyk-Kul: Its Natural Environment. New York, NY: Springer Science & Business Media.
Lan, Y. C., Zhong, Y. J., Wu, S. F., Shen, Y. P., Wang, G. Y., La, C. F., et al. (2011). Response of mountain runoff to climate change in representative rivers originated from the Tianshan Mountain. J. Desert Research. 31, 254–260.
Lee, E., and Mah, J. S. (2020). Industrial policy, industrialization and economic development of Kyrgyzstan. Asian Soc. Sci. 16. doi: 10.5539/ass.v16n9p41
Lee, T., Galavi, S. H., and Huang, Y. F. (2014). Uncertainty in climate change impact studies: a general picture. Int J Clim Chang Impacts Responses 6. doi: 10.18848/1835-7156/CGP/v06i01/37215
Li, Y., and Wang, C. (2009). Impacts of urbanization on surface runoff of the Dardenne Creek watershed, St. Charles County, Missouri. Phys. Geogr. 30, 556–573. doi: 10.2747/0272-3646.30.6.556
Lima, C. H., Kwon, H. H., and Kim, Y.-T. (2021). A Bayesian Kriging model applied for spatial downscaling of daily rainfall from GCMs. J. Hydrol. 597:126095. doi: 10.1016/j.jhydrol.2021.126095
Liu, J., Luo, M., Liu, T., Bao, A., De Maeyer, P., Feng, X., et al. (2017a). Local climate change and the impacts on hydrological processes in an arid alpine catchment in Karakoram. Water 9:344. doi: 10.3390/w9050344
Liu, J., Zhang, Q., Zhang, Y., Chen, X., Li, J., Aryal, S. K., et al. (2017b). Deducing climatic elasticity to assess projected climate change impacts on streamflow change across China. J. Geophys. Res. 122, 10.228–10.245. doi: 10.1002/2017JD026701
Liu, Y., Zhuo, L., Pregnolato, M., and Han, D. (2022). An assessment of statistical interpolation methods suited for gridded rainfall datasets. Int. J. Climatol. 42, 2754–2772. doi: 10.1002/joc.7389
Liu, Z., Cuo, L., Li, Q., Liu, X., Ma, X., Liang, L., et al. (2020). Impacts of climate change and land use/cover change on streamflow in Beichuan River Basin in Qinghai Province, China. Water 12:1198. doi: 10.3390/w12041198
Logofet, D. O., and Lesnaya, E. V. (2000). The mathematics of Markov models: what Markov chains can really predict in forest successions. Ecol. Modell. 126, 285–298. doi: 10.1016/S0304-3800(00)00269-6
López, E., Bocco, G., Mendoza, M., and Duhau, E. (2001). Predicting land-cover and land-use change in the urban fringe: a case in Morelia city, Mexico. Landsc. Urban Plan. 55, 271–285. doi: 10.1016/S0169-2046(01)00160-8
Luenberger, D. G. (1979). Introduction to Dynamic Systems; Theory, Models, and Applications. Hoboken, NJ: Wiley.
Luo, M., Liu, T., Frankl, A., Duan, Y., Meng, F., Bao, A., et al. (2018). Defining spatiotemporal characteristics of climate change trends from downscaled GCMs ensembles: how climate change reacts in Xinjiang, China. Int. J. Climatol. 38, 2538–2553. doi: 10.1002/joc.5425
Luo, M., Liu, T., Meng, F., Duan, Y., Bao, A., Frankl, A., et al. (2019a). Spatiotemporal characteristics of future changes in precipitation and temperature in Central Asia. Int. J. Climatol. 39, 1571–1588. doi: 10.1002/joc.5901
Luo, M., Liu, T., Meng, F., Duan, Y., Bao, A., Xing, W., et al. (2019b). Identifying climate change impacts on water resources in Xinjiang, China. Sci. Total Environ. 676, 613–626. doi: 10.1016/j.scitotenv.2019.04.297
Ma, Y., Wang, H., Cheng, B., Shen, J., Li, H., Guo, Y., et al. (2013). Changes in daily climate extremes in the arid area of northwestern China. Theor. Appl. Climatol. 112, 15–28. doi: 10.1007/s00704-012-0698-7
Mahmoud, S. H., and Gan, T. Y. (2018). Impact of anthropogenic climate change and human activities on environment and ecosystem services in arid regions. Sci. Total Environ. 633, 1329–1344. doi: 10.1016/j.scitotenv.2018.03.290
Markovic, D., Carrizo, S. F., Kärcher, O., Walz, A., and David, J. N. W. (2014). Developing tailored climate change scenarios for hydrological impact assessments. J. Hydrol. 508, 307–321. doi: 10.1016/j.jhydrol.2013.11.001
Matuzeviciute, G. M., Abdykanova, A., Kume, S., Tabaldiev, S., and Nishiaki, Y. (2018). The effect of geographical margins on cereal grain size variation: case study for highlands of Kyrgyzstan. J. Archaeol. Sci. Rep. 20, 400–410. doi: 10.1016/j.jasrep.2018.04.037
Meng, Y., Cave, M., and Zhang, C. (2019). Comparison of methods for addressing the point-to-area data transformation to make data suitable for environmental, health and socio-economic studies. Sci. Total Environ. 689, 797–807. doi: 10.1016/j.scitotenv.2019.06.452
Mertz, O., Halsnæs, K., Olesen, J. E., and Rasmussen, K. (2009). Adaptation to climate change in developing countries. Environ. Manage. 43, 743–752. doi: 10.1007/s00267-008-9259-3
Morak, S., Hegerl, G. C., and Christidis, N. (2013). Detectable changes in the frequency of temperature extremes. J. Clim. 26, 1561–1574. doi: 10.1175/JCLI-D-11-00678.1
Nijssen, B., O'Donnell, G. M., Hamlet, A. F., and Lettenmaier, D. P. (2001). Hydrologic sensitivity of global rivers to climate change. Clim. Change 50, 143–175. doi: 10.1023/A:1010616428763
Prathom, C., and Champrasert, P. (2023). General circulation model downscaling using interpolation—machine learning model combination—case study: Thailand. Sustainability 15:9668. doi: 10.3390/su15129668
Propastin, P. (2013). “Assessment of climate and human induced disaster risk over shared water resources in the Balkhash Lake drainage basin,” in Climate Change and Disaster Risk Management, ed W. L. Filho (Berlin; Heidelberg; Dordrecht; New York City, NY: Springer), 41–54.
Qing, B. (2012). Projected changes in Asian summer monsoon in RCP scenarios of CMIP5. Atmos. Ocean. Sci. Lett. 5, 43–48. doi: 10.1080/16742834.2012.11446959
Riahi, K., van Vuuren, D. P., Kriegler, E., Edmonds, J., O'Neill, B., Fujimori, S., et al. (2017). The shared socioeconomic pathways and their energy, land use, and greenhouse gas emissions implications: an overview. Glob. Environ. Change 42, 153–168. doi: 10.1016/j.gloenvcha.2016.05.009
Rodrik, D. (2017). Growth Without Industrialization. Project Syndicate. Cambridge, MA: Harvard Universty. 10.
Romanovsky, V. (2002). Water Level Variations and Water Balance of Lake Issyk-Kul, in Lake Issyk-Kul: Its Natural Environment. New York, NY: Springer, 45–57.
Romanovsky, V. V., Tashbaeva, S., Crétaux, J. F., Calmant, S., and Drolon, V. (2013). The closed Lake Issyk-Kul as an indicator of global warming in Tien-Shan. Nat. Sci. 5:55076. doi: 10.4236/ns.2013.55076
Rovenskaya, E., Sedighi, E., Komendantova, N., Strelkovskii, N., Karabashov, N., Atakanov, N., et al. (2018). Industrial Development of Kyrgyzstan: Background. Guayaquil: International Trade Centre.
Sao, D., Kato, T., Tu, L. H., Thouk, P., Fitriyah, A., and Oeurng, C. (2020). Evaluation of different objective functions used in the SUFI-2 calibration process of SWAT-CUP on water balance analysis: a case study of the Pursat River Basin, Cambodia. Water 12:2901. doi: 10.3390/w12102901
Sarker, S. J. C. (2023). Separation of floodplain flow and bankfull discharge: application of 1D momentum equation solver and MIKE 21C. CivilEng 4, 933–948. doi: 10.3390/civileng4030050
Sarker, S. J. E. (2022). Fundamentals of climatology for engineers: lecture note. Eng 3, 573–595. doi: 10.3390/eng3040040
Savvaitova, K., and Petr, T. (1992). Lake Issyk-Kul, Kirgizia. Int. J. Salt Lake Res. 1, 21–46. doi: 10.1007/BF02904361
Shabunin, G., and Shabunin, A. (2002). “Climate and physical properties of water in Lake Issyk-Kul,” in Lake Issyk-Kul: Its Natural Environment, eds J. Klerkx and B. Imanackunov (Berlin; Heidelberg; Dordrecht; New York City, NY: Springer), 3–11.
Shrestha, N., Du, K. X., and Wang, J. (2017). Assessing climate change impacts on fresh water resources of the Athabasca River Basin, Canada. Sci. Total Environ. 601, 425–440. doi: 10.1016/j.scitotenv.2017.05.013
Singhal, A., Jaseem, M., Sarker, S., Prajappati, P., Singh, A., and Jha, S. K. (2023). Identifying potential locations of hydrologic monitoring stations based on topographical and hydrological information. Water Resource Manage. 38, 369–384. doi: 10.1007/s11269-023-03675-x
Standen, J. C., Spencer, J., Lee, G. W., Van Buskirk, J., Matthews, V., Hanigan, I., et al. (2022). Aboriginal population and climate change in Australia: implications for health and adaptation planning. Int. J. Environ. Res. Public Health. 19:7502. doi: 10.3390/ijerph19127502
Steele-Dunne, S., Lynch, P., McGrath, R., Semmler, T., Wang, S., Hanafin, J., et al. (2008). The impacts of climate change on hydrology in Ireland. J. Hydrol. 356, 28–45. doi: 10.1016/j.jhydrol.2008.03.025
Stone, M. C., Hotchkiss, R. H., Hubbard, C. M., Fontaine, T. A., Mearns, L. O., Arnold, J. G., et al. (2001). Impacts of climate change on Missouri rwer basin water yield 1. J. Am. Water Resour. Assoc. 37, 1119–1129. doi: 10.1111/j.1752-1688.2001.tb03626.x
Su, B., van Vuuren, D. P., Kriegler, E., Edmonds, J., O'Neill, B. C., Fujimori, S., et al. (2002). Insight from CMIP6 SSP-RCP scenarios for future drought characteristics in China. Atmosph. Res. 2020:105375. doi: 10.1016/j.atmosres.2020.105375
Tan, J., Xie, X., Zuo, J., Xing, X., Liu, B., Xia, Q., et al. (2021). Coupling random forest and inverse distance weighting to generate climate surfaces of precipitation and temperature with multiple-covariates. J. Hydrol. 598:126270. doi: 10.1016/j.jhydrol.2021.126270
Tokarska, K. B., Stolpe, M. B., Sippel, S., Fischer, E. M., Smith, C. J., et al. (2020). Past warming trend constrains future warming in CMIP6 models. Sci. Adv. 6:eaaz9549. doi: 10.1126/sciadv.aaz9549
uulu Salamat, A., Abuduwaili, J., and Shaidyldaeva, N. (2015). Impact of climate change on water level fluctuation of Issyk-Kul Lake. Arab. J. Geosciences. 8, 5361–5371. doi: 10.1007/s12517-014-1516-6
Uwamahoro, S., Liu, T., Nzabarinda, V., Habumugisha, J. M., Habumugisha, T., Harerimana, B., et al. (2021). Modifications to snow-melting and flooding processes in the hydrological model—a case study in Issyk-Kul, Kyrgyzstan. Atmosphere 12:1580. doi: 10.3390/atmos12121580
Verstappen, H. T., Zuidam, R. A., Meijerink, A. M. J., and Nossin, J. J. (1991). The ITC System of Geomorphologic Survey: A Basis for the Evaluation of Natural Resources and Hazards. Enschede: ITC.
Voldoire, A., Saint-Martin, D., Sénési, S., Decharme, B., Alias, A., Chevallier, M., et al. (2019). Evaluation of CMIP6 deck experiments with CNRM-CM6-1. J. Adv. Model. Earth Syst. 11, 2177–2213. doi: 10.1029/2019MS001683
Vörösmarty, C. J., Green, P., Salisbury, J., and Lammers, R. B. (2000). Global water resources: vulnerability from climate change and population growth. Science 289, 284–288. doi: 10.1126/science.289.5477.284
Wang, W., Shao, Q., Yang, T., Peng, S., Xing, W., Sun, F., et al. (2013). Quantitative assessment of the impact of climate variability and human activities on runoff changes: a case study in four catchments of the Haihe River basin, China. Hydrol. Process. 27, 1158–1174. doi: 10.1002/hyp.9299
Watson, R., Zinyowera, T. M. C., and Moss, R. H. (1996). Climate Change 1995. Impacts, Adaptations and Mitigation of Climate Change: Scientific-Technical Analyses.
Willcock, S., Hooftman, D. A. P., Blanchard, R., Dawson, T. P., Hickler, T., Lindeskog, M., et al. (2020). Ensembles of ecosystem service models can improve accuracy and indicate uncertainty. Sci. Total Environ. 747:141006. doi: 10.1016/j.scitotenv.2020.141006
Wine, M. L., and Laronne, J. B. (2020). In water-limited landscapes, an Anthropocene exchange: trading lakes for irrigated agriculture. Earths Fut. 8:e2019EF.001274. doi: 10.1029/2019EF001274
Wu, L., Wang, S., Bai, X., Luo, W., Tian, Y., Zeng, C., et al. (2017). Quantitative assessment of the impacts of climate change and human activities on runoff change in a typical karst watershed, SW China. Sci. Total Environ. 601, 1449–1465. doi: 10.1016/j.scitotenv.2017.05.288
Yang, C.-J. (2010). Launching strategy for electric vehicles: lessons from China and Taiwan. Technol. Forecast. Soc. Change 77, 831–834. doi: 10.1016/j.techfore.2010.01.010
Yao, N., Li, L., Feng, P., Feng, H., Liu, D. L., Liu, Y., et al. (2020). Projections of drought characteristics in China based on a standardized precipitation and evapotranspiration index and multiple GCMs. Sci. Total Environ. 704:135245. doi: 10.1016/j.scitotenv.2019.135245
Yuan, Y., Zeng, G., Liang, J., Huang, L., Hua, S., Li, F., et al. (2015). Variation of water level in Dongting Lake over a 50-year period: implications for the impacts of anthropogenic and climatic factors. J. Hydrol. 525, 450–456. doi: 10.1016/j.jhydrol.2015.04.010
Zelinka, M. D., Myers, T. A., McCoy, D. T., Po-Chedley, S., Caldwell, P. M., Ceppi, P., et al. (2020). Causes of higher climate sensitivity in CMIP6 models. Geophys. Res. Lett. 47:e2019GL.085782. doi: 10.1029/2019GL085782
Zhang, Z., Li, J., Hu, Z., Zhang, W., Ge, H., and Li, X. (2022). Impact of land-use/land-cover and landscape pattern on seasonal in-stream water quality in small watersheds. J. Clean Prod. 357:131907. doi: 10.1016/j.jclepro.2022.131907
Keywords: climate change, human activities, SWAT model, land use and land cover, Shared Socioeconomic Pathways, Issyk-Kul Lake
Citation: Uwamahoro S, Liu T, Nzabarinda V, Li Zy, Umugwaneza A, Maniraho AP, Kayumba PM, Gulakhmadov A, Anming B and Abdullaev F (2024) Climatic and anthropogenic impacts on the water balance of Issyk-Kul Lake through its main catchments. Front. Water 6:1363039. doi: 10.3389/frwa.2024.1363039
Received: 29 December 2023; Accepted: 08 February 2024;
Published: 27 February 2024.
Edited by:
Soumendra Nath Bhanja, Oak Ridge National Laboratory (DOE), United StatesReviewed by:
Shiblu Sarker, University of Central Florida, United StatesDonghui Xu, Pacific Northwest National Laboratory (DOE), United States
Copyright © 2024 Uwamahoro, Liu, Nzabarinda, Li, Umugwaneza, Maniraho, Kayumba, Gulakhmadov, Anming and Abdullaev. This is an open-access article distributed under the terms of the Creative Commons Attribution License (CC BY). The use, distribution or reproduction in other forums is permitted, provided the original author(s) and the copyright owner(s) are credited and that the original publication in this journal is cited, in accordance with accepted academic practice. No use, distribution or reproduction is permitted which does not comply with these terms.
*Correspondence: Tie Liu, bGl1dGllQG1zLnhqYi5hYy5jbg==