 Kimberly Slinski1,2*
 Gabriel B. Senay3
 Alkhalil Adoum4
 Shraddhanand Shukla4
 Amy McNally2
 James Rowland3
 Erwann Fillol5
 Soni Yatheendradas1,2
 Chris Funk4
 Andrew Hoell6
 Michael Jasinski2
- 1Earth System Science Interdisciplinary Center, University of Maryland, College Park, MD, United States
- 2NASA Goddard Space Flight Center, Greenbelt, MD, United States
- 3U.S. Geological Survey, Earth Resources Observation and Science Center, Sioux Falls, SD, United States
- 4Climate Hazards Center, University of California, Santa Barbara, Santa Barbara, CA, United States
- 5Action Contre la Faim, Regional Office for West and Central Africa, Dakar, Senegal
- 6National Oceanic and Atmospheric Administration, Physical Sciences Laboratory, Boulder, CO, United States
Introduction: Rangeland ponds are vital to the livelihoods of pastoral and agropastoral communities in Africa, providing an important source of water for livestock. However, sparse instrumentation across much of Africa makes it extremely challenging to monitor surface water availability in these areas. Model estimates of surface water, for example, as used by the Famine Early Warning Systems Network (FEWS NET) Water Point Viewer, are one of the few operational tools available to monitor surface water stress across pastoral areas of the Sahel and East Africa.
Methods: Water availability data from these models are difficult to validate. New methods using satellite data to classify surface water provide an opportunity to assess the performance of these tools. This study compares water availability estimates derived from Landsat and Sentinel 1 satellite imagery to in situ observations and model simulations of water availability in 22 ephemeral ponds located in the Ferlo region of Senegal.
Results and discussion: The Active-Passive Water Classification (APWC) algorithm detected surface water at each location. Over 2022 and 2023, water was detected in pond locations annually at a frequency of 68.2% for all ponds and at a frequency of 43.8% for ponds with a surface area <10,000 square meters (m2). The APWC results outperform global and continental surface water datasets in the Ferlo region. Seasonal water availability was captured in 12 ponds over the 2022 and 2023 seasons. The 12 locations can function as sentinel ponds to monitor local water availability. Study results demonstrate the viability of satellite methods to assess water availability in the region, as well as the challenges to using satellite-based methods to estimate water availability in small ponds.
1 Introduction
Monitoring and forecasting rangeland water availability is critical to food security and early warning systems in Africa. Rangelands feed more than half of Africa's livestock, providing a source of income for 268 million pastoralists and agropastoralists (Liniger and Mekdaschi, 2019). Rangeland ponds are a vital source of water for pastoral livestock, directly contributing to household food security and health (Grace and Davenport, 2021). However, many African rangelands are in arid and semi-arid regions. Thus, pastoral livelihoods are extremely vulnerable to climate shocks such as drought. In August 2023, the United States Agency for International Development's (USAID) Famine Early Warning Systems Network (FEWS NET) projected that >65 million people in sub-Saharan Africa in large rangeland areas would require urgent food assistance (FEWS NET, 2023).
The Operational FEWS NET Water Point Viewer (Senay et al., 2013) is one of the few resources to monitor the status of surface water across the pastoral areas of Sahelian and East Africa. The FEWS NET Water Point Viewer applies a water balance model over 338 small ponds to assess water stress at each location (USGS et al., n.d.). Water stress is determined by comparing daily estimates of water depth at each location to its climatological median water depth (Senay et al., 2013). Daily estimates of stress are provided on the FEWS NET Water Point Viewer, available at https://earlywarning.usgs.gov/fews/waterpoint/. Indicators such as water stress are an important tool for assessing drought impacts on livelihoods. FEWS NET uses estimates of surface water availability from the FEWS NET Water Point Viewer to assess water stress experienced by livestock herds. This information is complementary to the water requirement satisfaction index for rangeland areas, which provides information on pasture health over the growing season (Senay et al., 2013). Livestock is critical to pastoral livelihoods and, therefore, food security in rangeland areas of Africa. However, sparse in situ hydrologic data across much of Africa have historically limited our ability to assess the performance of surface water models in estimating water availability.
Surface water classification methods using satellite remote sensing provide an opportunity to assess surface water availability in data-sparse regions. Data from passive optical sensors (e.g., Landsat and Sentinel 2) have been used to create global and continental-scale maps of surface waterbodies (Carroll et al., 2016; Feng et al., 2016; Mueller et al., 2016; Pekel et al., 2016). However, map resolution is coarse relative to the size of pastoral ponds, and time series miss a substantial amount of data due to clouds and other sensor errors. Recent studies in the Ferlo region of Senegal using Landsat and high-resolution PlanetScope data to map waterbodies (Mishra et al., 2020) and on the WENDOU platform (Water ENvironment Dashboard for Observation in support of Users; SERVIR, 2024) show promise, but are not yet used to routinely assess water availability. Synthetic aperture radar (SAR) data from active microwave sensors have been used alone as well as fused with optical sensors to generate time series of surface water extent (Slinski et al., 2019; Huang et al., 2018; Pulvirenti et al., 2011; Schumann et al., 2011), wetlands inundation (Bourgeau-Chavez et al., 2005; Chapman et al., 2015; Rebelo et al., 2012), and flood maps (Brakenridge and Kettner, n.d.; Salamon et al., 2021), but are not routinely used to map surface water in most rangeland regions in Africa. SAR-derived surface water maps are higher resolution and less affected by clouds, but classification accuracy is affected by layover, floating vegetation, as well as sand and other reflective surfaces. Confusion between sparsely vegetated land cover and open water is a particular challenge for SAR-based water classification in rangeland areas. However, combining SAR and optical sensor data, for example, using the Active-Passive Water Classification (APWC), reduces errors associated with the individual sensor datasets (Slinski et al., 2019).
The overarching goal of this study is to assess the potential of the APWC algorithm to validate the modeled representation of water availability in rangeland areas. Previous studies have demonstrated the algorithm's ability to estimate water stress in the Awash River basin in Ethiopia (Slinski et al., 2019) and for small waterbodies in rangeland areas of East Africa (Slinski et al., 2020). This study expands on this work, comparing surface water classification results derived from the APWC algorithm to in situ observations and model simulations of surface water availability in West Africa. The specific objectives of this study are to answer the following research questions:
1. To what extent can indicators from high resolution remote sensing data be used to assess water availability in rangeland ponds of West Africa?
2. To what extent can these indicators be used to assess model representation of surface water availability?
To address the first research question, in situ measurements of pond water depth collected during 2022 and 2023 in the Ferlo region of northern Senegal are compared to surface water classification results derived from the APWC algorithm. To address the second research question, model-simulated estimates of pond water depth during 2022 and 2023 for locations monitored by the FEWS NET Water Point Viewer in the Ferlo region of northern Senegal are compared to surface water classification results derived from the APWC algorithm. This study is the first to compare in situ data to satellite estimates of surface water availability in small ponds (<10,000 square meters [m2]) in the Sahel. This comparison allows a robust assessment of the skill of satellite estimates of water availability in this data-sparse region. This study is also the first to use satellite estimates of surface water area to assess the model estimates of water availability in the Sahel.
2 Materials and methods
2.1 Study area
The study area (Figure 1) is approximately a 35,000-square-kilometer (km2) area of the Ferlo Region, a semi-arid pastoral zone in northern Senegal. This region is part of the Sahelian climate zone (Tappan et al., 2016). Annual rainfall over the study area ranges from 250 millimeters (mm) in the north to 480 mm in the southwest (Figure 2A). Nearly all rainfall in this region falls during June, July, August, September, and October (Figure 2B) as part of the West African Monsoon (WAM). The onset of the WAM corresponds with the northern migration of the Intertropical Convergence Zone (ITCZ). Monsoon rainfall intensity has been linked to the ITCZ; large-scale atmospheric circulation features such as the Tropical Easterly Jet, the African Easterly Jet, and the low-level African Westerly Jet, as well as the Saharan Heat Low (Nicholson, 2013). Monthly precipitation for most of the 2022 and 2023 rainy seasons was above average across the study area (Figure 2B).
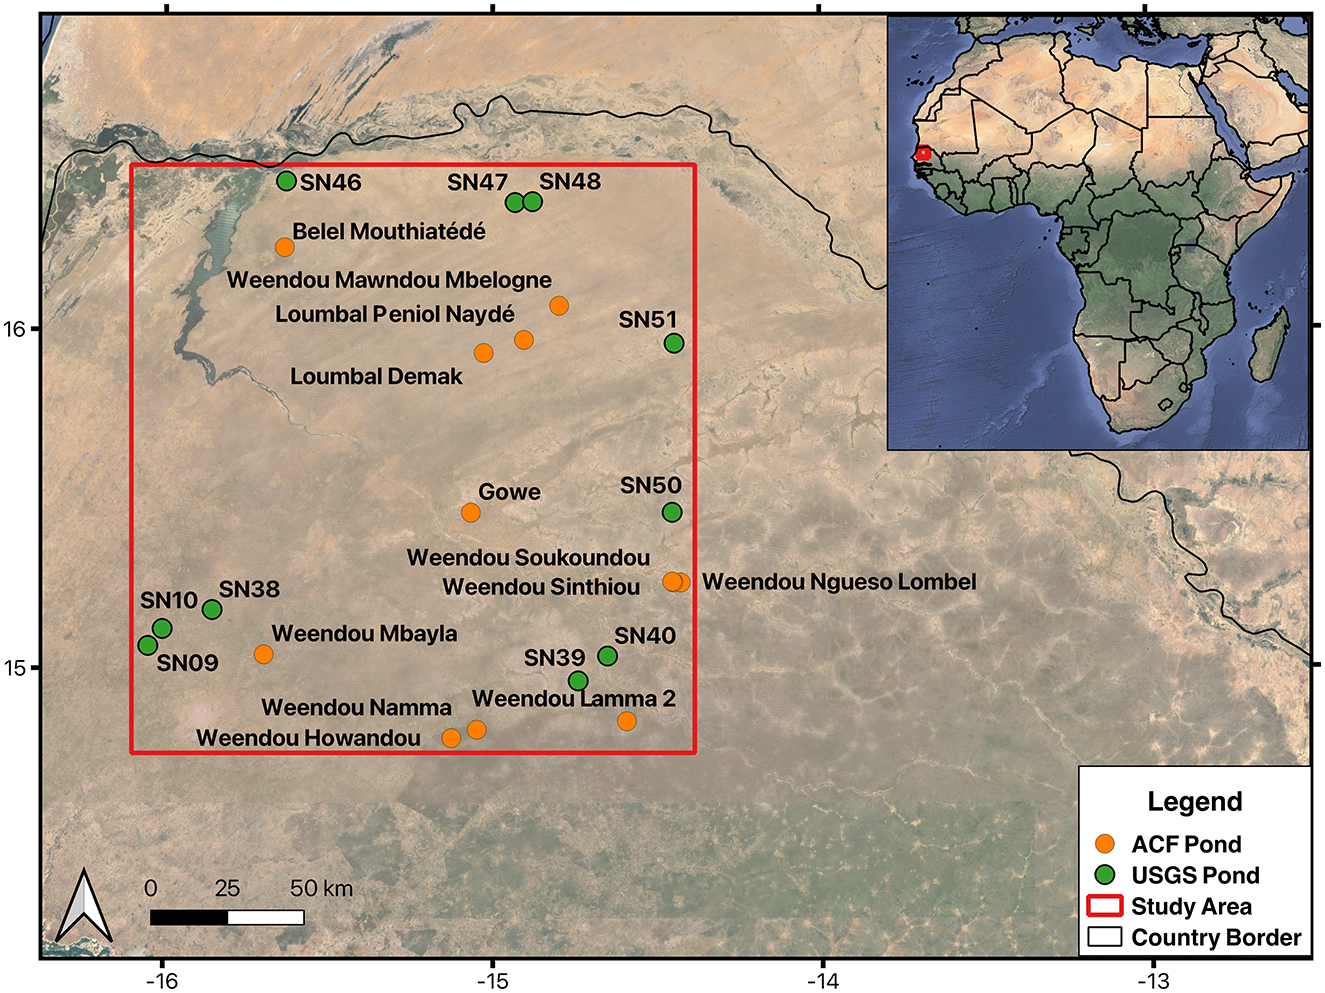
Figure 1. Location of the study area and ponds included in this study. Action Contre la Faim (ACF) pond locations are indicated by orange dots, and Famine Early Warning Systems Network (FEWS NET) pond locations are indicated by green dots. Imagery: ©2023 TerraMetrics, Map data: ©2023 Google.

Figure 2. (A) Shows mean annual precipitation over the study area based on Climate Hazards Group InfraRed Precipitation with Station (CHIRPS) precipitation (Funk et al., 2015) for 1993–2023. (B) Shows boxplots of monthly CHIRPS precipitation for 1993–2023 and monthly 2022 and 2023 CHIRPS precipitation as green and yellow dots, respectively. The upper and lower boxplot hinges represent the first and third quartiles (25th and 75th percentiles), respectively, and the whiskers extend to the largest/smallest value no farther than 1.5 times the interquartile range from the upper/lower hinge. Monthly precipitation is calculated as the mean precipitation over the study area.
The primary land cover of the Ferlo Region is the Sahelian shortgrass savanna (Tappan et al., 2016). Livelihoods in the region are largely dependent on resident and transhumance herds of cattle, sheep, and goats that graze on the savanna, with some rain-fed subsistence agriculture (World Food Program et al., 2011). The region is characterized by a network of natural and constructed ephemeral ponds that fill during the WAM. These ponds are an important source of water for livestock during the rainy season, when the pastureland greens up and herds are dispersed across the region. When the ponds dry at the end of the rainy season, herds are moved to areas with a year-round source of water, such as the Sylvo-Pastoral Reserves, which are managed pastoral areas in the Ferlo Region where high-yield boreholes have been installed.
Twenty-two natural ponds (shown in Figure 1) are included in this study. Action Contre la Faim (ACF) collected in situ water depth measurements from 12 ponds (denoted as “ACF ponds”), and the FEWS NET Water Point Viewer simulated water depth for 10 ponds (denoted as “FEWS NET ponds”). Remote sensing-based estimates of surface water extent were generated over all 22 ponds.
The following subsections provide additional detail on in situ, modeled, and remote sensing-based estimates of water availability for the ponds. Figures 3, 4 show dry season imagery for the ACF and FEWS NET ponds, respectively. Pond size inferred from these images indicates that these are small ponds, with pond diameters ranging from approximately 25 to 200 meters (m).
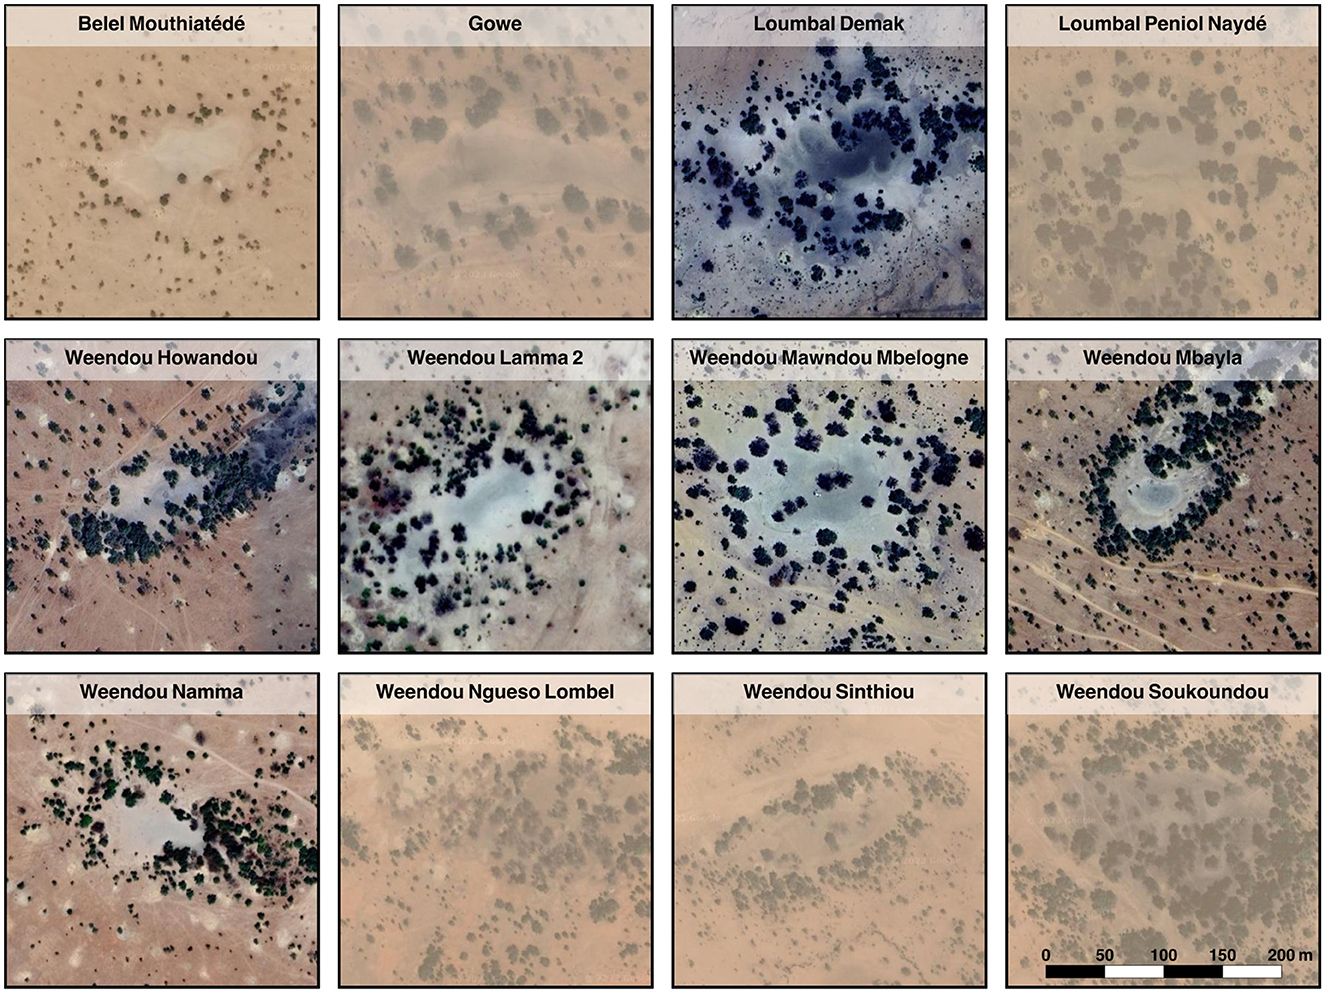
Figure 3. Dry season satellite images of the 12 Action Contre la Faim (ACF) ponds. Map projection: UTM 28N, Imagery: ©2023 TerraMetrics, Map data: ©2023 Google.
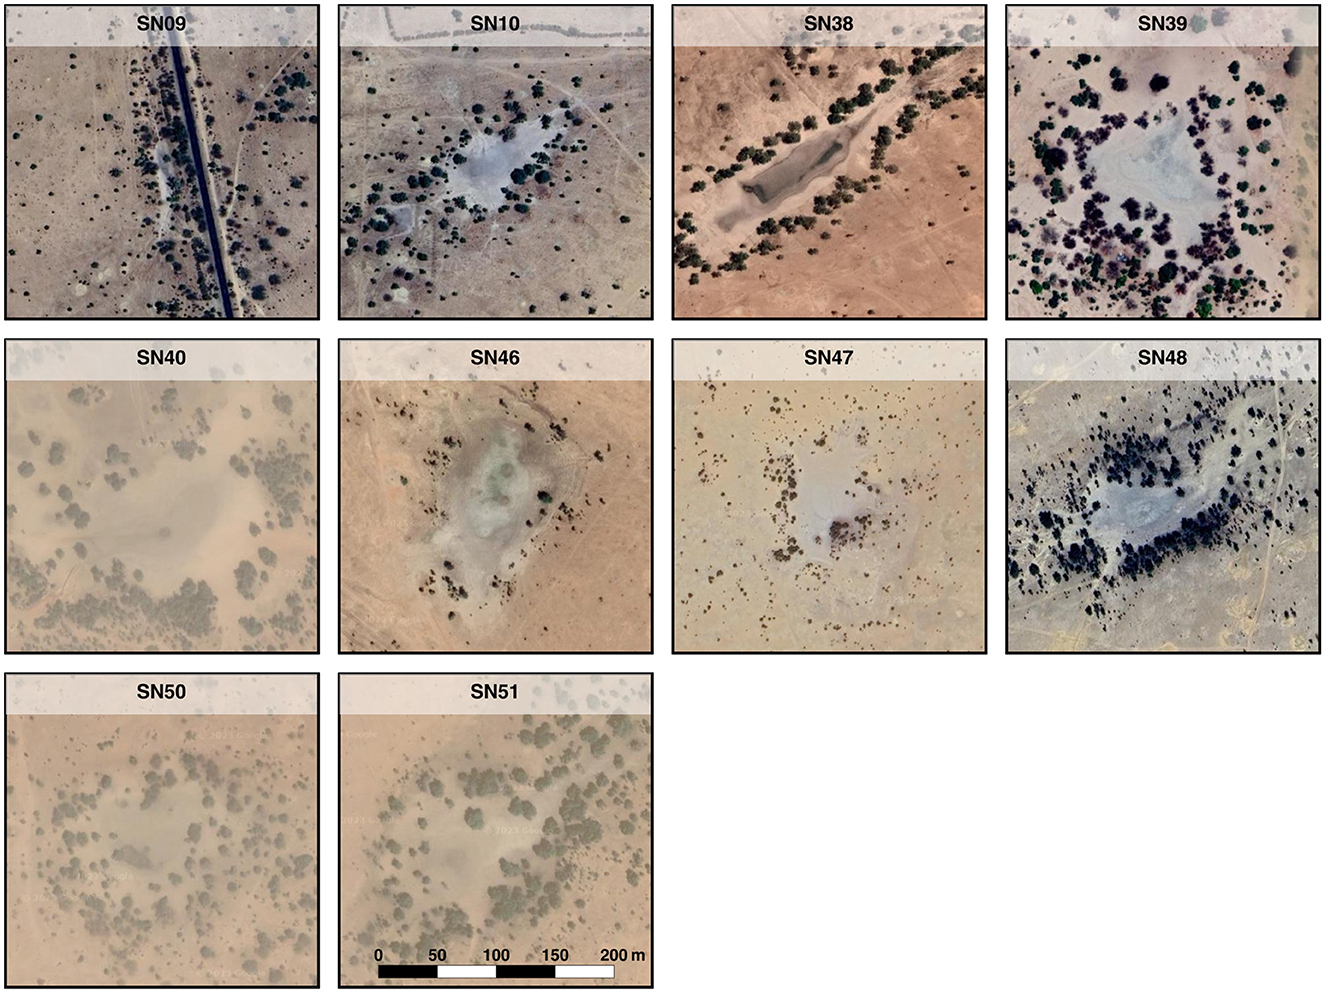
Figure 4. Dry season satellite images of the 10 Famine Early Warning Systems Network (FEWS NET) ponds. Map projection: UTM 28N, Imagery: ©2023 TerraMetrics, Map data: ©2023 Google.
2.2 In situ observations of water depth
ACF installed staff gauges in 12 ponds within the study area during July 2022. The gauges were installed at the approximate deepest point of each pond (Figures 5A, B). Data enumerators documented the pond depth at the gauge and the extent of each pond (Figure 5C) over the 2022 and 2023 rainy season and until each pond dried up. Data were collected approximately every 2 weeks from July to December 2022 and ~6 days from June to December 2023. Photographs were taken of the gauge, showing the water level reading, and of the pond, from the same vantage point for each reading. The photographs were transmitted to the ACF country office in Dakar, Senegal, for logging of the water level readings and filing of the photographs. For three locations, the staff gauge had to be decommissioned due to vandalism. At two of these locations, the gauge was moved to a pond in the same general area. The third gauge was not reinstalled. Data from vandalized gauges were discarded, resulting in shortened datasets for the Belel Mouthiatédé, Loumbal Demak, and Weendou Lamma 2 ponds. Pond depth data is archived at Slinski et al. (2025).
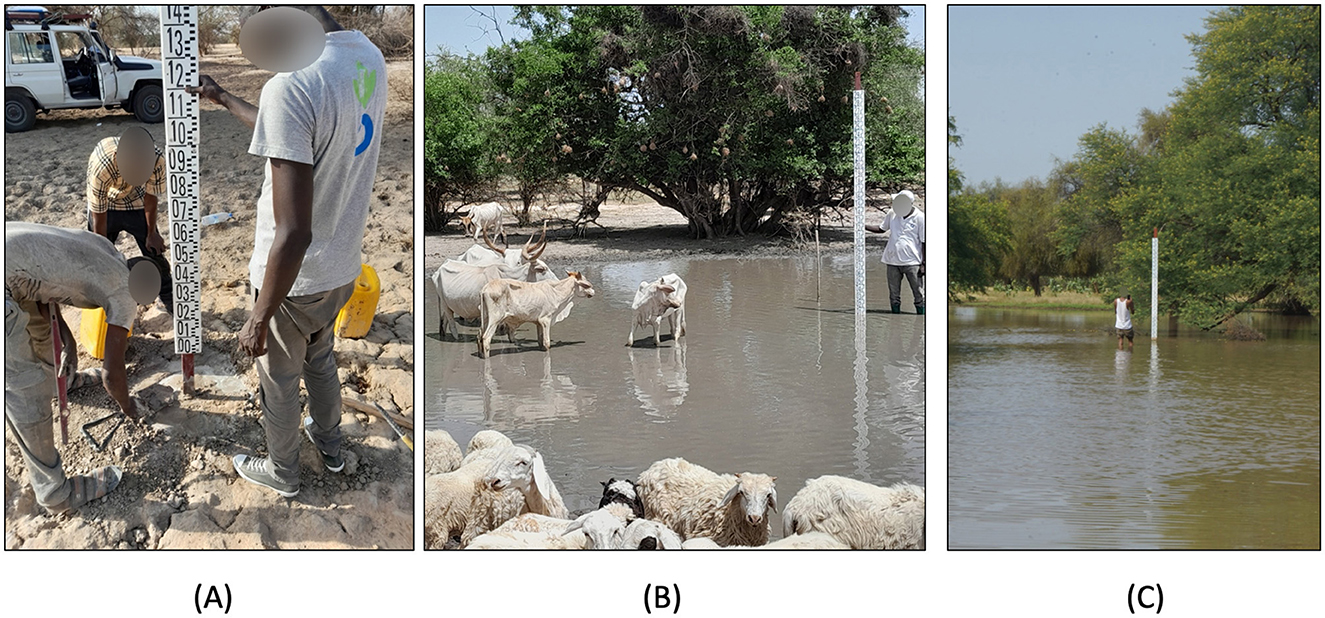
Figure 5. (A, B) Show photographs of the staff gauge installation. (C) Shows a photograph of the staff gauge reading.
Observed water levels were scaled as follows:
where ωs (%) is scaled water depth, ωi (meters) is measured water depth for the target month (i), and ωmax (meters) is the maximum measured water depth. Scaling converts water depth to a unitless value in the range of 0 and 100. A similar approach was used to convert satellite and modeled estimates of water availability to the same range, as described in the next subsections. Scaling facilitates comparison between the satellite, in situ, and modeled estimates of water availability.
2.3 Satellite remote sensing-based estimates of water availability
Water availability was estimated from satellite datasets following the APWC algorithm developed by Slinski et al. (2019). APWC uses the K-means clustering algorithm to identify water and non-water from SAR and optical datasets. K-means clustering is a simple unsupervised machine learning algorithm (Lloyd, 1982). The APWC algorithm was chosen because it is a rapid, computationally light surface water classification method that has been shown to accurately identify water bodies in rangeland areas of Africa (Slinski et al., 2019).
The APWC algorithm was implemented in Google Earth Engine (GEE, Gorelick et al., 2017) using datasets obtained from GEE data collections. First, monthly median composite grids of Sentinel 1 SAR brightness and Landsat-derived modified normalized difference water index (MNDWI; Xu, 2006) values were generated over the study area for 100 target months: October 2015–January 2023. The MDWI is used in the APWC algorithm because it performs better than other water classification indices, such as the normalized difference water index (McFeeters, 1996) and the automated water extraction index (Feyisa et al., 2014). Pixels were then grouped into k clusters using the K-means clustering algorithm, and the cluster associated with surface water was identified. The final dataset consists of 109 monthly, 10-m resolution grids covering the study area, with each grid pixel classified as “Surface Water,” “Not Surface Water,” or “No Data.” The following paragraphs provide additional detail on this study's implementation of the APWC algorithm for surface water classification. The Supplementary material (SM) contains a flow chart of the APWC methodology.
The MNDWI was calculated as follows:
where G is the visible green band and SWIR1 is the short-wave infrared 1 band from the Landsat 8–9 Tier 1 Collection 2 surface reflectance (SR; Vermote et al., 2016) and Landsat 7 Level 2, Collection 2, Tier 1 SR (Masek et al., 2006) datasets.
Each satellite has a 16-day return period. The Landsat 8 satellite orbit is an 8-day offset from the Landsat 7 and 9. Thus, the combined Landsat 7, 8, and 9 SR datasets provide data over the study area every 8 days. Table 1 presents additional information on the satellite platforms and associated datasets used to derive MNDWI. The MNDWI composites were generated as follows: (1) the MNWI was calculated for each Landsat scene available over the study area for 1 October 2015 through 1 February 2023; (2) a cloud and cloud shadow mask, derived from bits 3 and 4 of the Landsat 7, 8, and 9 Pixel Quality Assessment Band (QA_PIXEL), was applied to each scene; and (3) the 31-day median composite MNDWI grid was derived for each target month by taking the median pixel value of the masked Landsat scenes collected +/- 15 days around the 15th day of the target month. This method was followed for each month, with the following exception: cloud and cloud shadow contamination present over the south-central and southwest region of the study area during August 2022 was not identified in the QA_PIXEL and was masked manually. This affected August 2022 results for ACF ponds Weendou Howandou, Weendou Namma, and Weendou Mbayla. The FEWS NET pond locations were not affected.
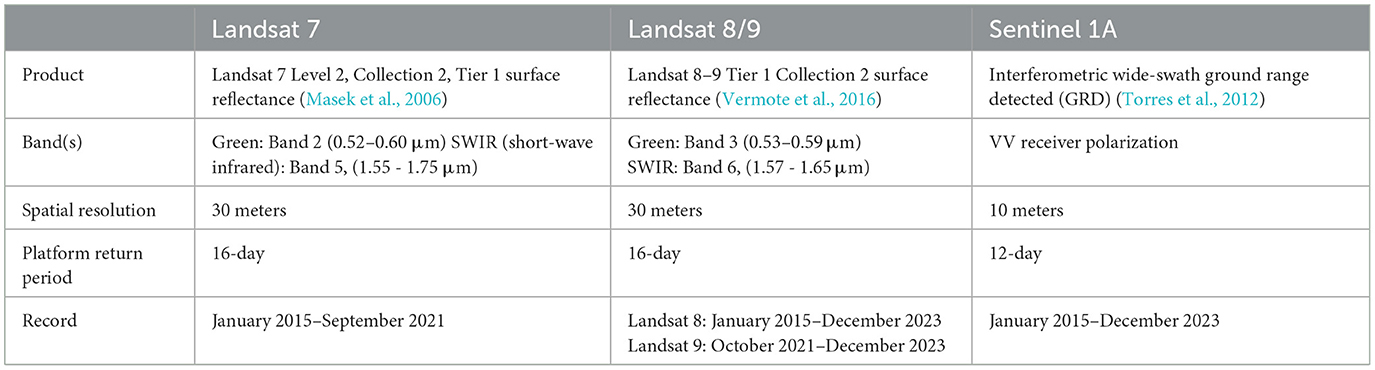
Table 1. Characteristics of the satellite platforms and associated datasets used by the Active-Passive Water Classification (APWC) algorithm.
Thirty-one-day median composite SAR brightness grids were derived from Sentinel 1A interferometric wide-swath ground range detected (GRD) data (Torres et al., 2012) with the vertical transmit-vertical receive (VV) polarization. Sentinel 1B data are not available over the study area. This study uses VV polarization because it performs better than vertical transmit-horizontal receive (VH) polarization at detecting water (Twele et al., 2016). Ascending and descending data are available for some regions. However, only ascending data are available for the study area. Table 1 presents additional information on the Sentinel 1A platform and associated dataset. GEE applied the following preprocessing routines to the GRD images used in this study: orbital file application, border noise removal, thermal noise removal, radiometric calibration, terrain correction, and conversion of the detected backscatter coefficients to decibels. Pixel values represent the detected backscatter coefficient in decibels, which is also referred to as “brightness.” Consistent with the MNDWI composite calculation, 31-day median composite SAR brightness grids were derived for each target month by taking the median pixel value of the SAR scenes collected +/- 15 days around the 15th of the target month.
Following derivation, the MNDWI and SAR brightness median composites were resampled to a common 10-m resolution grid projected to the Universal Transverse Mercator 28 North (UTM 28N) coordinate system. Pixels were grouped into k clusters using the cascade simple K-means clustering algorithm, where the best k was selected following (Caliński and Harabasz, 1974). Finally, the cluster number associated with Lac de Guiers, an area of known permanent surface water in northern Senegal, was identified as the reference surface water cluster. Pixels with K-means output matching the reference cluster number were classified as “Surface Water.” The remaining pixels were classified as “Not Surface Water” or “No Data.” This method produced a 10-m resolution surface water grid for each of the target months, with each grid pixel classified as “Surface Water,” “Not Surface Water,” or “No Data.”
There are several limitations to the APWC method. The APWC method requires a valid Landsat-derived MNDWI and SAR brightness value for pixel classification. This study uses 31-day compositing to minimize the impact of data gaps in individual Landsat and SAR scenes. However, sporadic data gaps remained in monthly composites of MNDWI due to clouds and cloud shadows. Additionally, Sentinel 1A scenes for portions of the study area are missing from the GEE archive for several dates, including July 2022, July 2023, and October 2023. The “No Data” label was applied to pixels where the MNDWI and/or the SAR brightness value for the target month was not available. Slinski et al. (2019) discuss additional method limitations, including errors of commission when water is incorrectly identified in both the MNDWI and SAR brightness datasets and errors of omission due to the presence of floating vegetation and tree canopy in pond areas.
The area of the surface water pixels associated with each pond was summed by month and scaled as follows:
where as (%) is scaled pond surface water area, ai (square meters) is the total pond surface water area for the target month (i), and amax (square meters) is the maximum surface water area detected over the period assessed. Scaled surface water area results were compared to scaled observations of water depth to assess the performance of the water classification approach.
The APWC results for October 2015 through December 2023 were used to derive estimates of surface water occurrence at each location. Surface water occurrence for each calendar month was calculated by pixel as follows:
where occi, m is surface water occurrence for pixel i and calendar month m, SWi, m is the count of the number of times surface water was detected for the pixel and calendar month, and Obsi, m is the count of the number of “Surface Water” and “Not Surface Water” observations for the pixel and calendar month. “No Data” pixel classifications are not included in the calculation. 100% surface water occurrence indicates that surface water was detected in the pixel for all valid observations for the month, while 0% surface water occurrence indicates that surface water was never detected.
2.4 Model-based estimates of water availability
Modeled estimates of water availability in ponds within the study area were obtained from the FEWS NET Water Point Viewer. Water availability estimates were generated using the water balance model described by Senay et al. (2013) as follows:
where ΔD (meters) is a change in pond water depth, and P (meters) is satellite precipitation over the pond from the CHIRPS data (Funk et al., 2015) precipitation product. Rin (meters) is the watershed runoff into the pond estimated using the Soil Conservation Service Curve Number method (Cronshey, 1986). Rout (meters) is the outflow from the pond that occurs when the water level exceeds maximum capacity, which is assumed to be 2 m for each pond. S (meters) is pond seepage, estimated to be a constant 0.002 m/day. E (meters) is open-water evaporation from the pond, calculated as:
where ETo is the climatological reference for evapotranspiration calculated using the American Society for Civil Engineers formulation of the Penman–Monteith method (Allen et al., 1998). The model assumes that the pond has negligible inflow from the groundwater. The surface area of each pond was delineated from ASTER satellite imagery and is kept constant over time in the model.
For this analysis, the modeled pond depth was transformed into scaled pond depth following Equation 1, consistent with the approach used to scale the observed pond depths.
Modeled estimates of water availability were obtained for the 10 FEWS NET ponds shown in Figure 1. At the time of writing, modeled water depth estimates were not available for the ponds equipped with staff gauges. One additional location, FEWS NET pond SN08, is located within the study area but was not included in this analysis for data quality reasons; its behavior was an outlier relative to nearby pond SN51 as well as the rest of the ponds included in the analysis.
2.5 Precipitation data
Water availability estimates at each location were compared to monthly rainfall estimates from the Climate Hazards Group InfraRed Precipitation with Station (CHIRPS) precipitation product. CHIRPS estimates rainfall by blending rain gauge data with satellite precipitation estimates from thermal infrared cold cloud duration statistics (Funk et al., 2015). The CHIRPS precipitation product has a 0.05 × 0.05° degree spatial resolution. The catchment area of the ponds used in this study is < 2 km2. Therefore, catchment area precipitation was estimated as the precipitation associated with the pixel overlaying the pond location.
3 Results
3.1 Satellite-based surface water classification results
This study found that surface water was detected by the APWC method at each of the 22 pond locations. Figures 6, 7 show surface water occurrence estimates for each of the ACF and FEWS NET ponds, respectively. The surface water classification of ponds was affected by the small size of some ponds. From 2022 to 2023, water was detected in pond locations annually at a frequency of 68.2% for all ponds and a frequency of 43.8% in ponds with a surface area of < 10,000 m2. The SM contains water classification results for each month and pond over the 2022 and 2023 seasons.
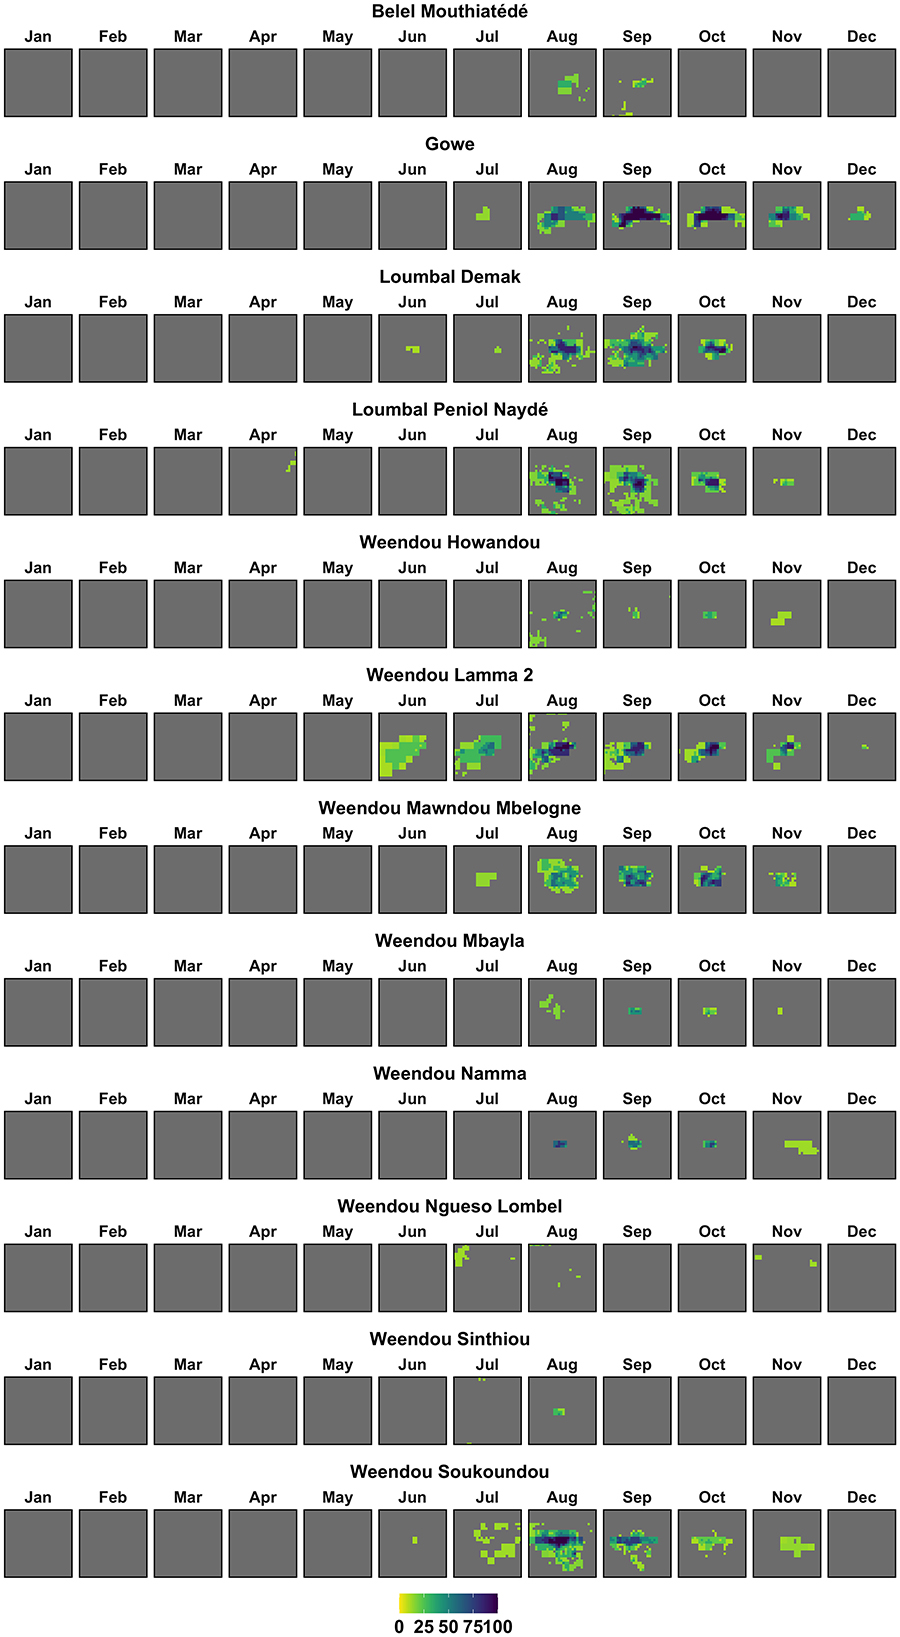
Figure 6. Percent surface water occurrence by month for the 12 Action Contre la Faim (ACF) ponds from October 2015 to December 2023. 100% surface water occurrence indicates that surface water was detected in the pixel for all valid observations for the month, while 0% surface water occurrence indicates that surface water was never detected.
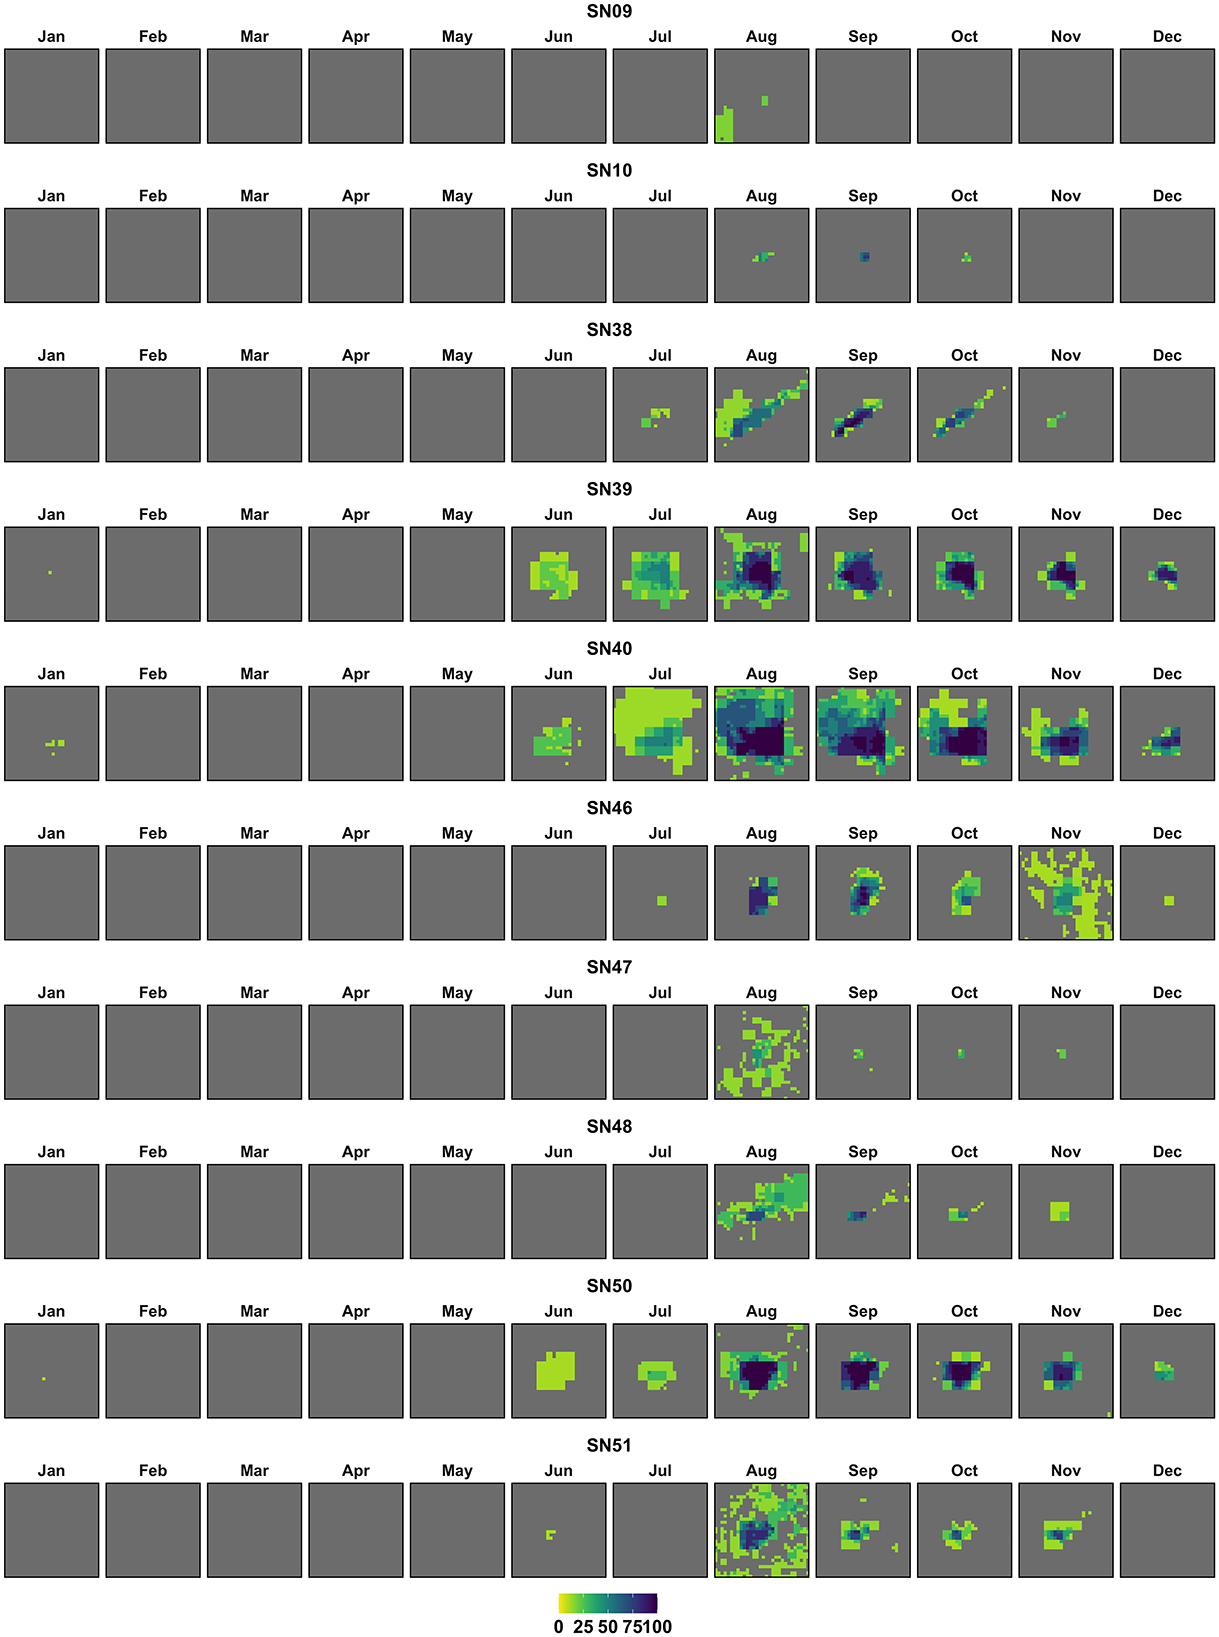
Figure 7. Percent surface water occurrence by month for the 10 Famine Early Warning Systems Network (FEWS NET) ponds from October 2015 to December 2023. 100% surface water occurrence indicates that surface water was detected in the pixel for all valid observations for the month, while 0% surface water occurrence indicates that surface water was never detected.
Satellite-based surface water classification results were also impacted by missing data. Partial results for July 2022 and 2023 are due to missing Sentinel 1A scenes, and partial results for August and September 2022 and October 2023 are due to cloud cover and cloud shadows in Landsat scenes. The pixels affected by the missing data are classified as “No Data” on the surface water classification maps included in the SM.
Surface water classification results at 12 locations (Gowe, Loumbal Demak, Loumbal Peniol Naydé, Weendou Lamma 2, Weendou Mawndou Mbelogne, Weendou Soukoundou, SB38, SN39, SN40, SN46, SN50, and SN51) identified surface water for 3 or more consecutive months during 2022 and 2023. This allowed inference of seasonality (i.e., the seasonal progression of pond filling and drying at those locations).
The primary reasons that the APWC method failed to capture seasonality during 2022 and 2023 in the remaining 10 locations are (1) the small pond size (< 10,000 m2) and (2) the presence of vegetation. Seven of the locations (Bele Mouthiatédé, Weendou Mbayla, Weendou Namma, SN09, SN10, SN47, and SN48) are < 10,000 m2. Three ponds (Weendou Howandou, Weendou Ngueso Lombel, and Weendou Soukoundou) had substantial tree cover, e.g., as illustrated for Weendou Soukoundou in Figure 8. Algae or floating vegetation (Figure 8) may also have affected the detection of surface water at some pond locations. Additionally, the missing data for July 2022 and 2023 limited the assessment of the timing of pond filling at the start of the season.
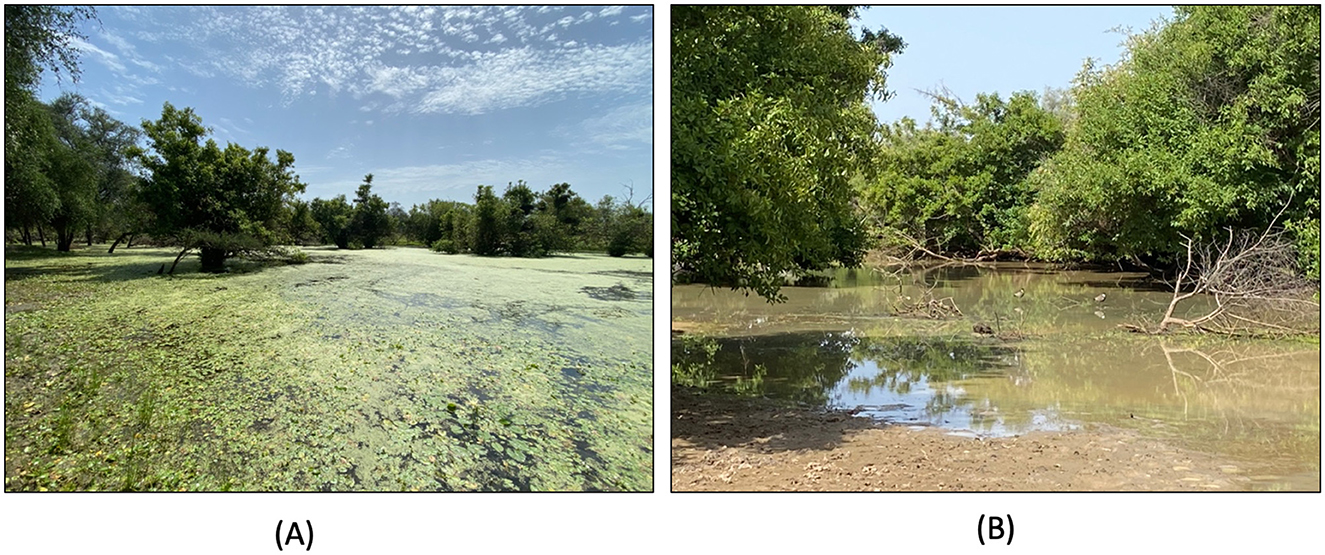
Figure 8. (A) Shows floating vegetation at the Weendou Namma pond. (B) Shows tree cover at the Weendou Soukoundou pond.
3.2 In situ water depth observations
In situ water depth observations show that all ACF ponds contained water during the 2022 and 2023 rainy seasons (Figure 9). The timing of pond filling following the onset of the Ferlo rainy season and pond drying up lags its end by 1 to 3 months (Figure 9). All ponds where observations were collected during July and August contained water by the first week of August. Pond depths reached near-maximum levels within a month of the first observation of water in the pond and maintained that level for most of the rainy season. The ponds progressively dried up from September to January, after the end of the rainy season. Bele Mouthiatédé dried up in September 2022, but was subsequently refilled and contained water until the end of October 2022. All other ponds contained water from the date of the first observation of water until the date of the first dry observation.
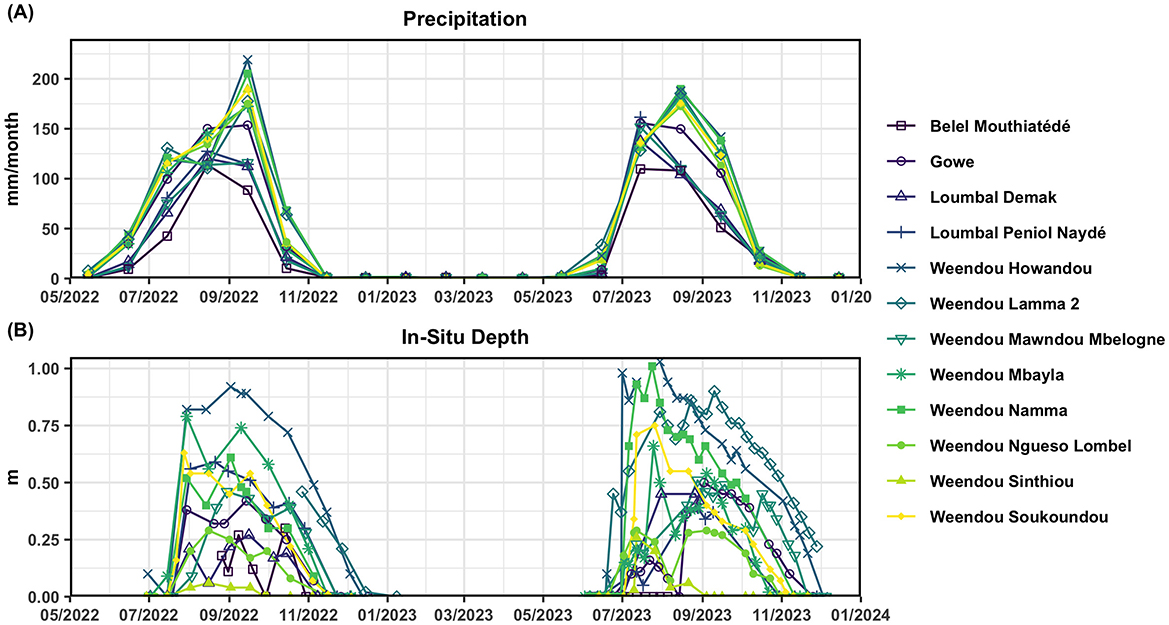
Figure 9. (A) Shows total monthly Climate Hazards Group InfraRed Precipitation with Station (CHIRPS) precipitation (Funk et al., 2015) at each Action Contre la Faim (ACF) pond. (B) Shows the in situ water depth measured at each ACF pond.
3.3 Comparison of satellite-based surface water classification results with in situ data
The satellite-based surface water classification results for six ACF ponds (Gowe, Loumbal Demak, Loumbal Peniol Naydé, Weendou Lamma 2, Weendou Mawndou Mbelogne, Weendou Soukoundou) were compared with in situ measurements of seasonal water availability. These ponds were selected because the satellite-based surface water classification results allowed inference of the seasonal progression of pond filling and drying. Figure 10 compares scaled in situ measurements of water depth to scaled satellite estimates of water area for these ponds. The SM contains plots showing scaled and unscaled comparisons for all ACF ponds.
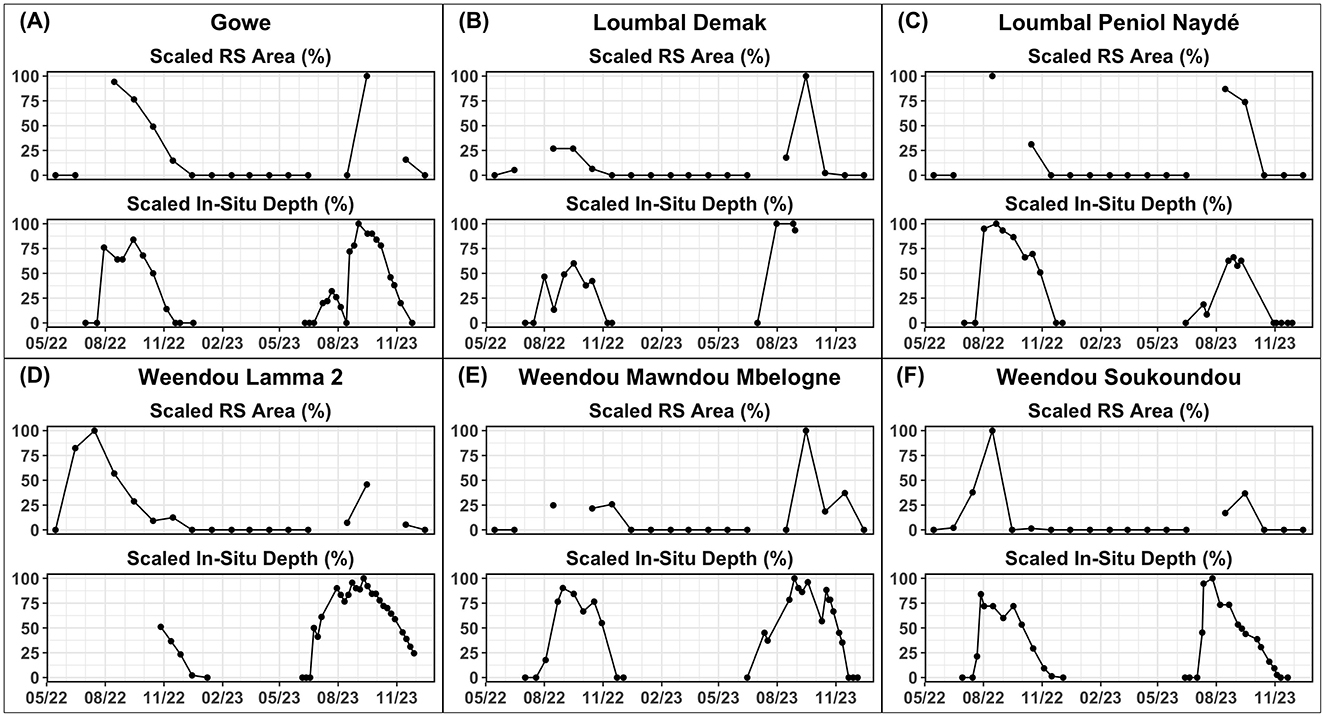
Figure 10. Comparison of scaled RS Area as percent of maximum measured and scaled in situ depth as percent of maximum measured for Gowe, Loumbal Demak, Loumbal Peniol Naydé, Weendou Lamma 2, Weendou Mawndou Mbelogne, and Soukoundou ponds [(A–F) respectively].
This study found good correspondence between the in situ measurements of water depth and satellite-based estimates of water area during the middle and end of the season (as depicted in Figure 10). However, early season comparisons for 2022 and 2023 cannot be made due to missing data for July. Correlations or other statistical metrics were not calculated because of the small sample size. The SM contains plots showing unscaled depth measurements and surface water area for the ACF ponds.
3.4 Comparison of satellite-based surface water classification results with modeled data
The satellite-based surface water classification results for six FEWS NET ponds (SB38, SN39, SN40, SN46, SN50, and SN51) allowed inference of the seasonal progression of pond filling and drying. The satellite-based surface water classification results for these ponds were compared with modeled estimates of seasonal water availability. Figure 11 compares scaled modeled estimates of water depth to scaled satellite estimates of water area for these ponds. The SM contains plots showing scaled and unscaled comparisons for all FEWS NET ponds.
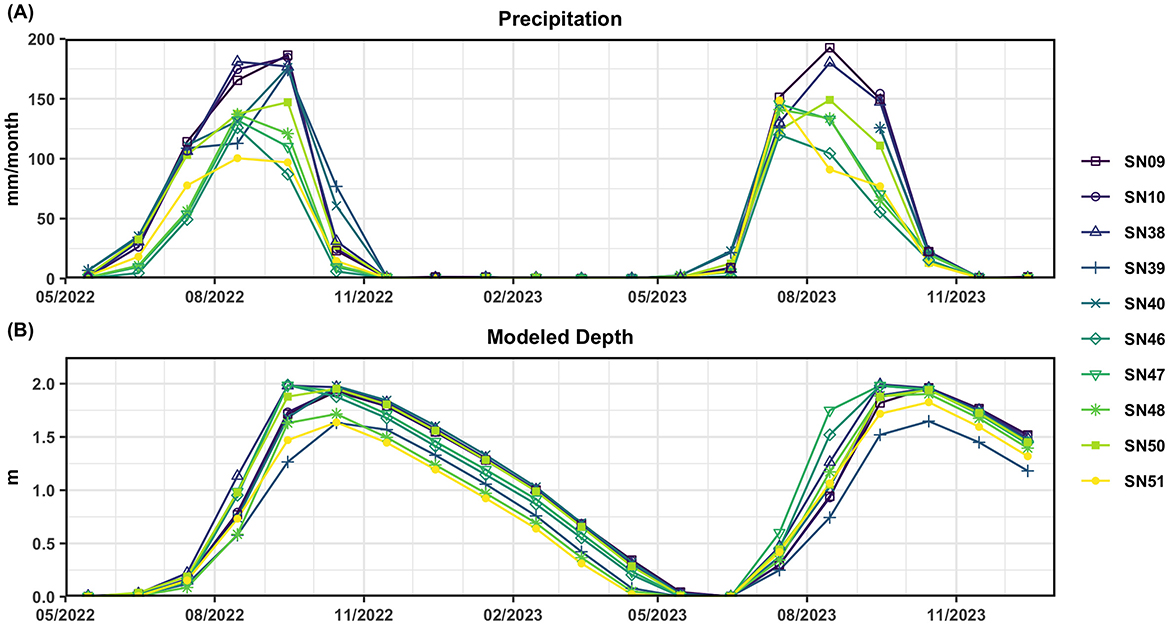
Figure 11. (A) Shows total monthly Climate Hazards Group InfraRed Precipitation with Station (CHIRPS) precipitation (Funk et al., 2015) at each Famine Early Warning Systems Network (FEWS NET) pond. (B) Shows the mean monthly water depth modeled at each FEWS NET pond.
Model simulations show all FEWS NET ponds containing water during the 2022 and 2023 season, with all ponds beginning to fill during July, drying up during April/May 2023, and containing water at the end of December 2023 (Figure 11). This study found good correspondence between the modeled estimates of water depth and satellite-based estimates of water area during the middle of the season (as shown in Figure 12).
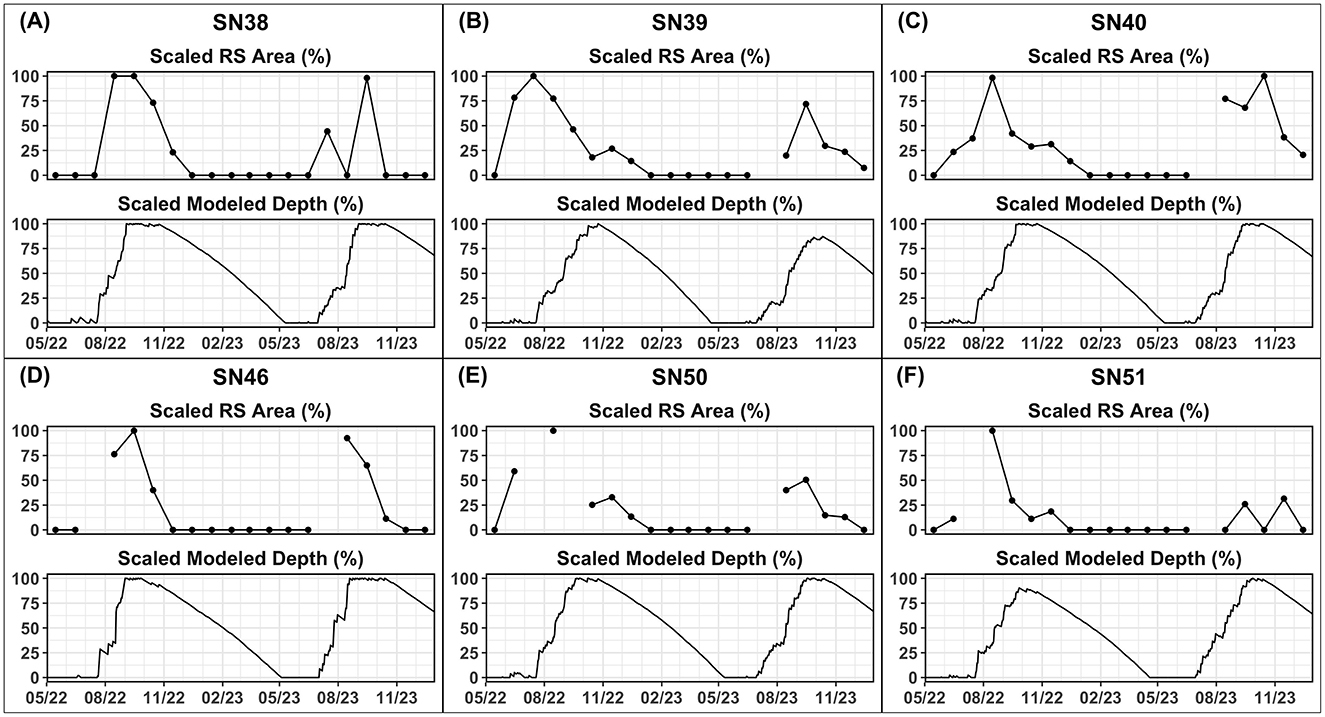
Figure 12. Comparison of scaled RS area as percent of maximum measured and scaled Modeled Depth as percent of maximum measured per month for SN38, SN39, SN40, SN46, SN50, and SN51 ponds [(A–F) respectively].
Correspondence during the early season was mixed. For one location, SN38, 2022 season pond filling in the satellite-based dataset matches the model (i.e., both begin in July 2022). Satellite-based pond filling estimates for the 2022 season are earlier than model estimates at four locations (SN39, SN40, SN50, and SN51), with these ponds filling in June 2022. The discrepancy between the model- and satellite-based estimates of water availability in June 2022 at these locations may be due to model parameterization and/or underreporting of June precipitation in the CHIRPS product. The presence of June 2022 water in these ponds is not considered a water classification error because it is consistent across all locations in the eastern portion of the study area where satellite-based time series were successfully derived, e.g., ACF pond Weendou Lamma 2. The timing of pond filling could not be determined due to missing data for the sixth location, SN36, in 2022 and for all locations in 2023. It appears likely that unseasonal above-normal rains in June may have been poorly captured by CHIRPS version 2. This may be due to a systematic under-representation of precipitation variance; this issue should be less pronounced in CHIRPS version 3 (UCSB CHC, n.d.).
A major difference between modeled and satellite-derived time series of water availability is the timing of the pond dries up. As shown in Figure 12, the satellite-derived time series indicate that all ponds dried up or were near-dry by the end of December of each year. This is consistent with the in situ water depth observation time series. The water point model simulations retained water in the ponds past December. The longer retention of pond water in the model simulation may be due to a model parameterization error, e.g., the modeled pond surface area may be smaller than the observed pond capacity, or the model could underestimate seepage. A larger pond watershed area could also increase overall pond depth and thus lead to larger and longer storage. It might also be due to the underestimation of the open-water evaporative demand (E in Equation 5). Underestimates of seepage (S in Equation 5) are also possible.
4 Discussion
Rangeland surface water is vital to the livelihoods of pastoral and agropastoral communities in rangeland regions of Africa. Modeling systems such as the FEWS NET Water Point Viewer described by Senay et al. (2013) provide one of the few resources to monitor the status of surface water across pastoral areas of the Sahel and East Africa. However, sparse in situ hydrologic data across much of Africa limit the ability to assess the performance of these models. Satellite remote sensing-based surface water classification methods, such as the APWC algorithm, have been shown to be a viable approach to assess water availability in the small ponds used by pastoral communities (Slinski et al., 2019). The overarching goal of this study was to assess the potential of the APWC algorithm to fill this gap. The study demonstrates the viability of this approach for assessing surface water availability in the Ferlo region of Northern Senegal, as well as the challenges to satellite-based estimates of water availability in small ponds. The main findings of the study are discussed below, according to research questions.
4.1 Research question 1: to what extent can indicators from high-resolution remote sensing data be used to assess water availability in rangeland ponds in West Africa?
Water occurrence derived from the APWC surface water extent estimates for 2015–2023 (Figures 6, 7) shows that the APWC method successfully detected water at all 22 pond locations. From 2022 to 2023, the annual detection frequencies for small ponds (< 10,000 m2) and all ponds are 43.8% and 68.2%, respectively. The APWC results outperformed water occurrence products produced by the Global Surface Water Explorer (Pekel et al., 2016) and the Water Observations from Space (WOfS) (Halabisky et al., 2024). Both datasets are 30-m resolution products derived from Landsat data. The Global Surface Water Explorer identified water in 3 of the 22 locations, and WOfS identified water in 19 of the 22 locations. The WOfS annual detection frequencies for small ponds and all ponds in 2022–2023 are 37.5% and 65.9%, respectively.
Mishra et al. (2020) derived annual detection frequencies for 867 small ponds in the Ferlo region of Senegal for 1 year, 2018, from Landsat and PlanetScope data. The APWC-derived surface water classification performed better than the Landsat classification method used by Mishra et al. (2020), which reported annual detection frequencies of 21.6% for small ponds and 31.7% for all ponds. PlanetScope are high-resolution (3-m) surface reflectance data. Mishra et al. (2020) report that water classification from these data performed considerably better, with an annual detection frequency of 97.3% for small ponds. This demonstrates PlanetScope's promise for monitoring surface water in small ponds such as those in the Ferlo region. However, PlanetScope data can be challenging to work with, particularly for time series applications over large domains, due to calibration issues, inadequate data flags, and the large volume of data (Mishra et al., 2020; Wang et al., 2021; Mullen et al., 2023). More recent studies by Mullen et al. (2023) using PlanetScope data to identify the seasonal dynamics of small ponds (< 10,000 m2) in the Alaskan tundra indicate that the more advanced Dove-R and Super Dove platforms and updated processing algorithms (Planet Labs, 2023) reduce, but do not fully resolve these issues. Key advantages of the APWC algorithm are its computational efficiency, use of longer and stable datasets, and ability to be implemented in the GEE cloud-computing environment (Slinski et al., 2019).
Water classification maps included in the SM show that seasonality over the 2022 and 2023 seasons can be inferred from the surface water estimates for 12 locations: 6 ACF ponds and 6 FEWS NET ponds. The APWC-derived surface water area estimates for 2022 and 2023 for the six ACF ponds were then compared to in situ observations of water depth collected over the same period. The remote sensing-derived and in situ time series shown in Figure 10 indicate that the timing of water availability in the ACF ponds is generally consistent between the two datasets. The APWC-derived seasonality could not be directly compared to the results reported by Mishra et al. (2020) or the WOfS datasets for 2022 and 2023.
Surface water classification at all locations was limited by data gaps due to missing SAR data and cloud/cloud shadow contamination of MNDWI data. Missing SAR data for July 2022 and 2023 limited the assessment of water availability during the onset of the rainy seasons, when ephemeral ponds in the study area begin to fill. However, APWC-derived surface water extent estimates for this critical period are available in the longer dataset used to derive the occurrence maps (covering 2015–2023). Cloud cover and cloud shadows also impacted the surface water classification results, but they are a minor limitation to the application of the APWC method in this region.
Surface water classification was also impacted by tree cover, algae, and floating vegetation. Classification in areas impacted by vegetation could be improved by including SAR data with longer wavelengths in the APWC algorithm, which better penetrates vegetation. The NASA-ISRO SAR (NISAR) mission (launch expected in 2025) will use L-band radar, which has a longer wavelength than the C-band data provided by the Sentinel 1A sensors. The longer wavelength will help overcome this issue, but is not likely to eliminate it.
These results demonstrate that the APWC method is a viable approach for assessing surface water availability in the Ferlo region of Senegal. The method was not able to generate surface water time series for all ponds, showing the importance of physical characteristics of the ponds such as size and presence of vegetation overlaying the water surface as well as gaps in the satellite datasets, on method performance. However, seasonality is not expected to vary widely across the region. Therefore, changes to model parameters to improve performance at locations where the APWC method was successful may be extended to nearby locations where seasonality was not captured by the method.
4.2 Research question 2: to what extent can these indicators be used to assess the model representation of surface water availability?
The APWC-derived surface water area and modeled water depth time series shown in Figure 12 indicate that, while the timing of the ponds' fill and start to dry up is generally consistent between the datasets, there are two notable differences. The remote sensing-based dataset identified water in June 2022 at four locations (SN39, SN40, SN50, and SN51), while the model simulations showed pond filling starting in July 2022. In addition, the remote sensing-based dataset indicated that all six ponds dried up by December during the 2022 and 2023 seasons, while the model simulations showed the ponds containing water past December. The differences between the two datasets may be attributed to errors in model parameters (e.g., pond surface area, watershed area, and maximum pond depth), model forcing data (e.g., precipitation and open-water evaporation), and/or surface water classification. Furthermore, the runoff estimation method could be a source of error, and future efforts will evaluate the potential of using other techniques, such as the saturation excess principles, to simulate the rainfall-runoff process. Like the ACF ponds, missing SAR data for July 2022 and 2023 limited the assessment of water availability during the onset of these rainy seasons, but APWC-derived surface water extent estimates for July are available in the longer dataset used to derive the occurrence maps. This assessment shows the utility of satellite remote sensing-based surface water in assessing model simulations of surface water availability in the Study Area. The method is subject to the previously mentioned challenges due to the physical characteristics of the ponds and data gaps in the satellite datasets.
4.3 Concluding remarks
Remote sensing-based surface water classification using high-resolution satellite datasets provides an important opportunity to assess surface water availability in pastoral and agropastoral regions, where surface water is critical to community livelihoods. This study demonstrates the ability of the APWC method to generate surface water extent datasets for ponds in the Ferlo region of northern Senegal that can be used to assess the representation of water availability by the FEWS NET Water Point Viewer. This dataset is an important tool to assess the performance of hydrologic models that would not otherwise be available in data-sparse areas such as northern Senegal. Future studies will assess to extent the new surface water estimates can be used to tune model parameters to improve the performance of the FEWS NET Water Point Viewer. This may be done by comparing modeled estimates of surface water area to satellite-derived estimates. Future studies will also assess improvement to satellite-based estimates of surface water area in the Sahel using datasets from new sensors, e.g., NISAR L-band data and PlanetScope Dove-R/Super Dove platforms.
Data availability statement
The raw data supporting the conclusions of this article will be made available by the authors, without undue reservation.
Author contributions
KS: Conceptualization, Data curation, Funding acquisition, Investigation, Methodology, Software, Supervision, Visualization, Writing – original draft, Writing – review & editing. GS: Investigation, Methodology, Writing – review & editing. AA: Investigation, Writing – review & editing. SS: Writing – review & editing. AM: Writing – review & editing. JR: Writing – review & editing. EF: Data curation, Investigation, Writing – review & editing. SY: Data curation, Writing – review & editing. CF: Writing – review & editing. AH: Writing – review & editing. MJ: Writing – review & editing.
Funding
The author(s) declare that financial support was received for the research and/or publication of this article. This project was supported by the following funding agencies: NASA Applied Sciences Program under the Water Resource Program, grant # 80NSSC22K0930 entitled Earth Observation-Based Monitoring and Forecasting of Rangeland Water Resources and NASA Harvest Consortium, grant # 80NSSC17K0625 entitled NASA Harvest: NASA's Global Food Security and Agriculture Consortium; Bureau of Humanitarian Assistance, U.S. Agency for International Development, under the terms of PAPA BHA22H00005 FAMINE EARLY WARNING SYSTEMS NETWORK (FEWS NET); Azione contro la Fame Italia foundation, through the project Western Sahelian Pastoral Early Warning System -PEWS -A tool toward resilience to climate change and climate variability.
Acknowledgments
Landsat Collection 2 Level 2 Science Products are provided courtesy of the U.S. Geological Survey. Data collection and curation support were provided by Chérif Assane Diallo and Bamba Ndiaye of Action Contre la Faim, Dakar, Senegal. Computing resources have been provided by NASA's Center for Climate Simulation (NCCS). Any use of trade, firm, or product names is for descriptive purposes only and does not imply endorsement by the U.S. Government.
Conflict of interest
The authors declare that the research was conducted in the absence of any commercial or financial relationships that could be construed as a potential conflict of interest.
Publisher's note
All claims expressed in this article are solely those of the authors and do not necessarily represent those of their affiliated organizations, or those of the publisher, the editors and the reviewers. Any product that may be evaluated in this article, or claim that may be made by its manufacturer, is not guaranteed or endorsed by the publisher.
Author disclaimer
The opinions expressed in this paper are those of the authors and do not necessarily reflect the views of the U.S. Agency for International Development, but do represent the views of the U.S. Geological Survey.
Supplementary material
The Supplementary Material for this article can be found online at: https://www.frontiersin.org/articles/10.3389/frwa.2025.1320010/full#supplementary-material
References
Allen, R. G., Pereira, L. S., Raes, D., and Smith, M. (1998). “Crop evapotranspiration,” in Guidelines for Computing Crop Water Requirements (Rome: Food and Agriculture Organization of the United Nations).
Bourgeau-Chavez, L. L., Smith, K. B., Brunzell, S. M., Kasischke, E. S., Romanowicz, E. A., Richardson, C. J., et al. (2005). Remote monitoring of regional inundation patterns and hydroperiod in the greater everglades using synthetic aperture radar. Wetlands 25, 176–91. doi: 10.1672/0277-5212(2005)025[0176:RMORIP]2.0.CO;2
Brakenridge, G. R., and Kettner, A. (n.d.). DFO Flood Event 4507, Dartmouth Flood Observatory. Boulder, Colorado: University of Colorado. http://floodobservatory.colorado.edu/Events/2017India4507/2017India4507.html (Accessed November 1, 2018).
Caliński, T., and Harabasz, J. (1974). A dendrite method for cluster analysis. Commun. Statist. 3, 1–27. doi: 10.1080/03610927408827101
Carroll, M., Wooten, M., DiMiceli, C., Sohlberg, R., and Kelly, M. (2016). Quantifying surface water dynamics at 30 meter spatial resolution in the North American High Northern Latitudes 1991–2011. Remote Sens. 8:622. doi: 10.3390/rs8080622
Chapman, B., McDonald, K., Shimada, M., Rosenqvist, A., Schroeder, R., Hess, L., et al. (2015). Mapping regional inundation with spaceborne L-Band SAR. Remote Sens. 7, 5440–5470. doi: 10.3390/rs70505440
Cronshey, R. (1986). Urban Hydrology for Small Watersheds. 55. Fort Worth, Texas and Lincoln, Nebraska: US Department of Agriculture, Soil Conservation Service, Engineering Division.
Feng, M., Sexton, J. O., Channan, S., and Townshend, J. R. (2016). A global, high-resolution (30-m) inland water body dataset for 2000: first results of a topographic–spectral classification algorithm. Int. J. Digit. Earth 9, 113–133. doi: 10.1080/17538947.2015.1026420
FEWS NET (2023). Food Assistance Outlook Brief . Available online at: https://fews.net/sites/default/files/2023-08/FAOB_August%202023_Final_0.pdf (Accessed February 1, 2024).
Feyisa, G. L., Meilby, H., Fensholt, R., and Proud, S. R. (2014). Automated water extraction index: a new technique for surface water mapping using landsat imagery. Remote Sens. Environm. 140, 23–35. doi: 10.1016/j.rse.2013.08.029
Funk, C., Peterson, P., Landsfeld, M., Pedreros, D., Verdin, J., Shukla, S., et al. (2015). The climate hazards infrared precipitation with stations—a new environmental record for monitoring extremes. Scient. Data 2:1. doi: 10.1038/sdata.2015.66
Gorelick, N., Hancher, M., Dixon, M., Ilyushchenko, S., Thau, D., Moore, R., et al. (2017). Google earth engine: planetary-scale geospatial analysis for everyone. Remote Sens. Environm. 202, 18–27. doi: 10.1016/j.rse.2017.06.031
Grace, K., and Davenport, F. (2021). Climate variability and health in extremely vulnerable communities: investigating variations in surface water conditions and food security in the West African Sahel. Populat. Environm. 42, 553–577. doi: 10.1007/s11111-021-00375-9
Halabisky, M., Yuan, F., Adimou, G., Birchall, E., Boamah, E., Burton, C., et al. (2024). A dynamic surface water extent service for Africa developed through continental-scale collaboration. Front. Environm. Sci. 12:1251315. doi: 10.3389/fenvs.2024.1251315
Huang, W., DeVries, B., Huang, C., Lang, M., Jones, J., Creed, I., et al. (2018). Automated extraction of surface water extent from sentinel-1 data. Remote Sens. 10:797. doi: 10.3390/rs10050797
Liniger, H., and Mekdaschi, R. (2019). Sustainable Rangeland Management in Sub-Saharan Africa-Guidelines to Good Practice. Washington D.C.; World Overview of Conservation Approaches and Technologies (WOCAT); World Bank Group (WBG), Washington DC, USA and Centre for Development and Environment (CDE), University of Bern, Switzerland.
Lloyd, S. (1982). Least squares quantization in PCM. IEEE Trans. Inform. Theory 28, 129–137. doi: 10.1109/TIT.1982.1056489
Masek, J. G., Vermote, E. F., Saleous, N. E., Wolfe, R., Hall, F. G., Huemmrich, K. F., et al. (2006). A landsat surface reflectance dataset for North America, 1990–2000. IEEE Geosci. Remote Sens. Letters 3, 68–72. doi: 10.1109/LGRS.2005.857030
McFeeters, S. K. (1996). The use of the normalized difference water index (ndwi) in the delineation of open water features. Int. J. Remote Sens. 17, 1425–1432. doi: 10.1080/01431169608948714
Mishra, V., Limaye, A. S., Muench, R. E., Cherrington, E. A., and Markert, K. N. (2020). Evaluating the performance of high-resolution satellite imagery in detecting ephemeral water bodies over West Africa. Int. J. Appl. Earth Observat. Geoinform. 93:102218. doi: 10.1016/j.jag.2020.102218
Mueller, N., Lewis, A., Roberts, D., Ring, S., Melrose, R., Sixsmith, J., et al. (2016). Water observations from space: mapping surface water from 25years of landsat imagery across Australia. Remote Sens. Environm. 174, 341–352. doi: 10.1016/j.rse.2015.11.003
Mullen, A. L., Watts, J. D., Rogers, B. M., Carroll, M. L., Elder, C. D., Noomah, J., et al. (2023). Using high-resolution satellite imagery and deep learning to track dynamic seasonality in small water bodies. Geophys. Res. Letters 50:e2022GL102327. doi: 10.1029/2022GL102327
Nicholson, S. E. (2013). The West African Sahel: a review of recent studies on the rainfall regime and its interannual variability. ISRN Meteorol. 2013, 1–32. doi: 10.1155/2013/453521
Pekel, J. F., Cottam, A., Gorelick, N., and Belward, A. S. (2016). High-resolution mapping of global surface water and its long-term changes. Nature 540, 418–422. doi: 10.1038/nature20584
Planet Labs, P. B. C. (2023). PlanetScope Product Specifications. Available online at: https://assets.planet.com/docs/Planet_PSScene_Imagery_Product_Spec_letter_screen.pdf
Pulvirenti, L., Chini, M., Pierdicca, N., Guerriero, L., and Ferrazzoli, P. (2011). Flood monitoring using multi-temporal COSMO-SkyMed data: image segmentation and signature interpretation. Remote Sens. Environm. 115, 990–1002. doi: 10.1016/j.rse.2010.12.002
Rebelo, L. M., Senay, G. B., and McCartney, M. P. (2012). Flood pulsing in the sudd wetland: analysis of seasonal variations in inundation and evaporation in South Sudan. Earth Interact. 16, 1–19. doi: 10.1175/2011EI382.1
Salamon, P., Mctlormick, N., Reimer, C., Clarke, T., Bauer-Marschallinger, B., Wagner, W., et al. (2021). “The new, systematic global flood monitoring product of the copernicus emergency management service,” in 2021 IEEE International Geoscience and Remote Sensing Symposium IGARSS (Brussels: IEEE), 1053–56.
Schumann, G. J. P., Neal, J. C., Mason, D. C., and Bates, P. D. (2011). The accuracy of sequential aerial photography and SAR data for observing urban flood dynamics, a case study of the UK summer 2007. Floods Remote Sens. Environm. 115, 2536–2546. doi: 10.1016/j.rse.2011.04.039
Senay, G. B., Velpuri, N. M., Alemu, H., Md Pervez, S., Asante, K. O., Kariuki, G., et al. (2013). Establishing an operational waterhole monitoring system using satellite data and hydrologic modelling: application in the pastoral regions of East Africa. Pastoralism 3, 1–16. doi: 10.1186/2041-7136-3-20
SERVIR (2024). Water ENvironment Dashboard for Observation in Support of Users in Ferlo, Senegal (WENDOU). (2024). Available online at: https://servirglobal.net/services/monitoring-ephemeral-water-bodies-ferlo-senegal (Accessed February 1, 2024).
Slinski, K., Fillol, E., and Yatheendradas, S. (2025). Water Depth Measurements for Rangeland Ponds in the Ferlo Region of Senegal, HydroShare. doi: 10.4211/hs.cf7fda39073543efbf3b8de7ae17d3f4
Slinski, K., Hogue, T. S., and McCray, J. E. (2019). Active-passive surface water classification: a new method for high-resolution monitoring of surface water dynamics. Geophys. Res. Lett. 46, 4694–4704. doi: 10.1029/2019GL082562
Slinski, K., McNally, A., Peters-Lidard, C., Senay, G., Hogue, T., McCray, J., et al. (2020). Rangelands Food Security Monitoring: Synthetic Aperture Radar (SAR) Applications for Famine Early Warning Systems. Boston, MA: AMS Annual Meeting.
Tappan, G. G., Cushing, W. M., Cotillon, S. E., Hutchinson, J. A., Pengra, B., Alfari, I., et al. (2016). Landscapes of West Africa: A Window on a Changing World. Garretson, SD: United States Geological Survey.
Torres, R., Snoeij, P., Geudtner, D., Bibby, D., Davidson, M., Attema, E., et al. (2012). GMES Sentinel-1 mission. Remote Sens. Environm. 120, 9–24. doi: 10.1016/j.rse.2011.05.028
Twele, A., Cao, W., Plank, S., and Martinis, S. (2016). Sentinel-1-based flood mapping: a fully automated processing chain. Int. J. Remote Sens. 37, 2990–3004. doi: 10.1080/01431161.2016.1192304
UCSB CHC (n.d.). CHIRPS v3.0. Available online at: https://www.chc.ucsb.edu/data/chirps3 (Accessed January 28, 2025).
USGS USAID, and FEWS NET. (n.d.). FEWS NET Water Point Viewer. Available online at: https://earlywarning.usgs.gov/fews/waterpoint/index.html (Accessed October 1, 2024).
Vermote, E., Justice, C., Claverie, M., and Franch, B. (2016). Preliminary analysis of the performance of the landsat 8/OLI land surface reflectance product. Remote Sens. Environm. 185, 46–56. doi: 10.1016/j.rse.2016.04.008
Wang, J., Yang, D., Chen, S., Zhu, X., Wu, S., Bogonovich, M., et al. (2021). Automatic cloud and cloud shadow detection in tropical areas for planetscope satellite images. Remote Sens. Environm. 264:112604. doi: 10.1016/j.rse.2021.112604
World Food Program Food and Agriculture Organization of the United Nations, Centre de Suivi Ecologique (Senegal), Commissariat National à la Sécurité Alimentaire (Senegal), and Famine Early Warning Systems Network. (2011). Comprehensive Food Security and Vulnerability Analysis (CFSVA): Livelihood Zone Descriptions. New York, NY: World Food Program.
Keywords: rangelands, pastoral, agropastoral, Sentinel 1, surface water classification, Landsat, water balance model
Citation: Slinski K, Senay GB, Adoum A, Shukla S, McNally A, Rowland J, Fillol E, Yatheendradas S, Funk C, Hoell A and Jasinski M (2025) In situ, modeled, and earth observation monitoring of surface water availability in West African rangelands. Front. Water 7:1320010. doi: 10.3389/frwa.2025.1320010
Received: 11 October 2023; Accepted: 27 May 2025;
Published: 27 June 2025.
Edited by:
Christof Lorenz, Karlsruhe Institute of Technology (KIT), GermanyReviewed by:
Rana Muhammad Adnan Ikram, Hohai University, ChinaAntonio Annis, University of Padua, Italy
Mili Lala, Birla Institute of Technology, Mesra, India
Seifu Admassu Tilahun, International Water Management Institute (IWMI), Ghana
Souleymane SY, University of Augsburg, Germany
Copyright © 2025 Slinski, Senay, Adoum, Shukla, McNally, Rowland, Fillol, Yatheendradas, Funk, Hoell and Jasinski. This is an open-access article distributed under the terms of the Creative Commons Attribution License (CC BY). The use, distribution or reproduction in other forums is permitted, provided the original author(s) and the copyright owner(s) are credited and that the original publication in this journal is cited, in accordance with accepted academic practice. No use, distribution or reproduction is permitted which does not comply with these terms.
*Correspondence: Kimberly Slinski, a2ltYmVybHkuc2xpbnNraUBuYXNhLmdvdg==