 Florence H. Mahay1*
 Patrick C. Valimba1Madaka H. Tumbo2
 Fides J. Izdori1
 Mohamed F. Mwabumba3
 Winfred B. Mbungu4
- 1Department of Water Resources Engineering, College of Engineering and Technology, University of Dar es Salaam, Dar es Salaam, Tanzania
- 2Water Institute, Dar es Salaam, Tanzania
- 3Nelson Mandela African Institution of Science and Technology, Arusha, Tanzania
- 4Department of Civil and Water Resources Engineering, Sokoine University of Agriculture, Morogoro, Tanzania
Water resources in many regions are increasingly under pressure due to population growth, agricultural expansion, and climate variability, which presents significant challenges in maintaining sustainable water supplies. The Little Ruaha catchment in Tanzania, a critical area for irrigation, water supply, and hydropower projects, is similarly affected by these pressures. This study was conducted to examine in detail the spatial–temporal variability and trends of rainfall indices to inform sustainable water resource management within the catchment. The study utilized the Mann-Kendall (MK) statistical test at a 95% confidence level (p ≤ 0.05), to assess the onset and cessation of annual and seasonal rainfall trends, with a particular focus on the November to April (NDJFMA) rainfall season. Rainbow statistical software was employed to evaluate rainfall normality and probabilities at 20, 50, and 80% risk levels. Results show decreasing trends in annual rainfall at Kilima station and Iringa Maji but were significant at Kilima station. On the other hand, increasing trends which were not significant at Iringa met and Mafinga stations. In terms of seasonal rainfall, the Iringa Met and Kilima stations demonstrated decreasing trends which were significant at Kilima. In addition, Mafinga and Iringa maji stations exhibited insignificant increasing trend. The results indicate that rain-fed crops in the southern and northeastern regions of the catchment are highly susceptible to drought stress, particularly during the short rainfall season (20% probability). Furthermore, there is a significant risk of water stress for sensitive crops in a typical season (50% probability) in these areas. The study recommends the cultivation of short-cycle crops or the implementation of irrigation strategies in vulnerable locations, along with enhancing water productivity and enforcing water permit regulations to ensure sustainable downstream flows. These findings are crucial for hydrological planning, irrigation management, and the overall sustainability of water resources in the Little Ruaha catchment.
Highlights
• The eastern and northeastern regions of the basin experience the lowest levels of seasonal rainfall.
• Dominant decreasing trends are observed for annual rainfall while seasonal rainfall patterns generally exhibit increasing tendency although not significant in some stations.
• Variations in the timing of rainfall onset and cessation, as well as the duration of the rainy season are observed. These changes are more pronounced in the eastern and central regions with the beginning and cessation dates that represent a risk at 20, 50, and 80% for return periods of 5, 2, and 4 years, respectively.
• The findings indicate that rain-fed crops in the southern and northeastern regions of the catchment are very susceptible to drying during the short rainfall season (at 20% probability) while for the regular season (at 50% probability), there is a 50 % likelihood of water stress damage to highly sensitive crops in these regions highlighting the need for irrigation.
1 Introduction
Africa is projected to experience increased unpredictability in precipitation patterns, particularly with a likely decrease in rainfall across most parts of sub-Saharan Africa (Nicholson, 2017). The rainfall patterns within sub-Saharan Africa demonstrate substantial variability reflecting the intricate interplay between local environmental factors and global anthropogenic influences (Knoben et al., 2019; Benyoussef et al., 2024). The erratic nature of the climate in this region results in disparate perceptions of changes in rainfall patterns, as the climates of individual countries are shaped by diverse natural regional systems and global anthropogenic activities. Consequently, it is imperative to understand the characteristics of precipitation patterns and their anticipated changes across various scales and levels. The understanding of rainfall characteristics holds significance in various domains, including agriculture, water resource management, and public health, particularly in developing countries (Hachigonta et al., 2008; Singh and Ranade, 2010; Mbungu and Kashaigili, 2017; Tumbo, 2018).
In East Africa, rainfall demonstrates significant variability across various spatial and temporal scales, presenting substantial challenges to livelihoods throughout the region. Research has identified instances of such variability, including droughts and protracted periods of rainfall (Bewket and Conway, 2007; Conway et al., 2009; Hamandawana and Chanda, 2013). Furthermore, the Intergovernmental Panel on Climate Change (IPCC, 2007) has projected an increase in the severity of climatic extremes in the future, underscoring the urgent necessity for comprehensive research on climate variability.
In Tanzania, several studies, such as those by Gulacha and Mulungu (2017), Nyembo et al. (2021), Pima et al. (2021), and Mwabumba et al. (2022), have investigated rainfall variability across different regions. However, the findings from these studies show inconsistencies, which can be attributed to diverse local factors such as variations in land use patterns and the distinct models used for climate simulation. These studies highlight the importance of conducting a comprehensive, site-specific analysis to accurately characterize the spatiotemporal variability and trends in rainfall. This involves a detailed examination of rainfall onset and cessation, duration, precipitation variations, extreme events, and drought occurrences across various regions (Francis and Mahongo, 2012; Mongi et al., 2010; Sigalla et al., 2023). Understanding these climatic characteristics is crucial, as they have significant implications for socioeconomic aspects, including food security, water resource management, and the agricultural sector (Amekudzi et al., 2015; Desa and Niemczynowicz, 1997; Hirsch et al., 1982; Patil and Kalange, 2015).
The agricultural sector is a vital contributor to national economies, providing food security, employment opportunities, and export earnings, among other benefits (Pawlak and Kołodziejczak, 2020). Despite its significance, this sector largely depends on rain-fed systems, making it highly susceptible to changes in rainfall patterns, which can have immediate effects on agricultural productivity and the overall GDP (Mbungu and Kashaigili, 2017). The long-term impacts of climate change on rainfall patterns pose additional risks to the agricultural sector. Climate change can alter the timing, intensity, and distribution of rainfall, leading to reorganization of river networks and shifts in water availability, which directly affect hydrological regimes and agricultural sustainability (Abed-Elmdoust and Kerachian, 2012; Gao et al., 2017). These changes, particularly under scenarios of increased rainfall variability, can lead to critical alterations in river system behavior and have profound implications for managing agricultural water resources (Sarker et al., 2019; Singhal et al., 2024).
Rainfall variability and trends are crucial for informed water resources planning and management in any geographical setting (Duncan et al., 2013). The analysis is crucial for advancing our scientific understanding of rainfall variability and trends, particularly, as climate change and variability are perceived as being the greatest threats to agricultural production and food security in sub-Saharan African countries (Alemu and Bawoke, 2019). This study in the Little Ruaha catchment, will leverage on the modified Mann-Kendall which combines the Mann-Kendall non-parametric test and Sen’s slope estimator for quantifying the magnitude, which are well-established methods preferred by the World Meteorological Organization for their robustness in analysing environmental data and detecting trends (Yue and Pilon, 2004). The preference for non-parametric statistical tests is justified by their suitability for data exhibiting significant variance, different data scales, and resilience to extreme values and skewed distributions – characteristics often observed in environmental datasets (Da Silva et al., 2015). Spatial interpolation was conducted using the Inverse Distance Weighted method in ArcMap, a commonly employed technique that has demonstrated reliable performance in climate data interpolation. Similar methodological approaches have been effectively utilized in Tanzania and comparable regions, providing valuable insights into local climate variability (Sigalla et al., 2023).
The Little Ruaha catchment in Tanzania, is an important resource for the agricultural sector, supporting activities such as irrigation schemes, water supply, and contributing significant inflows to the Mtera reservoir and the Julius Nyerere Hydropower Plant (JNHPP) for hydropower production. However, this catchment faces increasing pressures from population growth, intensified agricultural activities, and climate variability, leading to fluctuations in rainfall (Sigalla et al., 2023). This situation highlights the need for a comprehensive and location-specific analysis of the spatiotemporal variability and trends of rainfall indices, as it is essential for communities in the catchment who depend on agriculture for their livelihoods.
This study aims to analyze the rainfall patterns in the Little Ruaha catchment, focusing on critical aspects such as onset, cessation, duration, volume, and frequency. By examining these parameters, the study seeks to provide essential insights for hydrological and agricultural planning. Given the increasing unpredictability of rainfall patterns due to climate change, this research will inform adaptive strategies that can help mitigate the adverse effects of rainfall variability on agricultural productivity and water resource management. The findings will be particularly valuable for local farmers and water managers in optimizing irrigation scheduling and improving crop yields, while simultaneously ensuring the sustainable use of the catchment’s water resources. Moreover, the results will contribute significantly to regional efforts in implementing Integrated Water Resource Management (IWRM), fostering the development of resilient agricultural systems, and safeguarding food security and livelihoods. Ultimately, this study will not only support the effective management of water resources within the Little Ruaha catchment but also provide a framework that can be applied to similar regions facing the dual challenges of climate variability and increasing demands on water resources.
2 Materials and methods
2.1 Study area
The Little Ruaha catchment is geographically situated between longitudes 35°2′E and 35°36′E, and latitudes 7°11′S and 8°36′S. The catchment is estimated to encompass an area of 6,210 km2, which includes the catchment area and drains portions of Iringa Municipal, as well as Iringa, Kilolo, and Mufindi Districts within the Iringa Region. It is located within the Ihemi Cluster, which is one of six clusters constituting the Southern Agricultural Growth Corridor of Tanzania (SAGCOT). The climate of the catchment is characterized by high variability, predominantly exhibiting a unimodal pattern, with a single rainy season occurring from November to April. Average annual rainfall ranges from 500 mm in the lowlands to 700 mm in the highlands of Iringa. The average annual temperature fluctuates between 18°C at higher altitudes and approximately 28°C in lowland areas. Elevation within the catchment varies from 698 to approximately 2,300 meters above mean sea level (m. asl) (Figure 1). The predominant soil types in the region include Cambisols, Fluvisols, Leptosols, Lixisols, Nitisols, and Solonetz (Mbungu and Kashaigili, 2017).

Figure 1. Location map of the study area showing little Ruaha catchment [Data source: national bureau of statistics; shuttle radar topography mission (SRTM)].
The catchment area supports a diverse array of socioeconomic activities, with agriculture identified as the predominant sector, employing a significant portion of the population in the surrounding regions (Ires, 2021). Additional activities include fishing, cattle rearing, beekeeping, and tourism, which are notably influenced by the presence of various wildlife habitats within Ruaha National Park (URT, 2012).
2.2 Methodological approach
Figure 2 presents a systematic approach for analyzing rainfall data, beginning with data collection and rigorous quality control, including validation and homogeneity testing to ensure accuracy. Following these initial steps, the study conducts trend detection using the modified Mann-Kendall test to address serial autocorrelation, and Sen’s slope estimator is applied to quantify trend magnitude. Subsequently, rainfall characteristics such as onset, cessation, duration, and intensity are analyzed to capture seasonal variations. Spatial interpolation and risk probability analyses further enhance the spatial and risk assessments, providing a comprehensive view of rainfall distribution and variability across selected stations. Detailed descriptions of each methodological step are provided in the following sections.
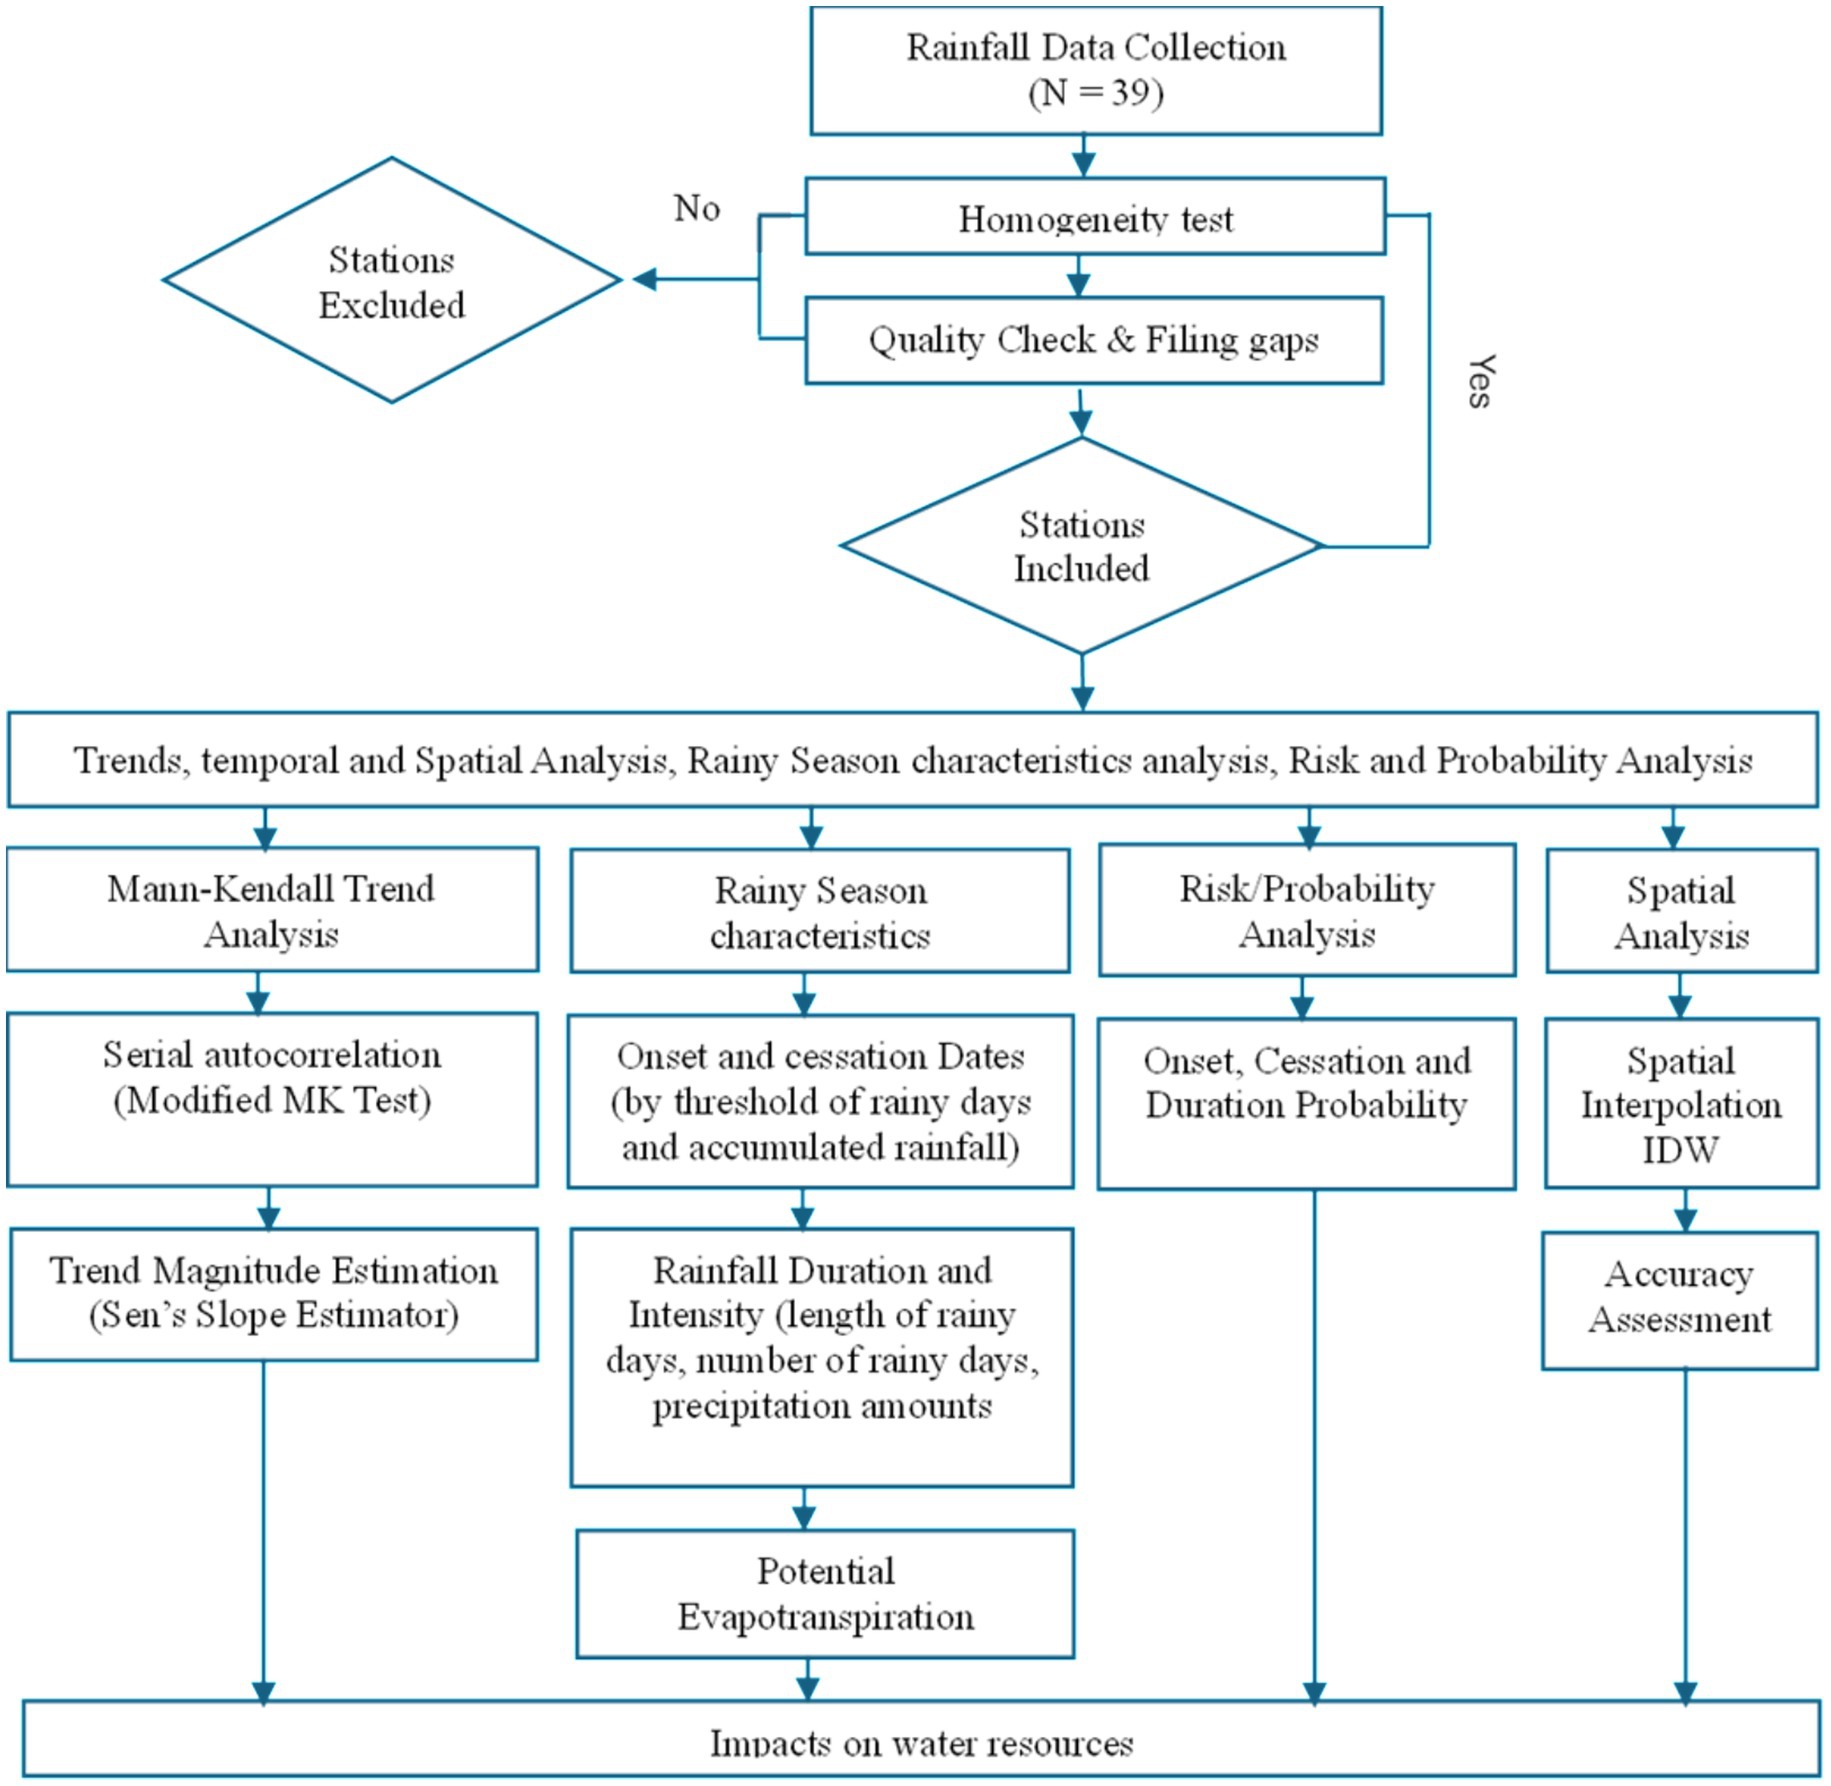
Figure 2. Flow chart of the methodological approach used in this study.
2.2.1 Data acquisition and quality assessment
Historical daily rainfall, for various periods, were collected from various sources within and around the Little Ruaha catchment. The data included those from the meteorological stations provided by the Tanzania Meteorological Authority (TMA) and data maintained by the Rufiji Basin Water Board and other organizations or agencies. Rainfall data for various periods from 39 stations were collected and checked for quality. For this study, analysis required that the data be both homogeneous and independent to ensure valid results. Homogeneity was particularly important to confirm that all observations stemmed from a single population. The RAINBOW (Raes et al., 2006) tool’s homogeneity test, which assesses cumulative deviations from the mean by examining their maximum values and range, was applied to data from the Little Ruaha catchment. This allowed for an evaluation of the consistency and reliability of the time series dataset used in the analysis.
Data quality control was conducted by examining the stations and their respective timescales, ensuring that data gaps did not exceed 10% of the overall study period, in accordance with the recommendations of Larbi et al. (2018) and Nkiaka et al. (2017). A comprehensive quality assessment of the dataset was executed, emphasizing data consistency and the identification of any missing information. The resolution of data gaps involved the application of regression equations; specifically, linear regression for continuous variables and logistic regression for categorical variables, as demonstrated in previous studies (Mbungu and Kashaigili, 2017; Mbungu et al., 2012). Moreover, data from other stations with analogous characteristics but less comprehensive datasets were utilized to address gaps, thereby enhancing the robustness of the primary dataset through the integration of data matching and regression analysis.
To assess the uncertainty introduced through regression-based infilling, a Leave-One-Out Cross-Validation (LOOCV) analysis was performed for each rainfall station. The LOOCV procedure involved systematically excluding one observed value at a time, predicting it using linear regression from the other stations, and comparing it to the actual value. The performance of the infilling was quantified using Mean Absolute Error (MAE) and Root Mean Square Error (RMSE). The detailed results of the LOOCV analysis are provided in Supplementary Table S1, which demonstrates that the infilling method yielded low error margins and preserved the reliability of the reconstructed time series.
After a thorough quality assessment and the rectification of any data deficiencies, the rainfall data deemed suitable for examining the characteristics and temporal patterns of precipitation were employed. Furthermore, the study incorporated maximum and minimum temperature data from the Iringa Meteorological Station to analyze additional characteristics of the rainy season, including onset, cessation, and season duration. This station was selected due to its provision of comprehensive temperature data for the entire study area.
2.2.2 Annual and seasonal analysis of trends and variability
To fully explore rainfall variations and trends triggered by climate change, the assessment was conducted for the period from 1961 to the end of the available data for all four studied stations. The study utilized the Mann-Kendall (MK) statistical test for trend analysis to determine the change of the random variables over the study area at different time scales depending on the data availability. This non-parametric method is a robust tool for identifying trends in environmental data time series and is recommended by the World Meteorological Organization (WMO). The Mann-Kendall test is straightforward, resistant to outliers, and capable of handling missing data, making it a reliable approach for analysing changes in precipitation patterns over time (Mohammed et al., 2018). The magnitudes of the trends in the annual and seasonal rainfall were estimated over the last four decades and their statistical significance for each station and the entire catchment were determined. The MK test was used to calculate annual and seasonal rainfall trends at a 95 percent confidence level (Kumar et al., 2017). The magnitude of trends was estimated using Sen’s slope estimator, and 95% confidence intervals were computed to quantify the uncertainty around the trend estimates.
The statistical significance level (α) was used to determine whether to accept the alternative hypothesis (Ha) of the presence of a monotonic trend or the null hypothesis (Ho) of the absence of a monotonic trend.
The MK tests (Equations 1–5) calculate the slope of the line generated by graphing the variable of interest against time, but they only consider the sign of the slope, not the magnitude (Ismail and Oke, 2012). The MK statistic S is calculated in the following way:
Where xj and xk are sequential data values for the time series data of length n. The sgn series is defined as:
The mean of S is 0 whenever there is an identical and independent dataset distribution, whereas the variance of S is provided by Equation 3.
where ti denotes the length of a certain tie. If the data series has tied values, ti signifies the sum of all ties and is only used if the data series contains tied values. Equation 4 shows how to calculate the standard normal variate Z. (4):
If Z is negative, the trend is downward, and if Z is positive, the trend is upward. If the absolute value of Z is greater than Z1−/2, the null hypothesis of no trend is rejected. Z1−/2 is calculated from conventional normal cumulative distribution tables. After determining the direction of the trend with the Mann–Kendall test, the amplitude of the trends was determined using Sen’s slope estimator (Equations 5, 6). The method calculates the change in slope using a linear model, and the variance of the residuals should be constant throughout time (Sen, 1968).
where Qi is the slope between data points Xj and Xk, Qmed is the median slope estimator which reflects the direction of the trend in the data.
In time series analysis, particularly in environmental datasets such as rainfall, there is often the risk of autocorrelation, which can skew the results of trend detection by increasing Type I error rates. To mitigate this, the study employed the modified Mann-Kendall (MMK) test, as proposed by Hamed and Rao (1998). Autocorrelation can distort the statistical reliability of detected trends, as noted in studies by Ameen et al. (2024) and Mohammed et al. (2018). The MMK test addresses this issue by applying a variance correction that adjusts for the presence of serial correlation within the data. The analysis was carried out in R-Studio (version 4.2.1) using the ‘modifiedmk’ package, which specifically implements the modified Mann-Kendall procedure. This method corrects the test statistic by adjusting the effective sample size, minimizing the impact of serial dependence on trend detection. Consequently, this approach ensures that the identified trends in the rainfall data reflect real changes rather than being the result of autocorrelation within the dataset.
The use of variance-corrected methodologies like the MMK test has become a standard practice in hydrological studies and has been validated as a robust tool for time series analysis in cases where autocorrelation may be present, as supported by research from Balogun et al. (2023).
To account for the potential influence of serial correlation on trend detection, lag-1 autocorrelation coefficients (ACF) were calculated for each rainfall time series, covering both annual totals and seasonal rainfall. The lag-1 ACF values varied across stations, with most exhibiting weak to moderate autocorrelation, while Kilima station showed a notably high value of 0.889, suggesting strong temporal persistence in its rainfall series. Given the presence of serial correlation, the modified Mann–Kendall test incorporating the Hamed–Rao variance correction (Hamed and Rao, 1998) was employed. This approach adjusts the variance of the Mann–Kendall statistic to account for autocorrelation without altering the original data series. The corrected p-values from this test, along with Sen’s slope estimates and their associated 95% confidence intervals, were reported to provide a robust and statistically sound assessment of monotonic trends in rainfall.
Additionally, this study defines rainfall variability as the fluctuations in seasonal and annual precipitation relative to the long-term average. Annual and seasonal rainfall patterns over extended periods are regarded as indicators of the potential impacts of climate change (Jones et al., 2015). Consequently, an analysis was undertaken to assess any potential changes in wet and dry seasons by examining both long-term and short-term patterns, as well as the onset, cessation, and variations in annual and seasonal rainfall.
2.2.3 Rainy season characteristics
The rainy season can be characterized by the distribution of the rain (amount and time), the start and cessation dates, dry spells, lengths of the season and precipitation amount (Yonah et al., 2006). The rainy season’s characteristics are crucial for agricultural and water resource management (Omotosho et al., 2000). For example, the onset of the season is useful for researching seasonal variations and determining planting and harvesting schedules. The duration of the rainy season helps in predicting crop yields and planning irrigation systems. Precipitation patterns during this time are studied to assess water availability and manage reservoirs for drinking water and hydroelectric power generation. Overall, understanding and monitoring the characteristics of the rainy season are essential for sustainable agriculture and efficient water resource management.
Numerous techniques and methods have been formulated and are used to estimate the onset and cessation of the rainy season (Laux et al., 2008; Stern et al., 1981; Sivakumar, 1988; Segele and Lamb, 2005; Marteau et al., 2009, 2011). This study used a combination of thresholds for rainy days, accumulated or total rainfall, the number of rainy days, and wet or dry spell lengths to determine the onset and cessation dates and length of the rainy season. For the onset, the day is rainy if at least 1 mm was observed, and the accumulated rainfall totals 20 mm over 3 days with at least 3 rain days (Stern et al., 1982). This potential start can be a false start if, a dry spell of 10 days or more within the next 30 days occurs afterwards (Ojo and Ilunga, 2018). Therefore, this study considered a dry spell not exceeding 7 days in the next 21 days (Marteau et al., 2009; Recha et al., 2012; Edao et al., 2018). Since the study areas exhibit a Unimodal rainfall pattern (long rains from November to April), October 1st was considered as the earliest possible planting date for the study area. 1st October was considered the earliest possible onset date to capture those few onsets that occurred before November during the November – April (NDJFMA) rainfall season. These methods result in diverse patterns and trends.
As for cessation dates, the potential evapotranspiration (PET) and water balance criteria were used. Potential evapotranspiration (PET) was calculated using the Modified Hargraves methods (Cobaner et al., 2017), which consider the rainfall and maximum and minimum temperature datasets. The PET was then used to calculate the water balance with the threshold of the soil moisture holding capacity of 100%. The Cessation date was computed based on the fraction of evapotranspiration and the threshold used is accumulated 10 days rainfall less than 0.5 of evapotranspiration (Omay et al., 2023). Further, analysis of rainfall duration (length of season), seasonal rainfall amounts, and number of rainy days was carried out to determine the rainfall seasonal characteristics of the study area.
To improve the spatial representativeness of PET across the study area, particularly given the variation in elevation and terrain, PET was computed for all four rainfall stations using gridded data from the Climatic Research Unit (CRU). This mitigates the bias that might arise from relying on a single high-altitude station and provides a more spatially consistent estimate of atmospheric demand. The reanalysis PET values were subsequently used to determine rainfall cessation dates for each station.
The datasets for each station and year were computed separately from 1st January 1960 to the end year of available data at a particular station to analyze the characteristics of the NDJFMA rainfall season. An open-source R-statistical Package Climate Data Tool (CDT), V 7.0 developed and maintained by the International Research Institute for Climate and Society (IRI), Columbia University (Acharya et al., 2021; Dinku et al., 2022), was used for the data organization, quality control and determination of the rainfall onset and cessation dates for the studied locations.
In this study, the risk or probability levels of onset, cessation and duration of the rainy season were also determined because of the high variability that is associated with the rainfall season characteristic over the catchment.
Due to the high variability associated with the rainfall season characteristics over the catchment, risk probability levels of onset, cessation and duration of the rainy season were computed. Various probability values (20, 50, and 80%) were established for both non-exceedance and exceedance likelihood. The curve fitting was performed utilizing the maximum likelihood process, whereas the probabilities were evaluated employing the Weibull method (Raes et al., 2006). The study utilized the Kolmogorov–Smirnov test and assessed the proximity of the fitted line to the data points to ascertain if the data for rainy season features at each station exhibited a normal distribution (Raes et al., 2006). The datasets for each rainy season index and climatic station that do not fit into a normal distribution were converted using four methods: (a) square root, (b) logarithmic, (c) square method, and (d) cube root technique. The study employed the Rainbow software to conduct frequency analysis and assess the homogeneity of hydrometeorological data (Raes et al., 2006). In addition, the study utilized ArcMap 10.7.1 and QGIS 2.6.0 software to perform spatial analysis. The Inverse Distance Weighting (IDW) method was used to interpolate and generate spatial rainfall distribution maps across the study area. The accuracy of the IDW interpolation was evaluated using three statistical performance metrics: the coefficient of determination (R2), Mean Absolute Error (MAE), and Root Mean Square Error (RMSE), following the approach of Yasin et al. (2024).
To complement the IDW method and improve spatial representation, a gauge–satellite blended interpolation approach was also employed. This method involved combining observed rainfall data from ground stations with satellite-based estimates from the Climate Hazards Group InfraRed Precipitation with Station data (CHIRPS). For each station, the arithmetic mean of the CHIRPS value and the corresponding gauge observation was calculated to generate the blended estimate. This approach aimed to minimize biases present in either data source and to harness the high spatial coverage of satellite data alongside the local accuracy of in-situ measurements.
The performance of both IDW and gauge–satellite blended methods was assessed using RMSE, MAE, and Bias, calculated by comparing interpolated values against the observed station data. Results indicated that the gauge–satellite blended approach consistently outperformed the IDW method, yielding lower error values and demonstrating improved accuracy in representing the spatial variability of rainfall within the study catchment.
2.2.4 Frequency analysis of annual maximum rainfall
Frequency analysis of annual maximum daily rainfall was performed using the Weibull and log-normal distributions. Parameters were estimated using Maximum Likelihood Estimation (MLE), and model performance was evaluated using the Kolmogorov–Smirnov (KS) test, Akaike Information Criterion (AIC), and Q–Q plots. Log-transformation was applied prior to fitting the log-normal model to assess improvements in distributional fit.
The Weibull distribution was chosen due to its common application in hydrology for modelling extremes (Gumbel, 1958; Stedinger et al., 1993; Hosking and Wallis, 1997), while the log-normal served as a comparative model suitable for skewed rainfall data (Wilks, 2011). The KS test was used to assess goodness-of-fit (Chakravarti et al., 1967), and AIC was applied to compare model parsimony (Akaike, 1974).
3 Results and discussion
The primary focus of this study was to analyze annual and seasonal rainfall trends, including the timing of rainfall onset and cessation, as well as other rainfall characteristics during the November to April rainfall season. The objective of this study was to characterize rainfall patterns and dynamics within the Little Ruaha catchment. To evaluate the effectiveness of spatial rainfall interpolation in the Little Ruaha catchment, two methods, Inverse Distance Weighting (IDW) and gauge–satellite blending,were compared using observed rainfall data from Iringa Maji, Iringa Met, Kilima, and Mafinga stations. The objective was to assess how well each method represents the spatial distribution of mean annual rainfall in a region characterized by complex topography and variable climate.
The IDW method yielded mean annual rainfall estimates ranging from 675.29 mm to 1230.10 mm but performed poorly in terms of accuracy, with a Root Mean Square Error (RMSE) of 440.50 mm and Mean Absolute Error (MAE) of 419.86 mm. This high error suggests that IDW’s distance-based weighting fails to adequately account for the spatial heterogeneity inherent in the catchment’s rainfall patterns.
In contrast, the gauge–satellite blended method, which combines observed values with CHIRPS satellite data, significantly improved estimation accuracy (RMSE = 45.34 mm, MAE = 40.79 mm). These results align with regional studies (e.g., Dinku et al., 2022), which show that blending improves spatial representation of rainfall, especially in data-sparse or topographically varied areas. The improved performance of the blended method supports its application in hydrological modelling and water resources planning in the catchment.
3.1 Annual and seasonal rainfall trends
Understanding long-term trends in extreme rainfall events is essential for evaluating hydrological risks and informing water resource management in the Little Ruaha Catchment. This section presents the results of trend analysis conducted on both annual and seasonal maximum daily rainfall series across selected stations. The analysis employed non-parametric methods to detect monotonic trends and quantify their magnitude. To ensure the robustness of the statistical results, the potential influence of serial correlation in the time series was also assessed and appropriately addressed prior to trend testing.
The analysis of lag-1 autocorrelation (ACF) across the four rainfall stations in the Little Ruaha catchment provides insights into the temporal persistence and memory of rainfall time series. Among the stations, Kilima exhibited the highest lag-1 ACF value of 0.89 for both annual and seasonal rainfall, indicating a strong autocorrelation in the data. This high persistence suggests that rainfall anomalies in one year are likely to be followed by similar anomalies in the subsequent year, which could be a result of underlying climatic drivers such as large-scale circulation patterns or sustained land surface changes (e.g., deforestation, elevation-linked feedbacks). The presence of strong autocorrelation at Kilima also emphasizes the importance of adjusting for serial correlation in trend analysis to avoid overstating significance, which was addressed in this study through pre-whitening procedures.
The results of the trend analysis for both annual and seasonal maximum daily rainfall are presented in Table 1. The spatial and temporal variability of rainfall trends in the Little Ruaha catchment reveals a highly heterogeneous pattern across the four analyzed stations. Kilima station stands out with a pronounced and statistically significant decreasing trend in both annual and seasonal rainfall. The annual Sen’s slope for Kilima is −34.73 mm/year with a 95% confidence interval of [−39.91, −29.55], and for the seasonal rainfall, the slope is −28.87 mm/year [−33.26, −24.47]. These strong negative trends are further supported by a high Mann-Kendall statistic of −0.64 (annual) and −0.62 (seasonal), both with p-values less than 0.001, indicating robust evidence of declining precipitation. Additionally, the high lag-1 autocorrelation value (0.88) suggests persistence in the rainfall decline over time. This finding aligns with previous studies such as Sigalla et al. (2023), who found evidence of rainfall reductions in high-altitude regions potentially driven by land use change and deforestation.
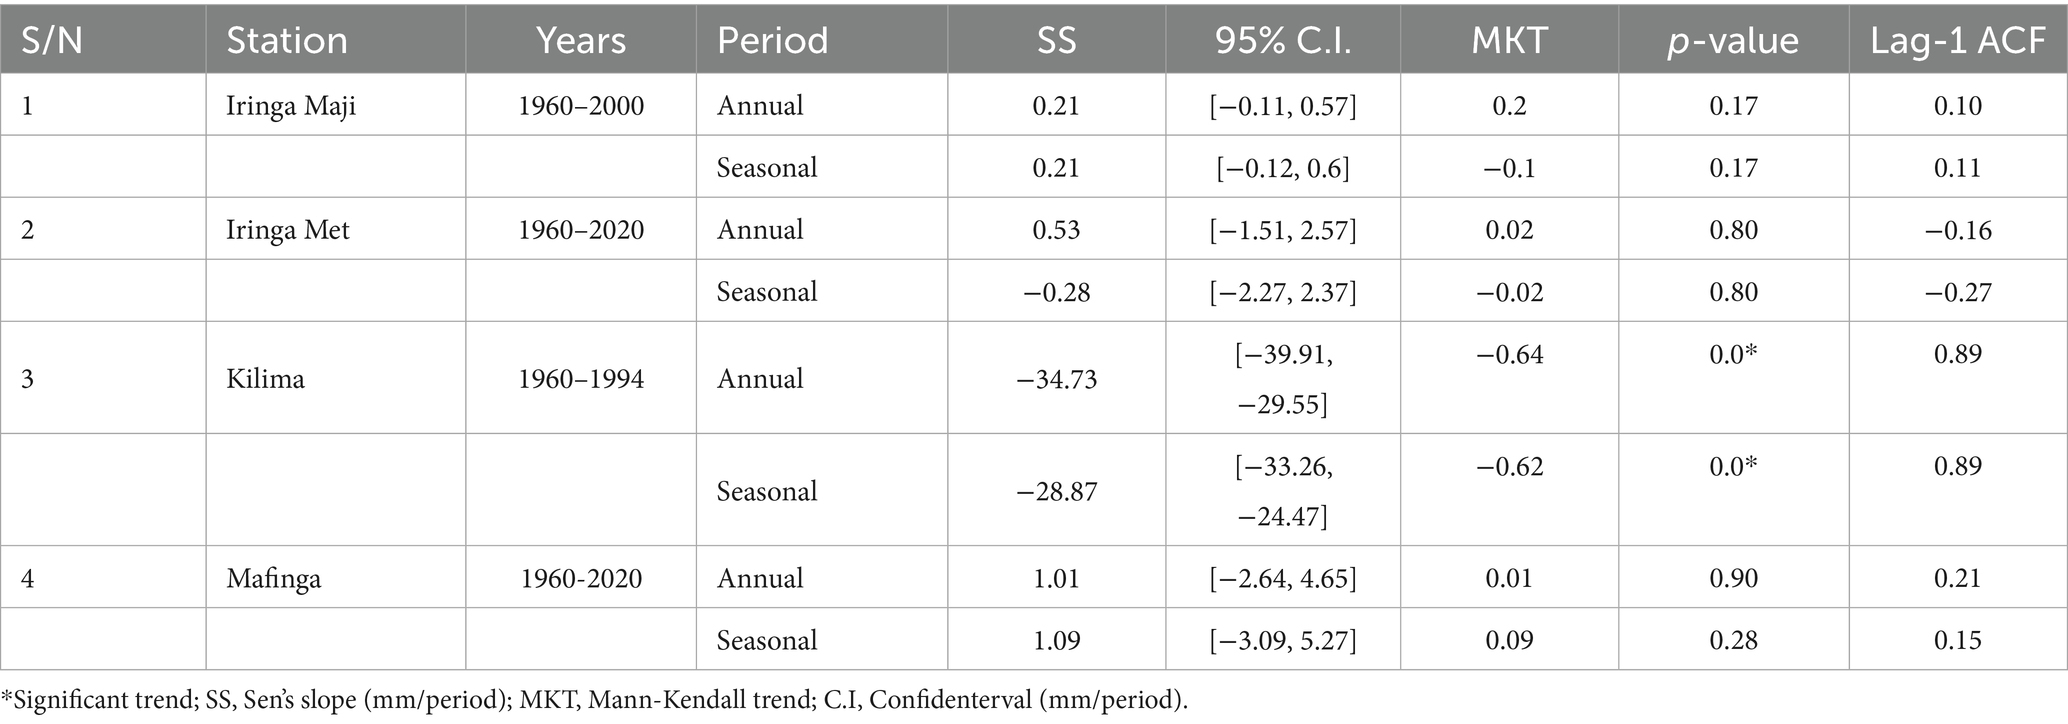
Table 1. Man-Kendal results for the annual and seasonal rainfall.
In contrast, the trends at Iringa Maji, Iringa Met, and Mafinga stations are not statistically significant. Iringa Maji showed a slight positive Sen’s slope of 0.21 mm/year for both annual and seasonal rainfall, with confidence intervals crossing zero [(−0.11, 0.57) annual and (−0.12, 0.60) seasonal], and p-values of 0.17. The Mann-Kendall statistics are low (0.2 and −0.1, respectively), indicating no meaningful trend. Similarly, Iringa Met showed negligible changes in rainfall with annual and seasonal Sen’s slopes of 0.53 mm/year and −0.28 mm/year, respectively, and wide confidence intervals, suggesting high variability. Mafinga also showed weakly positive trends (1.01 mm/year annual and 1.09 mm/year seasonal) with p-values above 0.28. These findings are consistent with studies such as Gulacha and Mulungu (2017), who found that many stations in central and southern Tanzania displayed no significant trends in long-term rainfall, and Samwel (2021), who observed station-level heterogeneity in rainfall behavior across western Kenya.
Overall, the contrasting trends between Kilima and the other stations underscore the localized nature of climatic changes. The significant drying in Kilima could be attributed to its unique topographical position and higher elevation, which may amplify sensitivity to broader climate dynamics or localized land use changes. The relatively stable or neutral trends in other stations suggest the absence of a basin-wide rainfall signal, further supporting findings from Mohammed et al. (2018), who documented spatially mixed rainfall trends in the Ethiopian Highlands. This spatial heterogeneity highlights the need for station-specific climate monitoring and adaptation strategies, particularly in highland areas where livelihoods and ecosystems are highly vulnerable to changes in rainfall patterns.
To assess the robustness of the identified rainfall trends, a sensitivity analysis was conducted comparing results derived from the gap-filled dataset with those from the raw (non-gapfilled) data. The Mann-Kendall trend test and Sen’s slope estimates were recomputed using the raw dataset and compared with the original analysis. The results revealed no change in the direction or statistical significance of trends across all stations. Minor differences in slope magnitude were observed but did not affect the interpretation. This confirms that the regression-based infilling did not introduce significant bias. The comparison is summarized in Supplementary Table S2.
3.2 Rainfall onset and cessation trends
The study area in the southern highlands of Tanzania has experienced notable changes in rainfall patterns in recent years. Table 2 illustrates the trends in the onset and cessation of rainfall within the study area. The tests for the rainfall onset trends are not statistically significant across most of the meteorological stations (p ≤ 0.05), except for the Kilima station, which demonstrates a significant decrease in the onset date of rainfall. This indicates a potential early onset of rainfall at these stations. Regarding rainfall cessations, the Mann-Kendall trend test reveals no significant changes across the study area. Overall, there is no significant seasonal shift observed in the study area; however, a notable increase in rainfall amounts is recorded. These results align with findings from a more localized study (Sigalla et al., 2023), which also reported a general increase in rainfall in the region. In contrast, these findings contradict those of other coarser-scale studies, which indicate a general decline in precipitation in Tanzania’s southern highlands (Mkonda and He, 2018).
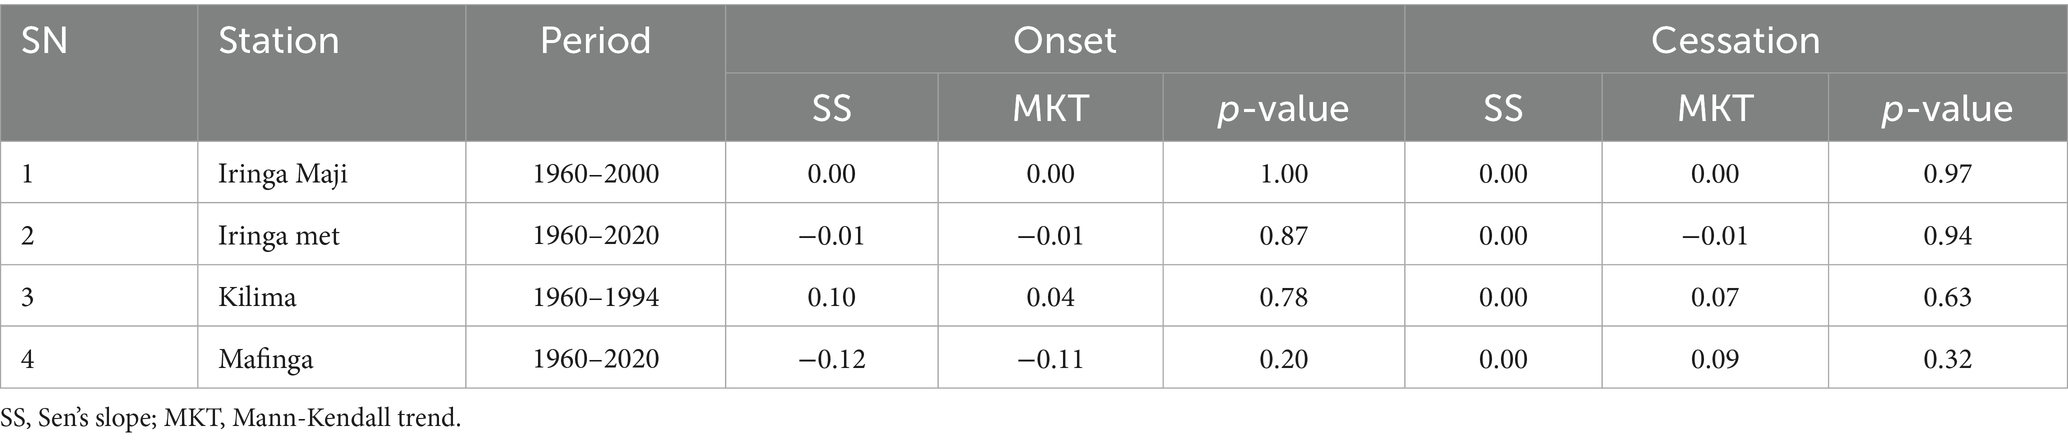
Table 2. Man-Kendal results for the seasonal rainfall.
The observed increase in rainfall amounts in the study area is in contrast with the broader trend of declining precipitation reported in the region. This could be due to localized microclimatic factors or potential differences in the study methodologies and data sources. The lack of significant changes in the onset and cessation of rainfall suggests that the agricultural systems in the region may not be experiencing major disruptions to their growing seasons, despite the overall increase in rainfall amounts (Alemu and Bawoke, 2019). Further research is needed to better understand the complex and sometimes contradictory patterns of climate variability in Tanzania’s southern highlands, and their implications for agricultural production and food security (Table 3).
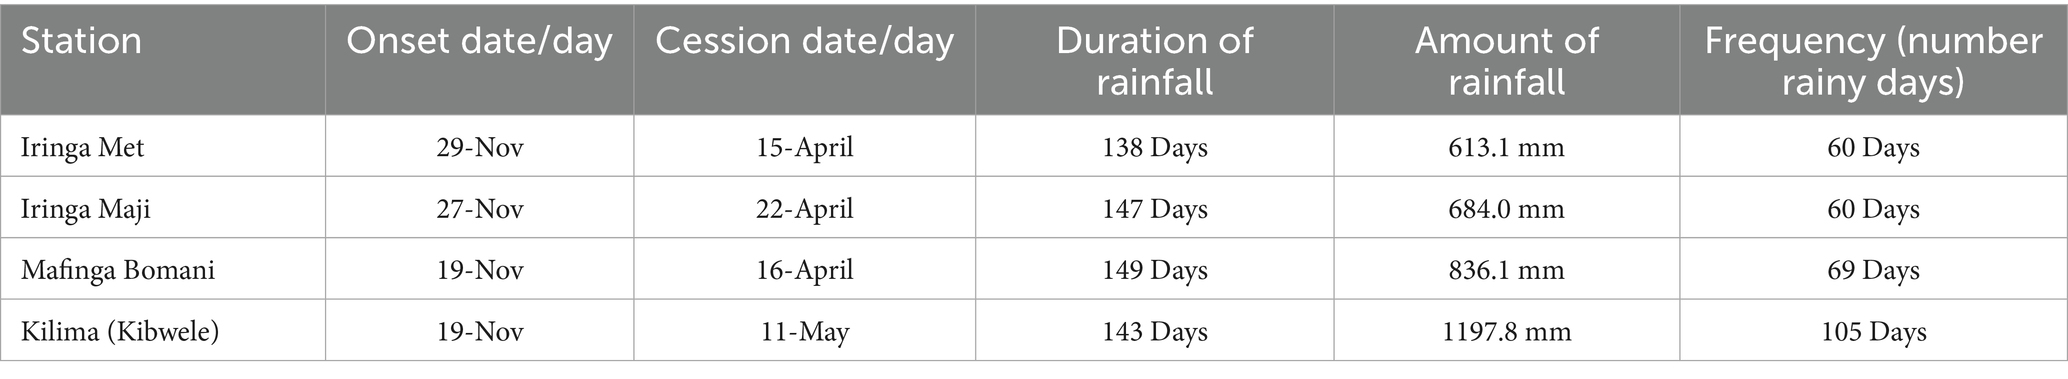
Table 3. Average seasonal rainfall characteristics for each station.
3.3 Rainfall characteristics
The findings indicate that while the onset and cessation dates generally fall within the anticipated range, with rainfall commencing and concluding within the natural timeframe, exceptions are noted for the Kilima station, where an extension of the cessation dates is observed. This variability in rainfall patterns can be attributed to various factors, including variations in atmospheric moisture and prevailing wind systems (Omay et al., 2023; Yonah et al., 2023).
Table 3 presents data regarding the mean dates of onset and cessation, along with additional characteristics such as duration, quantity, and frequency of rainfall. The results show that the region generally experiences precipitation levels ranging from 613.1 mm to 1197.8 mm, with the lowest recorded at the Iringa Meteorological Station in low-lying areas and the highest at the Kilima Station located in high-altitude regions. Despite the stations indicating normal dates for the start and end of a season, there are significant variations in the season’s onset and cessation, as well as rainfall patterns across different locations within the catchment area. This variability in rainfall patterns is consistent with the findings of previous studies in other regions, such as areas in Pakistani, which have reported similar spatial and temporal variations in precipitation (Ali et al., 2021).
A sensitivity analysis comparing cessation dates derived from station-based PET versus reanalysis-based PET yielded a satisfactory agreement with performance metrics of NSE = 0.58, RSR = 0.61, and PBIAS = 0.34, indicating that reanalysis PET slightly overestimates the local values but remains within an acceptable accuracy range for climatological applications.
The spatial–temporal assessment of rainfall has significant implications for numerous purposes, ranging from climate studies and water resources management to agricultural research and risk assessment for natural hazards (Ali et al., 2021). The understanding of geographical heterogeneities and temporal trends of rainfall is integral to modeling the impact of rainfall distribution and patterns on the society and environment.
3.3.1 Changes in rainfall onset and cessation dates, and lengths of rainfall season
Figures 3a–c illustrates the geographic distribution of the standard deviation in Rainfall Onset Days (RODs) for the NDJFMA season in the Little Ruaha catchment. The analysis reveals that the variability in Rainfall Onset Days for the NDJFMA season is influenced by both seasonal and geographical factors. The results indicate an average standard deviation ranging from 14 to 18 days, with the southeastern region exhibiting greater variability and the southern region experiencing the least variation. The results provide valuable insights into the spatial and temporal variability of rainfall patterns within the Little Ruaha catchment.
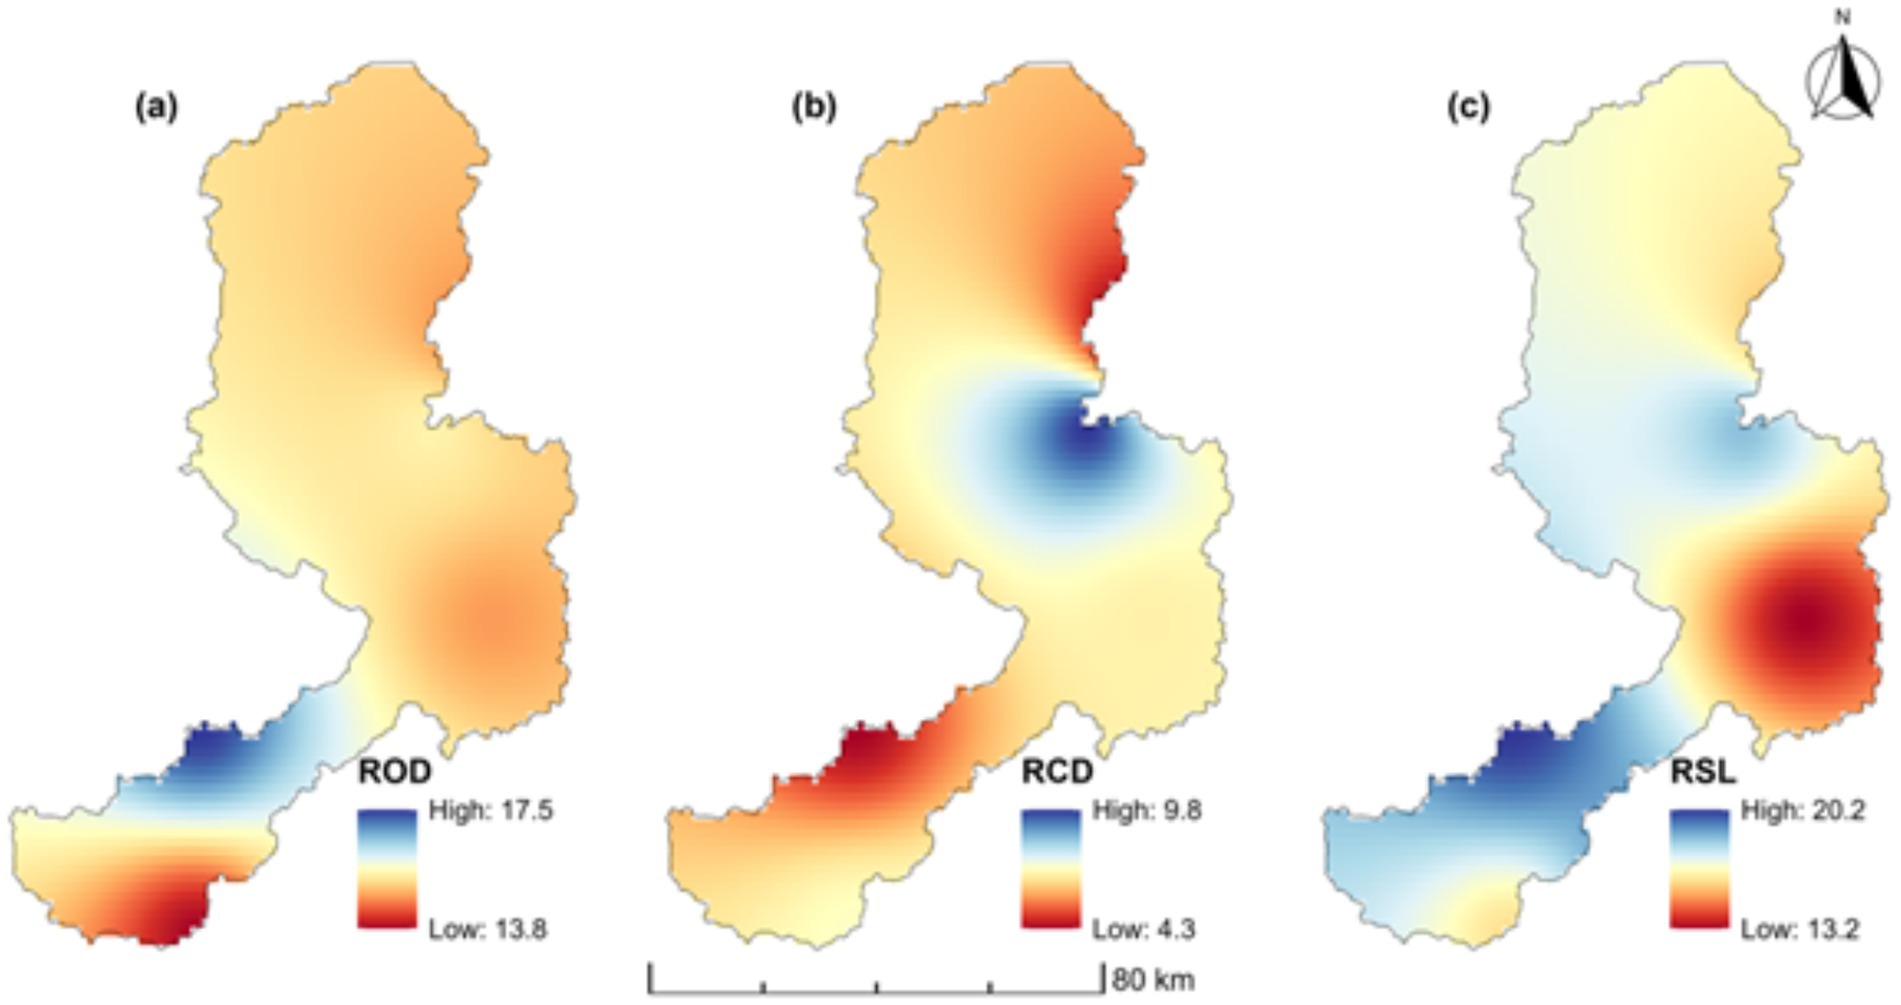
Figure 3. The standard deviation for rainfall onset dates (ROD) (a), Rainfall cessation date (RCD) (b), and Rainfall seasonal length (RSL) (c), for the Little Ruaha catchment.
Like rainfall cessation dates, the variability in RODs occurs both within the season and across different locations. The eastern and central regions display the most pronounced deviations, while the southeastern regions show the least deviation. These variations in Rainfall Onset Dates and Rainfall Cessation Dates lead to changes in the Length of Rainfall Seasons, with a standard deviation ranging from 13 to 20 days in the variability of seasonal precipitation patterns. These deviations are more pronounced in the southwestern and eastern-central regions (Figure 3c).
The results presented in Figures 3, 4 provide a compelling narrative of the cyclical fluctuations that have characterized the regional climate over the past four decades, offering valuable insights into the changing nature of precipitation regimes and their potential implications for water resource management and agricultural planning.
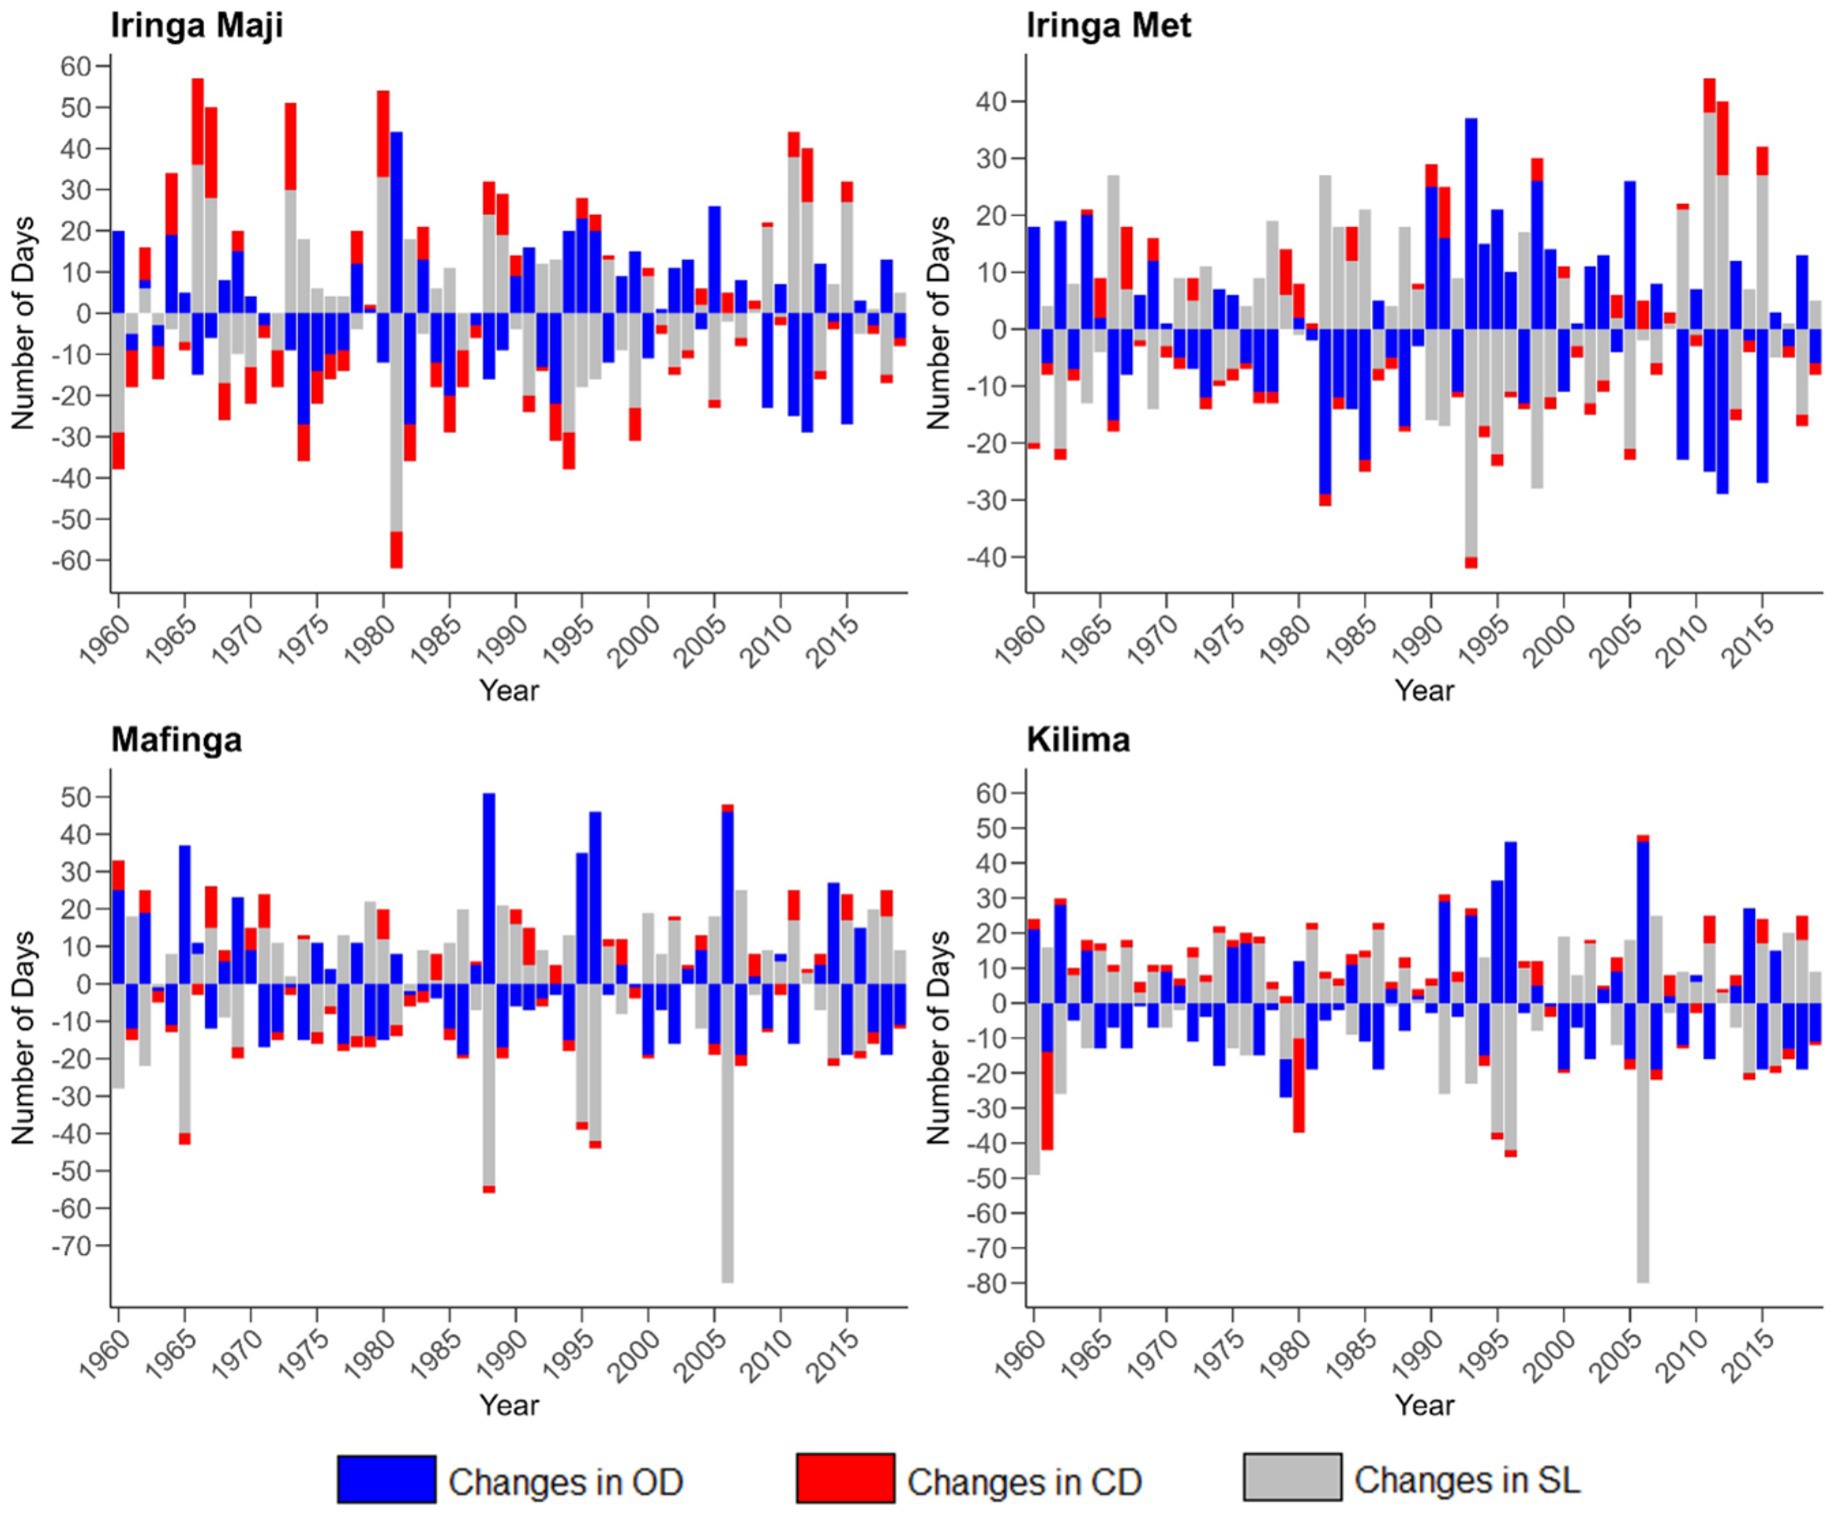
Figure 4. Changes in number of days for the onset date (OD), cessation date (CD), and seasonal lengths (SL) of rainfall for Iringa Maji, Iringa Met, Mafinga and Kilima.
The observed changes in Rainfall Onset Dates and Rainfall Cessation Dates have significantly influenced the Length of Rainy Seasons across the four designated stations within the catchment area. The study notes that early Rainfall Onset Dates are often associated with late Rainfall Cessation Dates, resulting in an extended Length of Rainy Season, as exemplified by the conditions observed in 1987 at the Iringa Maji, Iringa Met, and Mafinga stations. Conversely, late Rainfall Onset Dates are linked to early Rainfall Cessation Dates, leading to a reduced Length of Rainy Season, a trend that has become increasingly prevalent across most regions of the catchment over the past two decades.
The findings of this study align with the observations made in a similar investigation conducted in the IGAD region, which documented the spatial patterns of rainfall onset, cessation, and Length of Rainy Season (Omay et al., 2023). That study emphasized the crucial role these parameters play in crop production and food security in Eastern Africa, underscoring the need for a comprehensive understanding of the region’s rainfall dynamics.
These variations signify alterations in the timing and amount of rainfall in the catchment, which could have an impact on multiple activities in the catchment area, including agriculture and livestock production as well as hydrological systems. Agriculture is an important sector of the economy in Tanzania, accounting for around 25.8% of the country’s GDP and making up to 40% of its export revenues (Shemsanga et al., 2010; Thornton et al., 2011; Mwabumba et al., 2022). Hence, any significant alterations in the timing and amount of rainfall due to climate variability will inevitably affect not just the catchment area but also the population at large and the country’s economic state. The consequences will extend to disrupting food security for an expanding population (Shemsanga et al., 2010; Mwabumba et al., 2022).
These variations indicate alterations in the timing and quantity of rainfall within the catchment area, which may impact various activities, including agricultural practices and livestock production, as well as hydrological systems. Agriculture constitutes a vital sector of the Tanzanian economy, contributing approximately 25.8% to the country’s GDP and accounting for up to 40% of its export revenues (Shemsanga et al., 2010; Thornton et al., 2011; Mwabumba et al., 2022). Therefore, any significant changes in the timing and quantity of rainfall resulting from climate variability will inevitably influence not only the catchment area but also the broader population and the overall economic condition of the country. The repercussions will extend to threatening food security for an increasing population (Shemsanga et al., 2010; Mwabumba et al., 2022).
3.3.2 The risk or probability levels of onset, cessation and duration of the rainy season
Table 4 presents the rainfall onset dates (ROD), rainfall cessation dates (RCD), and rainfall seasonal length (RSL) at 20, 50, and 80% probabilities of exceedance, corresponding to return periods of 5 years, 2 years, and 4 years, respectively. The probability reflects the likelihood of surpassing a specific threshold and indicates the chance that the actual amount of rainfall will equal or exceed the anticipated amount over a designated duration. The return period, commonly referred to as the recurrence interval, denotes the average time interval between consecutive years in which the estimated rainfall value is attained (Alam et al., 2023).
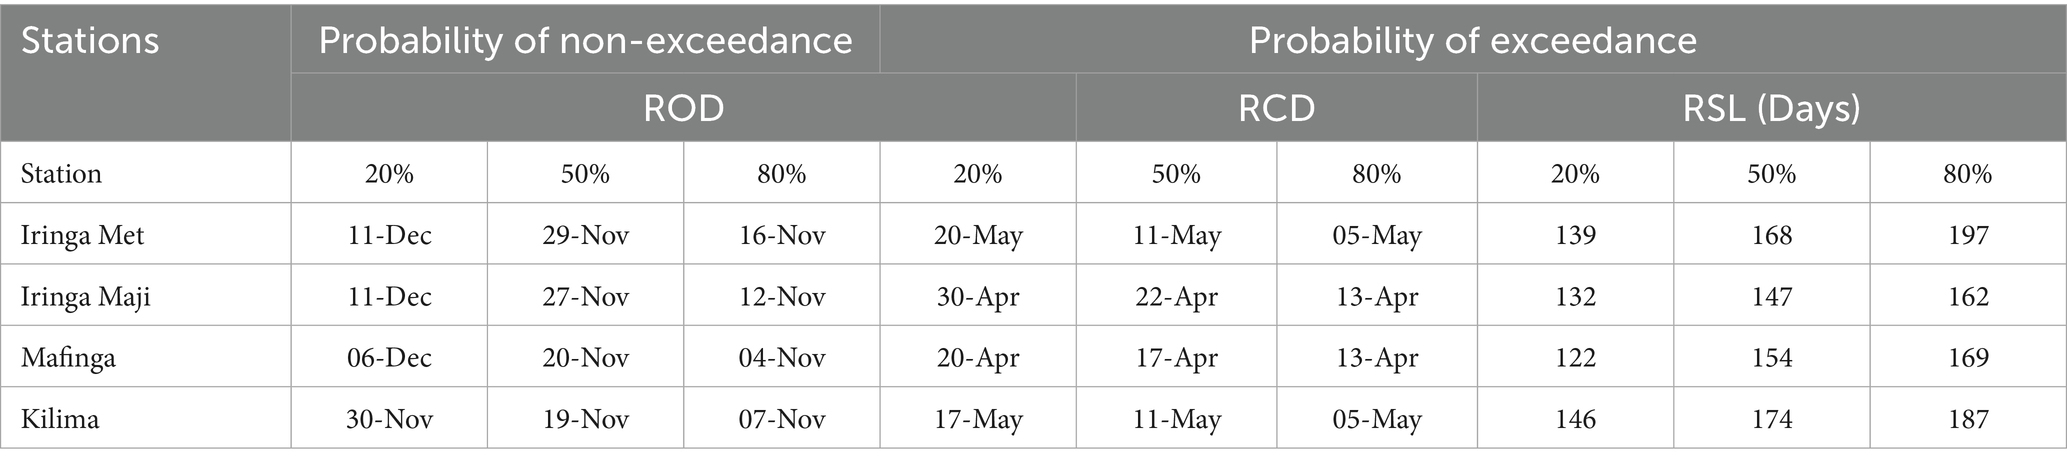
Table 4. Rainfall probabilities at 20, 50 and 80% for rainfall onset date, cessation dates and l seasonal length.
The onset date at 20% probability for the Little Ruaha catchment occurs between 30 November and 11 December, at 50% probability it ranges from 19–29, November and at 80%, the onset date ranges between 4th and 16th November. When the onset date is at 20%, farmers should plant crops that can withstand drought or that mature earlier than the typical crop cycle, unless they have access to additional watering infrastructure. It is important to highlight that there is a significant chance of encountering a false start to the season during the time that corresponds to a 20% probability. As a result, crops may not have sufficient soil moisture to support them in the initial phases of vegetative development (Moeletsi and Walker, 2012).
The onset date at a 20% probability for the Little Ruaha catchment is projected to occur between 30 November and 11 December. At a 50% probability, the range is from 19 to 29 November, while at an 80% probability, the onset date is anticipated to fall between 4 and 16 November. When the onset probability is at 20%, it is advisable for farmers to cultivate drought-resistant crops or those with a maturation period shorter than the typical crop cycle, unless they have access to supplementary irrigation infrastructure. It is crucial to emphasize that there exists a significant likelihood of experiencing a false start to the season during the timeframe corresponding to a 20% probability. Consequently, crops may not receive adequate soil moisture to support them during the initial stages of vegetative development (Moeletsi and Walker, 2012).
The 50% non-exceedance probability threshold is commonly used by farmers because it represents a balanced (50:50) likelihood of the onsets being sufficiently large to maintain a maize crop during the early vegetative stage. At the 80% probability level, crop failure during the early growth and development phases is at minimum risk. However, farmers should grow short-duration maize varieties, especially in areas with low temperature accumulation (highlands), so that the plant’s growth phase does not happen during times when it’s more vulnerable to changes in the weather (Moeletsi, 2010; Moeletsi and Walker, 2012).
Table 4 presents the cessation or retreat dates for rainfall, categorized according to the probabilities of exceeding 20, 50, and 80%. Aligning the maturity of maize crops with the 20% probability of an early termination of the rainy season may subject the crops to substantial water stress risk, owing to the heightened likelihood of an earlier cessation of precipitation at this probability level. Conversely, if planting strategies are synchronized with the final rainfall dates that possess a 50% or 80% probability of occurrence, it may mitigate losses resulting from inadequate water supply to support the maize crop.
Similarly, the seasonal duration of rainfall is characterized by various probability levels, as illustrated in Table 4 and spatially represented in Figures 5a–c. The 20% probability level denotes the volume of rainfall accumulated during dry seasons. The 50% probability level corresponds to the median or average seasonal rainfall. The 80% probability level reflects the amount of rainfall collected during wet rainy seasons.
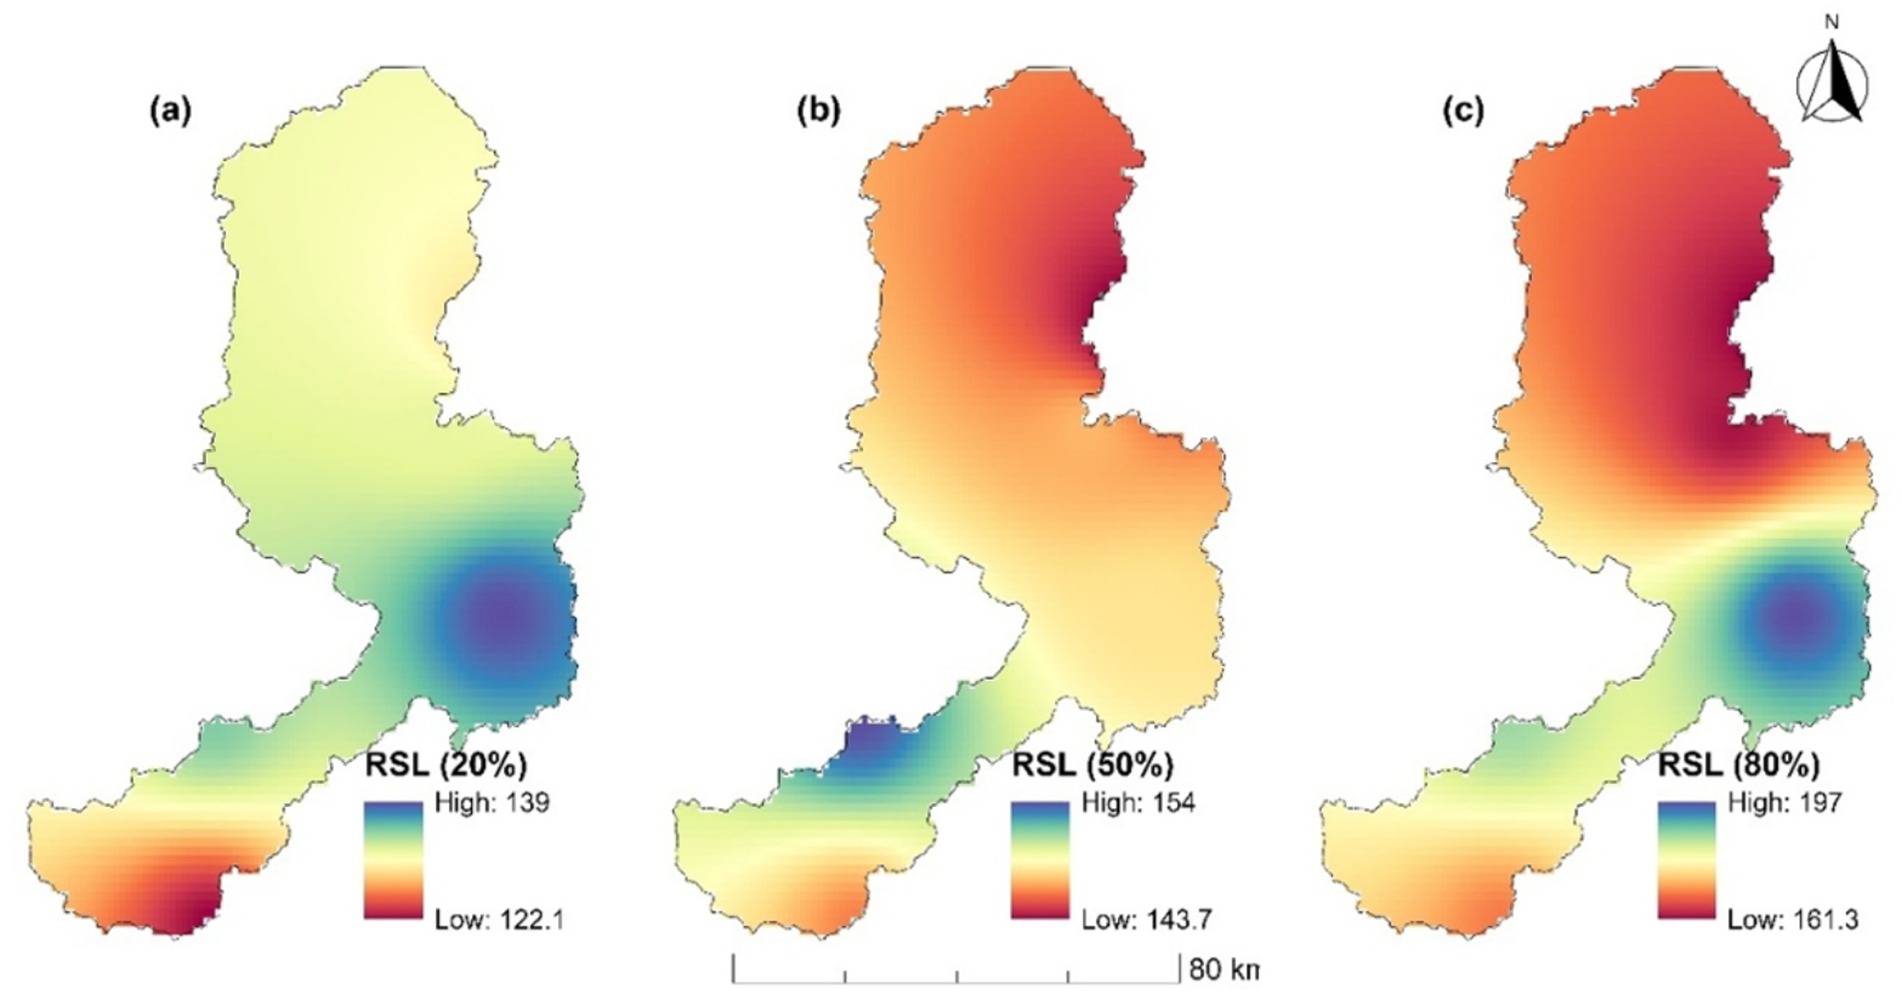
Figure 5. Spatial distribution of rainfall seasonal length (RSL) at 20% (a), 50% (b), and 80% (c) probabilities.
Spatially, in most regions, the duration of the rainy season at the 20th, 50th, and 80th percentiles exceed 120, 140, and 160 days, respectively. The catchment experiences a shorter rainy season, with durations ranging from 125 to 138 days at a 20% probability level, registering 125 days in the southern portion of the catchment, while the eastern regions experience an extension of approximately 14 days (see Figure 5a). At a 50% probability, the length of the rainy season ranges from 144 to 153 days, with the shortest duration located in the northeastern part of the catchment and the longest in the southwestern area (refer to Figure 5b). At an 80% probability, the catchment is projected to experience a wet season lasting between 160 and 200 days. The longest duration is anticipated in the eastern to northwestern sections of the catchment, whereas the southeastern region is expected to have a comparatively shorter season, as illustrated in Figure 5c.
The probability of complete failure of maize is significant, particularly for medium- and long-season varieties, with an estimated likelihood of 20%. For long-season maize cultivars, the probability of crop failure due to water stress is moderate, estimated at 50%. Additionally, the likelihood of crop failure resulting from water shortages is relatively low, estimated at 80%, due to the extended duration of the growing periods. This phenomenon is especially pronounced in the central, northern, and eastern regions.
3.4 Frequency analysis of annual maximum rainfall
Frequency analysis of annual maximum rainfall using the Weibull distribution revealed substantial variation in distributional properties across the four stations (Table 5). The estimated shape parameters (k) ranged from 1.17 at Kilima to 1.52 at Mafinga, indicating moderate skewness and differing tail behaviors of rainfall extremes. The scale parameters (λ) were highest at Kilima (13.92 mm), suggesting a higher characteristic magnitude of extreme rainfall at this highland station, and lowest at Iringa Met (10.41 mm), reflecting lower intensity extremes in the central catchment.
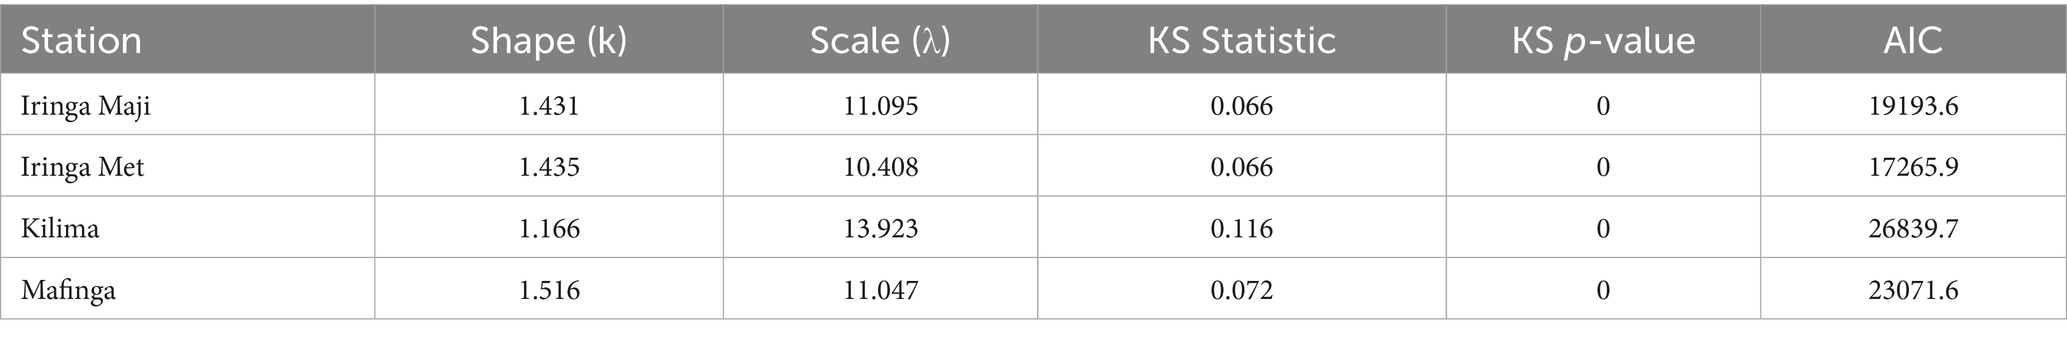
Table 5. Weibull distribution parameters (shape and scale), KS statistics, and AIC values for annual maximum rainfall at each station in the Little Ruaha catchment.
Goodness-of-fit assessments using the Kolmogorov–Smirnov (KS) test supported the adequacy of the Weibull distribution across all stations. All KS test p-values exceeded 0.05, indicating no statistically significant deviation from the theoretical distribution. The smallest KS values were observed at Iringa Maji and Iringa Met (0.066), while Kilima had the highest value (0.116), suggesting slightly reduced fit at this station. The Akaike Information Criterion (AIC) values followed a similar trend, with Iringa Met exhibiting the lowest (17,265.90) and Kilima the highest (26,839.68). These differences are also apparent in the Q–Q plots (Supplementary Figure S2), where Iringa stations showed better alignment with the theoretical Weibull distribution compared to Kilima and Mafinga.
The observed variability in Weibull parameters and goodness-of-fit across stations aligns with findings from other East African studies and reflects the spatial heterogeneity of rainfall extremes across the Little Ruaha catchment. For example, Tegegne et al. (2020) reported substantial differences in Weibull parameters across the Upper Blue Nile basin in Ethiopia, attributed to topographic complexity and variability in convective processes. Similarly, Gulacha and Mulungu (2017) found that Weibull scale parameters varied considerably between stations in the Wami-Ruvu basin in Tanzania, particularly between lowland and upland zones, echoing the high scale parameter found at Kilima in this study.
In Kenya, Samwel (2021) showed that both Weibull and log-normal distributions could perform differently depending on terrain and local climatology, a finding consistent with our observation of variable AIC values. The current results also support the conclusion by Mohammed et al. (2018) that testing multiple distributions improves robustness, especially in hydrologically diverse regions. While the Weibull model generally provided a satisfactory fit, exploratory analysis with the log-normal distribution (not shown in Table 5) yielded slightly lower AIC and KS values at some stations, most notably Kilima, highlighting the importance of considering multiple models in future applications.
Overall, the frequency analysis underscores the suitability of the Weibull distribution for modeling rainfall extremes while drawing attention to the role of microclimate, elevation, and topography in shaping station-specific behaviors. These findings are vital for site-specific hydrological design, flood risk assessment, and adaptation planning under climate variability.
4 Conclusion and recommendations
This research offers a comprehensive analysis of rainfall patterns and trends in the Little Ruaha catchment, with a focus on key aspects such as onset, cessation, duration, volume, and frequency of precipitation. The findings indicate that the southern and northeastern regions of the catchment are particularly susceptible to adverse conditions during the short (dry) rainfall season, with a 20% probability of deterioration. Additionally, during the regular rainfall season, there is a 50% chance of water stress affecting highly sensitive crops in these areas. Given these probabilities, it is recommended that farmers cultivate crops with shorter growth cycles in these specific regions or consider implementing irrigation mechanisms to mitigate the risks of water stress.
The insights provided by this study are crucial considering the increasing variability of rainfall patterns due to climate change. The outcomes will aid in developing adaptive agricultural strategies to mitigate the negative effects of rainfall variability on productivity and the sustainable use of water resources. The study further contributes to local efforts aimed at enhancing the resilience of agricultural systems by supporting irrigation planning and helping farmers optimize crop yields. Moreover, these findings will support the ongoing implementation of the Integrated Water Resource Management (IWRM) framework, ensuring sustainable resource management within the Little Ruaha catchment. Ultimately, the results of this research serve as a valuable model for addressing water resource challenges, offering lessons applicable to other regions grappling with similar climate-related pressures and agricultural vulnerabilities.
The findings of this study carry substantial implications for both environmental protection and climate change adaptation, particularly in regions experiencing climate-driven variability in rainfall. The study has enhanced the reliability of long-term rainfall assessments by accurately detecting trends while considering autocorrelation effects. This has crucial impacts on the planning and management of water resources, environmental conservation, and resilience building against climate change.
The study’s insights on rainfall variability provide a basis for informed water resources management and overall environmental protection. Accurate data on rainfall trends allow for the anticipation of periods of water scarcity or excess, enabling policymakers and environmental managers to implement adaptive strategies that protect ecosystems and biodiversity. Such proactive management could involve measures like improving water conservation practices, designing adaptive infrastructure, and establishing early warning systems to mitigate the effects of droughts and floods on both natural habitats and human settlements.
The study offers validated data that can be utilized in climate modelling and prediction in the context of climate change. Understanding historical rainfall trends is critical for forecasting future climate scenarios, as it helps refine climate models used in projecting the impacts of climate change at a regional level. Furthermore, these insights are essential for designing adaptation strategies for sectors heavily reliant on water availability, such as agriculture, energy, and public health. For instance, in agriculture, where rainfall patterns directly influence crop productivity, such data can inform climate-smart practices and improve food security resilience in changing climatic conditions.
This study acknowledges several limitations that constrain the reliability and broader applicability of the findings. The use of data from a limited number of rainfall stations may not capture the full spatial variability of rainfall across the study area. Additionally, the quality and availability of long-term data could affect the reliability of the analysis. Another limitation is the lack of consideration for non-climatic factors, such as land-use changes, that could also influence the observed rainfall patterns. To address these limitations, future research should explore strategies to enhance the spatial and temporal robustness of rainfall analysis. One approach could be to incorporate a larger network of rainfall stations to better capture the spatial heterogeneity of rainfall patterns. Additionally, the use of advanced remote sensing and modelling techniques may help overcome the limitations of ground-based observations and provide a more comprehensive understanding of rainfall dynamics.
Data availability statement
Publicly available datasets were analyzed in this study. This data can be found at: the data supporting this study’s findings are available from the corresponding author upon request. Additionally, the datasets used in this study were obtained from the Tanzania Meteorological Authority (TMA). The TMA data can be accessed by contacting TMA directly through their official website at http://www.meteo.go.tz. Data requests can be made to TMA, and they will provide the necessary datasets upon approval.
Author contributions
FM: Conceptualization, Data curation, Formal analysis, Investigation, Methodology, Project administration, Resources, Software, Writing – original draft, Writing – review & editing. PV: Conceptualization, Funding acquisition, Methodology, Project administration, Resources, Supervision, Validation, Writing – review & editing. MT: Data curation, Formal analysis, Investigation, Methodology, Project administration, Supervision, Visualization, Writing – review & editing. FI: Conceptualization, Formal analysis, Methodology, Supervision, Writing – review & editing. MM: Data curation, Resources, Software, Validation, Visualization, Writing – review & editing. WM: Methodology, Validation, Writing – review & editing.
Funding
The author(s) declare that no financial support was received for the research and/or publication of this article.
Acknowledgments
The authors are thankful to the Tanzania Meteorological Authority (TMA) and Rufiji Water Basin for quality input datasets to facilitate this study.
Conflict of interest
The authors declare that the research was conducted in the absence of any commercial or financial relationships that could be construed as a potential conflict of interest.
Publisher’s note
All claims expressed in this article are solely those of the authors and do not necessarily represent those of their affiliated organizations, or those of the publisher, the editors and the reviewers. Any product that may be evaluated in this article, or claim that may be made by its manufacturer, is not guaranteed or endorsed by the publisher.
Supplementary material
The Supplementary material for this article can be found online at: https://www.frontiersin.org/articles/10.3389/frwa.2025.1484307/full#supplementary-material
References
Abed-Elmdoust, A., and Kerachian, R. (2012). Water resources allocation using a cooperative game with fuzzy payoffs and fuzzy coalitions. Water Resour. Manag. 26, 3961–3976. doi: 10.1007/s11269-012-0115-0
Acharya, N., Ehsan, M. A., Admasu, A., Teshome, A., and Hall, K. J. C. (2021). On the next generation (NextGen) seasonal prediction system to enhance climate services over Ethiopia. Clim. Serv. 24:100272. doi: 10.1016/j.cliser.2021.100272
Akaike, H. (1974). A new look at the statistical model identification. IEEE Trans. Automat. Control 19, 716–723. doi: 10.1109/TAC.1974.1100705
Alam, A., Ahmed, B., Sammonds, P., and Maksud Kamal, A. S. M. (2023). Applying rainfall threshold estimates and frequency ratio model for landslide hazard assessment in the coastal mountain setting of South Asia. Nat. Hazards Res. 3, 531–545. doi: 10.1016/j.nhres.2023.08.002
Alemu, M. M., and Bawoke, G. T. (2019). Analysis of spatial variability and temporal trends of rainfall in Amhara region, Ethiopia. Journal of Water and Climate Change 11, 1505–1516.
Ali, G., Sajjad, M., Kanwal, S., Xiao, T., Khalid, S., Shoaib, F., et al. (2021). Spatial–temporal characterization of rainfall in Pakistan during the past half-century (1961–2020). Sci. Rep. 11, 1–15. doi: 10.1038/s41598-021-86412-x
Ameen, I., Kashif, M., Hameed, H. N., and Nida, H. (2024). Trend analysis of extreme weather indices in different districts of Punjab, Pakistan. Asian Bulletin of Research. doi: 10.47278/journal.abr/2024.035
Amekudzi, L. K., Yamba, E. I., Preko, K., Asare, E. O., Aryee, J., Baidu, M., et al. (2015). Variabilities in rainfall onset, cessation and length of rainy season for the various agro-ecological zones of Ghana. Climate 3, 416–434. doi: 10.3390/cli3020416
Balogun, V., Ekpenkhio, E., and Ebena, B. (2023). Spatiotemporal trends and variability analysis of rainfall and temperature over Benin Metropolitan Region, Edo State, Nigeria. Geography, Environment, Sustainability 16, 6–15. doi: 10.24057/2071-9388-2022-001
Benyoussef, S., Arabi, M., El Yousfi, Y., Cheikh, B. B., Abdaoui, A., Azirar, M., et al. (2024). Climate change and water resources management in the Ghis-Nekor watershed (north of Morocco)–a comprehensive analysis using SPI, RDI and DI indices. Ecol. Eng. Environ. Technol. 25, 199–209. doi: 10.12912/27197050/176275
Bewket, W., and Conway, D. (2007). A note on the temporal and spatial variability of rainfall in the drought-prone Amhara region of Ethiopia. Int. J. Climatol. 27, 1467–1477. doi: 10.1002/joc.1481
Chakravarti, I. M., Laha, R. G., Roy, J., and Roy, J. (1967). Handbook of methods of applied statistics, vol. 1. New York: Wiley, 392–394.
Cobaner, M., Citakoğlu, H., Haktanir, T., and Kisi, O. (2017). Modifying Hargreaves–Samani equation with meteorological variables for estimation of reference evapotranspiration in Turkey. Hydrol. Res. 48, 480–497. doi: 10.2166/nh.2016.217
Conway, D., Persechino, A., Ardoin-Bardin, S., Hamandawana, H., Dieulin, C., and Mahé, G. (2009). Rainfall and water resources variability in sub-Saharan Africa during the twentieth century. J. Hydrometeorol. 10, 41–59. doi: 10.1175/2008JHM1004.1
Da Silva, R. M., Santos, C. A. G., Moreira, M., Corte-Real, J., Silva, V. C. L., and Medeiros, I. C. (2015). Rainfall and river flow trends using Mann–Kendall and Sen’s slope estimator statistical tests in the Cobres River basin. Nat. Hazards 77, 1205–1221. doi: 10.1007/s11069-015-1644-7
Desa, M. N. M., and Niemczynowicz, J. (1997). Dynamics of short rainfall storms in a small scale urban area in coly limper, Malaysia. Atmos. Res. 44, 293–315. doi: 10.1016/S0169-8095(97)00017-3
Dinku, T., Faniriantsoa, R., Islam, S., Nsengiyumva, G., and Grossi, A. (2022). The climate data tool: enhancing climate services across Africa. Front. Clim. 3:185.
Duncan, J. M., Duncan, J. M. A., Biggs, E. M., Dash, J., and Atkinson, P. M. (2013). Spatio-temporal trends in precipitation and their implications for water resources management in climate-sensitive Nepal. Appl. Geogr. 43, 138–146. doi: 10.1016/j.apgeog.2013.06.011
Edao, A. L., Kibert, K., and Mamo, G. (2018). Analysis of start, end and length of the growing season and number of rainy days in semi-arid central Refit Valley of Oromia state, Ethiopia. Adv. Crop Sci. Technol. 6:386. doi: 10.4172/2329-8863.1000386
Francis, J., and Mahongo, S. B. (2012). Analysis of rainfall variations and trends in coastal Tanzania. West. Indian Ocean J. Mar. Sci. 11, 121–133.
Gao, L., Bernhardt, M., Schulz, K., and Chen, X. (2017). Elevation correction of ERA-interim temperature data in the Tibetan plateau. Int. J. Climatol. 37, 3540–3552. doi: 10.1002/joc.4935
Gulacha, M. M., and Mulungu, D. M. (2017). Generation of climate change scenarios for precipitation and temperature at local scales using SDSM in Wami-Ruvu River basin Tanzania. Physics Chemistry Earth, Parts A/B/C 100, 62–72. doi: 10.1016/j.pce.2016.10.003
Hachigonta, S., Reason, C. J. C., and Tadross, M. (2008). An analysis of onset date and rainy season duration over Zambia. Theor. Appl. Climatol. 91, 229–243. doi: 10.1007/s00704-007-0306-4
Hamandawana, H., and Chanda, R. (2013). Environmental change in and around the Okavango Delta during the nineteenth and twentieth centuries. Reg. Environ. Chang. 13, 681–694. doi: 10.1007/s10113-012-0367-5
Hamed, K. H., and Rao, A. R. (1998). A modified Mann–Kendall trend test for autocorrelated data. Journal of Hydrology 204, 182–196. doi: 10.1016/S0022-1694(97)00125-X
Hirsch, R. M., Slack, J. R., and Smith, R. A. (1982). Techniques of trend analysis for monthly water quality data. Water Resour. Res. 18, 107–121. doi: 10.1029/WR018i001p00107
Hosking, J. R. M., and Wallis, J. R. (1997). Regional frequency analysis (p. 240). Cambridge: Cambridge University Press.
IPCC (2007). Climate Change 2007: The Physical Science Basis. Contribution of Working Group I to the Fourth Assessment Report of the Intergovernmental Panel on Climate Change. Cambridge: Cambridge University Press.
Ires, I. (2021). Intensive agriculture as climate change adaptation? Economic and environmental tradeoffs in securing rural livelihoods in Tanzanian River basins. Front. Environ. Sci. :531. doi: 10.3389/fenvs.2021.674363
Ismail, A., and Oke, I. A. (2012). Trend analysis of precipitation in Birnin Kebbi, Nigeria. Int. Res. J. Agric. Sci. Soil Sci. 2, 286–297.
Jones, J. R., Schwartz, J. S., Ellis, K. N., Hathaway, J. M., and Jawdy, C. M. (2015). Temporal variability of precipitation in the upper Tennessee Valley. J. Hydrol. Reg. Stud. 3, 125–138. doi: 10.1016/j.ejrh.2014.10.006
Knoben, W. J., Freer, J. E., Fowler, K. J., Peel, M. C., and Woods, R. A. (2019). Modular assessment of rainfall–runoff models toolbox (MARRMoT) v1. 2: an open-source, extendable framework providing implementations of 46 conceptual hydrologic models as continuous state-space formulations. Geosci. Model Dev. 12, 2463–2480. doi: 10.5194/gmd-12-2463-2019
Kumar, N., Panchal, C. C., Chandrawanshi, S. K., and Thanki, J. D. (2017). Analysis of rainfall by using Mann-Kendall trend, Sen’s slope and variability at five districts of South Gujarat, India. Mausam 68, 205–222. doi: 10.54302/mausam.v68i2.604
Larbi, I., Hountondji, F. C., Annor, T., Agyare, W. A., Mwangi Gathenya, J., and Amuzu, J. (2018). Spatio-temporal trend analysis of rainfall and temperature extremes in the Vea catchment, Ghana. Climate 6:87. doi: 10.3390/cli6040087
Laux, P., Kunstmann, H., and Bárdossy, A. (2008). Predicting the regional onset of the rainy season in West Africa. Int. J. Climatol. 28, 329–342. doi: 10.1002/joc.1542
Marteau, R., Moron, V., and Philippon, N. (2009). Spatial coherence of monsoon onset over western and Central Sahel (1950–2000). J. Clim. 22, 1313–1324. doi: 10.1175/2008JCLI2383.1
Marteau, R., Sultan, B., Moron, V., Alhassane, A., Baron, C., and Traoré, S. B. (2011). The onset of the rainy season and farmers’ sowing strategy for pearl millet cultivation in Southwest Niger. Agric. For. Meteorol. 151, 1356–1369. doi: 10.1016/j.agrformet.2011.05.018
Mbungu, W. B., and Kashaigili, J. J. (2017). Assessing the Hydrology of a Data-Scarce Tropical Watershed Using the Soil and Water Assessment Tool: Case of the Little Ruaha River Watershed in Iringa, Tanzania. Open Journal of Modern Hydrology 7, 259–278. doi: 10.4236/ojmh.2017.72004
Mbungu, W., Ntegeka, V., Kahimba, F., Taye, M., and Willems, P. (2012). Temporal and spatial variations in hydro-climatic extremes in the Lake Victoria basin. Physics Chemistry Earth, Parts A/B/C 50, 24–33. doi: 10.1016/j.pce.2012.09.002
Mkonda, M. Y., and He, X. (2018). Climate variability and crop yields synergies in Tanzania’s semiarid agroecological zone. Ecosystem Health Sustain. 4, 59–72. doi: 10.1080/20964129.2018.1459868
Moeletsi, M. E. (2010). Agroclimatological risk assessment of rainfed maize production for the Free State Province of South Africa (Bloemfontein, South Africa: doctoral dissertation, University of the Free State). Available online at: http://hdl.handle.net/11660/2097
Moeletsi, M. E., and Walker, S. (2012). Rainy season characteristics of the Free State Province of South Africa with reference to rain-fed maize production. Water SA 38, 775–782. doi: 10.4314/wsa.v38i5.17
Mohammed, Y., Yimer, F., Tadesse, M., and Tesfaye, K. (2018). Variability and trends of rainfall extreme events in north east highlands of Ethiopia. International Journal of Hydrology 2, 594–605. doi: 10.15406/ijh.2018.02.00131
Mongi, H., Majule, A., and Lyimo, J. (2010). Vulnerability and adaptation of rain fed agriculture to climate change and variability in semi-arid Tanzania. Afr. J. Environ. Sci. Technol. 4.
Mwabumba, M., Yadav, B. K., Rwiza, M. J., Larbi, I., Dotse, S. Q., Limantol, A. M., et al. (2022). Rainfall and temperature changes under different climate scenarios at the watersheds surrounding the Ngorongoro conservation area in Tanzania. Environ. Challenges 7:100446. doi: 10.1016/j.envc.2022.100446
Nicholson, S. E. (2017). Climate and climatic variability of rainfall over eastern Africa. Rev. Geophys. 55, 590–635. doi: 10.1002/2016RG000544
Nkiaka, E., Nawaz, N. R., and Lovett, J. C. (2017). Evaluating global reanalysis precipitation datasets with rain gauge measurements in the Sudano-Sahel region: case study of the Logone catchment, Lake Chad Basin. Meteorol. Appl. 24, 9–18. doi: 10.1002/met.1600
Nyembo, L. O., Larbi, I., and Rwiza, M. J. (2021). Analysis of spatio-temporal climate variability of a shallow lake catchment in Tanzania. J. Water Clim. Change 12, 469–483. doi: 10.2166/wcc.2020.197
Ojo, O. I., and Ilunga, M. F. (2018). Application of nonparametric trend technique for estimation of onset and cessation of rainfall. Air Soil Water Res. 11, 1–4. doi: 10.1177/1178622118790264
Omay, P. O., Muthama, N. J., Oludhe, C., Kinama, J. M., Artan, G., and Atheru, Z. (2023). Changes and variability in rainfall onset, cessation, and length of rainy season in the IGAD region of eastern Africa. Theor. Appl. Climatol. 152, 871–893. doi: 10.1007/s00704-023-04433-0
Omotosho, J. B., Balogun, A. A., and Ogunjobi, K. (2000). Predicting monthly and seasonal rainfall, onset and cessation of the rainy season in West Africa using only surface data. Int. J. Climatol. 20, 865–880. doi: 10.1002/1097-0088(20000630)20:8<865::AID-JOC505>3.0.CO;2-R
Patil, M. K., and Kalange, D. N. (2015). Detection of trend in rainfall data: a case study of Sangli District. Rev. Res. 4, 1–15.
Pawlak, K., and Kołodziejczak, M. (2020). The role of agriculture in ensuring food security in developing countries: considerations in the context of the problem of sustainable food production. Sustainability 12:5488. doi: 10.3390/su12135488
Pima, N. A., Mbungu, W. B., Balama, C. P., Maguzu, J., Siwa, E., and Sangiwa, M. J. (2021). Spatial and temporal variability in hydro-meteorological selected variable in the southern highlands, Tanzania. Tanzan. J. For. Nat. Conserv. 90, 10–23.
Raes, D., Willems, P., and Gbaguidi, F. (2006). RAINBOW – a software package for analyzing data and testing the homogeneity of historical data sets. Proceedings of the 4th international workshop on ‘sustainable management of marginal drylands’. Islamabad, Pakistan, 27–31 January 2006. Available online at: https://iupware.be/wp-content/uploads/2016/03/rainbow_manual.pdf
Recha, C. W., Makokha, G. L., Traore, P. S., Shisanya, C., Lodoun, T., and Sako, A. (2012). Determination of seasonal rainfall variability, onset and cessation in semi-arid Tharaka district, Kenya. Theor. Appl. Climatol. 108, 479–494. doi: 10.1007/s00704-011-0544-3
Samwel, M. P. (2021). Climate variability and food security in Kisii County, Kenya (Doctoral dissertation). Nairobi University, Kenya.
Sarker, S., Veremyev, A., Boginski, V., and Singh, A. (2019). Critical nodes in river networks. Sci. Rep. 9:11178. doi: 10.1038/s41598-019-47292-4
Segele, Z. T., and Lamb, P. J. (2005). Characterization and variability of Kiremt rainy season over Ethiopia. Meteorog. Atmos. Phys. 89, 153–180. doi: 10.1007/s00703-005-0127-x
Sen, P. K. (1968). Estimates of the regression coefficient based on Kendall’s tau. Journal of the American Statistical Association 63, 1379–1389. doi: 10.1080/01621459.1968.10480934
Shemsanga, C., Omambia, A. N., and Gu, Y. (2010). The cost of climate change in Tanzania: Impacts and adaptations. Journal of American Science 6, 182–196.
Sigalla, O. Z., Valimba, P., Selemani, J. R., Kashaigili, J. J., and Tumbo, M. (2023). Analysis of spatial and temporal trend of hydro-climatic parameters in the Kilombero River catchment, Tanzania. Sci. Rep. 13:7864. doi: 10.1038/s41598-023-35105-8
Singh, N., and Ranade, A. (2010). The wet and dry spells across India during 1951–2007. J. Hydrometeorol. 11, 26–45. doi: 10.1175/2009JHM1161.1
Singhal, A., Muhammed Jaseem, P. A., Divya Sarker, S., Prajapati, P., Singh, A., et al. (2024). Identifying potential locations of hydrologic monitoring stations based on topographical and hydrological information. Water Resour. Manag. 38, 369–384. doi: 10.1007/s11269-023-03675-x
Sivakumar, M. V. K. (1988). Predicting rainy season potential from the onset of rains in southern Sahelian and Sudanian climatic zones of West Africa. Agric. For. Meteorol. 42, 295–305. doi: 10.1016/0168-1923(88)90039-1
Stedinger, J. R., Vogel, R. M., and Foufoula-Georgiou, E. (1993). “Frequency analysis of extreme events” in Handbook of hydrology (Chapter 18). ed. D. R. Maidment (New York: McGraw-Hill).
Stern, R. D., Dennett, M. D., and Dale, I. C. (1982). (1982). Analysing daily rainfall measurements to give Agronomically useful results. I. Direct methods. Exp. Agric. 18, 223–236. doi: 10.1017/S001447970001379X
Stern, R. D., Dennett, M. D., and Garbutt, D. J. (1981). The start of the rains in West Africa. J. Climatol. 1, 59–68. doi: 10.1002/joc.3370010107
Tegegne, G., Melesse, A. M., Asfaw, D. H., and Worqlul, A. W. (2020). Flood frequency analyses over different basin scales in the Blue Nile River Basin. Ethiopia. Hydrology 7:44. doi: 10.3390/hydrology7030044
Thornton, P. K., Jones, P. G., Ericksen, P. J., and Challinor, A. J. (2011). Agriculture and food systems in sub-Saharan Africa in a 4°C+ world. Philosophical Transactions of the Royal Society A: Mathematical, Physical and Engineering Sciences 369, 117–136. doi: 10.1098/rsta.2010.0246
Tumbo, M. H. (2018). Basin scale performance of a distributed rainfall-runoff model using uncertainty modelling approach in data scarce region. Achievements and Challenges of Integrated River Basin Management. IntechOpen. eds. M. Salih, A. Elsanabary, and M. Abdel-Fattah. doi: 10.5772/intechopen.78539
United Republic of Tanzania (URT) (2012). Rufiji Basin IWRMD plan: Interim report, Volume I – Rufiji River basin physical, socio-economic and management profile. Ministry of Water, Water Sector Development Program (WSDP). Prepared by WREM Interna-9tional Inc. Atlanta, Georgia, USA: Unpublished institutional report.
Wilks, D. S. (2011). Statistical methods in the atmospheric sciences. 3rd Edn.Oxford: Academic Press.
Yasin, K. H., Gelete, T. B., Iguala, A. D., and Kebede, E. (2024). Optimal interpolation approach for groundwater depth estimation. MethodsX 13:102916. doi: 10.1016/j.mex.2024.102916
Yonah, I. B., King’uza, P. H., Chang’a, L. B., Babyegeye, M. M., Mahoo, H. F., and Kijazi, A. L. (2023). The inter-annual variability of rainfall onset and its implication on crop planting in selected East Africa countries. Am. J. Clim. Change 12, 268–291. doi: 10.4236/ajcc.2023.122013
Yonah, I. B. B., Otengi, S. B. B., and Lukorito, C. B. (2006). Assessment of the growing season over the unimodal rainfall regime region of Tanzania. Tanzania J. Agricul. Sci. 7, 16–26. doi: 10.10520/AJA0856664X_206
Keywords: rainfall characteristics, climate change, onset, cessation, seasonal length, Little Ruaha
Citation: Mahay FH, Valimba PC, Tumbo MH, Izdori FJ, Mwabumba MF and Mbungu WB (2025) Characterizing rainfall patterns and dynamics in the Little Ruaha catchment, southern Tanzania. Front. Water. 7:1484307. doi: 10.3389/frwa.2025.1484307
Edited by:
Proloy Deb, International Rice Research Institute, IndiaReviewed by:
Shiblu Sarker, Virginia Department of Conservation and Recreation, United StatesMohammed Elseidi, Umm Al Quwain University, United Arab Emirates
Copyright © 2025 Mahay, Valimba, Tumbo, Izdori, Mwabumba and Mbungu. This is an open-access article distributed under the terms of the Creative Commons Attribution License (CC BY). The use, distribution or reproduction in other forums is permitted, provided the original author(s) and the copyright owner(s) are credited and that the original publication in this journal is cited, in accordance with accepted academic practice. No use, distribution or reproduction is permitted which does not comply with these terms.
*Correspondence: Florence H. Mahay, a2FqaWx1QGdtYWlsLmNvbQ==