 Lea Caduff
 Alexander Englert1
 Regula Meierhofer
 Michael Burkhardt
- 1OST, Eastern Switzerland University of Applied Sciences, Rapperswil, Switzerland
- 2Eawag, Swiss Federal Institute of Aquatic Science and Technology, Dubendorf, Switzerland
Safe drinking water free of microbial contamination can be obtained by using water treatment technologies, such as UV irradiation, applied at the household level. This study investigated the disinfection efficiency of two different configurations of UV-C LEDs in water containers (domes with five LEDs and a lance containing 40 LEDs), and it assessed their potential for providing effective drinking water treatment options at the household level. Male-specific (MS2) coliphages were used as biodosimeters, and their concentration was measured before and after a defined irradiation time to calculate the log inactivation. The reduction equivalent dose (RED) was calculated using averaged data from published collimated beam experiments. One of the two configurations (domes) achieved a 4-log inactivation in two different containers, even though it consisted of eight times fewer LEDs than the lance: the container with a volume of 11.1 L and a RED of 1,120 J/m2 after an exposure time of 6 h and the container with a volume of 31.1 L and a RED between 735 J/m2 and 1,821 J/m2 after 6–12 h of exposure time. The disinfection efficiency of both configurations could be improved by including a stirring device or flow-through solution to avoid the occurrence of non-irradiated water and a placement of LEDs that avoid the overlapping of UV-C light cones and allow for large light cone formations. It was demonstrated that UV-C LEDs can be combined with ordinary containers in a low-cost, self-built setup and can be applied to treat drinking water.
1 Introduction
The UN General Assembly explicitly recognized the human right to water and sanitation in 2010—sufficient, continuous, safe, acceptable, physically accessible, and affordable water for personal and domestic use (World Health Organization, 2022). The importance of ensuring the availability and sustainable management of water and sanitation for all was further highlighted by the Sustainable Development Goal 6 (World Health Organization, 2020). Yet, in 2020, 2 billion people still lacked access to a safely managed drinking-water service, which is defined by the availability on the premise, the availability when needed and by the absence of contamination (World Health Organization, 2022). Microbial contamination of the water poses a threat to human health (Singh et al., 2019; Edegbene et al., 2025). Consumption of such contaminated water can lead to diseases like cholera, typhoid, hookworm disease, diarrhea, and others (Troeger et al., 2017).
An option to improve drinking water quality is the application of a technology for household water treatment, such as chlorination, boiling, membrane filtration, solar, or artificial ultraviolet (UV) irradiation (Smieja, 2011). Previous experiences with the implementation of household water treatment revealed that, ideally, technologies should fulfill certain criteria to facilitate their application; be affordable, durable, easy, and safe to use (Lanrewaju et al., 2022).
UV-C radiation has been used for the treatment of drinking water in centralized systems since 1910, using either low-pressure (monochromatic at 254 nm) or medium-pressure (polychromatic spectrum) mercury lamps (Masschelein, 2022). The application of UV-C light emitting diodes (LEDs) in drinking water treatment instead of conventional lamps has gained interest because they do not contain toxic mercury, they can be instantly turned on and off and their production costs dropped significantly (Linden et al., 2019; Moore et al., 2023; Pelayo et al., 2024). In addition, their small size allows for the design of innovative products with nearly unlimited geometries (Beck, 2018; Li et al., 2019). UV-C LEDs emit a monochromatic spectrum, and their wavelength depends on the material used for production (Nicolau et al., 2022).
The spectrum of 200–280 nm is described as UV-C light, and it inactivates microbes because their DNA or RNA absorbs the UV light (Gross et al., 2015). The UV-C spectrum from 250 to 270 nm is absorbed by nucleic acids, with the peak germicidal wavelength being at 262 nm (Khan et al., 2022). This leads to broken bonds and new formations within their genetic material (Li et al., 2019). The nucleic damages prevent the organisms from being replicated and thus from being infectious (Beck, 2018).
When working with UV-C for the disinfection of drinking water, several aspects should be considered:
1) The waste heat generated by the UV-C LED lamp needs to be managed, as 98% of the energy input is lost as heat and negatively affects the wavelength and irradiance of the lamp (Beck et al., 2017).
2) The energy input that is not lost as heat is called the fluence and is defined as the UV-C energy output per area (unit J/m2) in the system. It is calculated by multiplying the fluence rate with time. The fluence must be high enough to achieve complete inactivation and prevent potential regrowth of pathogens (Bolton and Linden, 2003; Batch et al., 2004). Of the fluence, only a very small fraction is absorbed by exposed pathogens, which results in inactivation. This small fraction is called the dose (unit J/m2) (American Air and Water, 2019). The dose is calculated by multiplying the irradiance with time. Calculating the fluence in applied configurations often relies on computational modeling and can be challenging because the fluence rate is not uniformly distributed in space, the LEDs show varying radiation profiles, the heat of the LEDs leads to convection-mixing and UV energy is absorbed by dissolved organic matter and turbidity (Baldasso et al., 2021; Keshavarzfathy et al., 2021; Sun et al., 2022; Wu et al., 2023). Instead of using computational simulations, the fluence is often derived from collimated beam experiments, in which the required parameters to calculate the fluence rate are established under near-perfect conditions. Because all light rays reach the exposed area in quasi-parallel beams, the fluence rate is identical to the irradiance. Therefore, the fluence and the dose are interchangeable terms in collimated beam experiments (Bolton and Linden, 2003).
3) Applying different exposure times changes the fluence; for instance, a low exposure time leads to a low fluence (Sommer et al., 1998).
4) Dose–response curves are created by using a biodosimeter (a specific test-organism) in a collimated beam experiment. The concentration of the biodosimeter is measured before and after UV exposure and expressed as log inactivation value. Applying different UV exposure times and plotting the dose against the log inactivation value creates the dose–response curve (linear relationship between dose and log inactivation). Dose–response curves can vary due to numerous parameters: UV lamp type, optical power output, apparatus setup, intensity measurement, shutter operation, petri dish specifications, sample volume and depth, biodosimeter type and protocol, mixing conditions, and matrix specifications (Kuo et al., 2003). Some studies use UV dose as an interchangeable term with fluence and therefore refer to fluence-response curves (Bolton and Linden, 2003). Testing different conditions in the actual LED configuration (not in a collimated beam experiment) will also result in log inactivation values. These can be compared with the dose–response curve, and a reduction equivalent dose (RED) for each condition can be calculated (Nguyen et al., 2019; Romero-Martínez et al., 2022).
5) The wavelength of the light emitted by the lamp should be as close as possible to the peak germicidal wavelength of 262 nm to achieve the highest inactivation (Khan et al., 2022).
6) Turbid water and dissolved organic matter lower the UV light transmittance (UVT) (Gandhi and Prakash, 2023).
7) Materials used for lamps require a high UVT (e.g., fused quartz). If disinfection is done in a container, a high reflectivity of the container’s materials enhances effectiveness (e.g., aluminum or optical polytetrafluoroethylene (PTFE)) (Sommer et al., 1996).
8) Biological fouling on UV-transmitting materials should be reduced or prevented to keep UVT at a maximum (Nessim and Gehr, 2006).
9) Potential risks to humans must be prevented because UV-C light is not only damaging the genomic material of microbes but also of any living cell (Raeiszadeh and Adeli, 2020).
10) Inactivation of microorganisms via UV-C light can be improved by considering various design strategy parameters: number and placement of LEDs, heat management, constant versus intermittent usage, container material and geometry, LED beam angle, and flow rate of matrix (Kang et al., 2024; Moreno-Araujo et al., 2024; Pelayo et al., 2024).
The industry has developed various products using UV-C LEDs for stored (not pumped) drinking water treatment of small volumes (0.5–1.8 L). Examples include UV lances that are inserted into a water volume, water pitchers with integrated UV disinfection or bottles containing a UV-C LED in the lid. The costs of these products range from 20 to 200 USD, a price range which is above the ability to pay for most vulnerable households in a low-income region (Varuste, 2023; LARQ, 2023a; LARQ, 2023b; Giffits, 2023).
The objectives of this study were to develop two configurations of UV-C LEDs in water containers, test their disinfection efficiency and assess their potential for providing low-cost drinking water treatment options at the household level as a do-it-yourself device.
2 Materials and methods
Two configurations of UV-C LEDs in water containers of different shapes were developed and constructed.
2.1 Rectangular water containers with wall-integrated UV-C LEDs (“domes”)
The first configuration consisted of rectangular containers (transport-box type) of two different sizes with a single UV-C LED (“dome”) integrated into each of the four sidewalls and the lid of the container. Figure 1 depicts the rectangular containers with the domes installed on the right side of the image. All five UV-C LEDs consisted of a waterproof front end, the electronics (including an integrated switching regulator to protect the LED, limiting the power input per dome to 0.3 W) and a heat management (TaoYuan, TY-UVC-275W).
Figure 1. Containers used in this study; large and small round containers on the left and large and small rectangular containers on the right. Lance is inserted into the large round container, and both rectangular containers have domes installed.
Each of the containers had a total of five UV-C LEDs, positioned at different heights to better handle changing water levels. All five LEDs were connected in a parallel setup using a luster terminal and were attached to an electrical power source (Tenma machine 72–2550). The electrical input for five domes was 12 V and 0.112 A. The price for the total of five domes was 40 USD. The domes are very durable, can be placed under water and have a theoretical lifespan of over 10,000 h according to the manufacturer (TaoYuan, 2020a). The handling of the domes is very easy for a user (turn on or turn off).
Two different ordinary polypropylene (PP) containers with the same base area were used as water containers. The small container (inner length × inner width × inner height: 36.8 cm × 26.8 cm × 11.8 cm) had a usable volume of 11.1 L when the lid was closed, which limited the filling height to 0.5 cm below the inner height (utzgroup 36-203-11.7000). The large container (inner length × inner width × inner height: 36.8 cm × 26.8 cm × 32 cm) had a usable volume of 31.1 L (utzgroup 36-205-13.7000). Holes with a diameter of 1.6 cm were drilled to insert the domes, while the sealing ring of the LEDs was placed on the outside of the container to prevent leakages.
The five domes in each container were positioned in the middle of the width of each wall and the middle of the lid, while the distance of the domes from the bottom of the container was varied. In the small container, the domes in each wall were fixed at the following distances from the bottom (measured on the inside of the container): 2.6 cm, 4.5 cm, 5.8 cm, and 7.6 cm. In the large container, the domes were fixed at 6.5 cm, 12.2 cm, 17.5 cm, and 22.5 cm from the bottom. The large container had the lowest dome on a large wall, and the heights increased clockwise when looking at the container from the top. The small container had the lowest dome in a narrow wall, and the heights increased clockwise.
The capital expenditure for the rectangular containers (container costs and dome costs) per liter of volume in the container was 3 USD/L for the large rectangular container and 6 USD/L for the small rectangular container.
2.2 Round water containers with UV-C LED strips in a fused quartz tube (“lance”)
The second configuration consisted of two different sizes of round containers that contained a fused quartz tube. Inserted into the quartz tube were UV-C LED strips (“lance”), which could be submerged into the water. Figure 2 depicts the round containers with the lance installed on the left side of the image. The lance contained two strips with 20 LEDs (TaoYuan TY-UVC-12-A-300mm), a heat pipe (Conrad 557190), thermal adhesive tape (Conrad 870919-UO), two heat sinks (Conrad 188045), a fused quartz tube (Conrad 520460), and a self-designed 3D-printed lid (see Figure 2). The total length of the lance was 43 cm, and the length of the fused quartz tube and red lid was 34 cm. A thermo element type K (Omega 5SRTC-GG-KI) was used to measure the temperature resulting from the input power lost as heat at one of the LEDs. Both LED strips were connected in a serial setup after removing their transformer and attached to an electrical power source (Tenma machine 72–2550).
Figure 2. Assembled lance with the UV-C LED strips in a fused quartz tube.
The electrical input for the lance was 28 V and 0.393 A. The price for the lance was 140 USD. The LEDs have a theoretical lifespan of over 10,000 h according to the manufacturer (TaoYuan, 2020b). The handling of the lance is very easy for a user (insert, turn on or turn off). For upscaling, the configuration of the containers with the lance requires a process to ensure a secure electrical wiring, a switch for protecting users from uncontrolled exposure to UV radiation during handling and a suitable heatsink to avoid hot areas.
Two different sizes of round containers with the same height but different diameters were used, and holes with a diameter of 3 cm were drilled in the middle of their lids to insert the lance. The small container was made of polyvinyl chloride (PVC, inner diameter × inner height: 10.3 cm × 40 cm) and had a usable volume of 3.0 L when the lid was closed, which limited the filling height to 4 cm below the inner height (container: Ostendorf 220000, lid: Ostendorf 220630). The large container was made of PP (inner diameter × inner height: 28.5 cm × 40 cm) and had a usable volume of 23.0 L (container: streng 176.415.048, lid: Ostendorf 225630).
The capital expenditure for the round containers and their lids (container costs and lance costs) per liter of volume in the container was 30 USD/L for the large round container and 57 USD/L for the small round container.
2.3 Biodosimetry
The effectiveness of disinfecting drinking water of both configurations in two container sizes was tested using the male-specific (MS2) coliphage virus (Emesvirus zinderi, DSMZ 13767) as biodosimeter (Sommer et al., 2008). It is a bacteriophage infecting only strains of the bacterium Escherichia coli (E. coli) as a host strain. MS2 is commonly used as a surrogate for enteroviruses in the water treatment industry due to its similar shape, size, and genome composition (Beck et al., 2016). Even though it shows differences in UV and spectral sensitivity, it is also used as a surrogate for cryptosporidium, adenovirus and bacteria due to its higher resistance to UV-C radiation: a dose of 290–1,200 J/m2 is required for a 4-log inactivation of MS2 (Malayeri et al., 2016). Handling of MS2 during experimentation is non-problematic, as it is a biosafety level one strain, it only infects bacteria and is relatively easy to culture and enumerate (Lazarova and Savoye, 2004). To be considered a suitable solution for drinking water treatment at the household level, the two configurations needed to achieve a 4-log inactivation of MS2 as stated by the US EPA (United States Environmental Protection Agency, 2006).
As host, the bacterium E. coli (DSMZ 5695) was used. E. coli was grown at 95 rpm and 37°C overnight in autoclaved ATCC media 271 (10 g/L tryptone, 1 g/L yeast extract, 8 g/L sodium chloride, 1 g/L glucose, and 0.3 g/L calcium chloride). To prepare MS2 stock solutions, tris buffer (2.5 g/L tris(hydroxymethyl)-aminomethane, 0.6 g/L magnesium sulfate, pH 7.3) was prepared and autoclaved. To propagate MS2, 0.1 L of tris buffer was mixed with 0.1 L of ATCC media 271 in a 0.5 L sterile glass flask (Erlenmeyer). Streptomycin was added for a final concentration of 2 mg/L, magnesium sulfate for 0.6 g/L, 2 ml of a log-phase E. coli culture, and 0.2 ml of an existing MS2 stock. The flask was well mixed and incubated (non-shaking) at 37°C for 24 h. The solution was centrifuged at 2,844 g for 15 min (Hermle Z400). The supernatant was sterile filtered using 0.2 μm syringe filters (Corning 431222). The filtrate was filled up to 1 L using sterile tris buffer. This stock solution was kept at 4°C in the dark. The concentration was determined using a 10-fold dilution series and the double agar layer method. The concentration of the stock solution was normally approximately 1010 plaque-forming units per milliliter (PFU/ml).
The double agar layer method was used for the enumeration of MS2 (United States Environmental Protection Agency, 2001). Tryptic soy agar plates (40 g/L tryptic soy agar, 0.6 g/L magnesium sulfate) with a diameter of 9 cm containing roughly 9 ml of agar were prepared. Sterile glass vials were inserted into a water bath at 55°C. A sample of 2.5 ml of soft agar (32 g/L tryptic soy agar, 0.6 g/L magnesium sulfate, autoclaved) was pipetted into each glass vial. For each sample, 0.2 ml of a log-phase E. coli culture was added to a glass vial and vortexed. Additionally, 1 ml of a sample containing MS2 was added and vortexed again. The solution was poured onto an agar plate and distributed evenly. Once all agar plates had solidified, they were incubated overnight at 37°C for 10–20 h. Incubation was performed with the plates being upside down inside a sealed plastic bag containing a wet paper tissue. The day after, PFUs were counted, and the concentration of the undiluted sample was calculated as PFU/ml.
2.4 UV-C LED and UVT specifications
The wavelength and optical power output of the UV-C LEDs were measured with a spectrometer (Instrumentsystems CAS 140 D) and a goniometer (Instrumentsystems Ledgon 123) together with the software SpecWinPro (Version 3.6.3.2635). Measuring the total power output of the UV-C LED strip with 20 lights was not possible because the instrument could not handle the length of the strip. Instead, a strip with five lights (TaoYuan TY-275-05-06) was measured with the assumption that its deviations from the specifications were representative of the 20 LED strip. Four lights were covered so that only the middle LED was measured. To improve heat transmission, the strip was attached to an aluminum heat sink using a paste. The strip was then inserted into the spectrometer for measurement.
Additionally, the UVT of the tap water used for the experiments was measured. A fused quartz cuvette of 1-cm width (Hellma Analytics 100-QS) was filled with the sample, and the intensity of UV-C radiation transmitted was analyzed using the photometer UV-1800 by Shimadzu. The wavelengths used to determine the UVT were according to the emitted wavelengths of the UV-C LEDs.
2.5 Irradiation experiments
To investigate the relationship between exposure time and log inactivation, single replicate irradiation experiments were conducted. Experiments were performed using multiple exposure times for each container. Exposure times of 1 h and 5 h were used for the lance configuration. Exposure times of 1.5 h, 3 h, 6 h, and 12 h were used for the domes configuration.
For experimentation, containers were rinsed three times with tap water and then filled with room temperature (21°C) water spiked with MS2. MS2 stock solution was added to reach a starting concentration of 108 PFU/ml. This solution was well mixed for at least 30 s using a stirring device.
After mixing, a 10 ml sample was taken just below the water surface from the spiked water before the treatment. The container was closed and allowed to settle for 30 min before the UV-C LEDs were turned on for a defined exposure time. After the treatment, the solution was mixed well again, and a 10 ml sample was taken just below the water surface from the spiked water. After the experiment, the spiked water was disinfected using 0.25 L of bleach for each 10 L solution. It was well mixed and left alone for at least 20 min before being discarded. The container was then rinsed three times with tap water to get rid of any excess bleach. Both samples—before and after exposure—were 10-fold serial diluted in tris buffer from 100 (undiluted) to 10−7.
As described above, the MS2 concentration in each dilution step was quantified in duplicates using the double agar layer method. For each dilution step, the undiluted MS2 concentration in PFU/ml was calculated from the average of the duplicates. Averages of the duplicates with more than 400 PFU/ml and less than 10 PFU/ml were excluded. The final undiluted concentration of MS2 was calculated from the average of all dilution step concentrations. Using the final undiluted concentration before (N0) and after the exposure (N), the log inactivation was calculated (log inactivation = log10(N0/N)). The raw data is provided in Supplementary material S1.
To determine the approximate exposure times required to achieve sufficient disinfection in both configurations, a pre-test was conducted using an exposure time of 1.5 h for the domes and 15 min for the lance. The containers in the pre-test were not allowed to settle for 30 min before the UV light was turned on. The water could still have been moving due to the stirring, which could result in a higher inactivation. The lance achieved hardly any MS2 inactivation during the pre-test; thus, exposure time was prolonged during the experiment. Exposure times applied during the main experiment were 1 h and 5 h for the lance and 1.5 h, 3 h, 6 h, and 12 h for the domes (data for the 1.5 h time point using the domes came from the pre-test). Process controls consisted of the same configurations, but without turning on the LEDs. The small rectangular container with the domes and the small round container with the lance were used for process controls. They contained spiked water, and samples were taken before and after the same time intervals as from the irradiated containers (1.5 h and 3 h control in a small rectangular container, 12 h control in a small round container).
2.6 Calculating dose
Instead of creating another dose–response curve for the biodosimeter MS2 under UV-C LED conditions, the averaged parameters of other publications were used to evaluate the obtained inactivation results. First, a literature search was conducted to identify studies that developed dose–response curves using collimated beam experiments by applying similar experimental parameters (to avoid inter-study differences). The parameters that had to be matched were: collimated beam experiments, created dose–response curves, used biodosimeter MS2, tested in a water matrix, used UV-C LEDs and the LEDs had a wavelength range from 265 to 285 nm. From each study, the experimental data were directly extracted from the dose–response graphs via graphreader.com (Version 1) and plotted to recreate the dose–response curves. A linear trendline starting at the origin of the scatter plot was used to average all studies into a single dose–response curve. The trendline equation (y = mx + b, where b is 0) was used to calculate a reference value for RED.
2.7 Visualization of irradiation
To gain deeper knowledge of the LED configurations and their effect on irradiated areas and inactivation, a three-dimensional (3D) model was created for the domes and the lance. The large rectangular and round containers were drawn using computer-aided design software. UV-C LEDs were added, assuming that a single LED created a light emission in the shape of a geometrical cone. The angle of the cone was dependent on the “beam angle” provided by the technical specifications. All LEDs used had a beam angle of 140°. Those models visualized the occurrence of non-irradiated (dead) volumes in the round containers, while the rectangular containers were fully irradiated.
To calculate the dead volume VDead in the round containers, the irradiated volume was subtracted from the total volume VC, as can be seen in Equation 1. The irradiated volume can be calculated by subtracting the “cone-shaped” dead volume below the lance VCone from the irradiated portion of the total volume based on the beam angle of the LEDs VLED. For VLED it was assumed the lance touched the ground of the round container (no appearance of VCone). For VCone it was assumed the “cone-shaped” dead volume was a geometrical cone.
The parameter rC describes the radius of the round container (0.1425 m for large round container and 0.0515 m for small round container), hC the height of the water (0.36 m for both round containers), bLED the beam angle of the LEDs (140°), and hLED the distance of the lowest UV-C LED from the water surface (0.2 m).
3 Results
3.1 UV-C LED and UVT specifications
The measurements of the UV-C LEDs used in the “domes” configuration identified differences from the LED specifications of the manufacturer. As presented in Table 1, the measured wavelength emitted by the domes was lower than indicated. The required input power was roughly half the power indicated by the manufacturer. This difference was due to the switching regulator attached to the UV-C LED, which limited the electrical power input to a maximum of 0.3 W. Given this limitation in input power, the optical power output was almost as high as indicated by the vendor. Consequently, less input power was lost to heat in the measurements than in the manufacturer’s specifications. The overall input power for five domes resulted in 1.3 W, while the overall optical power resulted in 0.013 W (1%). Taking the cost of five domes into consideration (40 USD), this would result in a price of 3 USD per mW optical power output.
Table 1. LED specifications from the manufacturer compared with goniometer and spectrometer measurements.
The measured wavelength emitted by the five LED strip as a proxy-measure for the 20 LED strip (used in the “lance” configuration) was higher than indicated by the manufacturer. Input power, optical power, and heat percentage were all in a very similar range. The measured wavelength was assumed to be the same for the 20 LED strip. Using the manufacturer’s specifications for heat loss and the measured input power, the theoretical optical power output could be calculated for the 20 LED strip. The overall input power for the lance resulted in 11 W, while the overall optical power resulted in 0.22 W (2%). Taking the cost of the lance into consideration (140 USD), this would result in a price of 0.6 USD per mW optical power output.
For all types of UV-C LEDs used in this study, most of the input energy was lost as heat. This resulted in only a fraction of the input energy being available for inactivation. Both the measurements and the manufacturer showed that the peak emission wavelength of all used UV-C LEDs was not the peak germicidal wavelength of 262 nm. Nevertheless, inactivation can be achieved with off-peak wavelengths, but with a lower efficiency. Also, each LED emits not only a single wavelength, but a spectrum of wavelengths. The two measured spectra of the LEDs are supplied in the Supplementary material S2.
The measurement of the UVT of tap water was 98% for wavelengths 271 and 277 nm. In tap water spiked with the MS2 solution (final concentration of 108 PFU/ml), the UVT was 97% for 271 nm and 97.5% for 277 nm.
3.2 Irradiation experiments
The log inactivation of MS2 in the containers with domes (rectangular) or lance (round) in dependence on the exposure time is presented in Figure 3. The results show that inactivation increased with increasing UV exposure time in both configurations (domes and lance) in all containers, with all inactivations following a similar trend as a function of exposure time. For the exposure time of 12 h, no plaques were detected in the small rectangular container (indicated with an arrow above the container symbol). The log inactivation in the small rectangular container, therefore, could be higher than 7.5-log. The process controls showed that the experimental setup itself did not cause any significant inactivation or growth of MS2.
Figure 3. Log inactivation of MS2 based on different UV exposure times. Domes were tested in rectangular containers, lance in round containers, and control in round and rectangular containers (1.5 h and 3 h done in small rectangular container, 12 h in small round container).
For every exposure time, the inactivation in the small container was higher than in the large container (water volume in the large container was 2.8 times (domes) or 7.6 times (lance) larger than in the small container). During shorter exposure times (1, 1.5, and 3 h), the inactivation differences in small and large containers were not very distinguishable. Only during longer exposure times (5, 6, and 12 h) do the small containers show a distinctively higher inactivation than the large containers. The highest inactivation during the shortest exposure time was reached by the small rectangular container, even though it contained eight times fewer LEDs than the lance in the round containers.
After 5 h of UV exposure, the lance in the small round container achieved a 2.6-log inactivation, and the lance in the large round container achieved a 2-log inactivation. After 6 h of UV exposure, the domes in the small rectangular container achieved a 4-log inactivation, respectively, a 2.6-log inactivation in the large rectangular container. After 12 h, the domes achieved a 6.5-log inactivation in the large rectangular container and >7.5-log inactivation in the small rectangular container. A 2-log inactivation was achieved in both rectangular containers after 3 h and the large round container after 5 h. The 4-log inactivation recommended by US EPA guidelines was achieved in the small rectangular container after 6 h of exposure time and in the large rectangular container sometime between 6 and 12 h of exposure.
Normalizing each inactivation value by the LED power (number of LEDs multiplied by optical power output per LED) and the water volume to be able to compare the different configurations better, showed similar trends (see Supplementary material S3); the highest log-inactivation per (LED power * volume) was achieved in the small rectangular container, followed by the large rectangular container, then the small round container and finally the large round container.
3.3 Calculating dose
A total of eight studies were identified with matching parameters to calculate a reference dose–response curve (Bowker et al., 2011; Oguma et al., 2016; Beck et al., 2017; Hull and Linden, 2018; Oguma, 2018; Hull et al., 2019; Nguyen et al., 2019; Nyangaresi et al., 2023). The extracted data points from those studies are presented in Supplementary material S4, and a scatter plot with the linear trendline (y = 0.0036x) is shown in Figure 4. The RED of each experimental data point was calculated using the equation of the linear trendline (y = 0.0036x). The k-value based on the Chick-Watson equation would therefore equal 0.0036 m2/J (or 0.036 cm2/mJ) for each container, as for each container, the RED was calculated based on the same linear trendline (Li et al., 2019).
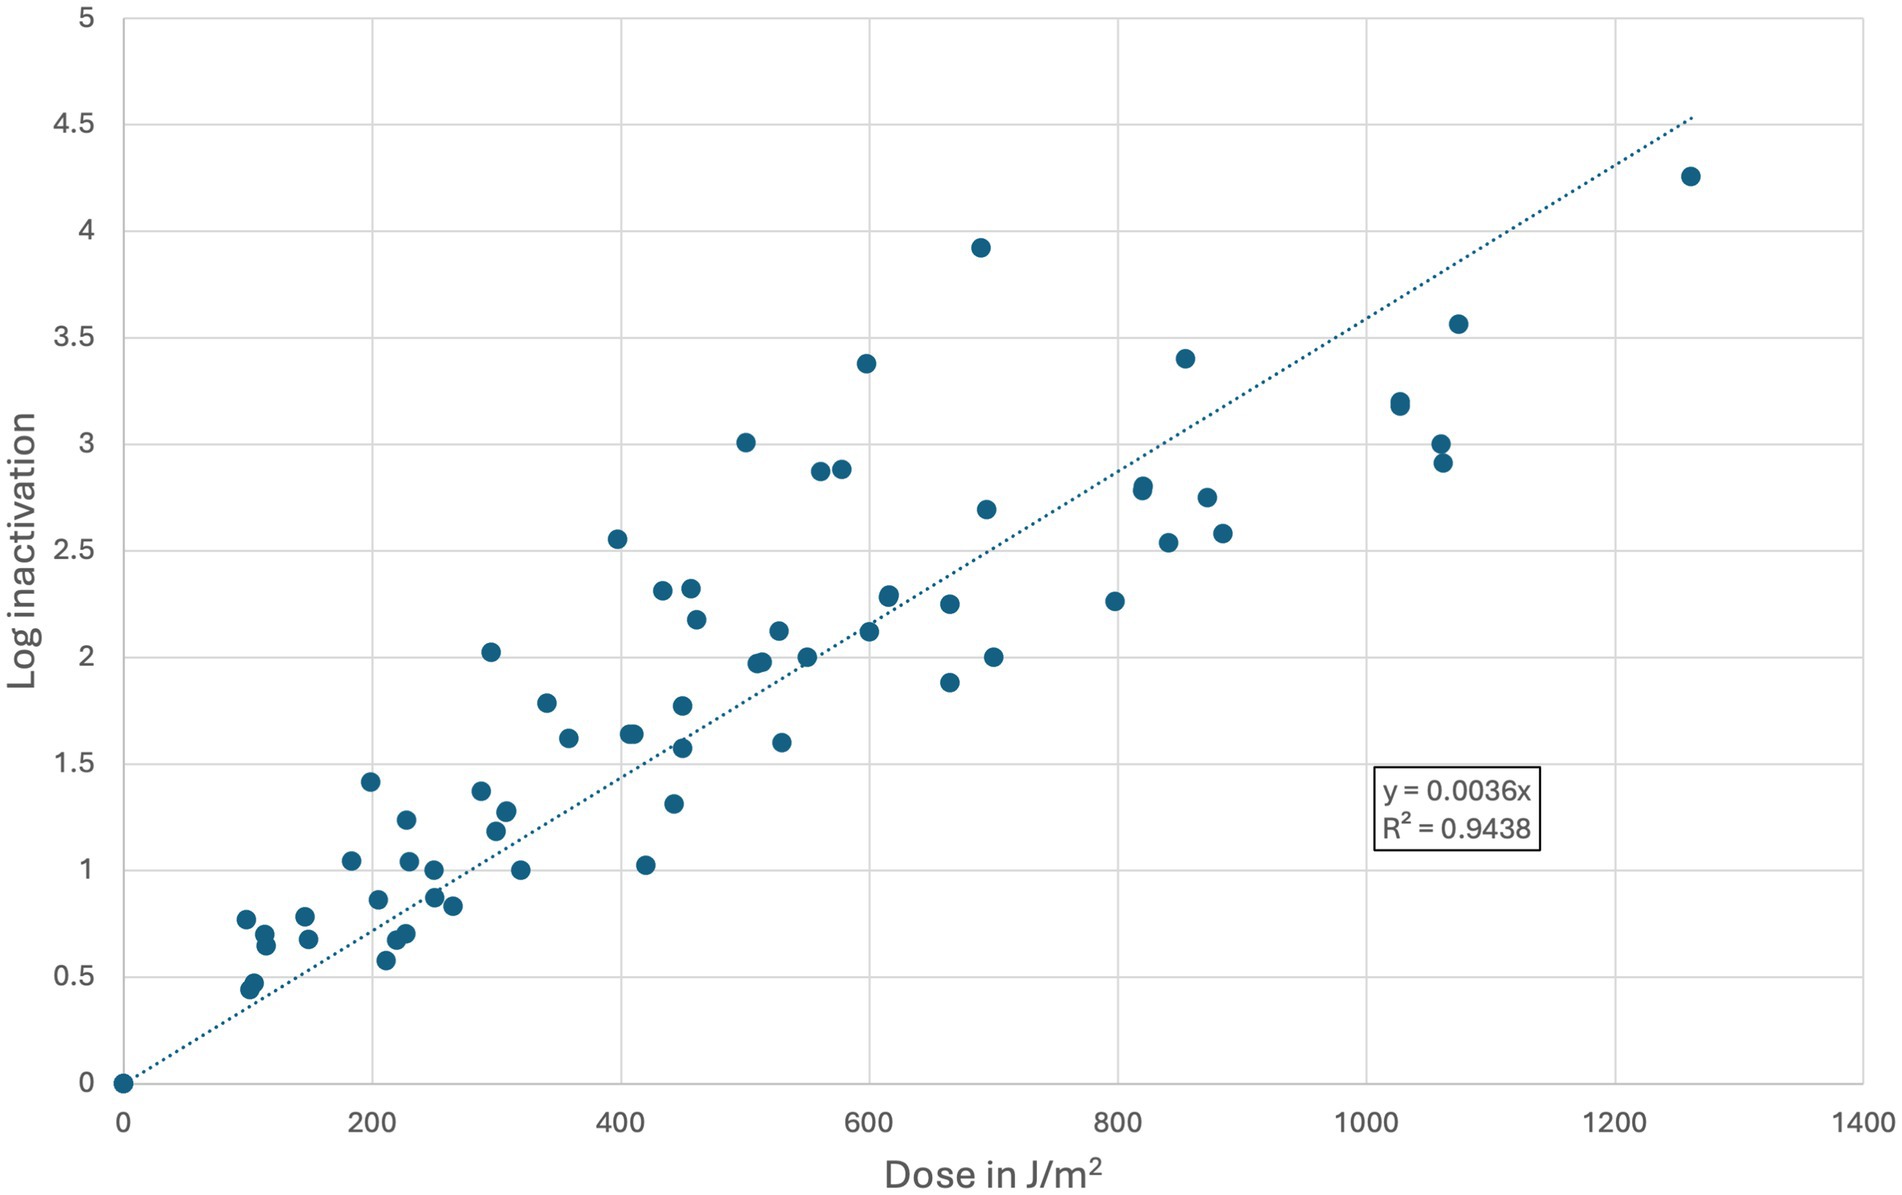
Figure 4. Extracted data points from published dose–response curves investigating MS2 in a water matrix using UV-LEDs with a wavelength range between 265 and 285 nm. A total of eight collimated beam studies were found and averaged via a linear trendline.
The RED in the large rectangular container resulted in 360 J/m2 for 1.5 h, 579 J/m2 for 3 h, 735 J/m2 for 6 h, and 1,821 J/m2 for 12 h. In the small rectangular container, the RED was 487 J/m2 for 1.5 h, 599 J/m2 for 3 h, 1,120 J/m2 for 6 h, and 2,072 J/m2 for 12 h. The RED in the large round container was 276 J/m2 for 1 h and 540 J/m2 for 5 h. In the small round container, the RED was 306 J/m2 for 1 h and 729 J/m2 for 5 h. The small rectangular container inactivated all MS2 phages present in the system after 12 h. For this container, the log inactivation and RED value could have been higher if a higher starting concentration had been used.
With an increasing exposure time, the RED also increased, though not in a linear relationship. For example, a five times higher exposure time in the round containers did not lead to a five times higher RED, but rather a two times higher RED. Using all the RED values versus exposure time, the relationship expressed via linear trendline was y = 2.43x + 110. For every time point, the RED was higher in the small container than in the large container. The RED was highest in the small rectangular container and lowest in the large round container. Three containers (large round and both rectangular containers) showed a 2-log inactivation, and they were assigned a similar RED value, despite the exposure times (3 or 5 h), the LED configurations (domes or lance) and the water volumes (31.1, 11.1, and 23 L) being different. The 4-log inactivation as stated by US EPA guidelines was achieved in the small rectangular container after 6 h of exposure time with a RED of 1,120 J/m2 and in the large rectangular container somewhere between 735 and 1,821 J/m2 (6–12 h).
3.4 Visualization of irradiation
Visualizations of the configurations in the large containers are shown in Figure 5. Schematic overviews of the UV-C LED placement within the large containers are in Panels a–c of Figure 5, 3D models in Panels d–f of Figure 5. The light cones of the LEDs indicate irradiated volume. In the case of the round containers, Panels b, c, and f show the occurrence of non-irradiated volume, due to the positioning of the UVC-LEDs in the lance. In the rectangular containers, no dead volumes occurred due to the positioning of the LEDs and all the water was reached by at least two light cones. If different UV-C LEDs with a smaller beam angle of 60° had been used instead, significantly more dead volumes would also occur in the rectangular containers (see Figure 5e). As these findings are not experimentally investigated (i.e., via irradiance measurements or ray tracing simulations), they are rather qualitative than quantitative.
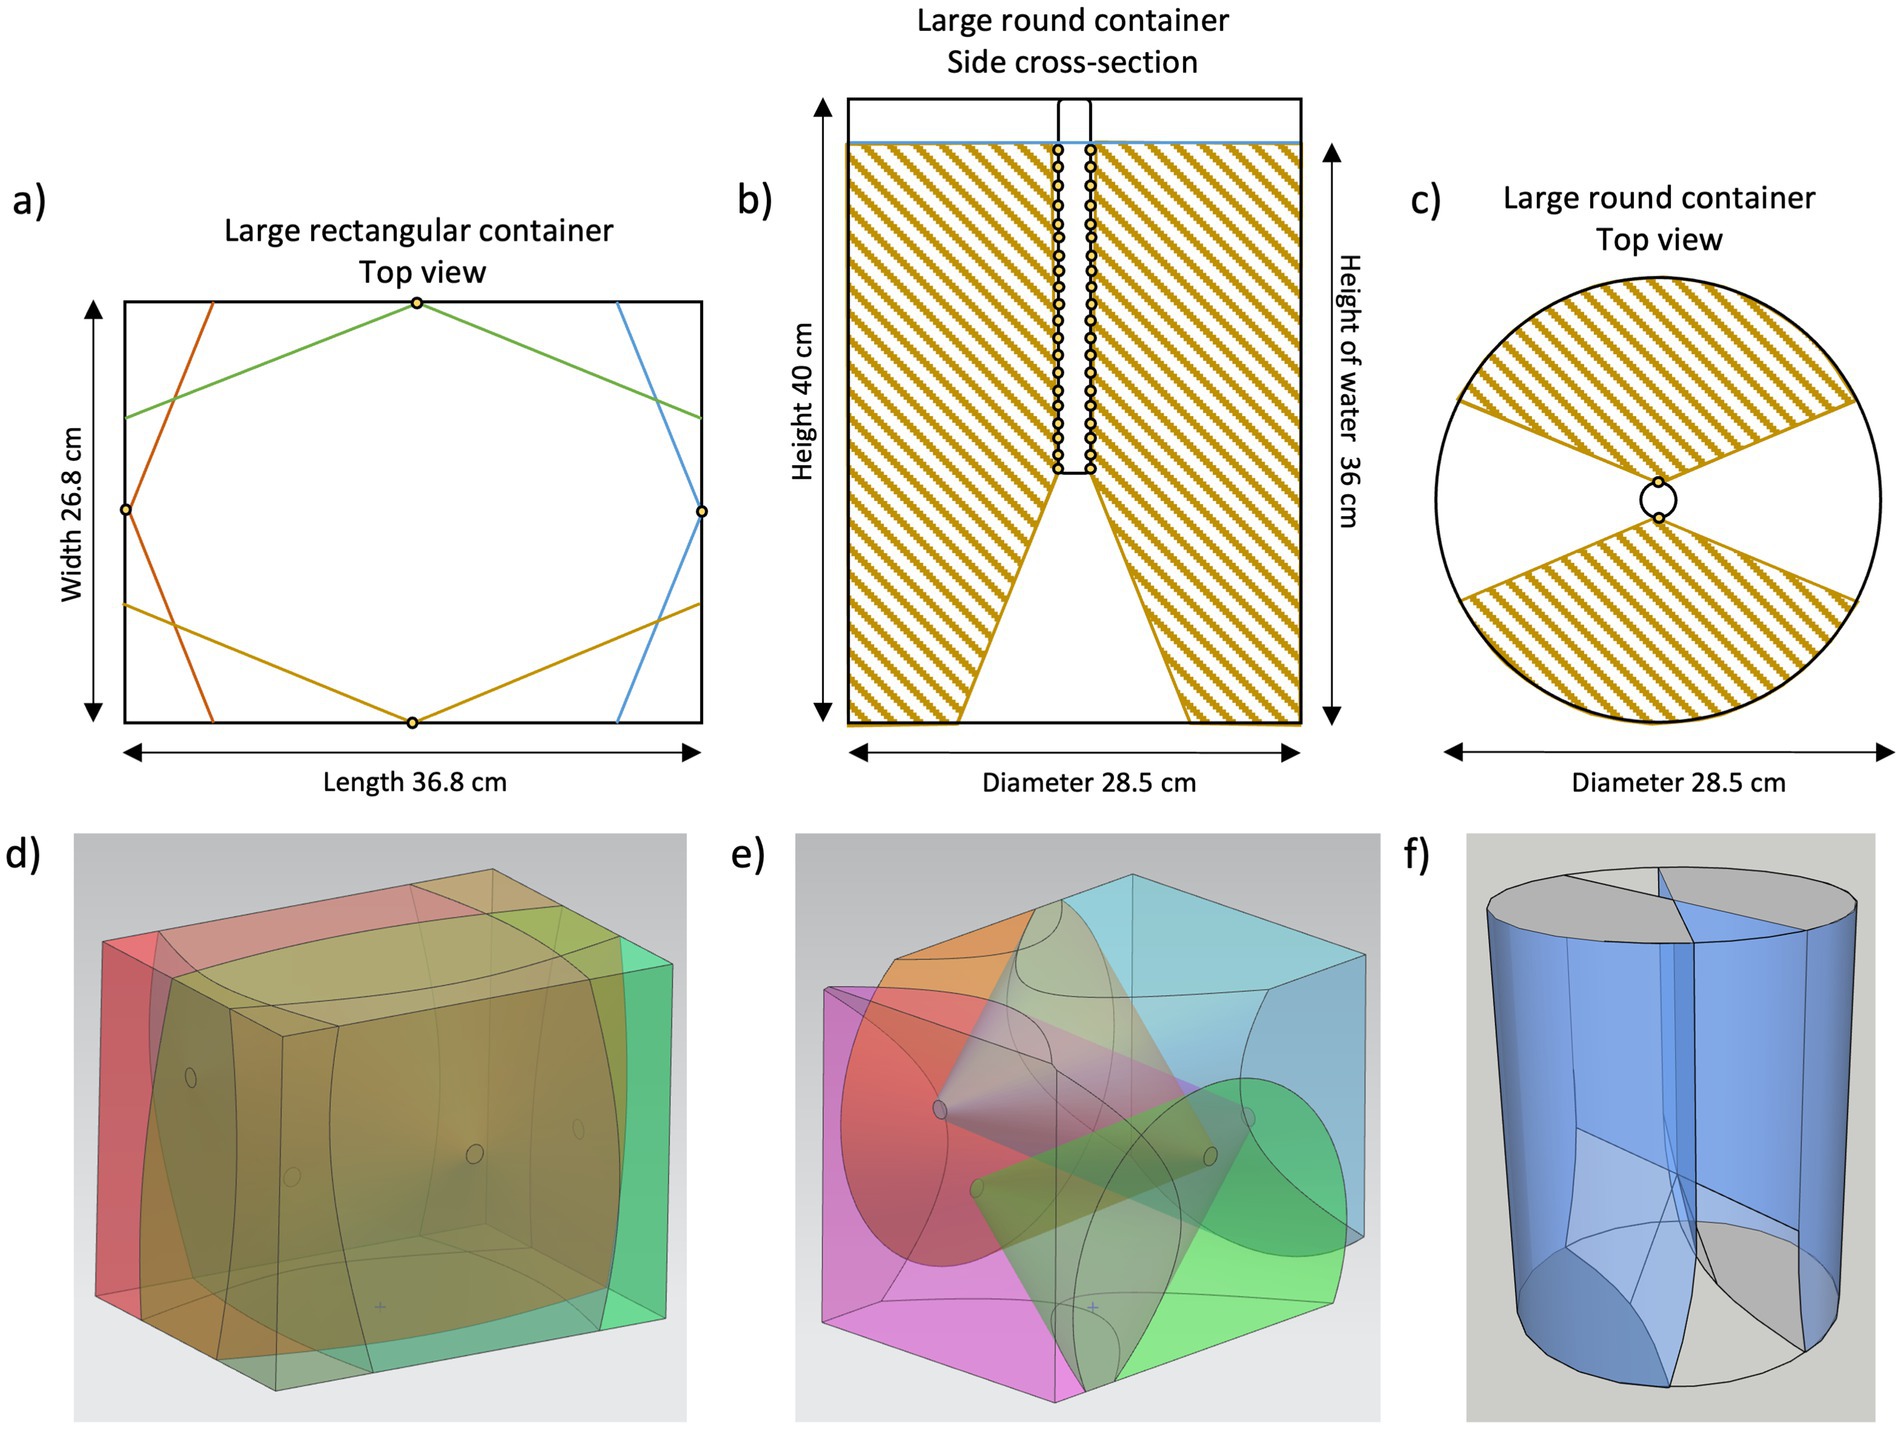
Figure 5. Schematic view of light cones in the different containers. (a) Large rectangular container including domes from the top, (b) cross-section of large round container including lance from the side, (c) large round container including lance from the top, (d) 3D depiction of large rectangular container with 140° beam angles showing no dead volumes, (e) 3D depiction of large rectangular container with 60° beam angles showing the occurrence of dead volumes, and (f) 3D depiction of large round container showing the occurrence of dead volumes.
Equation 1 resulted in a dead volume of 5.7 L (25% of the total volume) in the large round container and 1.2 L (41% of the total volume) in the small round container. With a decreasing volume of the round container, the relative dead volume increased.
4 Discussion
4.1 Implementation costs
The specific costs of providing safe drinking water are an important criterion that determines its applicability in low-income households. Considering the price of the configurations (domes versus lance), the domes were 3.5 times less expensive than the lance. The production of LEDs, however, is expected to increase and will result in lower prices, which might lead to more affordable product options in the near future (Linden et al., 2019). Prototyping costs for the lance were relatively high, but could be reduced in a large-scale production. Considering the capital expenditure costs per liter of volume in the container, the lance configuration resulted in approximately 10 times higher costs than the domes configuration. A significant part of the capital expenditure was due to the container costs, which amounted to 79% of the total cost for the large round container, 18% for the small round container, 53% for the large rectangular container, and 42% for the small rectangular container. Specific costs can be significantly reduced by choosing a lower-cost container, either a different type or sourcing it from a country with more favorable material prices.
4.2 RED values align with literature
Comparing the RED values required for a 4-log inactivation (as recommended by the US EPA) to the values from other published studies shows similar results. The RED values calculated here (small rectangular container 1,120 J/m2, large rectangular container 735–1,821 J/m2) are of course based on the dose-response curve from many of the comparable studies. But numerous other studies (with different matrix or lamp type) also show comparable RED values: Malayeri et al. (2016) summarized 57 publications dating from 1965 to 2016 investigating MS2 inactivation and obtained RED values ranging from 290 to 1,200 J/m2 to achieve a 4-log inactivation. Similarly, studies after 2016 found RED values of 600–1,750 J/m2 to fulfill a 4-log inactivation in MS2 (Zyara et al., 2017; Oguma et al., 2019; Baldasso et al., 2021; Beck et al., 2021; Keshavarzfathy et al., 2021; Szczuka et al., 2021; Freitas et al., 2024).
4.3 Inefficient inactivation
The LED configurations and container designs in this study were inefficiently applying the fluence to the biodosimeter due to several facts: First, in the lower exposure time range (1, 1.5, and 3 h) the inactivation results (and the RED values) achieved in large and small containers for both the domes and lance were very similar. However, the water volumes in large and small containers differed a lot. Second, log-2 inactivation data were measured for the domes and the lance, but a longer exposure time was used for the lance (3 versus 5 h). Third, even though the lance consisted of 40 UV-C LEDs and the domes only of five, the domes resulted in a higher inactivation in less time. Fourth, compared to collimated beam experiments, all containers required a much higher exposure time on the scale of hours instead of minutes or even seconds. To achieve higher inactivation rates in a shorter time and to improve the LED and container configurations, the following changes should be considered:
1) Using UV-C LEDs with a higher optical power output in the spectrum of 250–270 nm will lead to a higher inactivation. It is expected that doubling the optical power output will reduce the inactivation time by 50%.
2) Choosing LEDs with a wavelength closer to the germicidal peak will increase their inactivation efficiency.
3) The placement of the LEDs, the beam angle and the geometry of the container are of high importance to avoid non-irradiated volumes and reduce inefficiency due to overlapping light cones. In the lance, the narrow spacing of LEDs led to highly irradiated volumes due to 20 largely overlapping light cones. Instead, the light cone of a single LED in the large round container could have covered the complete container height, and therefore, could have disinfected almost the same volume as 20 LEDs. Hence the number of LEDs in the lance could be reduced and their orientation improved (e.g., facing the bottom of the round container as well) to avoid non-irradiated volumes. Or try the domes in the round container and install them in the lid and bottom. The shape of the container influenced the size of light cones, as a single light cone in the rectangular containers could reach a much larger volume than in the round containers: The light cone of a single UV-C LED irradiated 35% of the volume in the large round container and 90% in the large rectangular container (details of calculation in Supplementary material S5). Using reflective material inside the container could further improve the usage of UV light, as it would not be absorbed instantly.
4) The influence of UVT becomes more significant when the UV-C LED light cone is larger. In large containers, more UV light will be absorbed. For example, a light ray in the small round container had to pass an average irradiation distance (xAVG) of 20.8 cm of tap water (with a UVT of 98%) and lost 34.3% of its optical power. However, a light ray in the large rectangular container lost 46.3% of its optical power over an average irradiation distance of 30.8 cm. If the water in the container has a low UVT, for instance, due to turbidity, this effect is enhanced (calculation of xAVG and optical power loss see Supplementary material S6).
5) Mixing or stirring the water will lead to a more homogenous irradiation as bacteria or viruses are moved from non-irradiated volumes to irradiated volumes and lower the required exposure time, making the inactivation process faster. The high optical power of the lance would be more effectively used in a flow-through reactor, for instance.
6) Product safety, especially when dealing with cytotoxic UV-C radiation, is of utmost importance. Materials used for the container should not transmit any UV-C radiation, and irradiation of users must be prevented. The power supply must be secured over inactivation time, and operation requirements, including instructions for cleaning, should be clearly defined.
Specifically, the domes were able to achieve a 4-log inactivation, even though the lance contained eight times more LEDs. A higher LED number results in a higher fluence, but the inactivation values did not reflect this. Potential reasons for this inefficient application of the fluence by the lance include container geometry (occurrence of non-irradiated volumes, overlapping of light cones, and formation of much smaller light cones in the round containers), insufficient heat management (self-built in lance versus integrated in dome unit, could negatively affect wavelength and irradiance), and difference in LEDs (domes are closer to peak germicidal wavelength of 262 nm).
4.4 Recommendations for further research
This study involved a relatively low number of samples and replicates. It is recommended that further experiments be performed with a greater number of samples (more exposure times) and replicates. Additional experiments would help to improve the understanding of the treatment mechanisms of each configuration. Also, as the lance was only tested with two exposure times, additional experiments are needed to refine the inactivation curves, which could show after how many hours a 4-log inactivation will be achieved with the lance. Additionally, more replicates would increase the reliability of the data, as even in well-controlled collimated beam experiments, variances between replicates and between publications have been documented (see Figure 4).
Further experiments are recommended to investigate the effects of various factors on inactivation. For example, the effects of non-irradiated volumes on the inactivation should be investigated. Qualitative 3D models have shown the presence of non-irradiated volumes, but their actual effect in each configuration has not yet been experimentally tested. Quantitative modeling approaches like ray tracing or irradiance maps could support this investigation. Also, further experiments with the domes would be beneficial: applying improved conditions (stirring of the water to lower inactivation time, usage of LEDs with a higher optical output), using varying biodosimeters (test other pathogens), and applying field conditions (vary water levels, test different water parameters like turbidity, investigate performance under higher ambient temperature, look into post-disinfection regrowth).
5 Conclusion
This study demonstrated that low-cost configurations of UV-C LED installations in containers can be easily constructed and operated to improve the microbiological quality of drinking water at the household level. The domes achieved a 4-log inactivation of MS2 in the small and large containers, while the lance did not. The configuration with the domes required fewer individual parts, was cheaper and disinfected a larger volume than the lance. The findings underline the importance of understanding the dispersion of light within a container, the potential formation of non-irradiated volumes and the effect of overlapping light cones. The results show that the domes are an affordable, durable, easy, and safe to use configuration that can disinfect drinking water in simple containers as a build-your-own device.
While this study does not introduce a new theoretical framework or experimental technique, its primary contribution lies in the practical demonstration and comparison of two low-cost UV-C configurations. The applied perspective provides insights for future UV-C designs regarding the importance of non-irradiated volumes on reducing disinfection efficiency, the placement of UV-C LEDs resulting in a potential overlapping of light cones and the effect of the chosen container geometry on light cone size.
Data availability statement
The original contributions presented in the study are included in the article/Supplementary material, further inquiries can be directed to the corresponding author.
Author contributions
LC: Conceptualization, Data curation, Formal analysis, Investigation, Methodology, Project administration, Visualization, Writing – original draft, Writing – review & editing. AE: Conceptualization, Methodology, Resources, Supervision, Writing – review & editing. RM: Supervision, Writing – review & editing. MB: Conceptualization, Resources, Supervision, Writing – review & editing.
Funding
The author(s) declare that financial support was received for the research and/or publication of this article. Research funding was provided through the Institute of Environmental Sciences and Process Engineering (UMTEC) and the study programme of EEU Renewable Energy and Environmental Engineering, both at OST. Publication funding was provided through Lib4RI at Eawag.
Acknowledgments
The authors thank Nicolai Selva, Philipp Hofer, Colin Xiao, Raffael Palazzolo, and Gregor Siegenthaler of OST, Tim Julian of Eawag and Shangwei Zhang from Taoyuan Electron for their support during the study. We thank Matthew Halso for improving the structure of the final manuscript. OpenAI’s ChatGPT (model 4o-mini, version July 2025) was used to improve 3 sentences during the review process. The authors thank both institutions (OST and Eawag) for allotting time, space, materials and personnel to be able to conduct this study.
Conflict of interest
The authors declare that the research was conducted in the absence of any commercial or financial relationships that could be construed as a potential conflict of interest.
Publisher’s note
All claims expressed in this article are solely those of the authors and do not necessarily represent those of their affiliated organizations, or those of the publisher, the editors and the reviewers. Any product that may be evaluated in this article, or claim that may be made by its manufacturer, is not guaranteed or endorsed by the publisher.
Supplementary material
The Supplementary material for this article can be found online at: https://www.frontiersin.org/articles/10.3389/frwa.2025.1490541/full#supplementary-material
Supplementary Material Data Sheet S1 | S1 LED spectra 5LEDstrip.
Supplementary Material Data Sheet S1 | S1 LED spectra dome.
Supplementary Material Table 1 | S2 Raw data irradiation experiment.
Supplementary Material Table 2 | S4 RED calculation.
References
American Air and Water (2019). UV definitions. Available online at: https://www.americanairandwater.com/uv-definitions/ (accessed Feb 6, 2025).
Baldasso, V., Lubarsky, H., Pichel, N., Turolla, A., Antonelli, M., Hincapie, M., et al. (2021). UVC inactivation of MS2-phage in drinking water – modelling and field testing. Water Res. 203:117496. doi: 10.1016/j.watres.2021.117496
Batch, L., Schulz, C., and Linden, K. G. (2004). Evaluating water quality effects on UV disinfection of MS2 coliphage. Am. Water Works Assoc. 96, 75–87. doi: 10.1002/j.1551-8833.2004.tb10651.x
Beck, S. E., Rodriguez, R. A., Hawkins, M. A., Hargy, T. M., Larason, T. C., and Linden, K. G. (2016). Comparison of UV-induced inactivation and RNA damage in MS2 phage across the germicidal UV spectrum. Appl. Environ. Microbiol. 82, 1468–1474. doi: 10.1128/AEM.02773-15
Beck, S. E., Ryu, H., Boczek, L. A., Cashdollar, J. L., Jeanis, K. M., Rosenblum, J. S., et al. (2017). Evaluating UV-C LED disinfection performance and investigating potential dual-wavelength synergy. Water Res. 109, 207–216. doi: 10.1016/j.watres.2016.11.024
Beck, S. E., Suwan, P., Rathnayeke, T., Nguyen, T. M. H., Huanambal-Sovero, V. A., Boonyapalanant, B., et al. (2021). Woven-fiber microfiltration (Wfmf) and ultraviolet light emitting diodes (uv leds) for treating wastewater and septic tank effluent. Water (Switzerland) 13:1564. doi: 10.3390/w13111564
Bolton, J. R., and Linden, K. G. (2003). Standardization of methods for fluence (UV dose) determination in bench-scale UV experiments. J. Environ. Eng. 129, 209–215. doi: 10.1061/(ASCE)0733-9372(2003)129:3(209)
Bowker, C., Sain, A., Shatalov, M., and Ducoste, J. (2011). Microbial UV fluence-response assessment using a novel UV-LED collimated beam system. Water Res. 45, 2011–2019. doi: 10.1016/j.watres.2010.12.005
Edegbene, A. O., Yandev, D., Omotehinwa, T. O., Zakari, H., and Andy, B. O. (2025). Water quality assessment in Benue south, Nigeria: an investigation of physico-chemical and microbial characteristics. Water Sci. 39, 279–290. doi: 10.1080/23570008.2025.2483013
Freitas, B. L. S., Fava, N. M. N., Melo-Neto, M. G., Dalkiranis, G. G., Tonetti, A. L., Byrne, J. A., et al. (2024). Efficacy of UVC-LED radiation in bacterial, viral, and protozoan inactivation: an assessment of the influence of exposure doses and water quality. Water Res. 266:122322. doi: 10.1016/j.watres.2024.122322
Gandhi, J., and Prakash, H. (2023). Photo-disinfection processes for bacterial inactivation and underlying principles for water constituents’ impact: a review. Chem. Eng. J. Adv. 14:100482. doi: 10.1016/j.ceja.2023.100482
Giffits. (2023). Vakuum stainless steel flasche mit UV-C sterilisator. Available online at: https://www.giffits-werbeartikel.ch/vakuum-stainless-steel-flasche-mit-uv-c-sterilisator-weiss-werbegeschenke-438770.htm (accessed Sept 02, 2024).
Gross, A., Stangl, F., Hoenes, K., Sift, M., and Hessling, M. (2015). Improved drinking water disinfection with UVC-LEDs for Escherichia coli and bacillus subtilis utilizing quartz tubes as light guide. Water (Switzerland) 7, 4605–4621. doi: 10.3390/w7094605
Hull, N. M., Herold, W. H., and Linden, K. G. (2019). UV LED water disinfection: validation and small system demonstration study. AWWA Water Sci. 1:e1148. doi: 10.1002/aws2.1148
Hull, N. M., and Linden, K. G. (2018). Synergy of MS2 disinfection by sequential exposure to tailored UV wavelengths. Water Res. 143, 292–300. doi: 10.1016/j.watres.2018.06.017
Kang, S., Bae, J., Park, S., Kim, K., Lee, J., Yoon, C., et al. (2024). Design optimization of a cylindrical UV-C LED reactor for effective water disinfection with numerical simulations and test reactor fabrication. J. Environ. Chem. Eng. 12:112366. doi: 10.1016/j.jece.2024.112366
Keshavarzfathy, M., Hosoi, Y., Oguma, K., and Taghipour, F. (2021). Experimental and computational evaluation of a flow-through UV-LED reactor for MS2 and adenovirus inactivation. Chem. Eng. J. 407:127058. doi: 10.1016/j.cej.2020.127058
Khan, M., McDonald, M., Mundada, K., and Willcox, M. (2022). Efficacy of ultraviolet radiations against coronavirus, Bacteria, Fungi, fungal spores and biofilm. Hygiene 2, 120–131. doi: 10.3390/hygiene2030010
Kuo, J., ASCE, M., Chen, C-I., and Nellor, M. (2003). “Standardized Collimated Beam Testing Protocol for Water/Wastewater Ultraviolet Disinfection”. ASCE. doi: 10.1061/ASCE0733-93722003129:8774
Lanrewaju, A. A., Enitan-Folami, A. M., Sabiu, S., and Swalaha, F. M. (2022). A review on disinfection methods for inactivation of waterborne viruses. Front. Microbiol. 13:991856. doi: 10.3389/fmicb.2022.991856
LARQ. (2023a). LARQ bottle purevis. Available online at: https://www.livelarq.com/shop/larq-bottle-purevis?sku=BDOB050A&gclid=EAIaIQobChMIvYy-uJn0_QIVjeJ3Ch30yA2LEAQYASABEgLLWvD_BwE (accessed Mar 23, 2023).
LARQ. (2023b). LARQ pitcher purevis. Available online at: https://www.livelarq.com/shop/larq-pitcher-purevis (accessed Mar 23, 2023).
Lazarova, V., and Savoye, P. (2004). Technical and sanitary aspects of wastewater disinfection by UV irradiation for landscape irrigation. Water Sci. Technol. 50, 203–209. doi: 10.2166/wst.2004.0125
Li, X., Cai, M., Wang, L., Niu, F., Yang, D., and Zhang, G. (2019). Evaluation survey of microbial disinfection methods in UV-LED water treatment systems. Sci. Total Environ. 659, 1415–1427. doi: 10.1016/j.scitotenv.2018.12.344
Linden, K. G., Hull, N., and Speight, V. (2019). Thinking outside the treatment plant: UV for water distribution system disinfection. Acc. Chem. Res. 52, 1226–1233. doi: 10.1021/acs.accounts.9b00060
Malayeri, A. H., Mohseni, M., Cairns, B., Bolton, J. R., Chevrefils, G., Caron, E., et al. (2016). ‘Fluence (UV dose) required to achieve incremental log inactivation of Bacteria, Protozoa, viruses and algae’, IUVA News 18, 4–6.
Masschelein, W. J. (2022) in Ultraviolet light in water and wastewater sanitation. ed. R. G. Rice. 20131024th ed (Boca Raton: Lewis Publishers, CRC Press).
Moore, N., Pousty, D., Pras, A., Gehr, R., Wong, K., Ma, D., et al. (2023) ‘Decentralized UV disinfection Systems in Rural Areas or low-resource contexts: a case study compilation ’, SSRN. Available online at: https://dx.doi.org/10.2139/ssrn.4427836 (accessed September 2, 2024).
Moreno-Araujo, J. E., Ruíz-Valdiviezo, V. M., Camas-Anzueto, J. L., Pérez-Patricio, M., and Hernández-Gutiérrez, C. A. (2024). Design strategies based on UV-C LED characterization to enhance Escherichia coli inactivation. J Water Process Eng 62:105423. doi: 10.1016/j.jwpe.2024.105423
Nessim, Y., and Gehr, R. (2006). Fouling mechanisms in a laboratory-scale UV disinfection system. Water Environ. Res. 78, 2311–2323. doi: 10.2175/106143006x95474
Nguyen, T. M. H., Suwan, P., Koottatep, T., and Beck, S. E. (2019). Application of a novel, continuous-feeding ultraviolet light emitting diode (UV-LED) system to disinfect domestic wastewater for discharge or agricultural reuse. Water Res. 153, 53–62. doi: 10.1016/j.watres.2019.01.006
Nicolau, T., Gomes Filho, N., Padrão, J., and Zille, A. (2022). A comprehensive analysis of the UVC LEDs’ applications and decontamination capability. MDPI Mater. 15, 1–31. doi: 10.3390/ma15082854
Nyangaresi, P. O., Rathnayake, T., and Beck, S. E. (2023). Evaluation of disinfection efficacy of single UV-C, and UV-A followed by UV-C LED irradiation on Escherichia coli, B. Spizizenii and MS2 bacteriophage, in water. Sci. Total Environ. 859:160256. doi: 10.1016/j.scitotenv.2022.160256
Oguma, K. (2018). Inactivation of feline calicivirus using ultraviolet light-emitting diodes. FEMS Microbiol. Lett. 365:fny194. doi: 10.1093/femsle/fny194
Oguma, K., Rattanakul, S., and Bolton, J. R. (2016). Application of UV light–emitting diodes to adenovirus in water. J. Environ. Eng. 142:04015082. doi: 10.1061/(asce)ee.1943-7870.0001061
Oguma, K., Rattanakul, S., and Masaike, M. (2019). Inactivation of health-related microorganisms in water using UV light-emitting diodes. Water Sci. Technol. Water Supply 19, 1507–1514. doi: 10.2166/ws.2019.022
Pelayo, D., Hernández-Pellón, A., Santos, G., Rumayor, M., Ortiz, I., and Rivero, M. J. (2024). Performance of high-efficiency UV-C LEDs in water disinfection: experimental, life cycle assessment, and economic analysis of different operational scenarios. J. Environ. Manag. 364:121442. doi: 10.1016/j.jenvman.2024.121442
Raeiszadeh, M., and Adeli, B. (2020). A critical review on ultraviolet disinfection systems against COVID-19 outbreak: applicability, validation, and safety considerations. ACS Photonics 7, 2941–2951. doi: 10.1021/acsphotonics.0c01245
Romero-Martínez, L., Moreno-Andrés, J., Acevedo-Merino, A., and Nebot, E. (2022). Development of a geometrical model for the determination of the average intensity in a flow-through UV-LED reactor and validation with biodosimetry and actinometry. J Water Process Eng 49:103137. doi: 10.1016/j.jwpe.2022.103137
Singh, A. K., Das, S., Singh, S., Pradhan, N., Gajamer, V. R., Kumar, S., et al. (2019). Physicochemical parameters and alarming coliform count of the potable water of eastern Himalayan state Sikkim: an indication of severe fecal contamination and immediate health risk. Front. Cell Dev. Biol. 7:174. doi: 10.3389/fpubh.2019.00174
Smieja, J. A. (2011). Household water treatments in developing countries. J. Chem. Educ. 88, 549–553. doi: 10.1021/ed100480p
Sommer, R., Cabaj, A., and Haider, T. (1996). Microbicidal effect of reflected UV radiation in devices for water disinfection. Water Sci. Technol. 34, 173–177. doi: 10.1016/S0273-1223(96)00742-1
Sommer, R., Cabaj, A., Hirschmann, G., and Haider, T. (2008). Disinfection of drinking water by UV irradiation: basic principles – specific requirements – international implementations. Ozone Sci. Eng. 30, 43–48. doi: 10.1080/01919510701759181
Sommer, R., Haider, T., Cabaj, A., Pribil, W., and Lhotsky, M. (1998). Time dose reciprocity in UV disinfection of water. Water Sci. Technol. 38, 145–150. doi: 10.2166/wst.1998.0526
Sun, Z., Li, M., Li, W., and Qiang, Z. (2022). A review of the fluence determination methods for UV reactors: ensuring the reliability of UV disinfection. Chemosphere 286:131488. doi: 10.1016/j.chemosphere.2021.131488
Szczuka, A., Berglund-Brown, J. P., MacDonald, J. A., Mitch, W. A., et al. (2021). Control of sulfides and coliphage MS2 using hydrogen peroxide and UV disinfection for non-potable reuse of pilot-scale anaerobic membrane bioreactor effluent. Water Res. X 11:97. doi: 10.1016/j.wroa.2021.10
TaoYuan. (2020a). Waterproof IP67 275 nm UVC LED. Available online at: https://taoyuan.en.made-in-china.com/product/VvcmEsrURnap/China-Waterproof-IP67-275nm-UVC-LED.html (accessed Oct 02, 2020).
TaoYuan. (2020b). UVC LED Sterilizer 275 nm. Available online at: https://taoyuan.en.made-in-china.com/product/OsFmZCUlPIVB/China-UVC-LED-Sterilizer-275nm-300X12mm-100MW-UV-LED-Hard-Strip.html (accessed Oct 03, 2020).
TaoYuan. (2020c). USB Charge UVC LED. Available online at: https://taoyuan.en.made-in-china.com/product/kSVxBFZuZnGg/China-USB-Charge-UVC-LED-Disinfection-Light-Bar.html (accessed Oct 04, 2020).
Troeger, C., Forouzanfar, M., Rao, P. C., Khalil, I., Brown, A., Reiner, R. C. Jr., et al. (2017). Estimates of global, regional, and national morbidity, mortality, and aetiologies of diarrhoeal diseases: a systematic analysis for the global burden of disease study 2015. Lancet Infect. Dis. 17, 909–948. doi: 10.1016/S1473-3099(17)30276-1
United States Environmental Protection Agency (2001) Method 1602: Male-Specific (F+) and Somatic Coliphage in Water by Single Agar Layer (SAL) Procedure, EPA 821-R-01–029. Washington, DC, USA: U.S Environmental Protection Agency.
United States Environmental Protection Agency (2006). Ultraviolet disinfection guidance manual for the final long term 2 enhanced surface water treatment rule, EPA 815-R-06–007. Washington, DC, USA: U.S Environmental Protection Agency.
Varuste. (2023). Steripen. Available online at: https://varuste.net/de/p113384/steripen-classic-3-uv-water-purifier?&gclid=EAIaIQobChMIzpuq45j0_QIV2weLCh3jtQ08EAYYCCABEgIU1vD_BwE (Accessed March 23, 2023).
World Health Organization. (2020). Sustainable development goals. Available online at: https://www.who.int/health-topics/sustainable-development-goals#tab=tab_3 (accessed Sep 14, 2020).
World Health Organization. (2022). Drinking water. Available online at: https://www.who.int/news-room/fact-sheets/detail/drinking-water (accessed Jul 17, 2023).
Wu, J., Deng, B., Zou, X., and Luo, J. (2023). A systematic simulation of disinfection for the flow-through UV reactors with staggered ring baffles under the Eulerian framework. J Water Process Eng 52:103598. doi: 10.1016/j.jwpe.2023.103598
Keywords: drinking water disinfection, UV-C LED, LED placement, non-irradiated volume, container design, household water treatment, MS2 inactivation, DIY UV device
Citation: Caduff L, Englert A, Meierhofer R and Burkhardt M (2025) Comparison of two different container designs and UV-C LED configurations in their drinking water disinfection efficiency. Front. Water. 7:1490541. doi: 10.3389/frwa.2025.1490541
Edited by:
Ashish Kumar Singh, Center of Innovative and Applied Bioprocessing (CIAB), IndiaReviewed by:
Roberto Rodriguez, Indiana University, United StatesSunitha Vangala, Yogi Vemana University, India
Carlos A. Hernandez-Gutierrez, National Polytechnic Institute, Mexico
Copyright © 2025 Caduff, Englert, Meierhofer and Burkhardt. This is an open-access article distributed under the terms of the Creative Commons Attribution License (CC BY). The use, distribution or reproduction in other forums is permitted, provided the original author(s) and the copyright owner(s) are credited and that the original publication in this journal is cited, in accordance with accepted academic practice. No use, distribution or reproduction is permitted which does not comply with these terms.
*Correspondence: Lea Caduff, bGVhLmNhZHVmZkBlYXdhZy5jaA==