 Seyoum Bezabih Kidane1*
 Mariye Melkam Taye1,2
- 1Department of Integrated Watershed Management, Debre Markos Agricultural Research Center, Ethiopian Institute of Agricultural Research, Addis Ababa, Ethiopia
- 2Department of Animal Nutrition and Management, Debre Markos Agricultural Research Center, Ethiopian Institute of Agricultural Research, Addis Ababa, Ethiopia
Water is a vital resource for humanity, with groundwater being the largest source of fresh water available. The Hormat-Golina sub-basin, located in the North Wollo Zone of the Amhara region, is a key area for groundwater-based irrigation. However, irregular rainfall patterns in both timing and distribution make it challenging for residents to maintain adequate soil moisture for crop growth. As a result, there is an increasing demand for agricultural development utilizing groundwater in this region. Despite ambitious irrigation expansion plans, there has been insufficient assessment of groundwater reserves and recharge rates. Understanding the spatial variability of groundwater recharge in relation to land use, soil texture, topography, groundwater levels, and hydrometeorological factors is crucial to ensure the sustainable development of groundwater resources. This study aimed to estimate the spatial groundwater recharge in the Hormat-Golina sub-basin in northern Ethiopia using a spatially distributed water balance model (WetSpass). Input data for the model were organized into grid maps with a 30 m grid size, and parameters were tailored to reflect the specific conditions of the sub-basin based on expert insights and scientific research. The model results demonstrated a strong correlation between observed and simulated surface runoff, with R2 = 0.94 and NSE = 0.85. The findings indicated that the long-term average annual rainfall of 829 mm was distributed as follows: 156 mm (19%) for surface runoff, 617 mm (73%) for evapotranspiration, and 55 mm (8%) for recharge. This recharge amounts to ~400,000 cubic meters for the Hormat-Golina sub-basin, which covers an area of about 698 km2. Notably, 83% of this recharge occurs during the rainy summer season, while the remaining 17% occurs during the dry (beg) season. The highest recharge rates were recorded in forested areas with sandy soil.
1 Introduction
Groundwater is the most significant source of fresh water and is crucial for human survival (Mengistu et al., 2019a; Al-Ruzouq et al., 2015; Mengistu et al., 2019b). Its essential characteristics, such as stable temperature, widespread availability, and continuous supply, make it an important resource in various climatic zones. Given its limited and vulnerable nature, it is vital to use groundwater resources sustainably for both current and future generations (Yenehun et al., 2017; Solomatine and Wagener, 2011).
Effective management of groundwater resources relies on a deep understanding of recharge processes and potential (Fenta et al., 2015). Various methods for estimating groundwater recharge, from direct measurements to empirical approaches, are essential for this purpose (Teklebirhan et al., 2012; Haile, 2015; Gebremeskel and Kebede, 2017). The selection of a particular method depends on factors like spatial and temporal scales, as well as the reliability of the recharge estimates (Gidafie et al., 2016).
In the Hormat-Golina sub-basin of Northern Ethiopia, which relies on rain-fed agriculture and experiences variable rainfall, groundwater is critical for food security. The variability in rainfall often leads to insufficient soil moisture, increasing the need for supplemental irrigation and reliance on groundwater (Gebremeskel and Kebede, 2017). Despite its increasing significance, past studies have primarily concentrated on point estimates of groundwater recharge and have not employed robust methodologies (Ayenew et al., 2008; Belay and Bewket, 2013).
This study seeks to fill this gap by estimating long-term seasonal and annual average groundwater recharge in the Hormat-Golina sub-basin using the GIS-based WetSpass model. By integrating factors such as land use, soil texture, slope, and hydrometeorological conditions, the model provides a more detailed understanding of groundwater recharge variability, which is crucial for sustainable management of groundwater resources and agricultural development in the area.
2 Materials and methods
2.1 Description of the study area
The Hormat-Golina sub-basin is located in northern Ethiopia, between latitudes 11°56′-12°13′N and longitudes 39°25′-39°47′E (see Figure 1). It is bordered by the Lasta Mountains to the west, the Zobel Mountains to the east, the Raya Valley to the north, and volcanic ridges to the south, encompassing an area of 698 km2. This sub-basin is situated on the western edge of the Danakil basin and features distinct physiographic traits, including north-south oriented mountains in the west, a steep fault scarp on the eastern side, and a major graben interspersed with isolated hills.
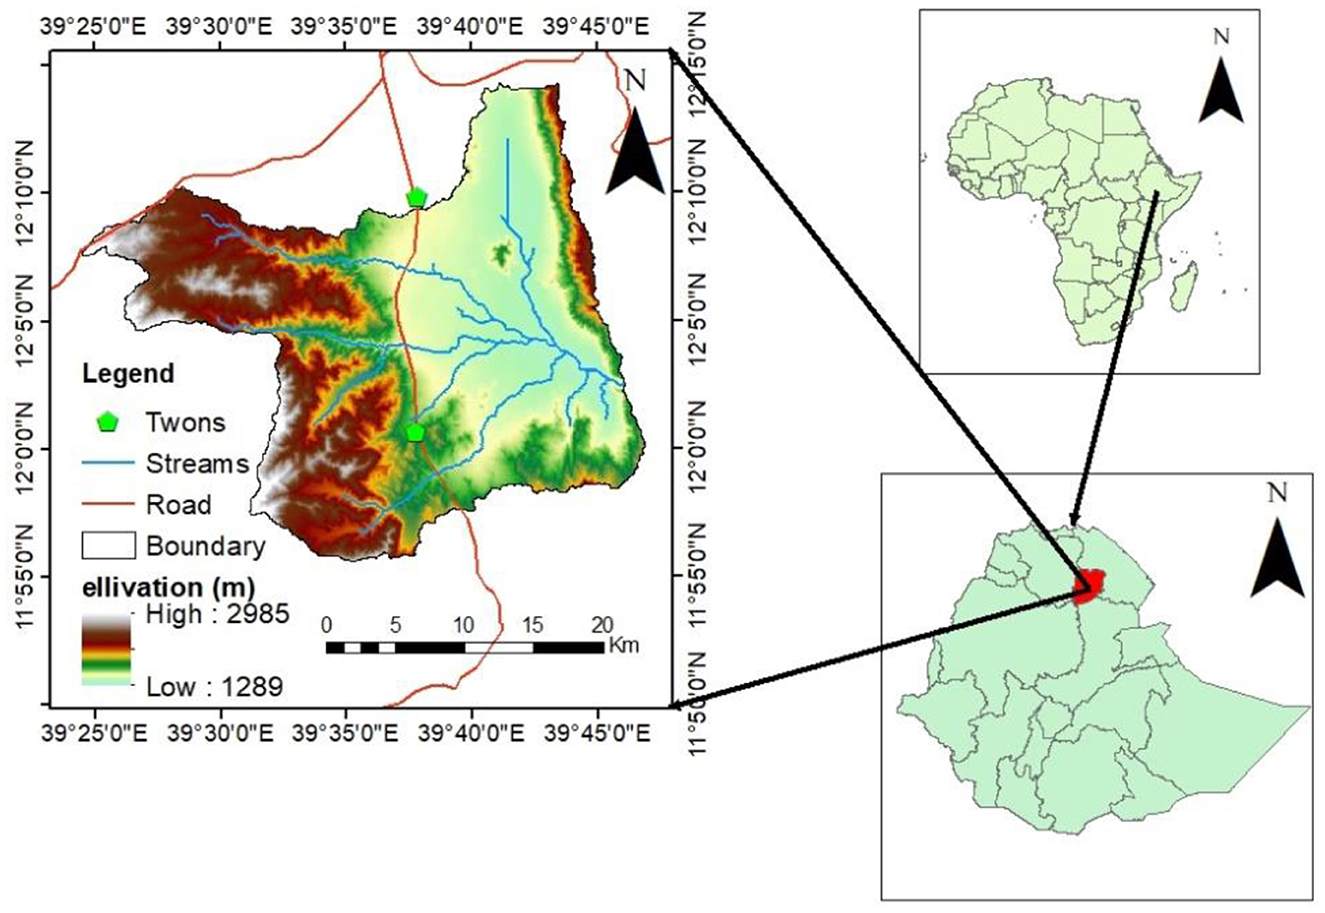
Figure 1. Location map of the Hormat-Golina sub-basin.
The region mainly consists of Quaternary sediments, with high-elevation volcanic mountains lining its eastern and western borders. These mountains are primarily composed of Tertiary-aged volcanic rocks such as basalts, rhyolite, and granite, which are exposed in surrounding areas and underlie the valley's alluvial deposits. Geological features, including significant and inferred faults, fractures, and lineaments, show alignments ranging from north-south to northeast-southwest, playing a crucial role in the hydrology of the catchment (Tadesse et al., 2015).
Elevation in the sub-basin varies from 1,189 m in the valley floors to 2,985 m above sea level in the western mountain ridges. The area experiences an irregular bimodal rainfall pattern, with the main rainy season occurring from late June to early September. Peak rainfall is generally recorded in July and August, while a brief spring rainy season takes place from February to March. Monthly temperatures fluctuate, with average lows of 4.7°C in the Lasta plateaus and average highs of 35.5°C in the Waja lowlands. June typically sees the highest temperatures, while November records the lowest. The western mountainous terrain is intersected by streams and steep slopes, promoting high runoff rates, which provide seasonal recharge to the valley floor from runoff that flows down from the nearby hills. In this region, rain-fed agriculture, which often depends on the diversion of seasonal floodwaters, is a prevalent agricultural practice.
2.2 Dataset and sources
The primary data utilized in this study consisted of remote sensing data and ancillary data. The remote sensing data included the Digital Elevation Model (DEM) and groundwater level information. Ancillary data encompassed hydro-meteorological elements such as rainfall, temperature, wind speed, potential evapotranspiration (PET), as well as bio-physical data like soil texture and land use/land cover. These datasets were essential for generating the necessary inputs for the water balance model (WetSpass).
Mean monthly meteorological variables (rainfall, temperature, and wind speed) were collected over a 22-year period (2000–2021) from seven stations managed by the National Meteorology Agency (NMA) of Ethiopia. The Hargreaves equation was employed to calculate potential evapotranspiration, as it requires only a few easily accessible variables: minimum, maximum, and mean temperatures, along with extraterrestrial radiation. In cases where sufficient meteorological data for the Penman-Monteith method are lacking, the FAO recommends using the Hargreaves method as an alternative (Allen et al., 1998; Hargreaves and Samani, 1982). The PET was estimated using the Hargreaves method available in the R-software SPI package, which uses an empirical approach based on calculated extraterrestrial radiation and temperature without requiring direct radiation monitoring. The formula for PET is as follows:
Where: PET = Evapotranspiration [mm day−1], TT = Mean temperature of the day [°C], RsRs = Solar radiation [MJ m−2 day−1], conv = Conversion to ET equivalent (conv = 4082.0) [m2 mm MJ−1].
To assess groundwater recharge, biophysical data such as soil texture and groundwater level data were necessary. The soil texture map for the Hormat-Golina sub-basin was sourced from the Ministry of Water, Irrigation, and Energy (MWIE) of Ethiopia. Initial groundwater depth data were collected from 34 boreholes drilled in the area (between 1999 and 2019), primarily by the Amhara Water Works Construction Enterprise (AWWCE) and the Kobo-Girana Valley Development Project (KGVDP). The slope and topographic maps of the study area were processed using a 12.5 × 12.5 m resolution Digital Elevation Model (DEM) obtained from the Alaska Satellite Facility (ASF) website (https://asf.alaska.edu/) and processed using ArcGIS. Land use/land cover (LULC) data were obtained from the Ethiopian Geospatial Institute (EGI) with a 30 m resolution. Remote sensing and GIS software packages were used to process the data and extract the required input variables for the WetSpass model, with GIS applications serving as the primary tools for managing spatial and temporal variability (Tilahun and Merkel, 2009).
2.3 Data analysis
2.3.1 WetSpass model description
WetSpass, which stands for Water and Energy Transfer between Soil, Plants, and Atmosphere under quasi-Steady State, is a physically-based model intended to estimate long-term average spatial patterns of groundwater recharge, surface runoff, and evapotranspiration (Batelaan et al., 2003; Batelaan and De Smedt, 2007). It incorporates long-term average meteorological data alongside grid maps of land use, soil, and groundwater levels, utilizing both physical and empirical relationships (Gebremeskel and Kebede, 2017). The model is integrated into ArcGIS as a raster model and is programmed using Avenue and Visual Basic. WetSpass generates various hydrological outputs on both annual and seasonal (summer and winter) bases (Gebremeskel and Kebede, 2017). Parameters like land use and soil type are connected to the model through attribute tables corresponding to the raster maps, facilitating the easy definition of new land cover or soil types and modifications of parameter values to explore future land and water management scenarios (Ghouili et al., 2017).
WetSpass models treats a basin or region as a grid of raster cells, with each cell's total water balance divided into independent components for vegetated areas, bare soil, open water, and impervious surfaces. This method addresses the variability of land use within each cell, which is influenced by the resolution of the raster cells. The processes within each part of a cell are organized in a cascading order, reflecting the sequence of events following a precipitation event. This seasonal framework allows for the quantification of processes while taking into account physical and hydro-meteorological constraints (Meresa and Taye, 2019).
The water balance components for vegetated areas, bare soil, open water, and impervious surfaces are calculated using Equations 1–3, where Eta represents total evapotranspiration, Sa indicates surface runoff, and Ra denotes groundwater recharge for each raster cell. These components are based on the proportions of vegetated, bare soil, open water, and impervious areas within each cell.
Where Eta, Sa, and Ra are the total evapotranspiration, surface runoff, and groundwater recharge of a raster cell respectively, each having vegetated, bare soil, open water and impervious area fractions denoted by av, as, ao and ai respectively, E is evaporation.
Water balance calculations begin with precipitation, which is then followed by processes such as interception, surface runoff, evapotranspiration, and recharge, in a specified sequence of events (Figure 2).
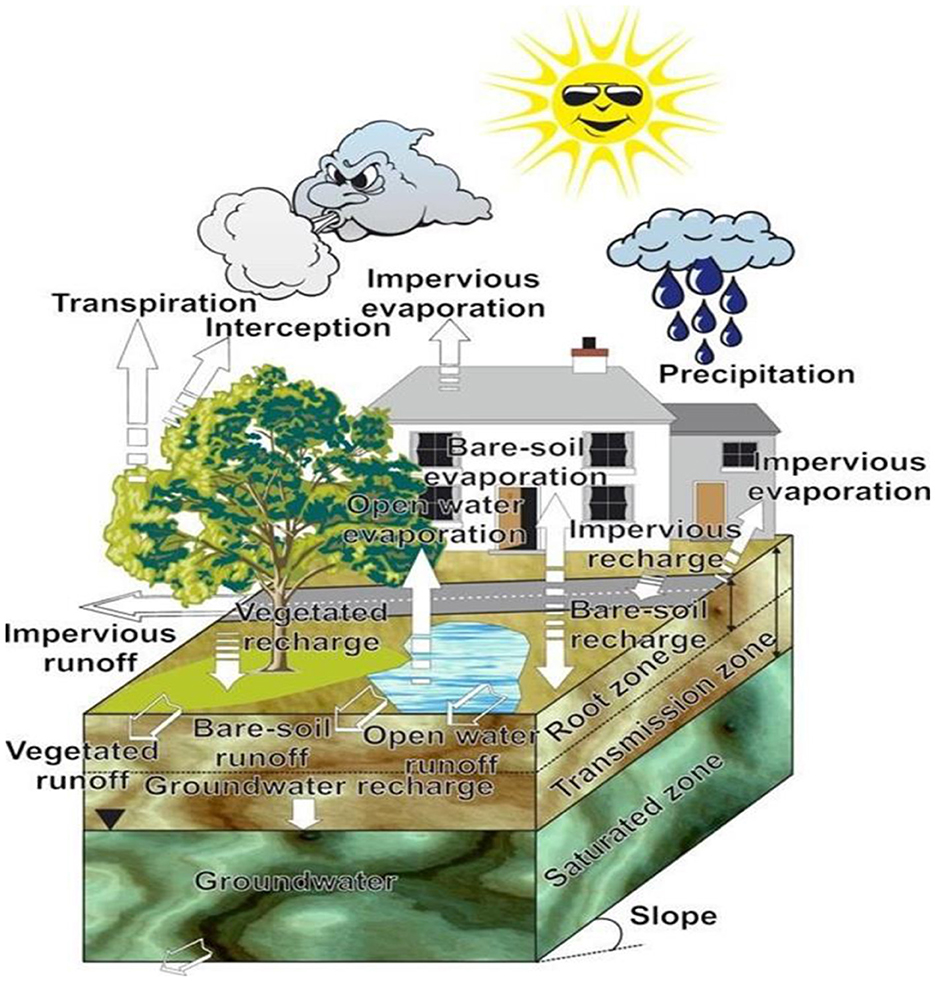
Figure 2. Schematic water balance of hypothetical raster cell (Batelaan and De Smedt, 2001).
2.3.2 WetSpass model data inputs preparation
The preparation of input data for the WetSpass model involved digitizing existing maps, processing remote sensing images, and integrating field data to extract relevant information. According to Rwanga (2013) the model requires two types of inputs: Arc-Info grid maps and parameter DBF tables. As noted by Dereje and Nedaw (2018), the recharge process is influenced by the interplay of climate, geology, morphology, soil conditions, and vegetation. Consequently, input data were organized into grid maps representing meteorological, hydrological, and geographical elements of the sub-basin, all prepared with a grid cell size of 30 m by 30 m.
Meteorological data from seven stations of the Ethiopian National Meteorological Agency (EMA) were utilized to create the meteorological inputs for the WetSpass model. Missing records were a common issue in the study area, but the selected stations provided relatively consistent data over the 22-year period from 2000 to 2021. Each station's data were analyzed to determine seasonal and annual meteorological averages. Precipitation and temperature data were available for all stations, while wind speed measurements were only recorded at Kobo, Maichew, and Chercher stations. The Hargreaves equation (Hargreaves and Samani, 1985) was employed to estimate potential evapotranspiration (PET) at the seven stations.
Seasonal and annual grid maps for the climatic variables were developed using an interpolation method to derive values from a limited number of sample points across unknown geographic locations. The Inverse Distance Weighted (IDW) interpolation method was chosen for its reliability in producing consistent results with known values. The WetSpass input grid maps for major meteorological parameters in the Hormat-Golina sub-basin revealed significant spatial variation related to topography. Notably, the orographic effect led to substantial differences in rainfall, with the Lasta highland receiving more precipitation than the valley bottoms.
During the wet (summer) season, precipitation values ranged from 421 mm to 686 mm, averaging 416 mm, while in the dry (winter) season, values varied from 288 mm to 340 mm, with a mean of 312 mm. The highest precipitation levels were primarily located in the western highlands of the sub-basin, resulting in a mean annual precipitation of 829 mm.
The average monthly PET was calculated for the period from 2000 to 2021 using monthly average temperature values from the seven stations. The highest PET value recorded was 1,180 mm during the dry season (October–May), with minimum and maximum values of 947 mm and 1,180 mm, respectively, and a mean of 1,113 mm for the winter season. In contrast, the summer season saw PET values ranging from 541 mm to 692 mm, with a mean of 647 mm. The mean annual potential evapotranspiration for the sub-basin was 1,759 mm.
Temperature data indicated that during the dry season, temperatures ranged from 15°C to 23°C, with a mean of 19°C, while the summer season temperatures ranged from 17°C to 25°C, averaging 21°C. Overall, the mean annual temperature of the Hormat-Golina sub-basin was 20.3°C, with an average wind speed of 2 m/s per year.
The land use/land cover map of Ethiopia for 2020 was created by the Ethiopian Geospatial Institute (GSI). From this map, the land use and land cover for the Hormat-Golina sub-basin were extracted and modified. The primary land use and vegetation types identified in the sub-basin include forests, shrub-bush land, cropland, bare land, wetlands, grassland, woodlands, and settlements. The classification of land use/land cover in the study area resulted in eight categories: settlement (0.7%), bare land (10.5%), cropland (47.4%), grassland (4.4%), wetland (0.6%), woodland (11.2%), forest (12.6%), and shrub-bush land (12.6%).
Soil texture and permeability are critical factors for estimating groundwater recharge, as coarse-grained soils typically allow for higher recharge rates compared to fine-grained soils (Cook et al., 1992). The soil map for the Hormat-Golina sub-basin was derived from the national soil map developed by the Ministry of Water, Irrigation, and Energy (MWIE) of Ethiopia. This map categorized the sub-basin's soils into four types: sandy loam, silty clay loam, loam, and clay loam, with silty clay loam being the predominant type across the catchment.
Groundwater depth data were generated from static water level measurements taken from boreholes and springs. A total of 34 static water level measurements, primarily located in the valley areas, were used to interpolate and create a groundwater depth grid map. The groundwater elevation map was produced by subtracting static water levels from ground elevation. The results revealed that groundwater levels in the Hormat-Golina sub-basin range from 1,368 m to 1,481 m during the wet season and from 1,359 m to 1,489 m during the dry season.
Elevation and slope maps for the study area were developed using datasets from the Alaska Satellite Facility (ASF), which provides a Digital Elevation Model (DEM) with a resolution of 12.5 × 12.5 m. The highest point in the sub-basin is located upstream on the western escarpment at 1,319 meters, while the lowest point in the eastern downstream area is at 1,290 meters.
Slope is a vital factor in understanding the hydrological characteristics of the watershed. Steep slopes typically serve as recharge zones, whereas moderate slopes act as discharge areas, showing a direct relationship with topography. The slope map of the study area was created using ArcGIS and the 12.5 m × 12.5 m DEM. It categorizes slopes based on steepness, ranging from 0 to 43 degrees, where 0 indicates gentle lowland and 43 signifies steep escarpments. The Hormat-Golina sub-basin features a significant region of steep slopes unsuitable for agriculture, as well as flat lowland areas conducive to farming. Approximately 41% of the study area has slopes below 5 degrees, 5% exceeds 25 degrees, and the remaining 54% falls between 5 and 25 degrees, which is favorable for recharge and discharge hydrological processes (Figure 3).
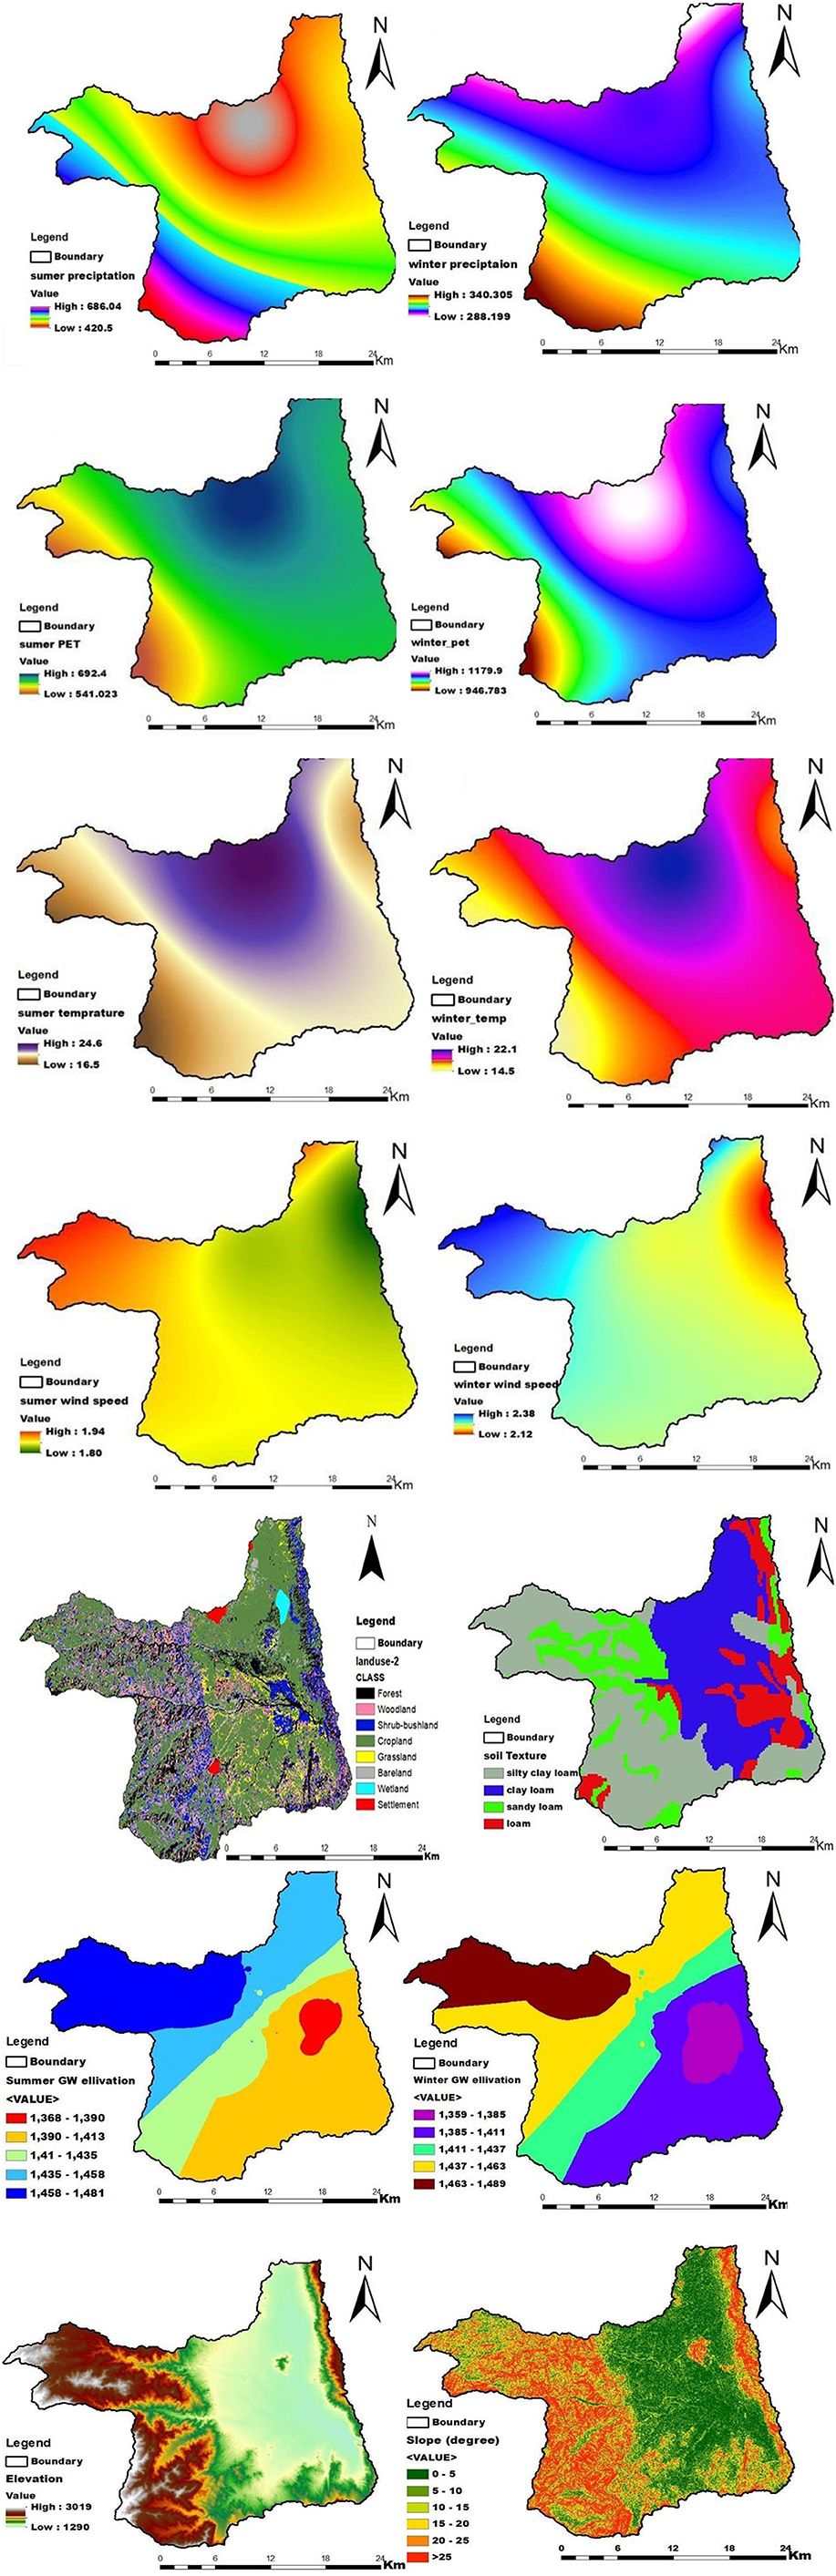
Figure 3. WetSpass input grid maps.
2.3.3 Parameter tables/lookup tables preparation
Creating lookup tables is critical for the effective operation of the WetSpass model. This study involved the preparation of four parameter tables: land use/land cover for summer and winter, soil texture, and runoff coefficient parameters, all saved in DBF (database file) format to ensure compatibility with the model. It was important to adjust the parameter values to reflect the specific characteristics of the sub-basin, guided by the model user manual and relevant literature. To facilitate this process, software for converting Excel files to DBF format was used, which streamlined the transition of data from Excel spreadsheets into the necessary DBF format for creating parameter tables for the WetSpass model.
2.3.4 Adaptation of WetSpass to the case of Hormat-Golina sub-basin
WetSpass was initially developed for temperate regions, particularly Europe (Batelaan and De Smedt, 2001). However, the model has been successfully adapted for various global conditions by modifying its parameters (Aish et al., 2010; Teklebirhan et al., 2012; Pandian et al., 2014; Armanuos and Negm, 2016). In Ethiopia, the modified WetSpass model has been utilized to simulate the hydrological water balance of the Geba basin (Gebreyohannes et al., 2013) and to estimate long-term average recharge in Dire Dawa (Tilahun and Merkel, 2009).
The land-use classifications and soil textures in tropical countries like Ethiopia differ significantly from those in temperate regions. While there may be some overlapping land-use classes, their characteristics are not identical. Additionally, the seasonal patterns in temperate regions, with distinct winter and summer periods, contrast with those in Ethiopia, where winter corresponds to the dry season and summer represents the main rainy season. Therefore, any watershed simulation using WetSpass requires modifications to tailor it to Ethiopian conditions.
For the Hormat-Golina sub-basin, a modified WetSpass model was developed. This involved adjusting the land-use parameter tables for both summer and winter seasons based on expert knowledge and scientific literature. The parameter tables used in the WetSpass model include land use (for both seasons), soil characteristics, and runoff coefficients. The land-use attribute table comprises parameters such as land-use type, rooting depth, leaf area index, and vegetation height. The soil parameter table includes soil characteristics like textural class and plant-available water content, while the runoff coefficient attribute table addresses runoff classes related to various land uses, slope, and runoff coefficients.
Key modifications were made to the land-use parameters, particularly concerning the leaf area index, crop height, and interception percentage, to better reflect the conditions in the Hormat-Golina sub-basin. Furthermore, the proportions of vegetative, bare, impervious, and open water areas for each land-use class were adjusted (see Tables 1, 2). The year was divided into two seasons—summer (June–September) and winter (October to May)—with corresponding input data such as land use, precipitation, potential evapotranspiration, temperature, wind speed, and groundwater depth. Key modifications were made to the land-use parameters, particularly regarding leaf area index, crop height, and interception percentages, to accurately represent the conditions of the Hormat-Golina watershed. Furthermore, the proportions of vegetative, bare, impervious, and open water areas for each land-use category in the Hormat-Golina watershed were adjusted (see Tables 1, 2). The year was divided into two seasons: summer (from June to September) and winter (from October to May), each with its respective input data, including land use, precipitation, potential evapotranspiration, temperature, wind speed, and groundwater depth.
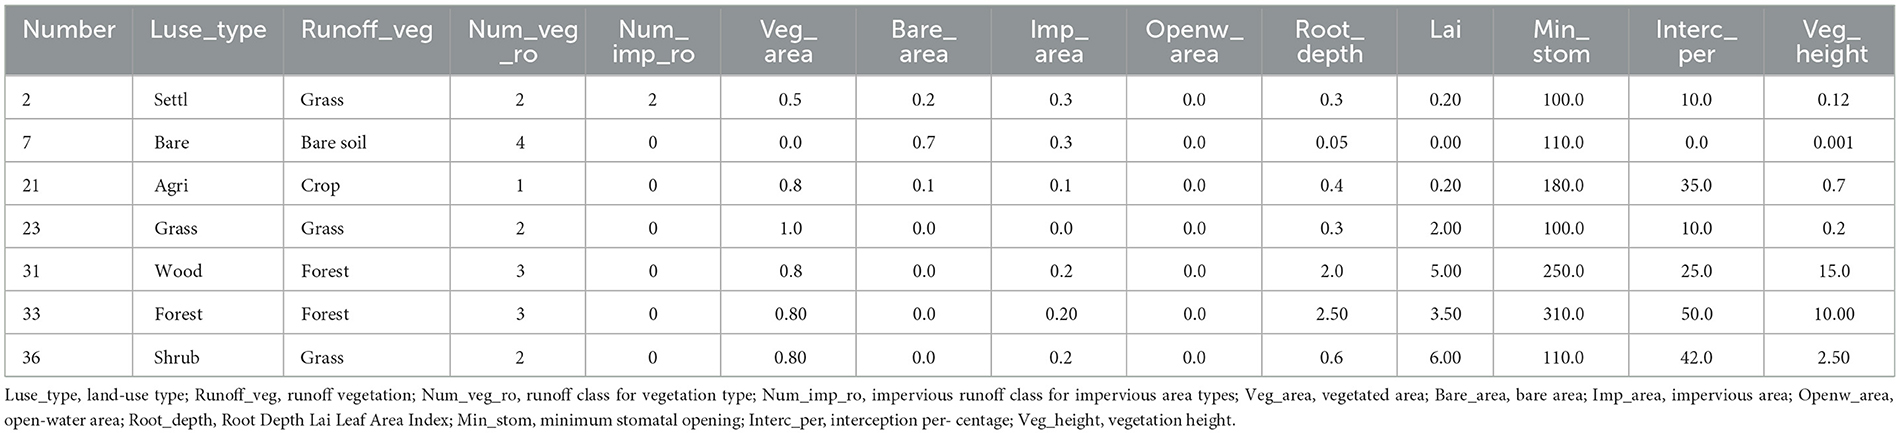
Table 1. Summer land-use parameter table modified for the Hormat-Golina sub-basin.
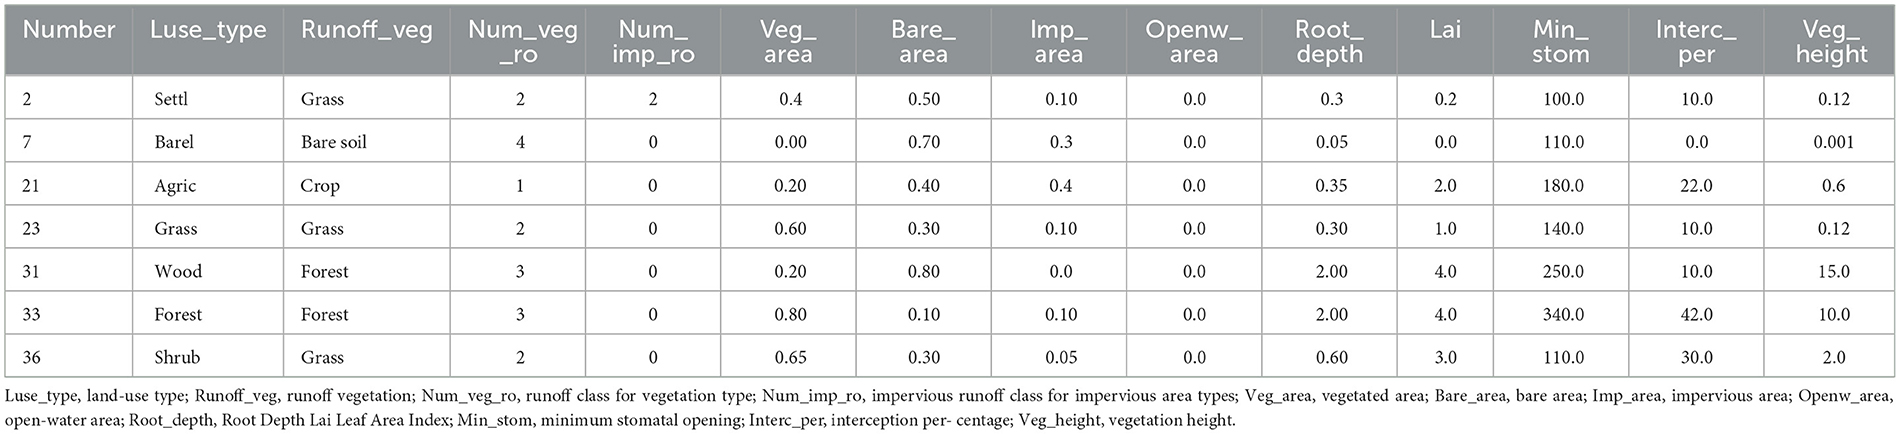
Table 2. Winter land-use parameter table modified for the Hormat-Golina sub-basin.
2.3.5 Analysis and grid maps combination
The WetSpass model produces hydrological outputs on both an annual and seasonal basis, differentiating between summer and winter periods. These outputs can be analyzed in various ways to gain insights into the spatial variations of recharge and runoff, especially in relation to land use and soil type. Since the model outputs are represented as grid maps rather than in tabular form, merging multiple grid maps can yield valuable insights.
To achieve this, the “combine” function in ArcGIS is employed to merge different grid maps into database files that are suitable for further analysis and graphical representation. In this study, for instance, land-use and soil maps were combined with maps of surface runoff, recharge, and actual evapotranspiration. This integration enabled the visualization of how various land covers and soil textures affect evapotranspiration, surface runoff, and groundwater recharge, thereby providing a comprehensive understanding of the hydrological processes in the study area.
2.3.6 Generating hydrometric data for the outlet of the sub-basin
Obtaining accurate and sufficient inputs, such as precipitation and streamflow data, is crucial for effective hydrological modeling (Gao et al., 2014). Hydrometric data serve as essential inputs for evaluating the performance of hydrological models by calibrating simulated outputs against observed values. However, many developing countries, including Ethiopia, face challenges in establishing high-resolution hydrological and meteorological stations in remote areas due to financial and technical limitations. Consequently, runoff simulations and estimates in ungauged catchments pose significant challenges for hydrologists.
In the Hormat-Golina sub-basin of northern Ethiopia, implementing hydrological models to assess the impacts of human and natural stressors on surface and subsurface water resources, as well as to develop appropriate water management strategies, is particularly difficult due to the lack of streamflow measuring stations. To address these challenges, researchers have explored various regionalization techniques globally. Regionalization is a method used to estimate historical streamflow in ungauged areas by transferring hydrometric information from gauged (donor) catchments to ungauged ones (Arsenault et al., 2019).
Over the past several decades, various regionalization techniques have been developed to estimate streamflow in regions with sparse or limited hydrometric data. These techniques include: Arithmetic Mean (AM) (Jin et al., 2009; Merz and Blöschl, 2004; Oudin et al., 2008), Physical Similarity (PS) (Narbondo et al., 2020; Samaniego et al., 2010; Samuel et al., 2011), Spatial Proximity (SP) (Oudin et al., 2008; Li et al., 2021; Parajka et al., 2005) Regression (R) (Oudin et al., 2008; Parajka et al., 2005; Jillo et al., 2017; Ochoa-Tocachi et al., 2016; Visessri and McIntyre, 2016; Young et al., 2006), Catchment Runoff Response Similarity (CRRS) (Tegegne et al., 2017) and Probabilistic Random Forests (PRF) (Prieto et al., 2019).
According to a comprehensive review by Gao et al. (2014), the physical similarity regionalization approach involves extracting remotely sensed data, such as land use, vegetation cover, slope, topography, and meteorological information (e.g., rainfall, minimum and maximum temperature), from catchment attributes to predict streamflow in ungauged areas. This method transfers hydrological information from donor catchments that are similar to ungauged catchments based on specific catchment descriptors. The selection of donor catchments relies on their proximity to ungauged catchments in terms of these descriptors. Streamflow data for the ungauged catchment is then produced by averaging values from the most similar catchments (Figure 4).
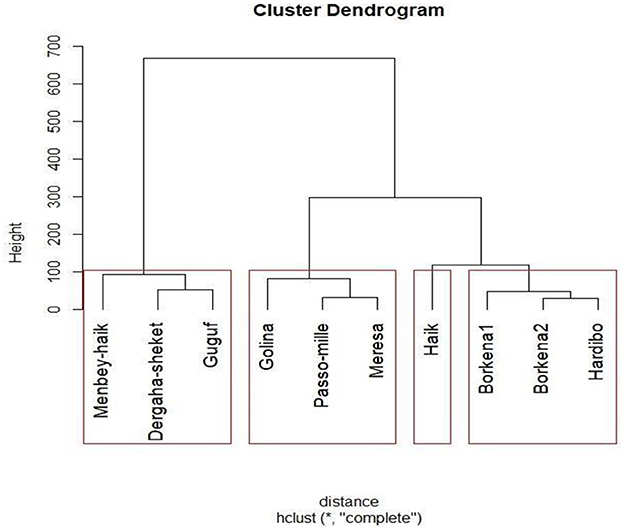
Figure 4. Watershed clustering with physical similarity.
2.3.7 Validation of WetSpass mode
The validation of the WetSpass model utilized flow data generated through physical similarity regionalization techniques, which were analyzed using hydrograph analysis. To extract base flow from the streamflow data, the Automated Web-Based Hydrograph Analysis Application (WHAT) was employed (Eckhardt, 2005). WHAT provides three filtering options: the Eckhardt recursive digital filter method (RDF), the one-parameter digital filter method (OPM), and the local-minimum method (LMM).
For this study, the Eckhardt recursive digital filter method (RDF) was specifically chosen (Eckhardt, 2005). The RDF method is described by the following equation:
Where, bt represents base flow at time step t (m3/s); bt−1 represents the filtered base flow at time step t−1 (m3/s); BFImax presents the maximum long-term ratio of base flow/total stream flow; Qt is the total stream flow at time step t (m3/s) and α is the filter parameter.
Eckhardt (2005), recommended different \(BFI_ {max} \) values depending on the hydrogeological characteristics of the streams: 0.50 for ephemeral streams with porous aquifers, 0.25 for perennial streams with hard rock aquifers, and 0.80 for perennial streams with porous aquifers. In this case, proposed values of 0.80 for \ (BFI_ {max} \) and 0.98 for the filter parameter were utilized, reflecting the hydrogeological characteristics of the watershed under study (Table 3 and Figure 5).

Table 3. Monthly generated flow using regression techniques.
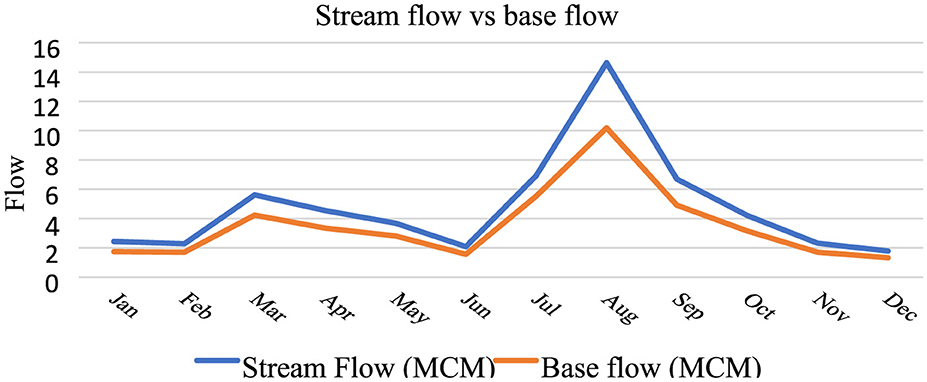
Figure 5. Comparison between stream flow and base flow.
3 Result and discussion
3.1 Model sensitivity analysis
The WetSpass monthly model incorporates various parameters and requires specific input variables to generate accurate outputs for understanding the water balance components of a watershed. To effectively utilize the model's parameters, it is essential to evaluate the sensitivity of each parameter and input variable. This sensitivity analysis helps in understanding how the model responds to variations in these parameters. For this study, a sensitivity analysis was conducted for the monthly model. To perform this analysis, the average values of all meteorological data in the WetSpass input dataset were prepared, while the biophysical data remained unchanged.
To assess the sensitivity of parameters such as the interception coefficient (“a”), the alpha coefficient, and the Lp coefficient, a reasonable range was assigned to each. During each simulation run, the values of the target parameter were incrementally increased by 1% of their range, while all other input variables and parameters were held constant. To evaluate the sensitivity of different water balance components to variations in input variables, the target variable was increased by 25% to 100%, keeping other variables unchanged. The results of the sensitivity analysis, which illustrate the impact of parameter and input variable variations on water balance components, are presented in Figures 6 and 7.
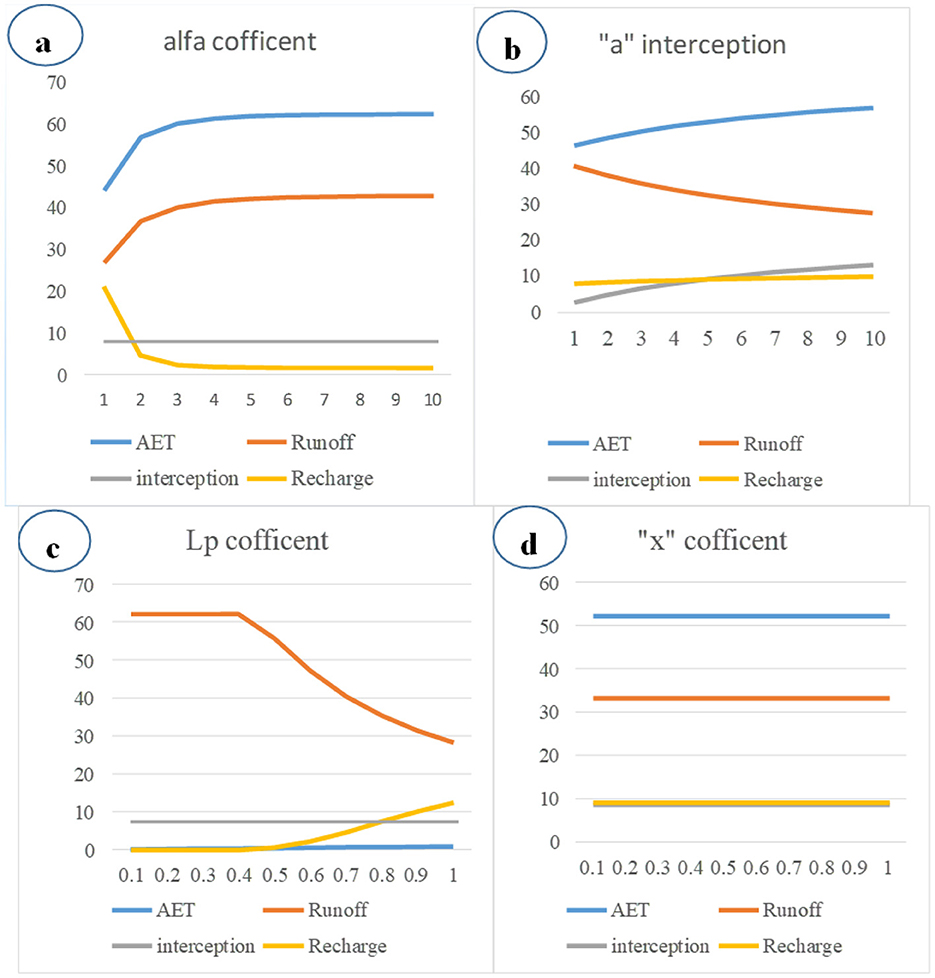
Figure 6. Sensitivity of water balance component with changing different model parameters.
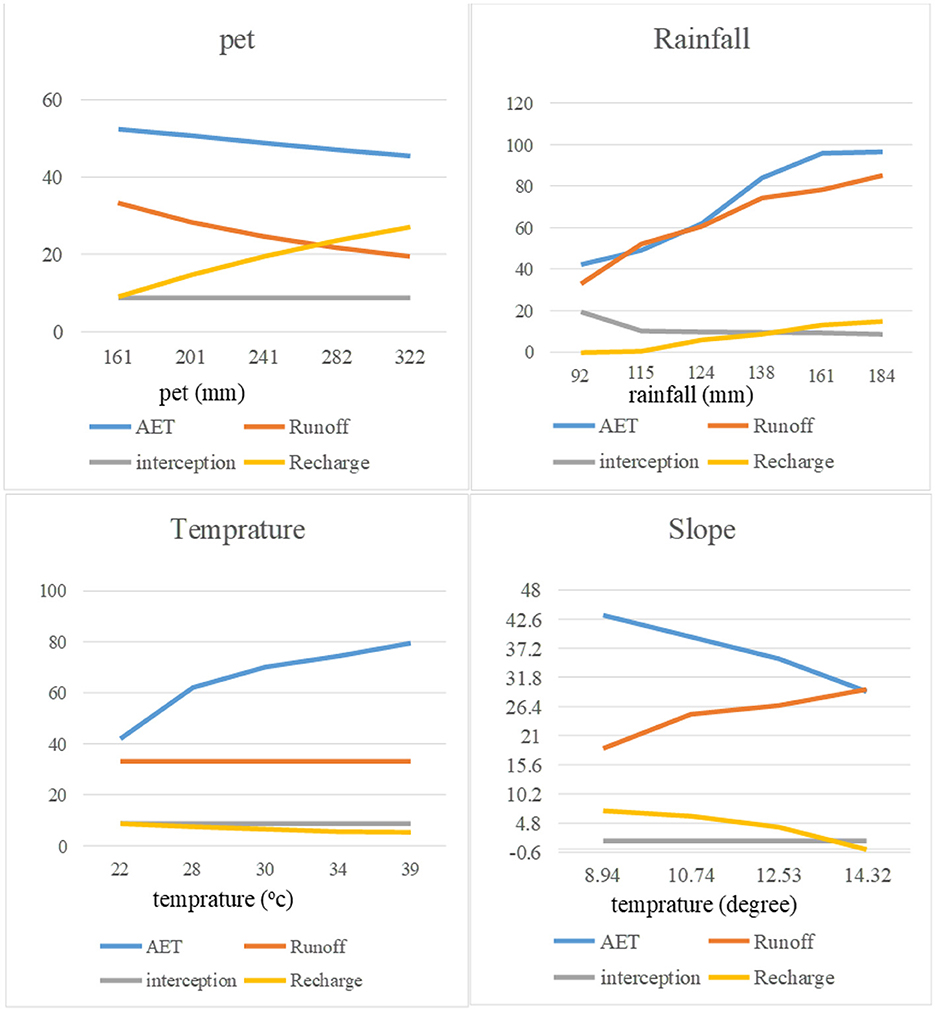
Figure 7. Sensitivity of water balance component with changing different input variables.
The analysis revealed that the interception coefficient, alpha coefficient, and Lp coefficient are relatively sensitive to water balance components. However, the interception value generally exhibited lower sensitivity compared to other components. In contrast, recharge and runoff showed significant responses to variations in multiple factors, likely because they are estimated as residuals of the water balance (Abdollahi et al., 2017).
The sensitivity analysis of input variables highlighted that potential evapotranspiration (PET) and rainfall are the most critical parameters, while temperature and groundwater variables are less sensitive to the model's results (i.e., the water balance components). Groundwater, in particular, demonstrated minimal sensitivity, as the effect of evapotranspiration on groundwater in the study area is negligible.
3.2 Validation of WetSpass mode
Conventionally, the validation of the WetSpass distributed hydrologic water balance model involves manually adjusting or modifying model parameters within specified ranges. The primary objective of this validation process is to optimize the correlation coefficient of determination (R2) between simulated surface runoff and observed discharge.
The parameters typically adjusted include: Alpha coefficient, Interception coefficient (“A”), Lp coefficient and Runoff delay factor (“x”). These parameters are optimized to achieve a close agreement between calculated discharge and observed discharge recorded at the Hormat-Golina River, as well as the base flow derived from separating the observed discharge using base flow separation techniques.
The total flow in a river from a basin consists of surface runoff and subsurface flow, which corresponds to the long-term mean seasonal river discharge from that basin. The WetSpass model simulates both subsurface flow and surface runoff, which were then calibrated against in situ observed streamflow data from the Hormat-Golina River.
As shown in Figures 8 and 9, the simulation analysis yielded excellent results, with a correlation coefficient (goodness of fit) of 0.94 and a Nash-Sutcliffe efficiency (NSE) of 0.85, alongside a standard error of 0.21. This evaluation of the WetSpass model demonstrated representative results for total discharge and strong performance for base flows, affirming the model reliability in hydrological simulations for the Hormat-Golina sub-basinand positive outcomes for base flows, confirming the model's reliability and accuracy in simulating hydrological processes within the study area.
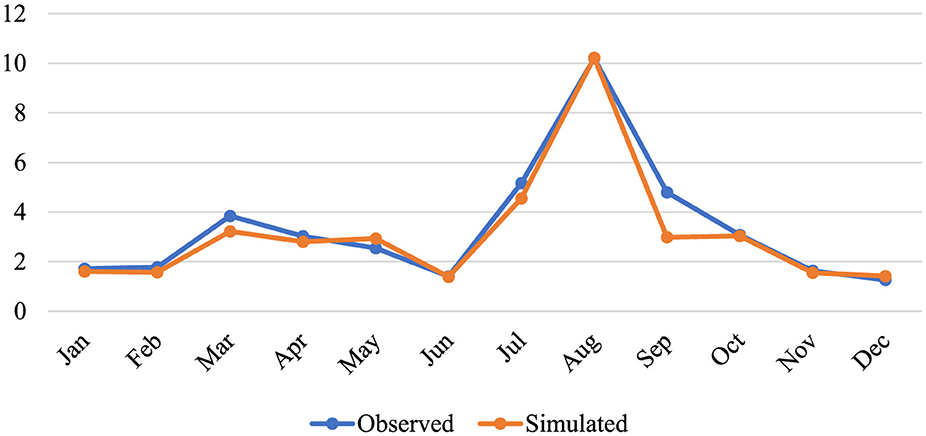
Figure 8. Compression between simulated and observed flow data.
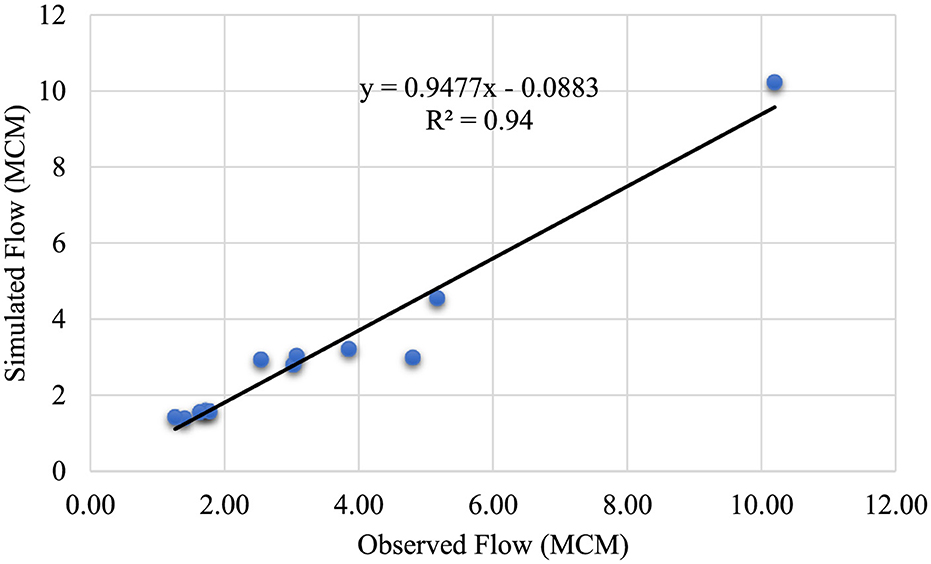
Figure 9. Model validation using coefficient of determination.
3.3 Outputs of WetSpass model
The main outputs of the WetSpass model are raster maps that depict annual and seasonal groundwater recharge, surface runoff, and actual evapotranspiration from 2000 to 2021. Each pixel on these maps indicates the magnitude of the respective water balance component, measured in millimeters. Essentially, these raster maps offer a comprehensive visualization of the spatial distribution and variation of groundwater recharge, surface runoff, and evapotranspiration throughout the study area during the specified time frame.
3.3.1 Groundwater recharge
The seasonal and annual groundwater recharge within the Hormat-Golina watershed displays spatial variability influenced by the basin characteristics and topography (see Figure 10). According to the WetSpass model, the long-term annual groundwater recharge in the sub-basin ranges from 0 mm to 197 mm, with an average of 55 mm. This average recharge accounts for only 8% of the areal average rainfall. Temporal analysis reveals that 83% of the recharge occurs during wet periods, while 17% takes place during dry periods. Annually, ~420,000 m3 of water is replenished into the groundwater across the total watershed area of 698 km2.
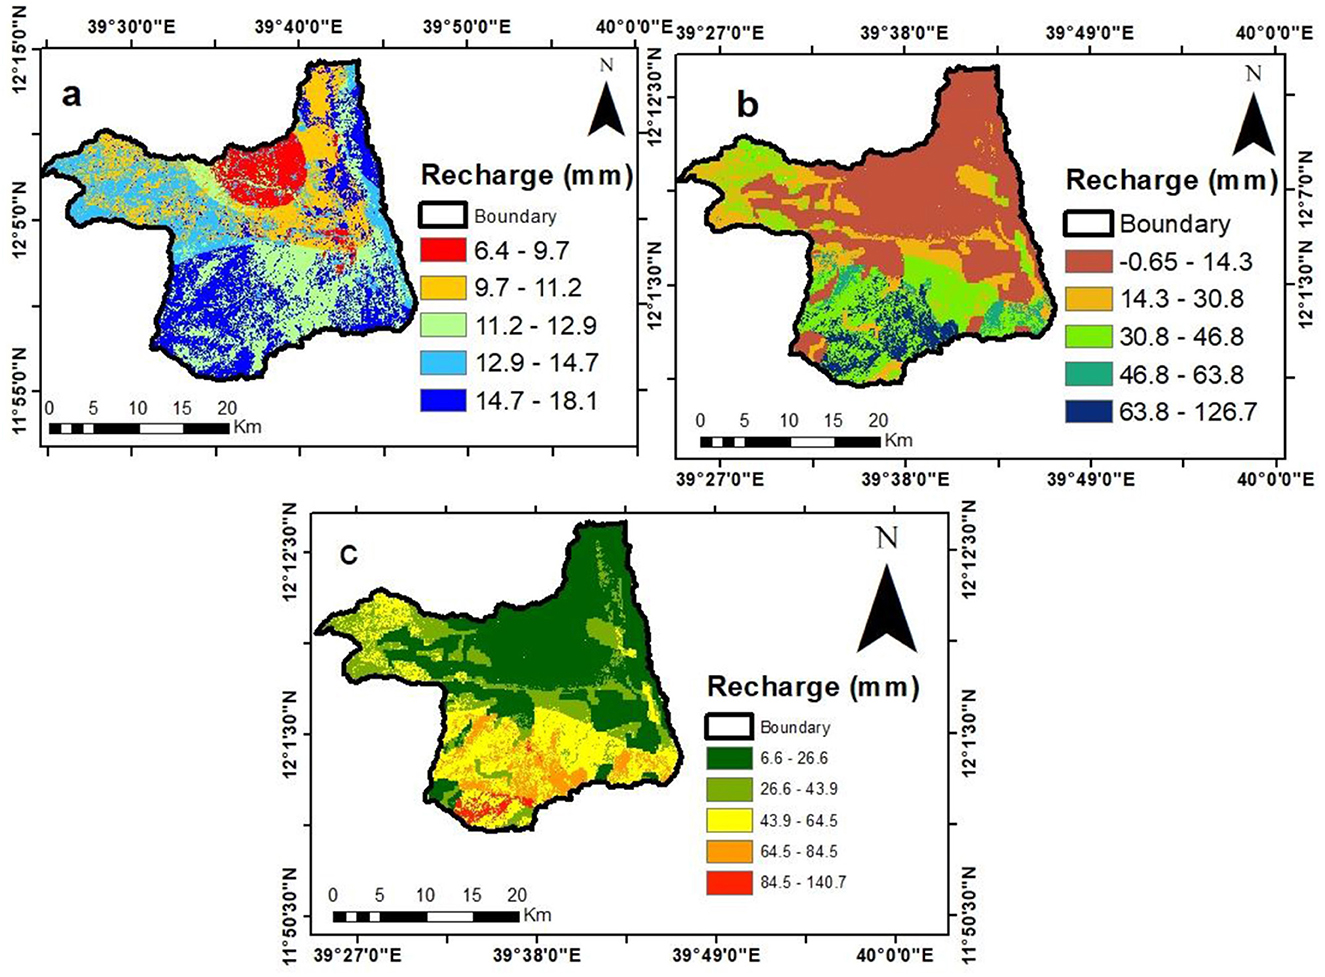
Figure 10. Ground water recharge map of Hormat-Golina sub-basin summer, winter and annual respectively.
The mean annual spatial groundwater recharge varies considerably throughout the sub-basin (see Figure 10). The southern and western highlands exhibit higher annual groundwater recharge due to factors such as permeable soils, increased rainfall, and dense vegetation cover. The western foothill areas also experience significant groundwater recharge, attributed to their flat topography and coarse, permeable soils. In contrast, the lowlands and central southeastern regions show lower groundwater recharge, primarily because they act as discharge areas and feature less permeable fine-textured soils. Forested regions with sandy soils demonstrate high groundwater recharge, benefiting from the sandy soils' permeability and minimal runoff on gentle slopes. Conversely, bare land with clay soils exhibits low infiltration, leading to increased surface runoff (see Table 4).
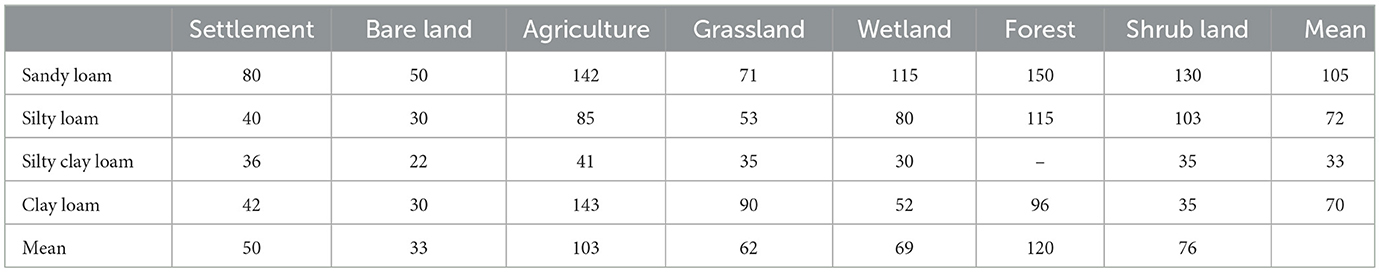
Table 4. Simulated mean annual recharge (Mm) for the combinations of land-use and soil texture.
3.3.2 Actual evapotranspiration
The WetSpass model estimates the mean annual evapotranspiration for the Hormat-Golina sub-basin at 617 mm, which constitutes ~78% of the area's annual average rainfall. This highlights evapotranspiration as the primary water loss process in the sub-basin, primarily due to high radiation levels and strong dry winds. Seasonal distribution indicates that a greater portion of evapotranspiration occurs during the summer season (62%), while the remaining 38% occurs in the winter. Notably, actual evapotranspiration in the summer exceeds that of the winter by 24%, reflecting the region bimodal precipitation pattern.
Lower elevation areas within the sub-basin tend to have higher annual evapotranspiration rates. Moreover, regions with increased precipitation, like the Gaba basin, also show elevated levels of evapotranspiration. As a result, evapotranspiration represents a significant component of the average rainfall, underscoring its importance as a water loss mechanism within the sub-basin (see Figure 11).
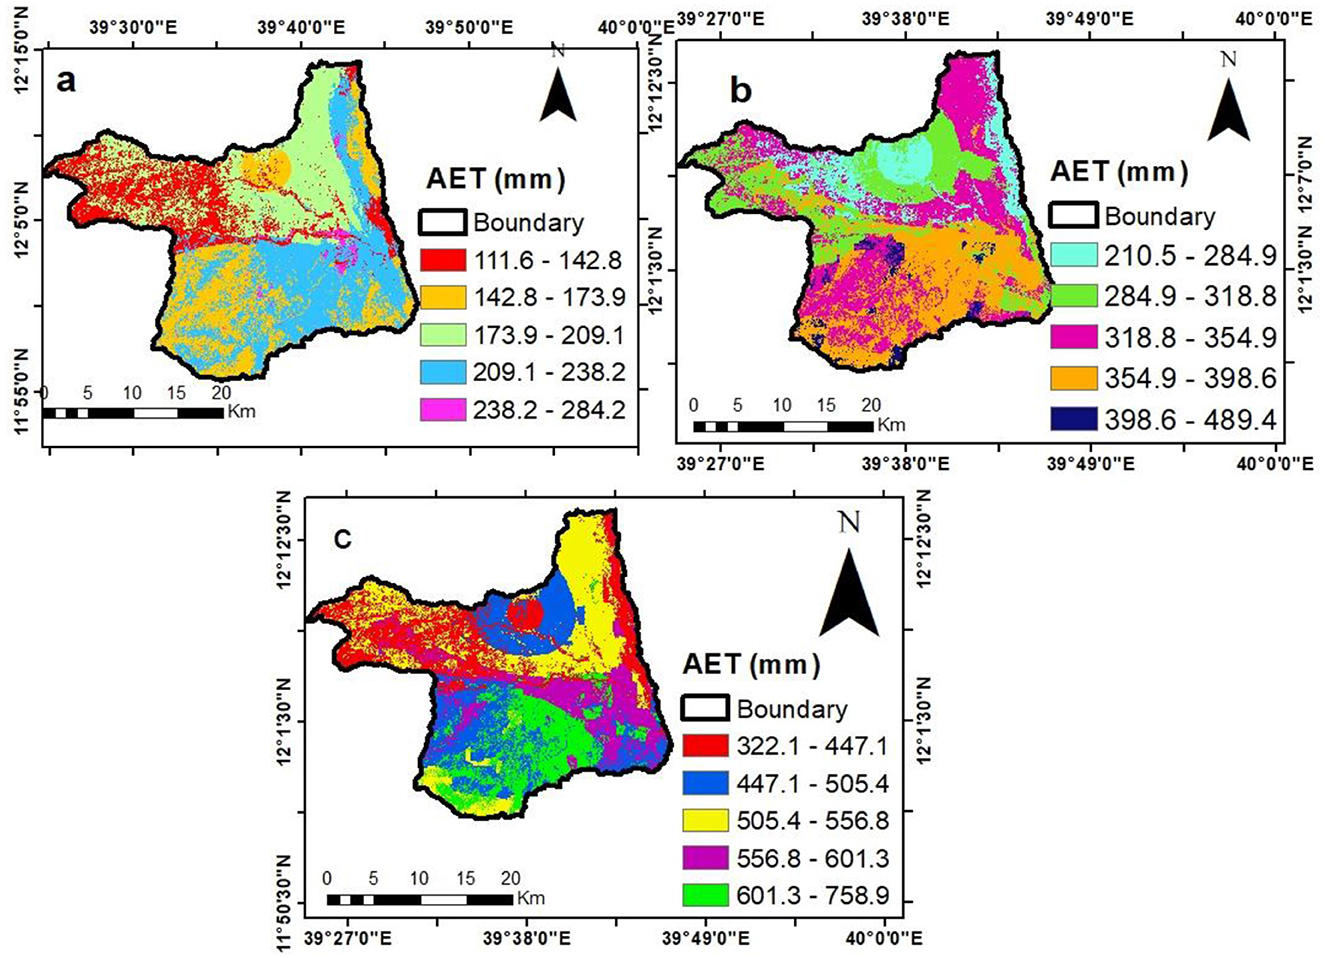
Figure 11. Actual evapotranspiration from Hormat-Golina sub-basin winter summer and annual respectively.
Spatial variations in evapotranspiration were further examined by correlating average annual evapotranspiration with different land-use and soil types. Areas with good water availability in the soil and high transpiration rates from vegetation particularly forests, grasslands, and shrubs on sandy loam and clay soils exhibit higher evapotranspiration rates (see Table 5).
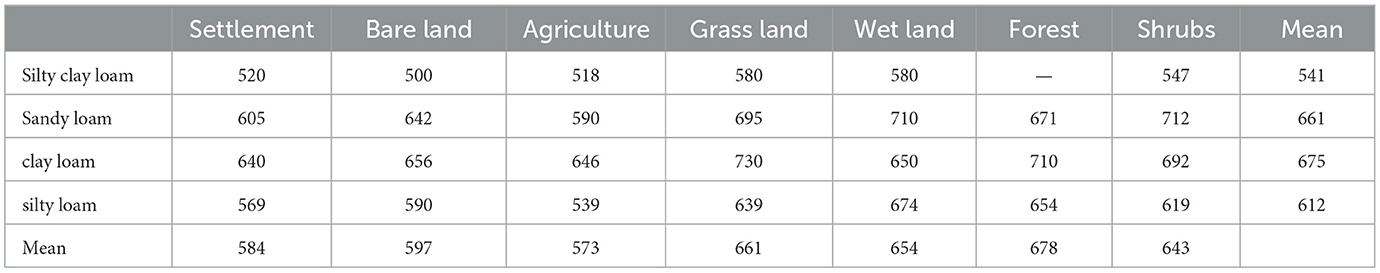
Table 5. Simulated mean annual evapotranspiration for combinations of land-use and soil texture.
3.4 Surface runoff
Surface runoff in the Hormat-Golina sub-basin shows spatial variability influenced by slope and other catchment characteristics (see Figure 12). The simulated annual surface runoff in this sub-basin ranges from 22 mm to a maximum of 448 mm, with an average of 156 mm. This average runoff accounts for ~19% of the total mean annual precipitation in the area, equating to about 1.2 million cubic meters for the entire basin. Seasonally, 53% of the runoff occurs during the summer, while the remaining 47% occurs in winter.
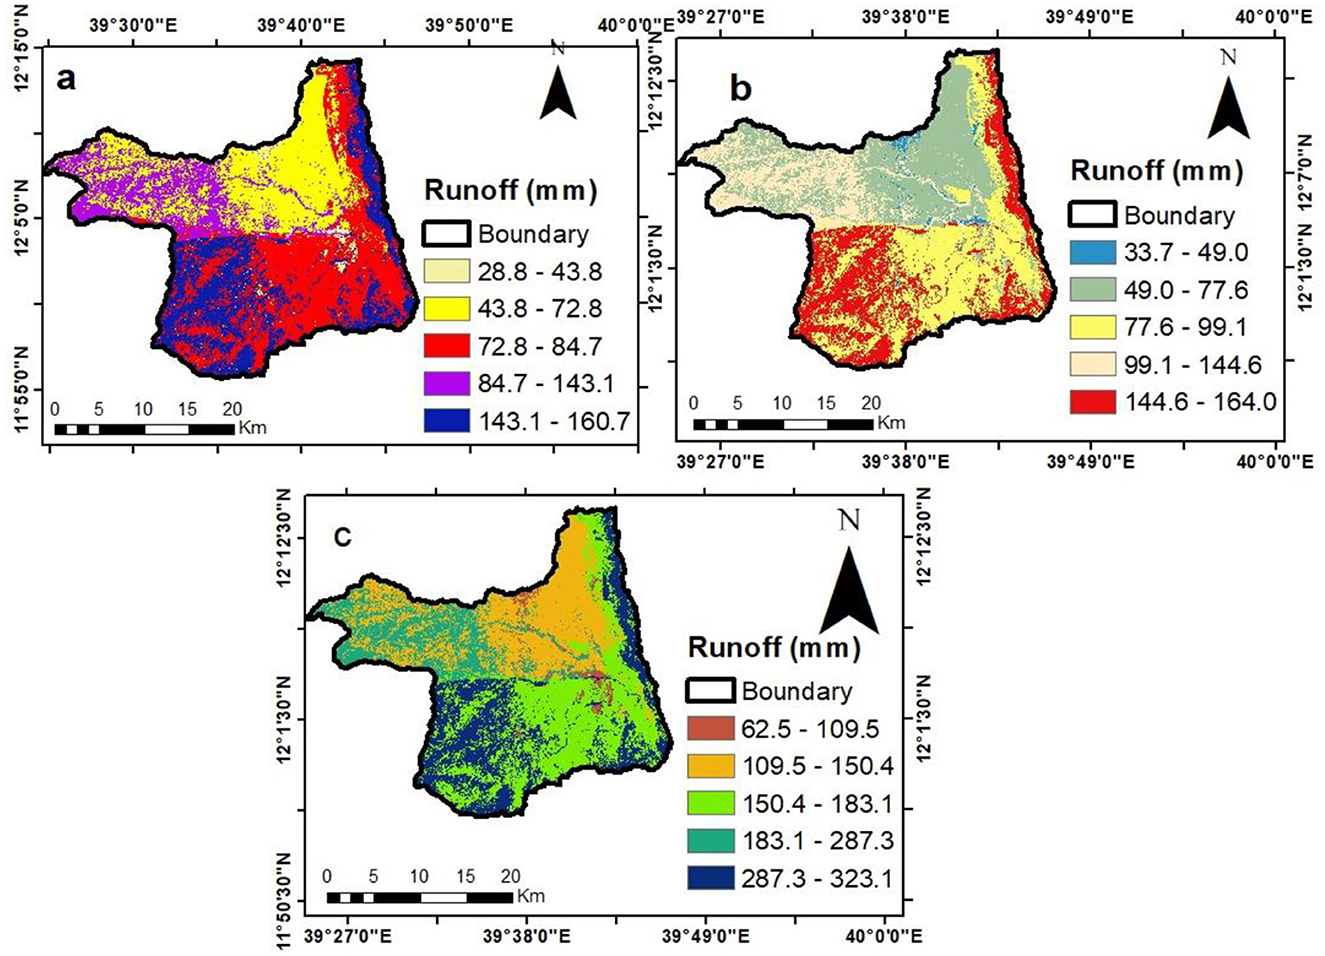
Figure 12. Surface runoff from Hormat-Golina sub-basin winter, summer and annual respectively.
The western highlands of the Hormat-Golina watershed exhibit the highest mean annual surface runoff, primarily due to clay and silty loam soils with low permeability, which increases surface runoff. In contrast, the northern and central regions of the watershed show the lowest runoff levels, attributed to sandy loam soils. Clay loam soils, along with settlements and wetlands, contribute to higher runoff generation, while grasslands and forests with sandy loam soils result in lower runoff (see Table 6). Moreover, highland areas with relatively high rainfall generate more runoff compared to valley floors that receive less rainfall.
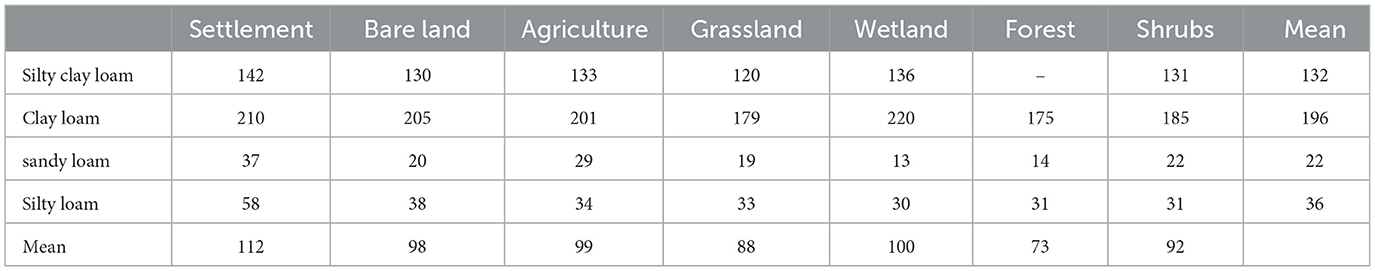
Table 6. Mean annual surface runoff for different combinations of land-use and soil texture.
3.4.1 Water balance components
The comprehensive water balance analysis of the Hormat-Golina sub-basin, presented in Table 7, reveals that only a small fraction of the annual rainfall contributes to the recharge of the groundwater reservoir within the watershed. Most of the rainfall is lost from the watershed, primarily through evapotranspiration, with a smaller amount leaving via surface runoff. The higher standard deviation values observed in the water balance components indicate considerable spatial variation in these elements throughout the basin. This variability is mainly driven by the uneven distribution of climatic factors, which are further influenced by differences in land use/land cover, soil type, topography, and slope across the sub-basin.
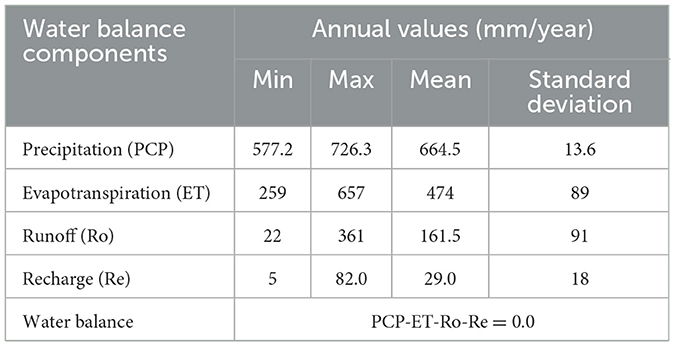
Table 7. Water balance components of Hormat-Golina watershed.
4 Conclusion
Water is crucial for humanity, with groundwater being the largest source of fresh water. The Hormat-Golina sub-basin in the Amhara region faces challenges in maintaining soil moisture for crops due to erratic rainfall. As a result, there is a growing need for agricultural development using groundwater. However, plans for irrigation expansion lack proper assessments of groundwater reserves and recharge.
The WetSpass model was employed to evaluate groundwater recharge in the sub-basin, considering various environmental factors. This model successfully simulated the seasonal and annual water balance, revealing that climatic inputs and land use significantly affect water balance components. Validation of the model showed good performance (R2 = 0.94, NSE = 0.85).
Findings indicate that the annual groundwater recharge is ~55 mm, or 8% of total rainfall, with 83% of recharge occurring during the summer. The highest recharge rates were in forested areas with sandy soils, while bare land showed the lowest rates. Actual evapotranspiration averaged 617 mm, accounting for 62% of total rainfall, with runoff averaging 156 mm, representing 19% of total precipitation. The highest runoff was observed in clay loam areas, while sandy loam showed the lowest runoff.
Data availability statement
The original contributions presented in the study are included in the article/supplementary material, further inquiries can be directed to the corresponding author.
Author contributions
SB: Conceptualization, Data curation, Formal analysis, Funding acquisition, Investigation, Methodology, Project administration, Resources, Software, Supervision, Validation, Visualization, Writing – original draft, Writing – review & editing. MM: Conceptualization, Data curation, Investigation, Project administration, Software, Supervision, Writing – review & editing.
Funding
The author(s) declare that no financial support was received for the research and/or publication of this article.
Conflict of interest
The authors declare that the research was conducted in the absence of any commercial or financial relationships that could be construed as a potential conflict of interest.
Generative AI statement
The author(s) declare that no Gen AI was used in the creation of this manuscript.
Publisher's note
All claims expressed in this article are solely those of the authors and do not necessarily represent those of their affiliated organizations, or those of the publisher, the editors and the reviewers. Any product that may be evaluated in this article, or claim that may be made by its manufacturer, is not guaranteed or endorsed by the publisher.
References
Abdollahi, K., Bashir, I., Verbeiren, B., Harouna, M., Griensven, A., Huysman, M., et al. (2017). A distributed monthly water balance model: formulation and application on Black Volta Basin. Environ. Earth Sci. 76, 1–18. doi: 10.1007/s12665-017-6512-1
Aish, A. M., Batelaan, O., and De Smedt, F. (2010). Distributed recharge estimation for groundwater modeling using WetSpass model, case study—Gaza strip, Palestine. Arab. J. Sci. Eng. 35:155. doi: 10.1007/s13369-018-3303-2
Allen, R. G., Pereira, L. S., Raes, D., and Smith, M. (1998). “Crop evapotranspiration-Guidelines for computing crop water requirements,” in FAO Irrigation and Drainage (Rome: FAO), 300.
Al-Ruzouq, R., Shanableh, A., and Merabtene, T. (2015). Geomatics for mapping of groundwater potential zones in northern part of the United Arab Emiratis-Sharjah City. Int. Arch. Photogramm. Remote Sens. Spat. Inf. Sci. - ISPRS Arch. 40, 581–586. doi: 10.5194/isprsarchives-XL-7-W3-581-2015
Armanuos, M. A., and Negm, A. (2016). Assessment of the variations of local parameters of Wetspass model: case study Nile Delta aquifer. Procedia Eng. 154, 276–283. doi: 10.1016/j.proeng.2016.07.475
Arsenault, R., Breton-Dufour, M., Poulin, A., Dallaire, G., and Romero-Lopez, R. (2019). Streamflow prediction in ungauged basins: analysis of regionalization methods in a hydrologically heterogeneous region of Mexico. Hydrol. Sci. J. 64, 1297–1311. doi: 10.1080/02626667.2019.1639716
Ayenew, T., Demlie, M., and Wohnlich, S. (2008). Hydrogeological framework and occurrence of groundwater in the Ethiopian aquifers. J. African Earth Sci. 52, 97–113. doi: 10.1016/j.jafrearsci.2008.06.006
Batelaan, F., and De Smedt, F. (2001). WetSpass: a flexible, GIS based, distributed recharge methodology for regional groundwater modelling. Impact of Human Activity on Groundwater Dynamics, 11–18.
Batelaan, O., and De Smedt, F. (2007). GIS-based recharge estimation by coupling surface-subsurface water balances. J. Hydrol. 337, 337–355. doi: 10.1016/j.jhydrol.2007.02.001
Batelaan, O., De Smedt, F., and Triest, L. (2003). Regional groundwater discharge: phreatophyte mapping, groundwater modelling and impact analysis of land-use change. J. Hydrol. 275, 86–108. doi: 10.1016/S0022-1694(03)00018-0
Belay, M., and Bewket, W. (2013). Farmers' livelihood assets and adoption of sustainable land management practices in north-western highlands of Ethiopia. Int. J. Environ. Stud. 70, 284–301. doi: 10.1080/00207233.2013.774773
Cook, P. G., Walker, G. R., Buselli, G., Potts, I., and Dodds, A. R. (1992). The application of electromagnetic techniques to groundwater recharge investigations. J. Hydrol. 130, 201–229. doi: 10.1016/0022-1694(92)90111-8
Dereje, B., and Nedaw, D. (2018). Groundwater Recharge Estimation Using WetSpass Modeling in Upper Bilate. 11, 37–51. doi: 10.4314/mejs.v11i1.3
Eckhardt, K. (2005). How to construct recursive digital filters for baseflow separation. Hydrol. Process. An Int. J. 19, 507–515. doi: 10.1002/hyp.5675
Fenta, A. A., Kifle, A., Gebreyohannes, T., and Hailu, G. (2015). Spatial analysis of groundwater potential using remote sensing and GIS-based multi-criteria evaluation in Raya Valley, northern Ethiopia. Hydrogeol. J. 23, 195–206. doi: 10.1007/s10040-014-1198-x
Gao, H., Hrachowitz, M., Fenicia, F., Gharari, S., and Savenije, H. H. G. (2014). Testing the realism of a topography-driven model (FLEX-Topo) in the nested catchments of the Upper Heihe, China. Hydrol. Earth Syst. Sci. 18, 1895–1915. doi: 10.5194/hess-18-1895-2014
Gebremeskel, G., and Kebede, A. (2017). Spatial estimation of long-term seasonal and annual groundwater resources: application of WetSpass model in the y. Phys. Geogr. 38, 338–359. doi: 10.1080/02723646.2017.1302791
Gebreyohannes, T., De Smedt, F., Walraevens, K., Gebresilassie, S., Hussien, A., Hagos, M., et al. (2013). Application of a spatially distributed water balance model for assessing surface water and groundwater resources in the Geba basin, Tigray, Ethiopia. J. Hydrol. 499, 110–123. doi: 10.1016/j.jhydrol.2013.06.026
Ghouili, N., Horriche, F. J., Zammouri, M., Benabdallah, S., and Farhat, B. (2017). Coupling WetSpass and MODFLOW for groundwater recharge assessment: case study of the Takelsa multilayer aquifer, northeastern Tunisia. Geosci. J. 21, 791–805. doi: 10.1007/s12303-016-0070-5
Gidafie, D., Tafesse, N. T., and Hagos, M. (2016). Estimation of groundwater recharge using water balance model: A case study in the Gerado basin, North Central Ethiopia. Int. J. Earth Sci. Eng. 9, 942–950.
Haile, G. G. (2015). Estimation of groundwater recharge and potentials under changing climate in Werii Watershed, Tekeze River Basin [MSc thesis]. Haramaya: Haramaya University.
Hargreaves, G. H., and Samani, Z. A. (1982). Estimating potential evapotranspiration. J. Irrig. Drain. Div. 108, 225–230. doi: 10.1061/JRCEA4.0001390
Hargreaves, G. H., and Samani, Z. A. (1985). Reference crop evapotranspiration from temperature. Appl. Eng. Agric. 1, 96–99. doi: 10.13031/2013.26773
Jillo, A. Y., Demissie, S. S., Viglione, A., Asfaw, D. H., and Sivapalan, M. (2017). Characterization of regional variability of seasonal water balance within Omo-Ghibe River Basin, Ethiopia. Hydrol. Sci. J. 62, 1200–1215. doi: 10.1080/02626667.2017.1313419
Jin, X., Xu, C., Zhang, Q., and Chen, Y. D. (2009). Regionalization study of a conceptual hydrological model in Dongjiang basin, south China. Quat. Int. 208, 129–137. doi: 10.1016/j.quaint.2008.08.006
Li, M., Di, Z., and Duan, Q. (2021). Effect of sensitivity analysis on parameter optimization: case study based on streamflow simulations using the SWAT model in China. J. Hydrol. 603:126896. doi: 10.1016/j.jhydrol.2021.126896
Mengistu, H. A., Demlie, M. B., and Abiye, T. A. (2019a). Revisão: Potencial dos recursos hídricos subterrâneos e status do desenvolvimento dos recursos hídricos subterrâneos na Etiópia. Hydrogeol. J. 27, 1051–1065. doi: 10.1007/s10040-019-01928-x
Mengistu, H. A., Demlie, M. B., and Abiye, T. A. (2019b). Review: Groundwater resource potential and status of groundwater resource development in Ethiopia. Hydrogeol J. 27:1051–1065. doi: 10.1007/s41062-022-00992-9
Meresa, E., and Taye, G. (2019). Estimation of groundwater recharge using GIS-based WetSpass model for Birki watershed, the eastern zone of Tigray, Northern Ethiopia. Sustain. Water Resour. Manag. 5, 1555–1566. doi: 10.1007/s40899-018-0282-0
Merz, R., and Blöschl, G. (2004). Regionalisation of catchment model parameters. J. Hydrol. 287, 95–123. doi: 10.1016/j.jhydrol.2003.09.028
Narbondo, S., Gorgoglione, A., Crisci, M., and Chreties, C. (2020). Enhancing physical similarity approach to predict runoff in ungauged watersheds in sub-tropical regions. Water 12:528. doi: 10.3390/w12020528
Ochoa-Tocachi, B. F., Buytaert, W., and De Bièvre, B. (2016). Regionalization of land-use impacts on streamflow using a network of paired catchments. Water Resour. Res. 52, 6710–6729. doi: 10.1002/2016WR018596
Oudin, L., Andréassian, V., Perrin, C., Michel, C., and Le Moine, N. (2008). Spatial proximity, physical similarity, regression and ungaged catchments: a comparison of regionalization approaches based on 913 French catchments. Water Resour. Res. 44:3. doi: 10.1029/2007WR006240
Pandian, M., Rajasimman, U., and Saravanavel, J. (2014). Identification of groundwater potential recharge zones using WETSPASS model in parts of Coimbatore and Tiruppur Districts in Tamil Nadu, India. Int. J. Water Res. 2, 27–32.
Parajka, J., Merz, R., and Blöschl, G. (2005). A comparison of regionalisation methods for catchment model parameters. Hydrol. Earth Syst. Sci. 9, 157–171. doi: 10.5194/hess-9-157-2005
Prieto, C., Le Vine, N., Kavetski, D., García, E., and Medina, R. (2019). Flow prediction in ungauged catchments using probabilistic random forests regionalization and new statistical adequacy tests. Water Resour. Res. 55, 4364–4392. doi: 10.1029/2018WR023254
Rwanga, S. S. (2013). A review on groundwater recharge estimation using wetspass model. Int. Conf. Civ. Environ. Eng. 2013, 156–160. doi: 10.5897/IJWREE11.142
Samaniego, L., Bárdossy, A., and Kumar, R. (2010). Streamflow prediction in ungauged catchments using copula-based dissimilarity measures. Water Resour. Res. 46:2. doi: 10.1029/2008WR007695
Samuel, J., Coulibaly, P., and Metcalfe, R. A. (2011). Estimation of continuous streamflow in Ontario ungauged basins: comparison of regionalization methods. J. Hydrol. Eng. 16, 447–459. doi: 10.1061/(ASCE)HE.1943-5584.0000338
Solomatine, D. P., and Wagener, T. (2011). Hydrological modeling. Treatise Water Sci. 2, 435–457. doi: 10.1016/B978-0-444-53199-5.00044-0
Tadesse, N., Nedaw, D., Woldearegay, K., Gebreyohannes, T., and Steenbergen, F. V. (2015). Groundwater management for irrigation in the raya and kobo valleys, Northern Ethiopia. Int. J. Earth Sci. Eng. 8, 1104–1114.
Tegegne, G., Park, D. K., and Kim, Y.-O. (2017). Comparison of hydrological models for the assessment of water resources in a data-scarce region, the Upper Blue Nile River Basin. J. Hydrol. Reg. Stud. 14, 49–66. doi: 10.1016/j.ejrh.2017.10.002
Teklebirhan, A., Dessie, N., and Tesfamichael, G. (2012). Groundwater recharge, evapotranspiration and surface runoff estimation using WetSpass modeling method in Illala catchment, northern Ethiopia. Momona Ethiop. J. Sci. 4, 96–110. doi: 10.4314/mejs.v4i2.80119
Tilahun, K., and Merkel, B. J. (2009). Estimation of groundwater recharge using a GIS-based distributed water balance model in Dire Dawa, Ethiopia. Hydrogeol. J. 17, 1443–1457. doi: 10.1007/s10040-009-0455-x
Visessri, S., and McIntyre, N. (2016). Regionalisation of hydrological responses under land-use change and variable data quality. Hydrol. Sci. J. 61, 302–320. doi: 10.1080/02626667.2015.1006226
Yenehun, A., Walraevens, K., and Batelaan, O. (2017). Spatial and temporal variability of groundwater recharge in Geba basin, Northern Ethiopia. J. African Earth Sci. 134, 198–212. doi: 10.1016/j.jafrearsci.2017.06.006
Young, A. R., Keller, V., and Griffiths, J. (2006). “Predicting low flows in ungauged basins: a hydrological response unit approach to continuous simulation,” in Climate Variability and Change—Hydrological Impacts (Proceedings of the Fifth Friend World Conference held at Havana, Cuba, November 2006) (IAHS Publ.), 308. doi: 10.1016/j.jhydrol.2025.132841
Keywords: Ethiopia, groundwater recharge, Hormat-Golina, WetSpass, soil texture
Citation: Bezabih Kidane S and Melkam Taye M (2025) Groundwater recharge estimation in relation to land use type and soil: the case of Hormat-Golina sub-basin, northern Ethiopia. Front. Water 7:1542663. doi: 10.3389/frwa.2025.1542663
Received: 10 December 2024; Accepted: 12 May 2025;
Published: 18 June 2025.
Edited by:
Daniela Ducci, University of Naples Federico II, ItalyReviewed by:
Il-Moon Chung, Korea Institute of Civil Engineering and Building Technology, Republic of KoreaAmmar Kamel, University of Anbar, Iraq
Copyright © 2025 Bezabih Kidane and Melkam Taye. This is an open-access article distributed under the terms of the Creative Commons Attribution License (CC BY). The use, distribution or reproduction in other forums is permitted, provided the original author(s) and the copyright owner(s) are credited and that the original publication in this journal is cited, in accordance with accepted academic practice. No use, distribution or reproduction is permitted which does not comply with these terms.
*Correspondence: Seyoum Bezabih Kidane, U2V5b3VtYjE4QGdtYWlsLmNvbQ==