 Huma Shakoor1*
 Fahad Alshehri
 Muhammad Shahab
- 1Department of English, National University of Modern Languages (NUML) Peshawar, Islamabad, Pakistan
- 2Abdullah Alrushaid Chair for Earth Science Remote Sensing Research, Geology and Geophysics Department, College of Science, King Saud University, Riyadh, Saudi Arabia
- 3National Centre of Excellence in Geology, University of Peshawar, Peshawar, Pakistan
Introduction: Lead (Pb) contamination in drinking water poses serious public health risks, particularly when concentrations exceed the WHO permissible exposure limit (PEL) of 0.01 mg/L (10 ppb). This study investigates Pb levels in drinking water sources across five districts Kohat, Hangu, Dera Ismail Khan (D.I. Khan), Bannu, and Karak to assess contamination severity, spatial distribution, and potential health risks.
Methods: Drinking water samples were collected from multiple locations within the five districts and analyzed for Pb concentrations. Statistical analyses, including one-way ANOVA and the Shapiro-Wilk normality test, were conducted to evaluate variations and data distribution. Health risk assessment was performed using estimated daily intake (EDI) and hazard quotient (HQ) calculations. Additionally, geospatial analysis using Inverse Distance Weighting (IDW) modeling was employed to identify contamination hotspots.
Results: All districts exceeded the WHO PEL for Pb, with the highest mean concentrations recorded in Bannu (0.720 mg/L) and Karak (0.693 mg/L). Maximum Pb levels reached 1.809 mg/L in Bannu and 1.572 mg/L in Karak. Exceedance rates were 100% in Hangu, Bannu, and Karak. ANOVA analysis (p-value = 8.16 × 10⁻¹¹) indicated significant variations among districts, while the Shapiro-Wilk test (W = 0.742, p-value < 0.0001) confirmed non-normal data distribution. Health risk assessment revealed critical risks, particularly for children, with HQ values exceeding safe thresholds, notably in Bannu and Karak. Geospatial modeling identified contamination hotspots, including Jozara Water (Hangu), Mufti Mehmood Circuit House (D.I. Khan), and Kalanger (Bannu).
Discussion and conclusion: The findings highlight widespread Pb contamination in drinking water across the study area, posing severe health risks. Immediate intervention through advanced water treatment, stringent regulatory enforcement, and continuous monitoring is essential to safeguard public health.
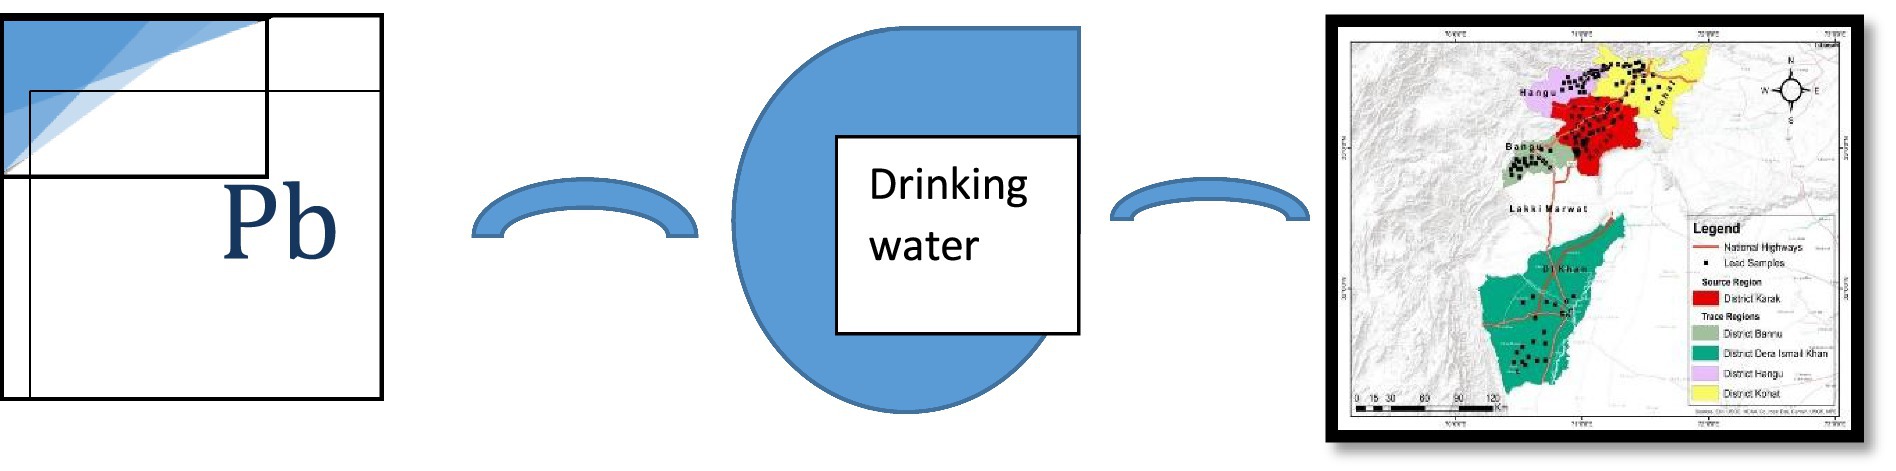
Graphical Abstract.
1 Introduction
Lead (Pb) contamination in drinking water is a critical environmental and public health issue that continues to pose significant risks worldwide (Salman et al., 2021; Jjagwe et al., 2024). Even at low concentrations, prolonged exposure to Pb can cause severe health effects, particularly in vulnerable populations such as children, pregnant women, and individuals with preexisting health conditions (Lanphear et al., 2005). The World Health Organization (WHO) has classified Pb as one of the most hazardous environmental pollutants, emphasizing the urgent need for effective monitoring and mitigation strategies (WHO, 2022a,b). The primary sources of Pb contamination in drinking water include corroding lead-based plumbing materials, industrial discharge, mining activities, and contaminated groundwater (Triantafyllidou and Edwards, 2012). Lead pipes, solder, and brass fittings used in older water distribution systems are a significant contributor to Pb contamination (Ahmed et al., 2023), particularly in urban areas where outdated infrastructure remains in use (Roy and Edwards, 2019). Especially when the water is corrosive or has a low pH. Industrial activities such as battery manufacturing, smelting, and waste disposal sites are also significant contributors to Pb pollution, releasing Pb into surface water and groundwater systems (Reimann and de Caritat, 1998). Additionally, Pb contamination may arise from agricultural runoff containing lead-based pesticides (Ding et al., 2021), which were widely used in the past and persist in some regions (Patrick, 2006). Lead exposure has been extensively studied due to its widespread toxicity and severe health impacts (Zeng et al., 2021). Ingestion of Pb-contaminated water can result in neurological and cognitive impairments, particularly in children, who are more susceptible due to their developing nervous systems (Needleman, 2004). Studies have shown that chronic Pb exposure can lead to reduced IQ levels, attention deficits, learning disabilities, and behavioral problems in children (Lanphear et al., 2005). In adults, Pb exposure has been linked to hypertension, kidney damage, cardiovascular diseases, and reproductive issues (Navas-Acien et al., 2007). Pregnant women exposed to Pb-contaminated water face an increased risk of miscarriage, premature birth, and developmental disorders in their offspring (Bellinger, 2013). Given these health risks, it is crucial to establish stringent regulations and effective mitigation strategies to limit Pb exposure (Flores-Rojas et al., 2024). In response to the health hazards associated with Pb exposure, regulatory agencies worldwide have set permissible limits for Pb in drinking water (Xia et al., 2024). The WHO has established a maximum Pb concentration of 0.01 mg/L to minimize health risks (WHO, 2022a,b). Similarly, the United States Environmental Protection Agency (EPA) has set an action level of 0.015 mg/L under the Lead and Copper Rule (Environmental Protection Agency (EPA), 2021). However, despite these regulations, Pb contamination continues to be a persistent problem in many parts of the world, particularly in developing countries where water quality monitoring and enforcement mechanisms are inadequate (Patrick, 2006; Roy and Edwards, 2019; Chen et al., 2024). Geospatial analysis has emerged as an effective tool for assessing Pb contamination patterns and identifying high-risk areas (Goovaerts, 2001). By integrating statistical methods with geostatistical modeling techniques such as kriging and inverse distance weighting (IDW), researchers can predict spatial variations in Pb concentrations and assess population vulnerability (Griffith, 2005). These approaches facilitate targeted interventions, enabling authorities to implement site-specific remediation efforts and reduce exposure risks (Hengl et al., 2009). Statistical analyses, including correlation and regression models, are also employed to identify key factors influencing Pb levels in drinking water, such as water source type, pH, and proximity to industrial zones (Triantafyllidou and Edwards, 2012). To improve monitoring and mitigation strategies for Pb contamination in drinking water, it is essential to integrate advanced experimental and modeling techniques. Experimental validation of predictive models enhances the reliability of assessments, allowing for better forecasting of Pb contamination trends. Studies such as those by Errico et al. (2019) and Box et al. (2021) have demonstrated the importance of using flow resistance models and hydrological simulations in environmental assessments. These methodologies provide a robust foundation for understanding Pb transport dynamics and optimizing water treatment processes. Additionally, comparative analysis of modeled and measured environmental variables, as explored by Lama et al. (2019), strengthens the predictive accuracy of geospatial and hydrological models. By combining laboratory experimentation with computational modeling, researchers can develop comprehensive frameworks for assessing Pb contamination risks, ensuring effective regulatory compliance, and safeguarding public health.
In Pakistan, Pb contamination in drinking water is a growing concern due to industrialization, poor infrastructure, and inadequate water treatment facilities (Khan et al., 2013). The southern regions of Khyber Pakhtunkhwa (KP), including districts such as Kohat, Hangu, D.I. Khan, Bannu, and Karak, are particularly vulnerable due to their reliance on groundwater sources that may be contaminated by industrial effluents and natural Pb deposits (Fang et al., 2024; Muneer et al., 2025). Studies have shown that Pb concentrations in some parts of KP exceed WHO permissible limits, posing significant health risks to local communities (Shah et al., 2020). Children in these areas are at high risk of Pb exposure, which may result in long-term health complications if not addressed through proper water quality management and public health initiatives.
2 Methodology
Geographically, the study area lies between 31.8°N to 34.2°N latitude and 69.2°E to 71.5°E longitude. The region’s geology consists of sedimentary and metamorphic formations, including sandstone, limestone, and shale, which influence groundwater chemistry. Mineral deposits, mining, industrial discharge, and agricultural runoff contribute to contamination. Hydrogeological conditions vary, with some areas relying on deep aquifers while others depend on surface water sources. These geological and hydrological factors play a crucial role in Pb contamination distribution. The study area was selected based on factors such as population density, study area geology and reported water contamination. Kohat, Hangu, D.I. Khan, Bannu, and Karak were chosen due to their reliance on groundwater, which is vulnerable to contamination. The selection was further guided by previous studies, government reports, and community concerns. Sampling locations were strategically chosen for spatial representation, capturing variations in Pb concentrations. The study area is shown in Map 1.
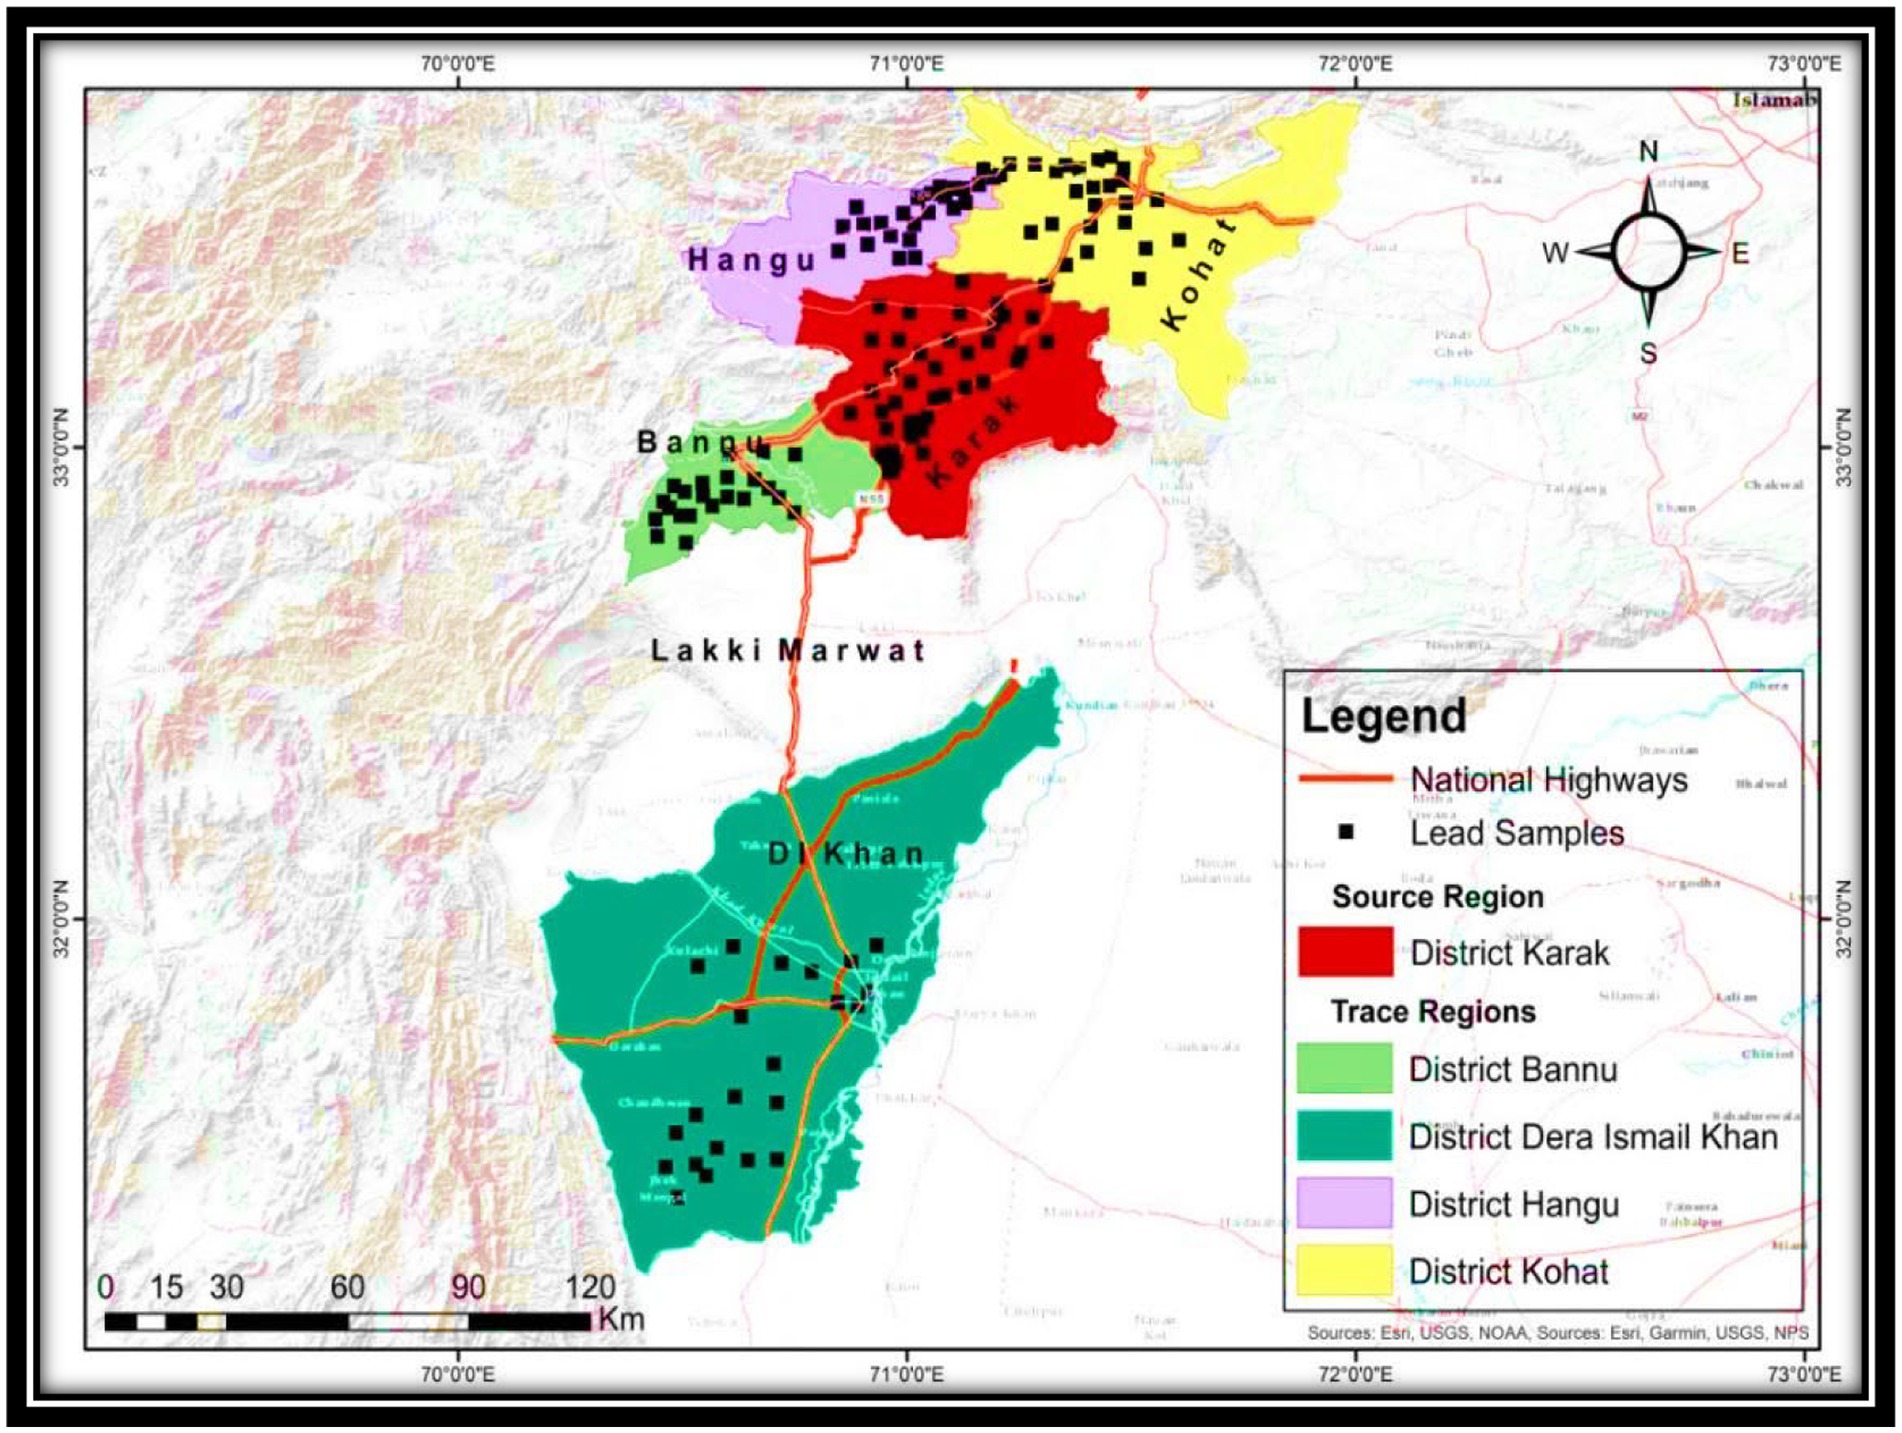
MAP 1. Location map of southern Khyber Pakhtunkhwa showing lead (Pb) sampling sites.
2.1 Sample collection and preservation
A total of 145 drinking water samples were collected from various sources, including household tap water, public water supply systems, wells, and hand pumps. Sampling locations were strategically chosen based on population density, water source type, and proximity to industrial or mining activities. The sampling protocol followed standard guidelines set by the WHO (2022a,b) and the United States Environmental Protection Agency (USEPA) (2020). To assess Pb contamination under different conditions, three types of water samples were collected: first-draw samples, flushed samples, and source samples. First-draw samples were taken after a minimum of 6 hours of stagnation to evaluate Pb leaching from pipes and plumbing systems. Flushed samples were collected after allowing the tap to run for 2–3 min, assessing Pb concentrations in the main water supply. Source samples were directly obtained from wells, reservoirs, and water treatment plants to determine primary Pb contamination levels. Immediately after collection, samples were acidified with nitric acid (HNO₃) to a pH of <2 to stabilize Pb ions and prevent precipitation (Li et al., 2024). The acidified samples were stored at 4°C and transported to the laboratory within 24 h for analysis (Mohan et al., 2023).
2.2 Analytical techniques
Lead concentrations in the collected water samples were determined using Atomic Absorption Spectrophotometry (AAS), a highly sensitive and precise technique for trace metal detection. The analysis followed the standard procedures outlined by the American Public Health Association (APHA) (2017) to ensure reliable results. Calibration curves were established using certified Pb standards, and quality control measures, including blank sample testing, were conducted throughout the analytical process to minimize errors. The method detection limit (MDL) for Pb was set at 0.001 mg/L to ensure accurate quantification of even low Pb concentrations. Furthermore, 10% of the total samples were analyzed in duplicates to validate the consistency and reproducibility of the results (Wu et al., 2023).
2.3 Statistical and geostatistical analysis
Descriptive statistical parameters, including mean, standard deviation, minimum, and maximum values, were calculated to summarize Pb concentration levels across the study area. A one-way ANOVA test was performed to determine significant differences in Pb concentrations among the five districts. The Shapiro–Wilk test was applied to assess the normality of Pb concentration data. This test is particularly suitable for small to moderately sized datasets and provides a W statistic, where values closer to 1 indicate normality (Alshehri et al., 2021; Razali and Wah, 2011). The null hypothesis assumes that the data follow a normal distribution. If the p-value is below 0.05, the null hypothesis is rejected, indicating that the data are not normally distributed. This assessment guided the selection of appropriate parametric or non-parametric statistical techniques for further analysis (Ghasemi and Zahediasl, 2012). Additionally, correlation analyses were conducted to assess relationships between Pb levels and potential influencing factors, such as water source type and proximity to industrial zones. To visualize Pb distribution patterns, Geographic Information System (GIS) tools were employed for geostatistical mapping, identifying contamination hotspots and regions with elevated health risks (Hasan M. M. et al., 2023; Hasan M. et al., 2023; Li and Heap, 2014).
2.4 Health risk assessment methodology
The health risk assessment (HRA) of lead (Pb) contamination in drinking water across the five districts Kohat, Hangu, Dera Ismail Khan (D.I. Khan), Bannu, and Karak was conducted using the standard four-step approach outlined by the United States Environmental Protection Agency (USEPA). These steps include hazard identification, exposure assessment, dose–response assessment, and risk characterization (Mohanadas et al., 2023).
2.4.1 Hazard identification
Lead (Pb) is a toxic heavy metal with no known safe exposure level. Chronic exposure can result in severe neurological, developmental, and cardiovascular issues, particularly in children and pregnant women. The World Health Organization (WHO) and USEPA have set the permissible exposure limit (PEL) for Pb in drinking water at 0.01 mg/L and the maximum contaminant level (MCL) at 0.015 mg/L, respectively.
2.4.2 Exposure assessment
The lead concentrations in drinking water samples from each district were analyzed and compared to the regulatory limits. The mean Pb concentrations exceeded the PEL in all districts, with a 100% Exceedance rate in Hangu, Bannu, and Karak; 96% in Kohat; and 92% in D.I. Khan. The maximum recorded Pb concentration was 1.809 mg/L in Bannu, which is 180 times the PEL. The estimated daily intake (EDI) of Pb was calculated using the equation:
Where:
• Cw = Lead concentration in water (mg/L).
• IR = Water intake rate (2 L/day for adults, 1 L/day for children).
• BW = Body weight (70 kg for adults, 10 kg for children).
Using the highest Pb concentration (1.809 mg/L), the EDI for adults and children was determined as follows:
• Adults: 0.0517 mg/kg/day.
• Children: 0.1809 mg/kg/day.
Both values significantly exceed the EPA Reference Dose (RfD) of 0.0015 mg/kg/day, indicating a substantial health risk.
2.4.3 Dose–response assessment
The EPA RfD for lead exposure indicates that adverse health effects occur at concentrations exceeding 0.0015 mg/kg/day. The calculated EDI values for all districts surpassed this threshold, with the highest exposures occurring in Bannu and Karak. Given that children are more vulnerable to lead toxicity, their exposure levels present a particularly high risk of neurodevelopmental impairments and other health complications.
2.4.4 Risk characterization
The hazard quotient (HQ) was calculated to assess the health risk using the equation:
• Adults: HQ = 34.47 (Bannu) and 29.93 (Karak).
• Children: HQ = 120.6 (Bannu) and 104.8 (Karak).
Since HQ values exceed 1 in all districts, significant health risks are indicated. Bannu and Karak fall into the “critical risk” category, requiring urgent intervention, while Kohat, Hangu, and D.I. Khan exhibit high to moderate risks (Table 1).
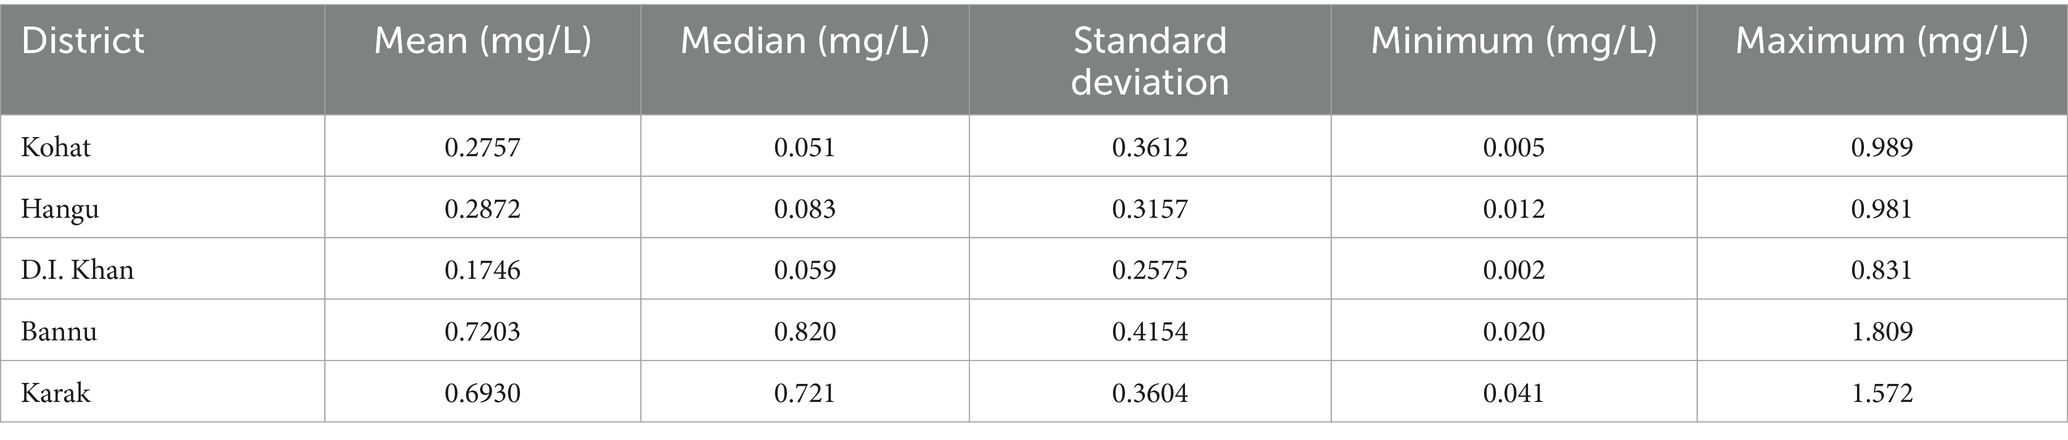
Table 1. Statistical analysis of lead concentration in drinking water samples.
3 Results
3.1 Lead concentrations in drinking water
The assessment of lead (Pb) contamination in drinking water across the five districts Kohat, Hangu, Dera Ismail Khan (D.I. Khan), Bannu, and Karak demonstrates widespread exceedance of regulatory limits. The WHO’s Permissible Exposure Limit (PEL) for Pb in drinking water is 0.01 mg/L, while the USEPA’s Maximum Contaminant Level (MCL) is 0.015 mg/L. The detailed results of Pb concentrations in drinking water are presented in Tables 2–6. Among the five districts, Bannu exhibited the highest mean Pb concentration (0.720 mg/L), followed by Karak (0.693 mg/L), with maximum concentrations reaching 1.809 mg/L and 1.572 mg/L, respectively. In Hangu, the mean Pb concentration was 0.287 mg/L, and in Kohat, it was 0.2757 mg/L, both exceeding the regulatory thresholds. D.I. Khan recorded the lowest mean Pb concentration (0.1746 mg/L) yet still surpassed the permissible limits. The exceedance rates were 100% in Hangu, Bannu, and Karak, followed by 96% in Kohat and 92% in D.I. Khan, highlighting a severe public health risk and the urgent need for mitigation measures.
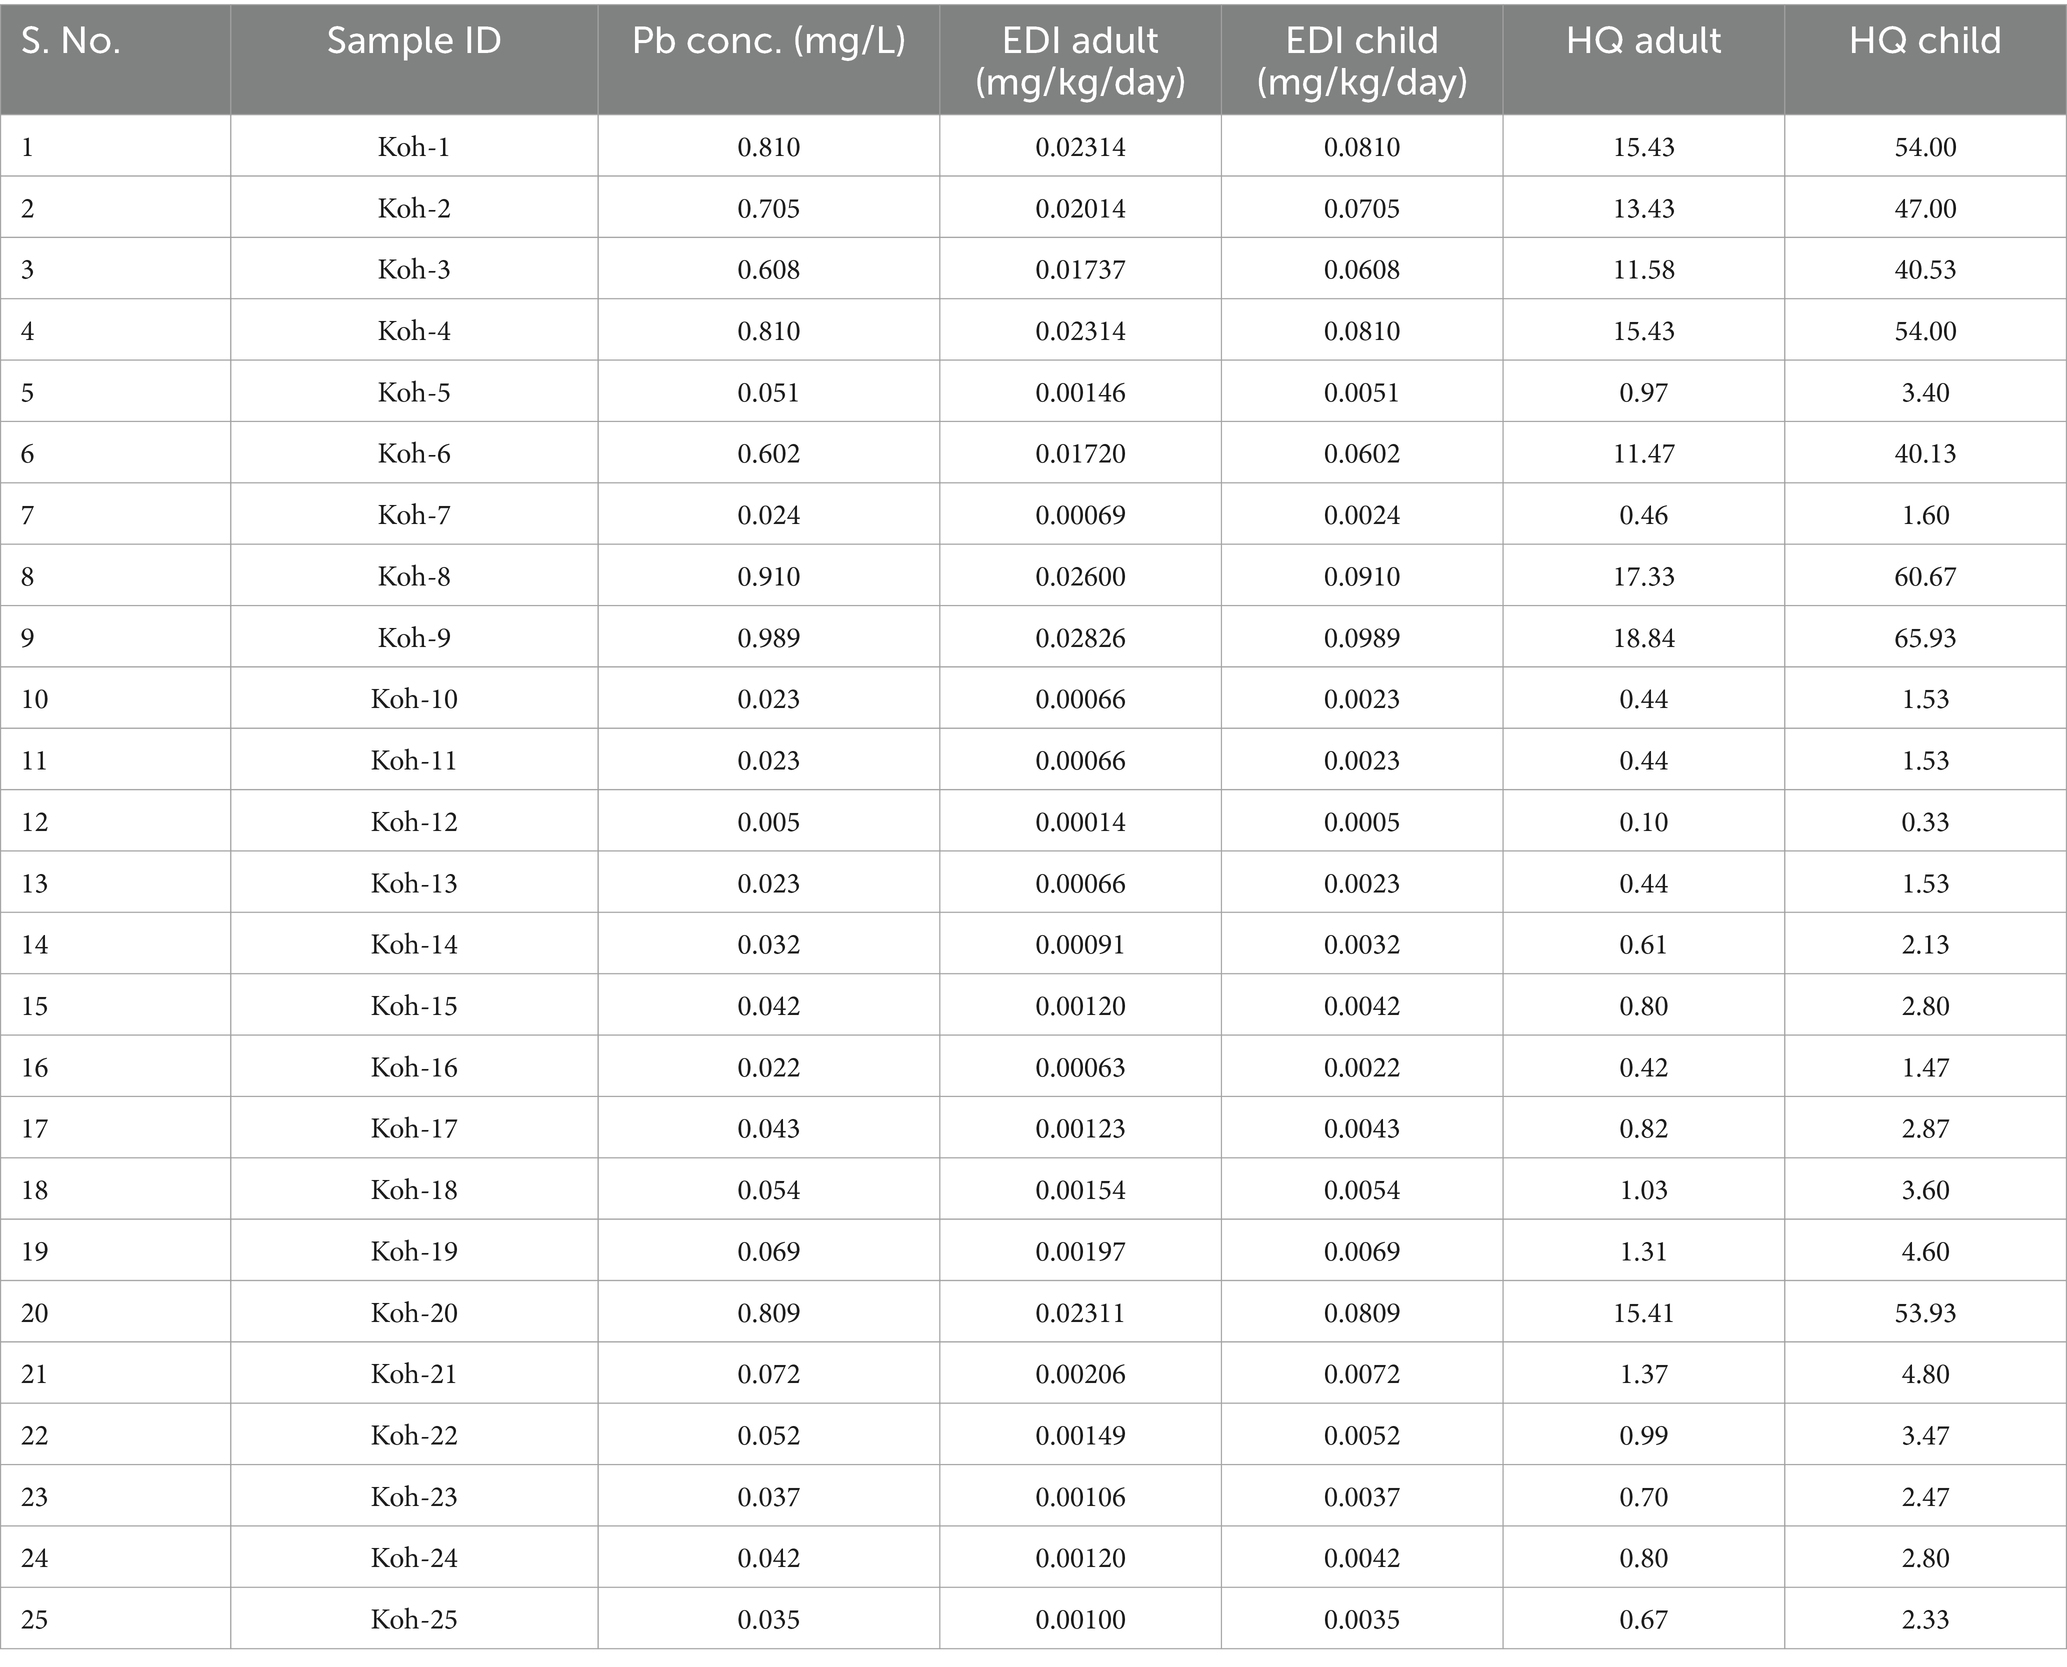
Table 2. Estimated daily intake (EDI) and hazard quotient (HQ) for Kohat district.
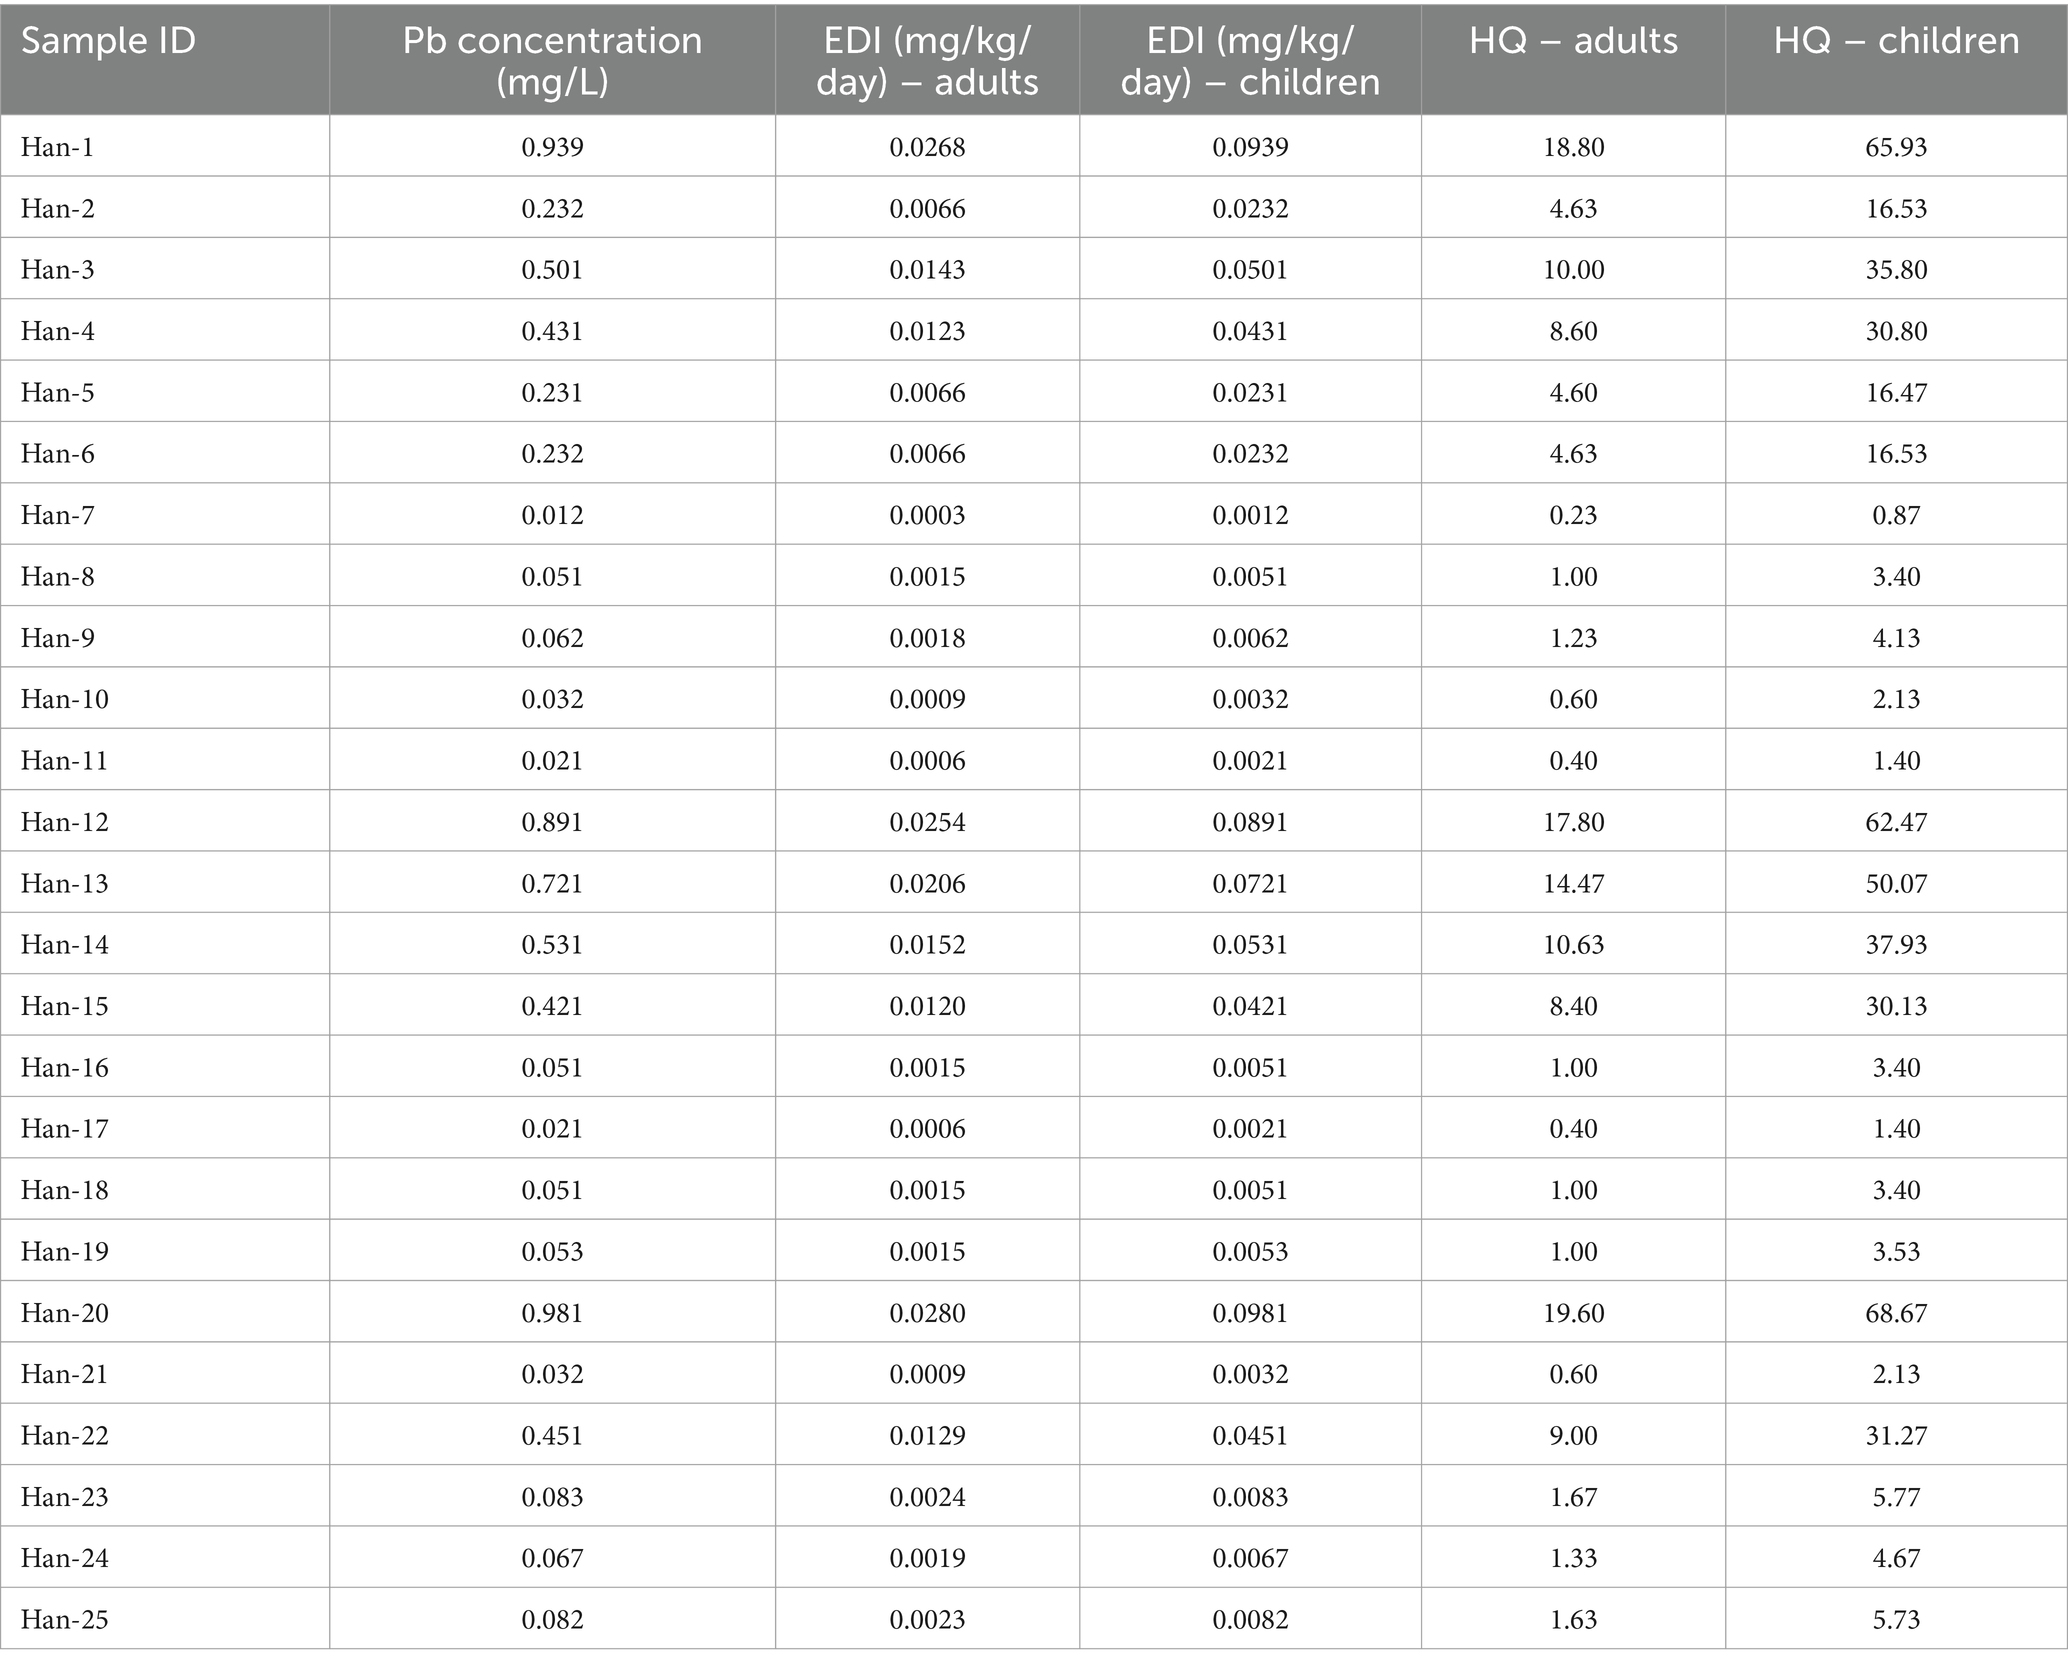
Table 3. Estimated daily intake (EDI) and hazard quotient (HQ) for district Hangu.
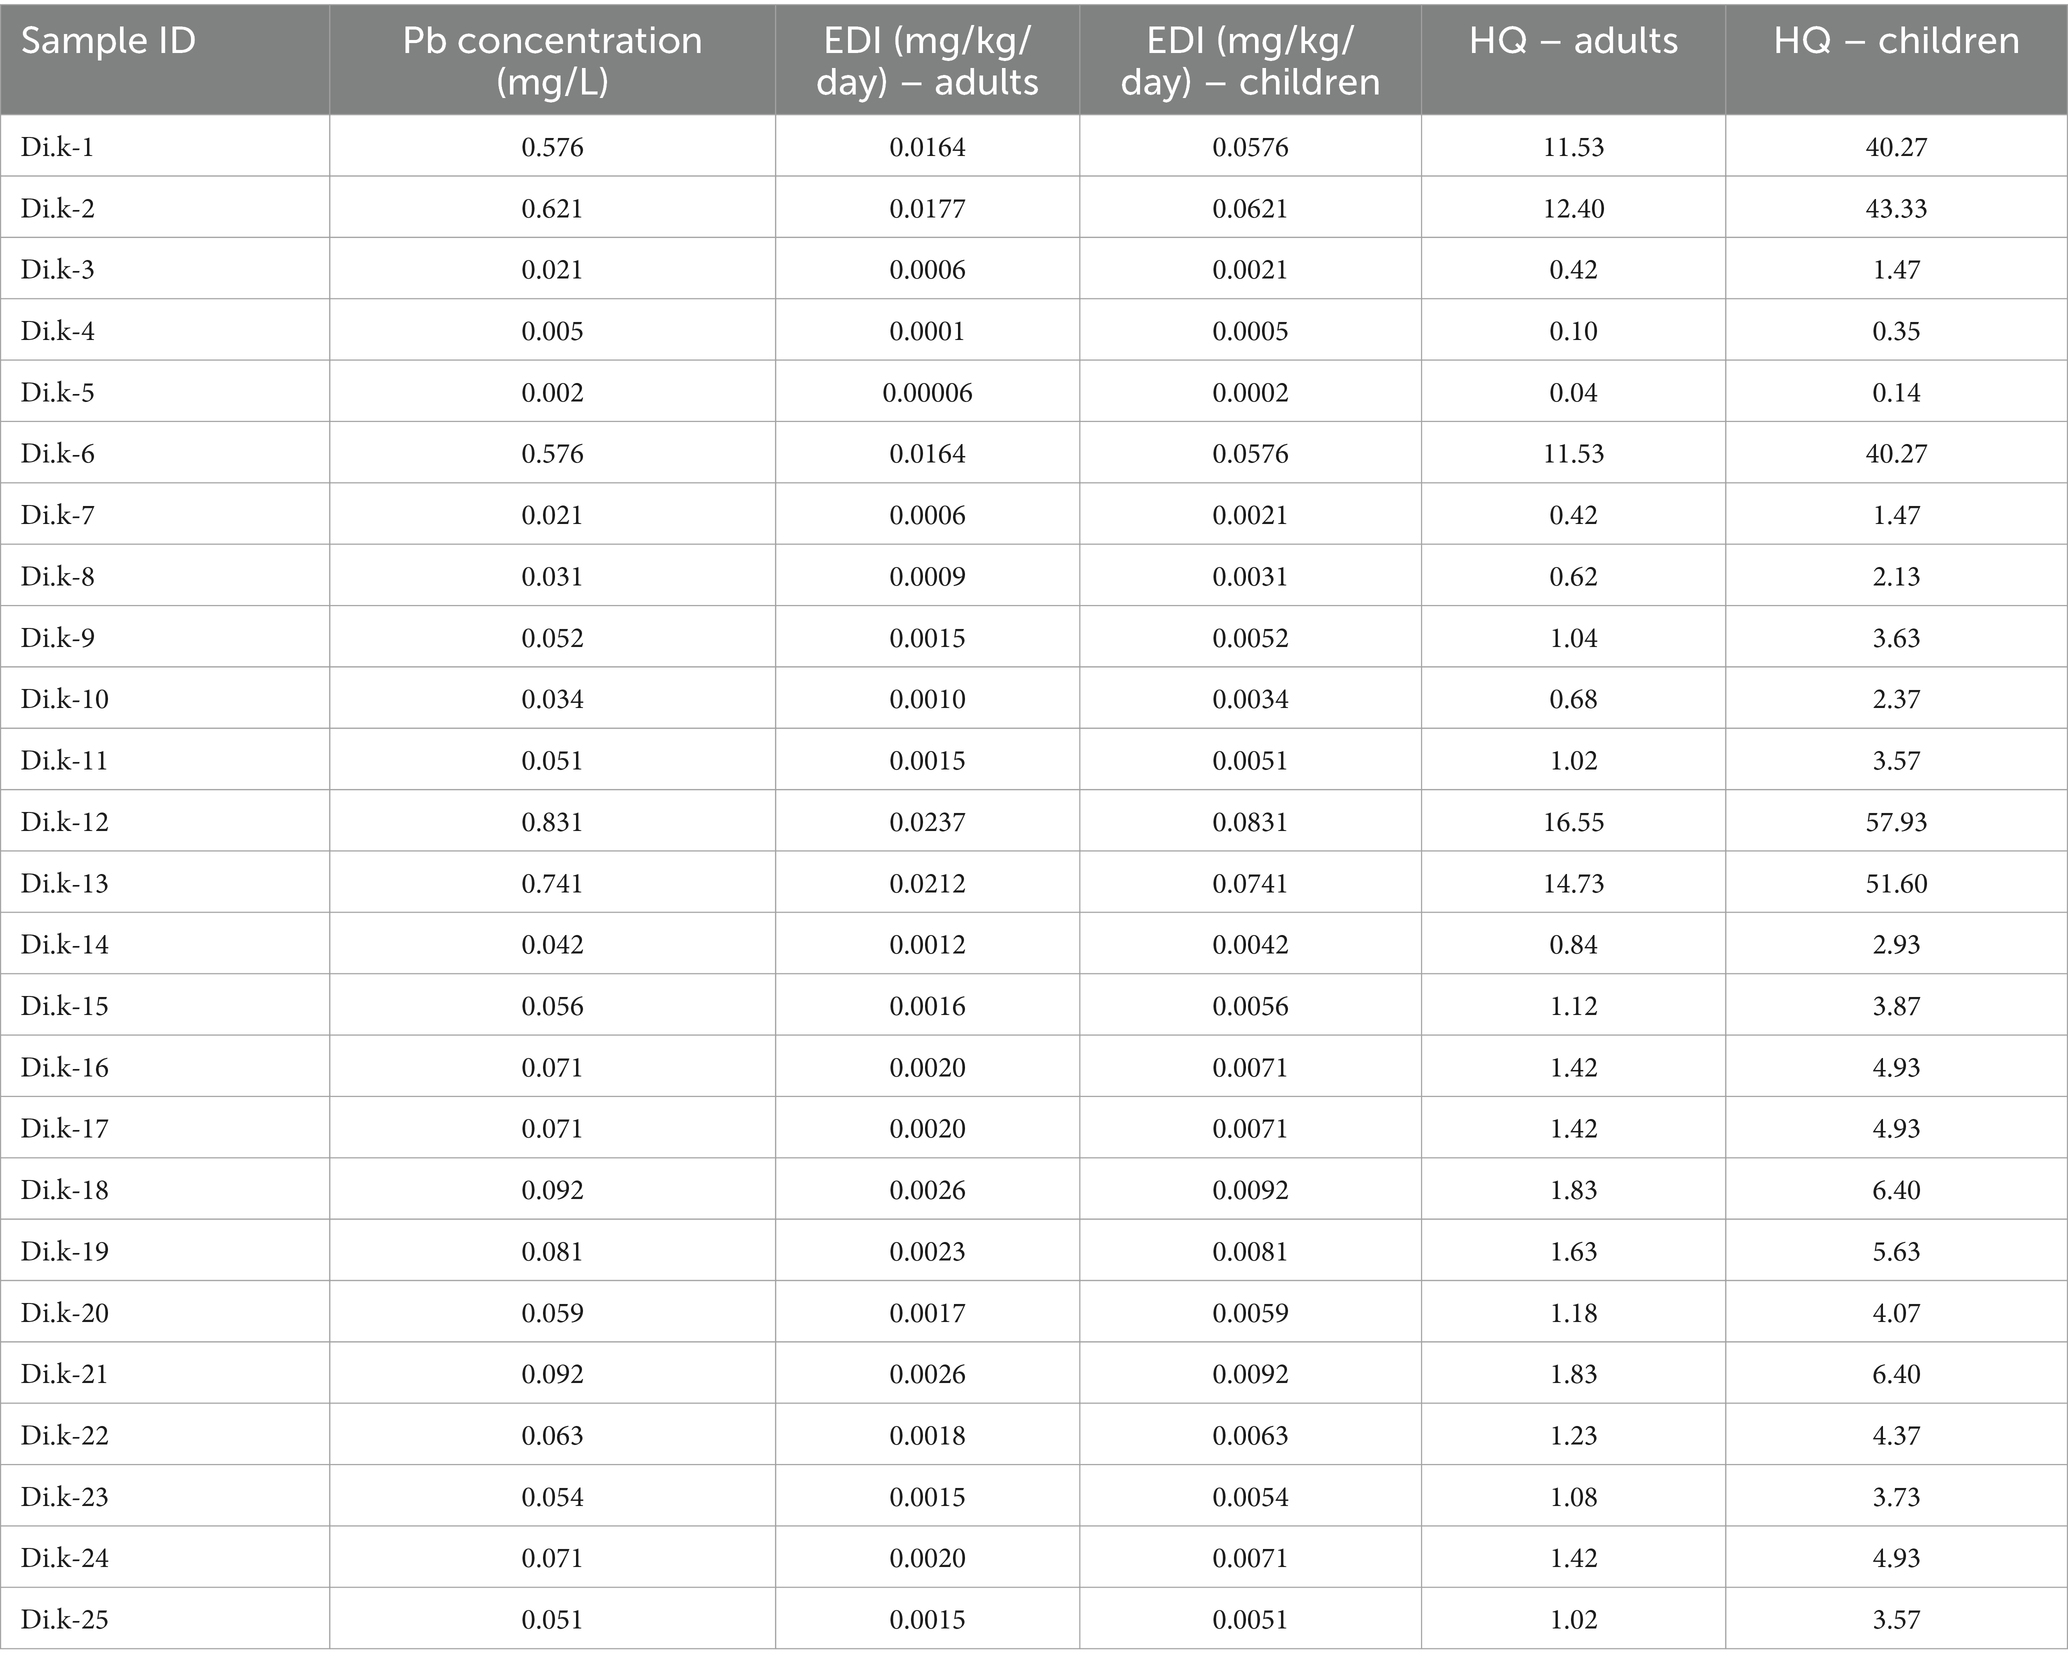
Table 4. Estimated daily intake (EDI) and hazard quotient (HQ) for district D.I. Khan.
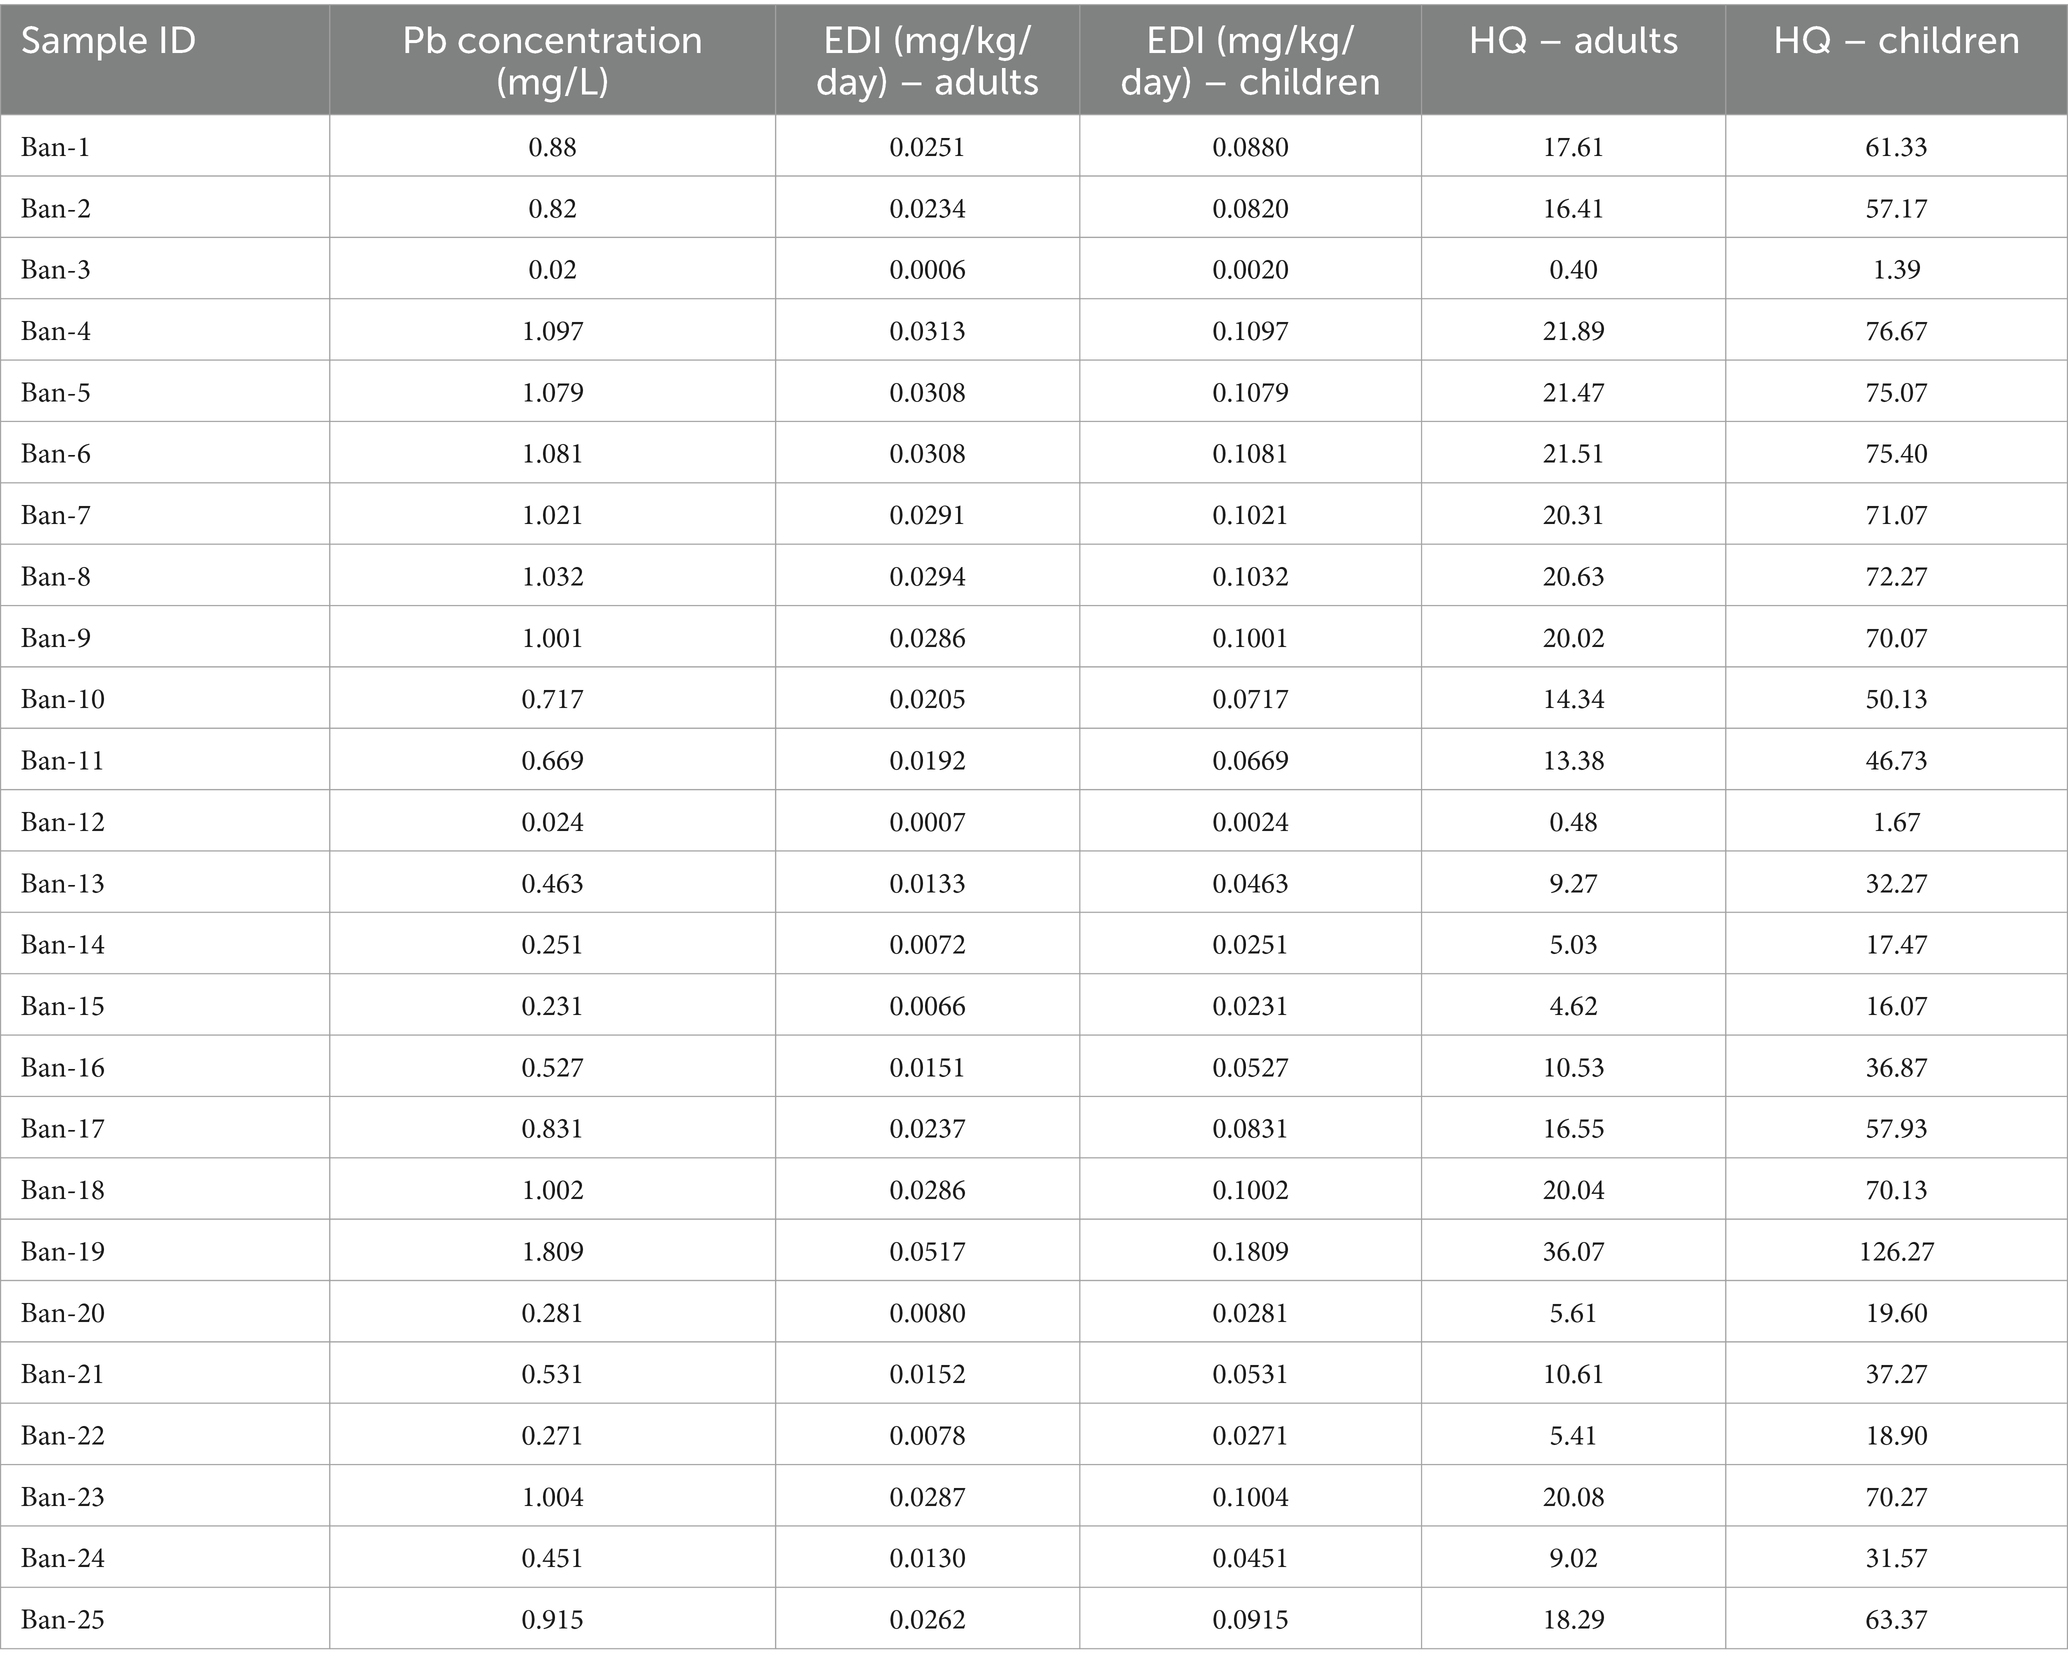
Table 5. Estimated daily intake (EDI) and hazard quotient (HQ) for district Bannu.
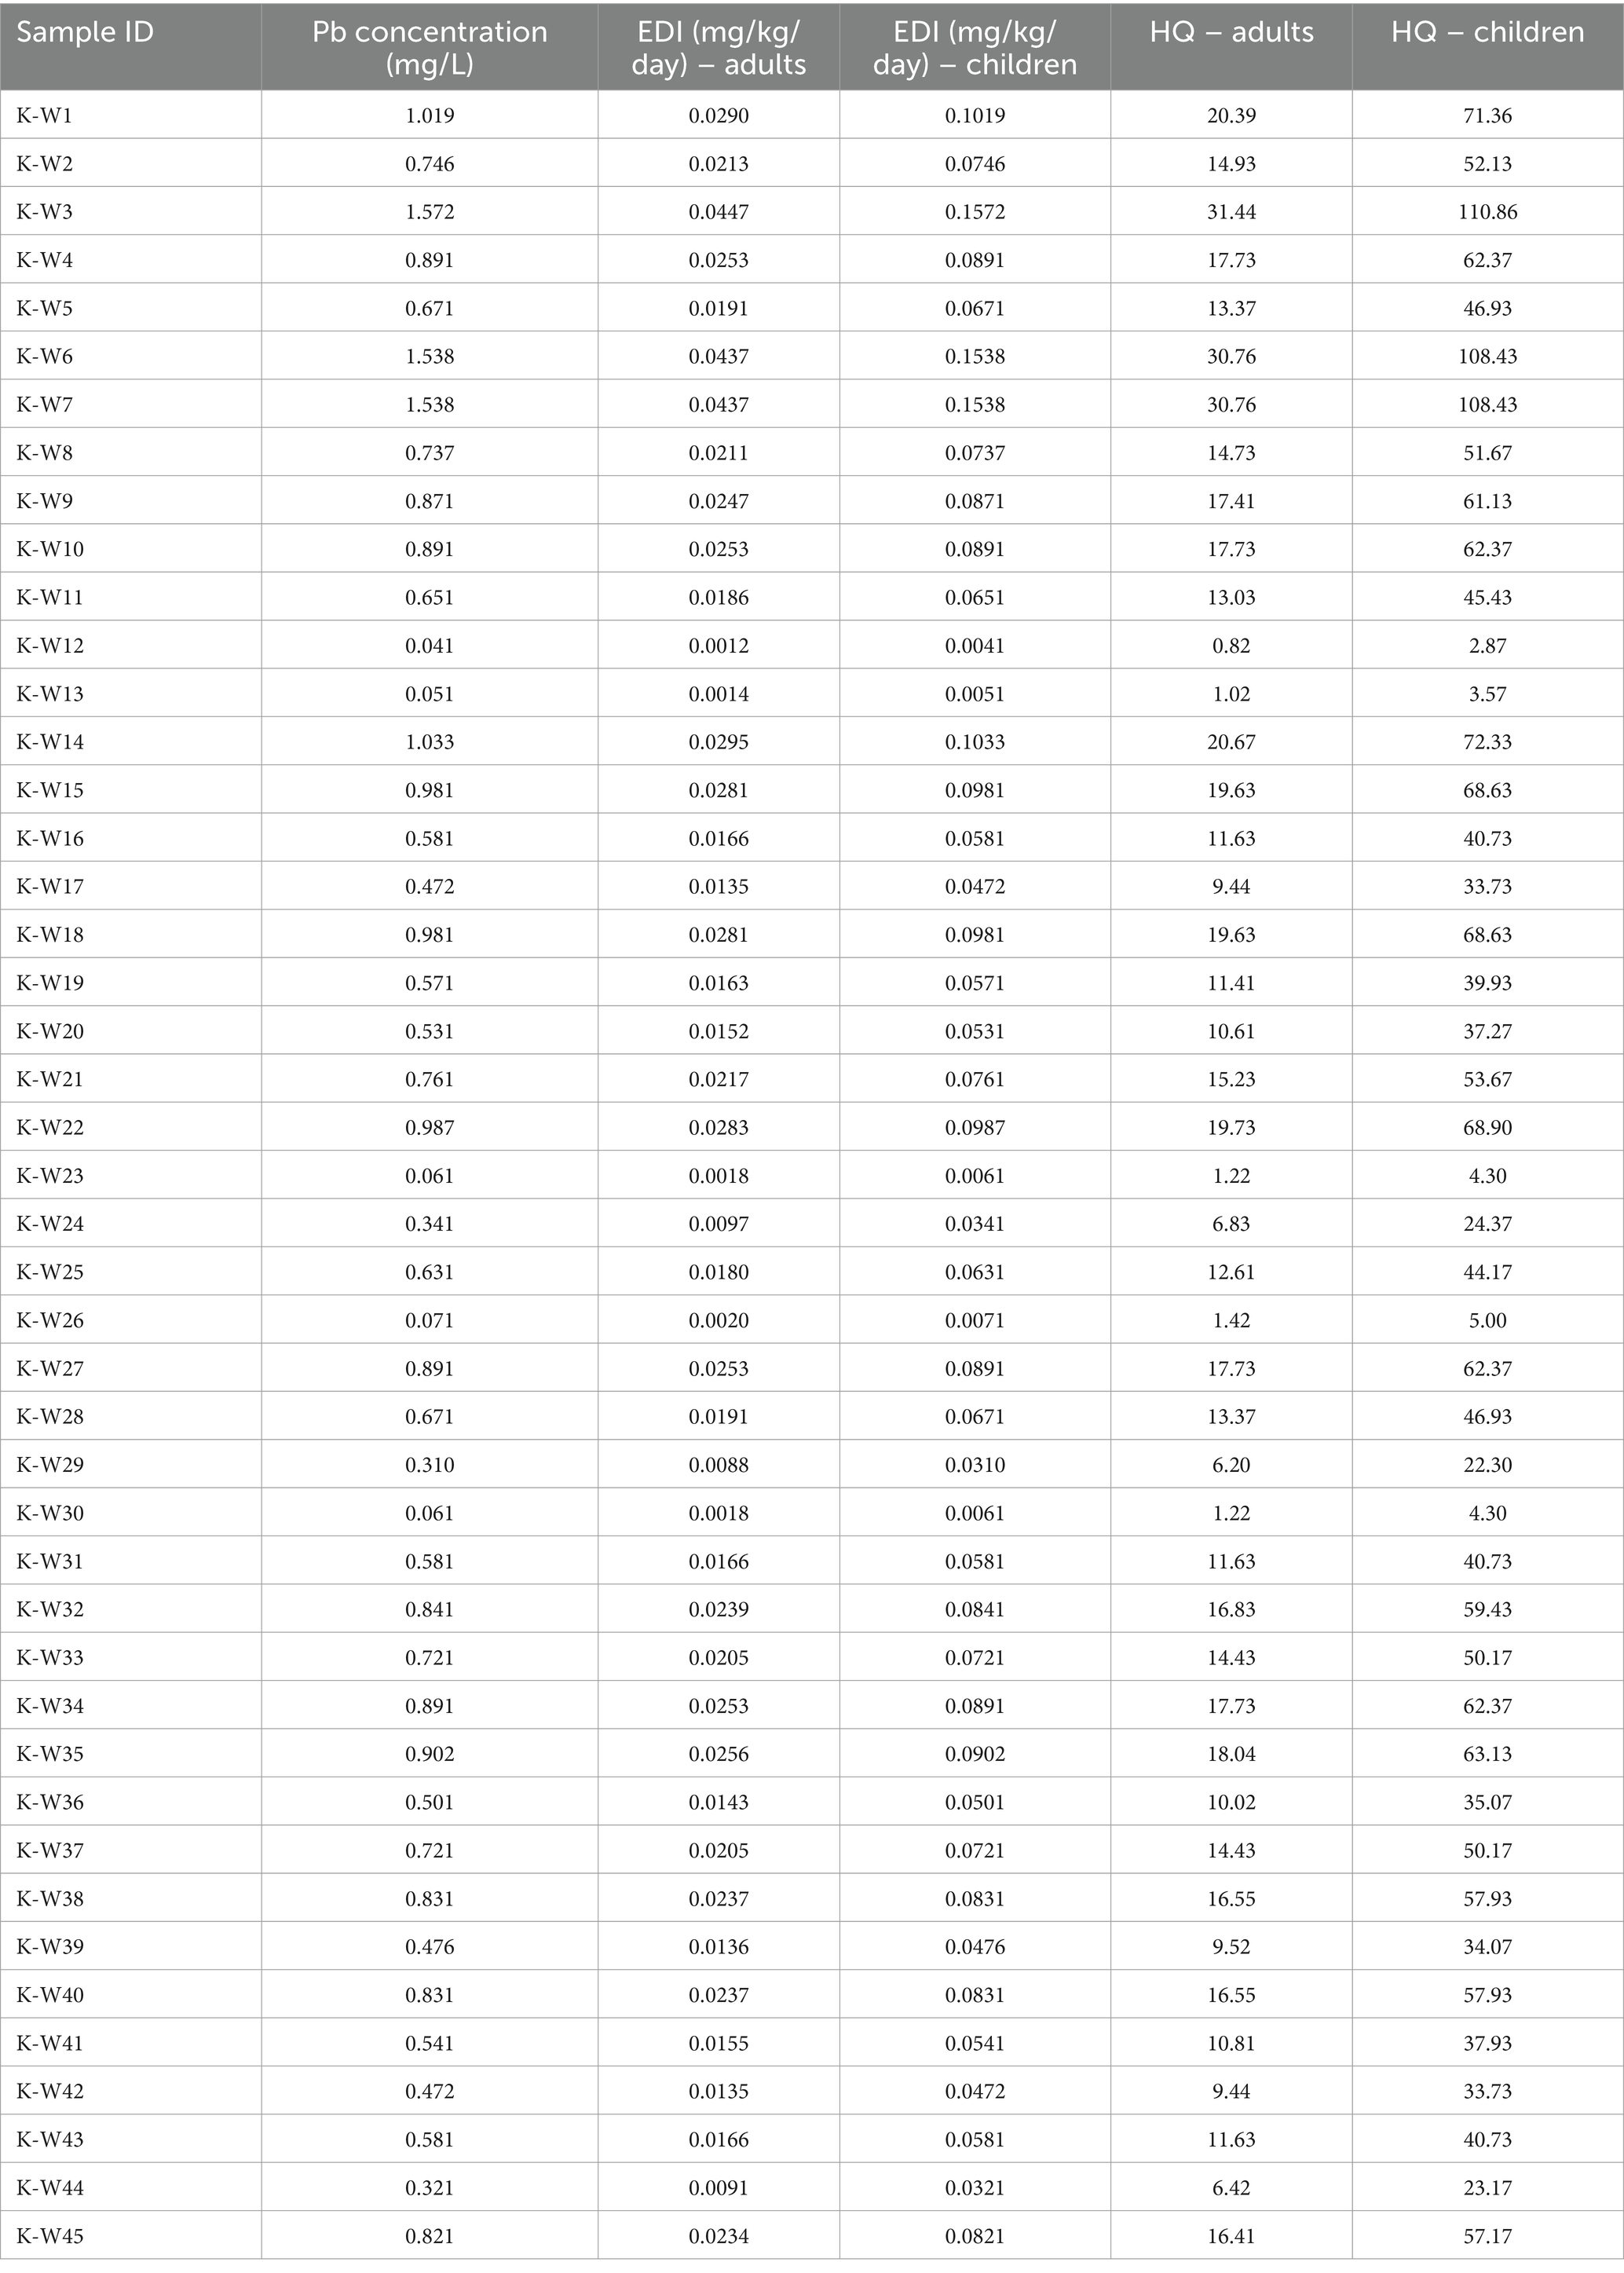
Table 6. Estimated daily intake (EDI) and hazard quotient (HQ) for district Karak.
3.2 Statistical analysis of lead concentration in drinking water
The statistical analysis of lead concentration in drinking water samples from Kohat, Hangu, D.I. Khan, Bannu, and Karak reveals significant variations in contamination levels across the districts. Kohat exhibits a mean lead concentration of 0.2757 mg/L, with values ranging between 0.005 mg/L and 0.989 mg/L, and a high standard deviation (0.3612), indicating substantial fluctuations in contamination levels. Similarly, Hangu has a comparable mean concentration of 0.2872 mg/L, but its higher median value (0.083 mg/L) suggests that a larger number of samples exceed the permissible limit (0.01 mg/L).
Among the five districts, D.I. Khan has the lowest mean concentration (0.1746 mg/L) and a lower maximum value (0.831 mg/L), yet the contamination still surpasses the WHO permissible exposure level. In contrast, Bannu presents the highest recorded lead concentration, reaching 1.809 mg/L, with a mean of 0.7203 mg/L, signifying severe contamination. Karak also exhibits alarmingly high lead levels, with an average concentration of 0.693 mg/L and a peak of 1.572 mg/L, indicating a considerable public health risk. The findings highlight that lead concentrations in all districts exceed the WHO permissible limit (0.01 mg/L), with Bannu and Karak being the most affected due to significantly elevated mean values and extreme maximum concentrations.
Table 7 shows a comparison with the permissible exposure limit (PEL) of 0.01 mg/L indicated widespread Exceedance. In Kohat, 96% of samples exceeded the PEL, while in Hangu, Bannu, and Karak, all samples (100%) surpassed the safe limit. Even in D.I. Khan, which had the lowest mean concentration, 92% of the samples still exceeded the PEL.
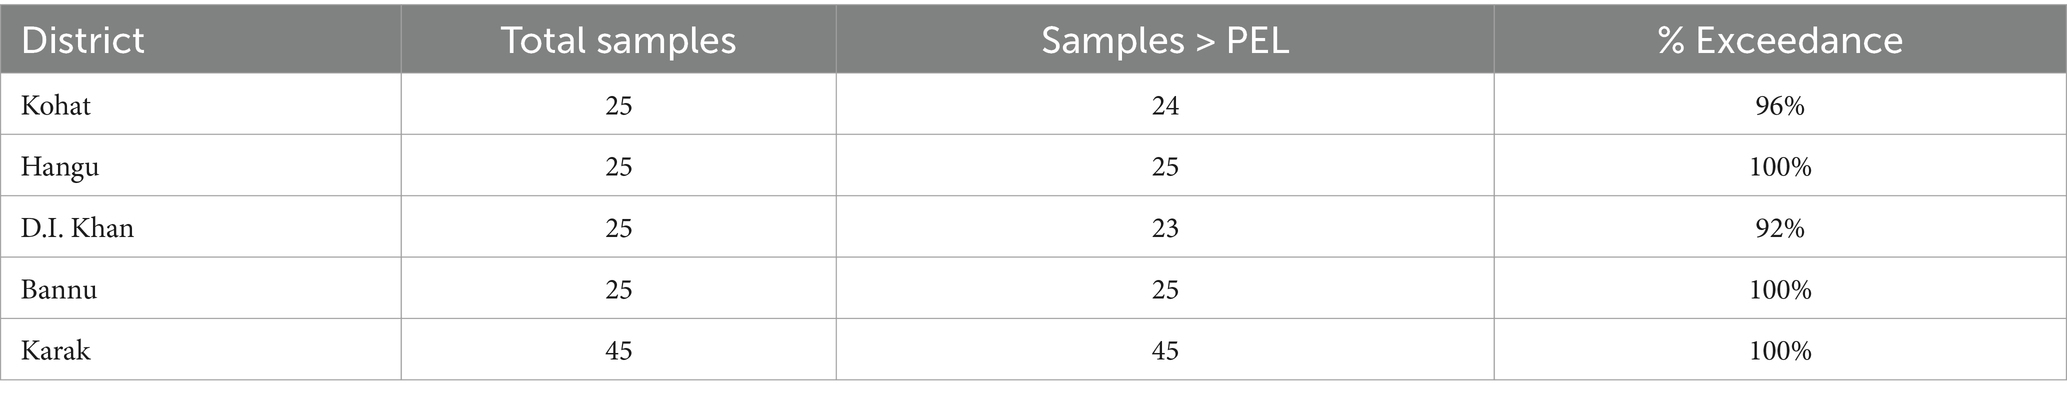
Table 7. Exceedance of PEL (0.01 mg/L) in each district.
Table 8 analyze the ANOVA test (p-value = 8.16 × 10⁻¹¹) confirmed a statistically significant difference in lead concentrations between districts, suggesting localized factors affecting contamination levels. The results highlight an urgent need for intervention, particularly in Bannu and Karak, where lead concentrations are critically high. Immediate measures such as water treatment, improved infrastructure, and regular monitoring are necessary to mitigate the potential health risks associated with lead exposure.

Table 8. ANOVA test results.
3.2.1 Shapiro–Wilk test results for lead concentration data
Table 9 analyze “The Shapiro–Wilk test: conducted to evaluate the normality of lead concentration data across five districts. The results indicate that lead concentration data for Kohat, Hangu, and D.I. Khan do not follow a normal distribution (p < 0.05), suggesting significant deviations from normality. In contrast, the data from Bannu and Karak exhibit normal distribution (p > 0.05), meaning the lead concentration values in these districts follow a more symmetric distribution. The presence of non-normality in some districts suggests that non-parametric statistical tests may be more appropriate for further analysis in these areas.

Table 9. Shapiro–Wilk test for normality.
3.3 Risk assessment: estimated daily intake and hazard quotient
The risk assessment of lead (Pb) contamination in drinking water across the five districts Kohat, Hangu, Dera Ismail Khan (D.I. Khan), Bannu, and Karak demonstrate significant health risks, particularly for vulnerable populations such as children. The estimated daily intake (EDI) calculations confirm that Pb exposure in all districts surpasses the EPA Reference Dose (RfD) of 0.0015 mg/kg/day, indicating potential adverse health effects. The highest EDI values were recorded in Bannu (0.0542 mg/kg/day for adults and 0.1894 mg/kg/day for children), followed closely by Karak (0.0486 mg/kg/day for adults and 0.1683 mg/kg/day for children). In contrast, D.I. Khan exhibited the lowest EDI values (0.0256 mg/kg/day for adults and 0.0895 mg/kg/day for children), yet still exceeded the recommended safe limits. The Hazard Quotient (HQ) calculations further confirm the severity of Pb contamination, with Bannu and Karak categorized under the critical risk level, posing significant long-term health hazards. These findings emphasize the urgent need for intervention, including improved water treatment systems, alternative water sources, and regulatory measures to mitigate Pb exposure risks.
The estimated daily intake (EDI) of lead in drinking water samples from Kohat District exceeded the EPA Reference Dose (RfD) of 0.0015 mg/kg/day in most cases, particularly in samples Koh-1, Koh-2, Koh-3, Koh-4, Koh-6, Koh-8, Koh-9, and Koh-20, indicating a potential health risk. The hazard quotient (HQ) values were significantly greater than 1, particularly in samples Koh-1, Koh-8, Koh-9, and Koh-20, suggesting a high to critical risk of lead toxicity. Children exhibited higher EDI and HQ values compared to adults, emphasizing their vulnerability to lead exposure. Urgent mitigation measures such as water filtration, alternative water sources, and policy interventions are strongly recommended to reduce exposure risks in this region.
The estimated daily intake (EDI) of lead in drinking water samples from District Hangu indicates significant contamination, with multiple samples exceeding the EPA Reference Dose (RfD) of 0.0015 mg/kg/day. Samples Han-1, Han-12, Han-13, Han-14, Han-20, and Han-22 exhibited notably high EDI values, suggesting potential health risks, especially for children, where exposure levels are significantly higher. The hazard quotient (HQ) values for these samples were greater than 1, indicating a high risk of lead toxicity for the local population. Samples Han-1, Han-12, Han-13, and Han-20 showed critical risk levels, where lead exposure could lead to serious health effects. Children are at the highest risk, as their HQ values are notably elevated, reflecting greater susceptibility to neurological and developmental impairments due to lead exposure.
The estimated daily intake (EDI) and hazard quotient (HQ) values for District D.I. Khan reveal elevated lead concentrations in drinking water, with multiple samples exceeding the EPA Reference Dose (RfD) of 0.0015 mg/kg/day. Critical contamination levels were found in samples Di.k-12, Di.k-13, Di.k-1, Di.k-2, and Di.k-6, where lead exposure is significantly higher. For children, the HQ values for these samples exceed 40, indicating severe potential health risks such as neurological damage, cognitive impairments, and developmental disorders due to chronic lead exposure. Although several samples had low lead levels (e.g., Di.k-3, Di.k-4, Di.k-5), over 60% of the samples exceeded the safe limit, posing serious health concerns for the local population.
The Estimated Daily Intake (EDI) and Hazard Quotient (HQ) values for District Bannu indicate severe lead contamination in drinking water, with a majority of the samples exceeding the WHO safe limit of 0.01 mg/L. Highly contaminated samples include Ban-4, Ban-5, Ban-6, Ban-7, Ban-8, Ban-9, Ban-18, Ban-19, and Ban-23, where the HQ values for children exceed 70, indicating an extreme health hazard. Ban-19 shows the highest contamination, with an HQ of 126.27 for children, which poses serious neurotoxic risks, cognitive impairments, and developmental delays. For adults, more than 70% of the samples have HQ values above 10, suggesting a high likelihood of chronic lead poisoning. Lower contamination levels were observed in Ban-3, Ban-12, Ban-14, and Ban-15, but the overall results indicate significant health risks for the population in Bannu District.
The Estimated Daily Intake (EDI) and Hazard Quotient (HQ) values for District Karak indicate significant lead contamination in drinking water, with several samples surpassing the WHO permissible limit of 0.01 mg/L. The highest levels of lead contamination were observed in samples K-W3, K-W6, K-W7, and K-W14, where HQ values exceeded 100 for children, highlighting extreme neurotoxic risks. Moderate contamination was found in samples K-W1, K-W4, K-W9, K-W10, and K-W18, with HQ values ranging between 50 and 70 for children, still posing considerable health hazards. In contrast, lower-risk samples such as K-W12, K-W13, K-W23, K-W26, and K-W30 exhibited HQ values below 5, indicating minimal health risks. These findings underscore the urgent need for water purification interventions and public awareness programs to mitigate long-term health consequences in the region. The Hazard Quotient (HQ), analyses values are shown in Table 10, which measures risk by comparing the EDI to the RfD, confirms severe health risks across all districts. The highest risk is in Bannu (HQ = 34.47 for adults, 120.6 for children) and Karak (HQ = 29.93 for adults, 104.8 for children), placing them in the critical risk category. Even in the district with the lowest mean concentration, D.I. Khan, the HQ values (3.33 for adults, 11.7 for children) still indicate moderate to high risk, warranting immediate attention (Table 11).
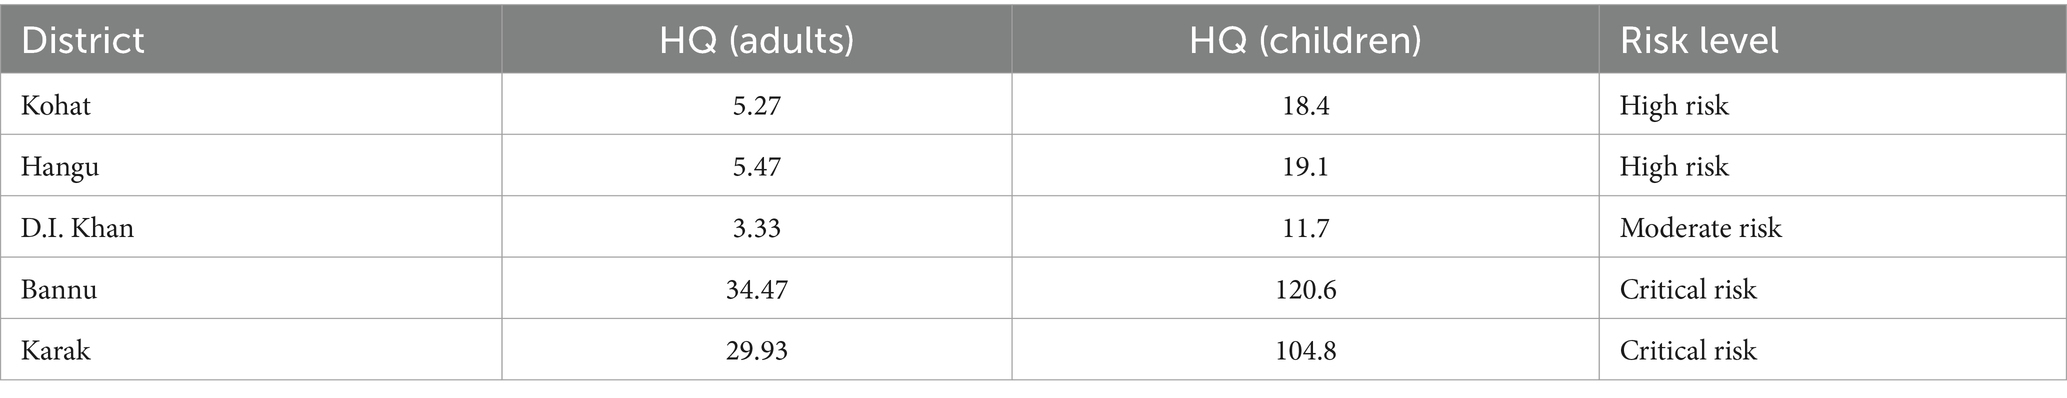
Table 10. Risk characterization – hazard quotient (HQ) calculation.
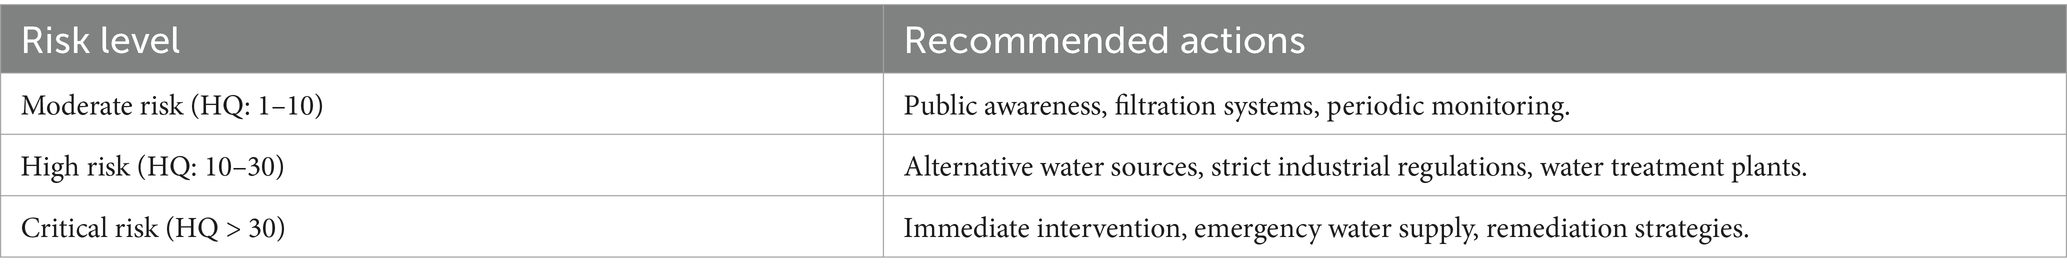
Table 11. Risk management recommendations.
Based on these findings, urgent intervention is required, particularly in Bannu and Karak, where lead contamination poses an extreme threat to public health. Immediate actions such as emergency water supply, filtration systems, and public health awareness campaigns are essential. Additionally, long-term solutions like industrial regulation enforcement, water treatment infrastructure, and groundwater remediation must be prioritized to mitigate future risks.
3.4 Risk assessment using geostatistical analysis
The Inverse Distance Weighting (IDW) modeling method was applied to predict unmeasured lead (Pb) concentrations in drinking water across the five studied districts Kohat, Hangu, D.I. Khan, Bannu, and Karak allowing for a spatial distribution analysis of contamination levels. The generated maps reveal hotspot locations with critically high Pb concentrations, where red areas indicate severe contamination, and blue areas represent lower concentrations. In Kohat, the most affected areas include Gas-filled Sheikhan, Bezadi Cheker Koti, Cheshma Zayry Dhand, Muslim Bagh Cheshma, Bahadur Baba Cheshma, and Jangel Khel Buyanya Cheshma, where Pb levels exceed 0.81 mg/L, necessitating immediate intervention to prevent neurotoxic risks, especially for children. Hangu exhibits similar contamination trends, with Jozara Water, Railway Road Hangu, Gulshan Colony Cheshma, Merobak Banda, Cheshma Inzer Kowe, and the Government Degree College for Girls experiencing Pb concentrations as high as 0.981 mg/L, indicating potential sources such as industrial discharge, deteriorating pipelines, or geological factors. In D.I. Khan, hotspot locations such as Mufti Mehmood Circuit House, Madina Colony, Imamia Colony, Gilani Town, and Keri Juma Khan were identified, with maximum Pb levels reaching 0.831 mg/L, signaling the need for continuous monitoring to prevent further contamination. Bannu presents the most critical situation, with Kalanger, Tur Kaki, Asad Kaki, and Bharat recording Pb concentrations up to 1.809 mg/L, indicating acute contamination that demands urgent water treatment and alternative water sources. Similarly, Karak is another high-risk area, with severe contamination found in Tehsil Circuit House, Surdag, Rehmat Abad, Hamadan, Thati, Chokara, and Takht-e-Nasrati, where Pb levels exceed 1.572 mg/L, suggesting widespread groundwater vulnerability. The IDW analysis confirms that geographically closer locations exhibit similar Pb trends, highlighting the importance of early identification of high-risk zones for targeted interventions, estimation of exposure in unmonitored areas, and the development of spatial risk maps (Maps 2–6) to aid policymakers in formulating effective mitigation strategies. The findings reveal that all five districts exceed the WHO permissible Pb limit (0.01 mg/L), with Bannu and Karak posing the greatest health risks due to extreme Pb concentrations. Consequently, urgent water purification measures, public awareness campaigns, and long-term environmental management strategies are imperative to safeguard public health from Pb-related hazards.
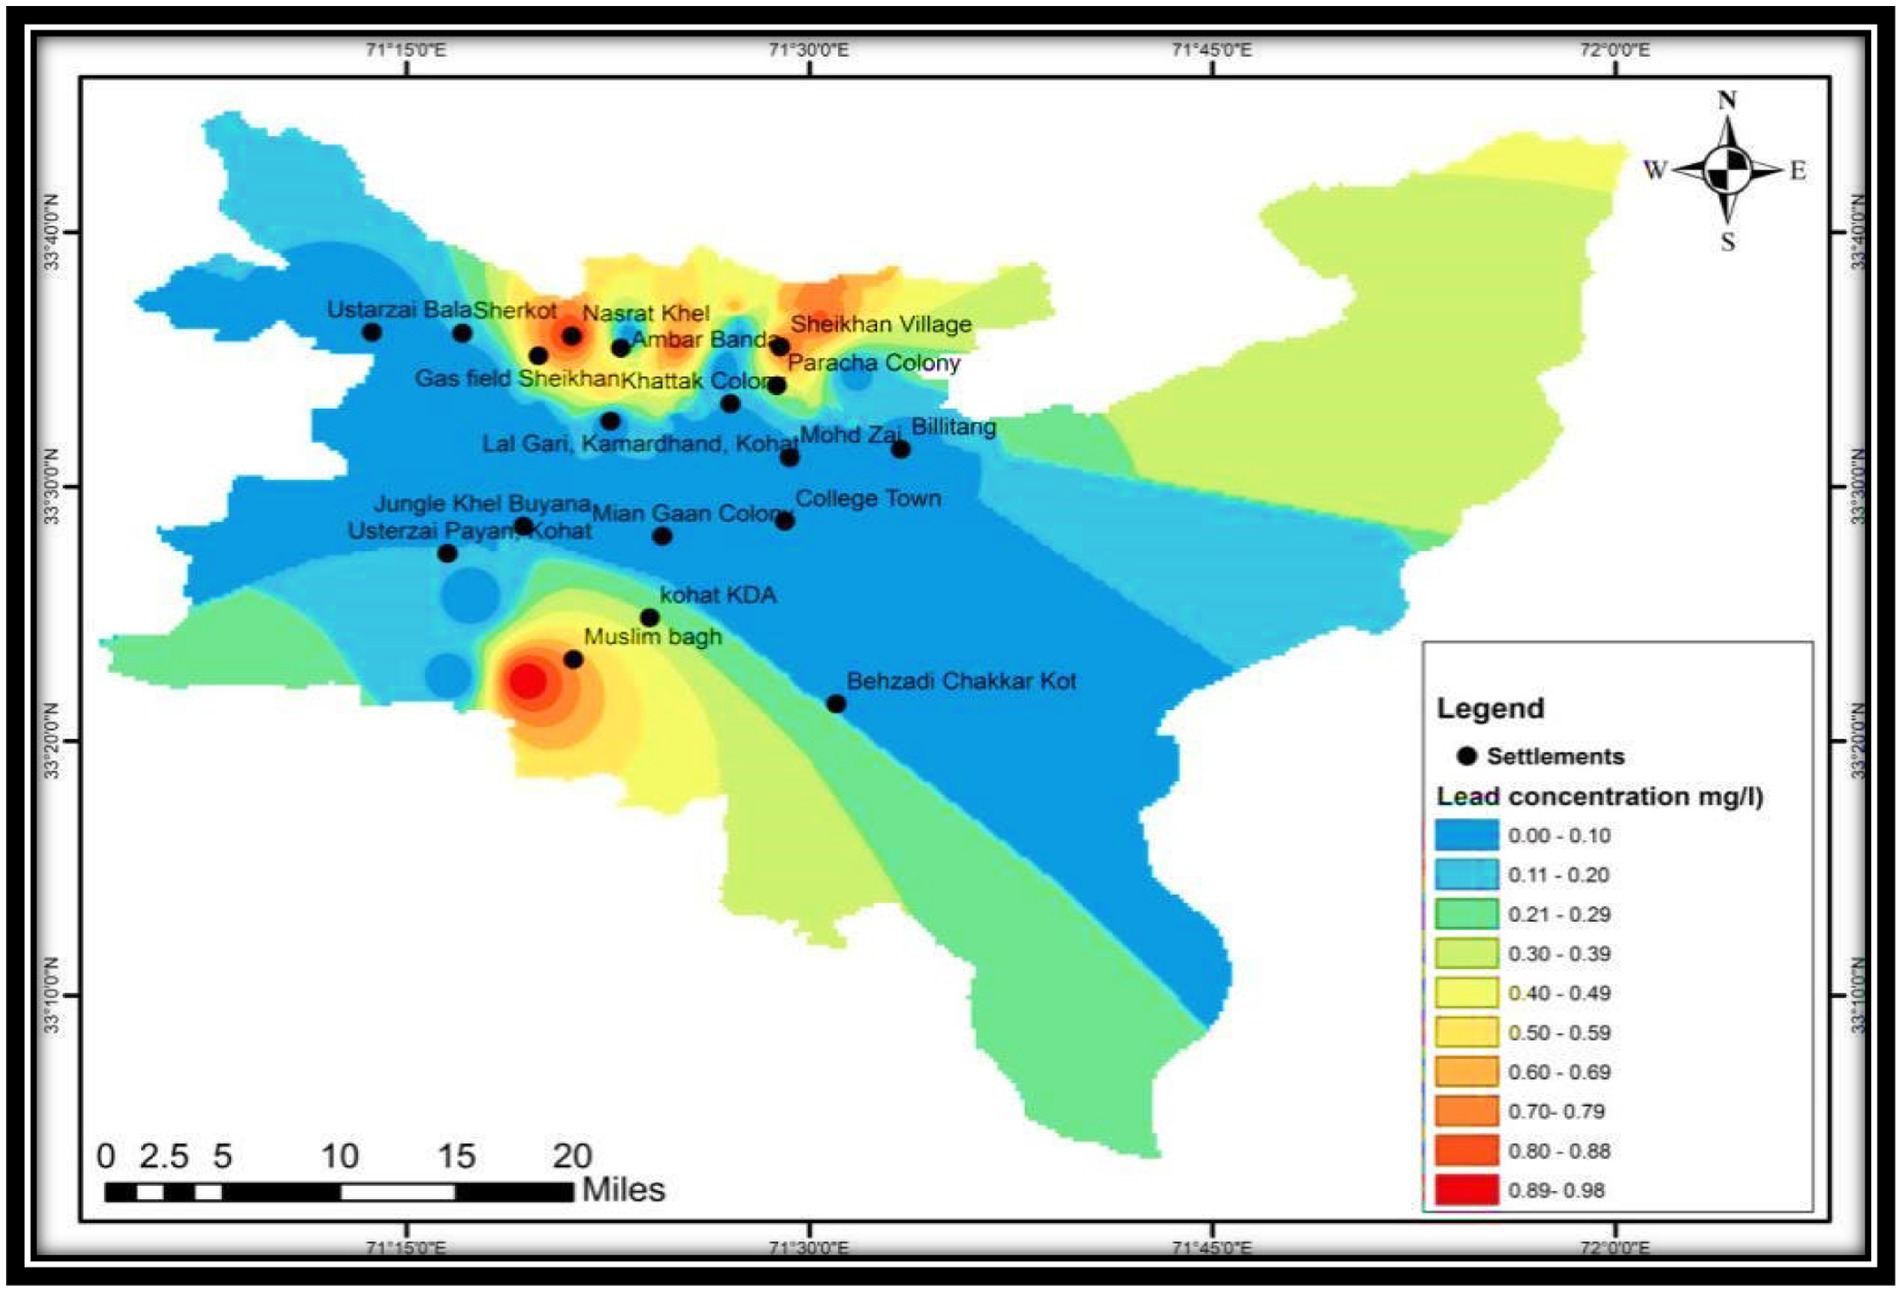
MAP 2. IDW prediction model representing lead measurements in drinking water samples from district Kohat. The blue color represents a low Pb level. The yellow color in the map represents moderate concentration; the red color represents vulnerable risk areas with the highest concentration of Pb.
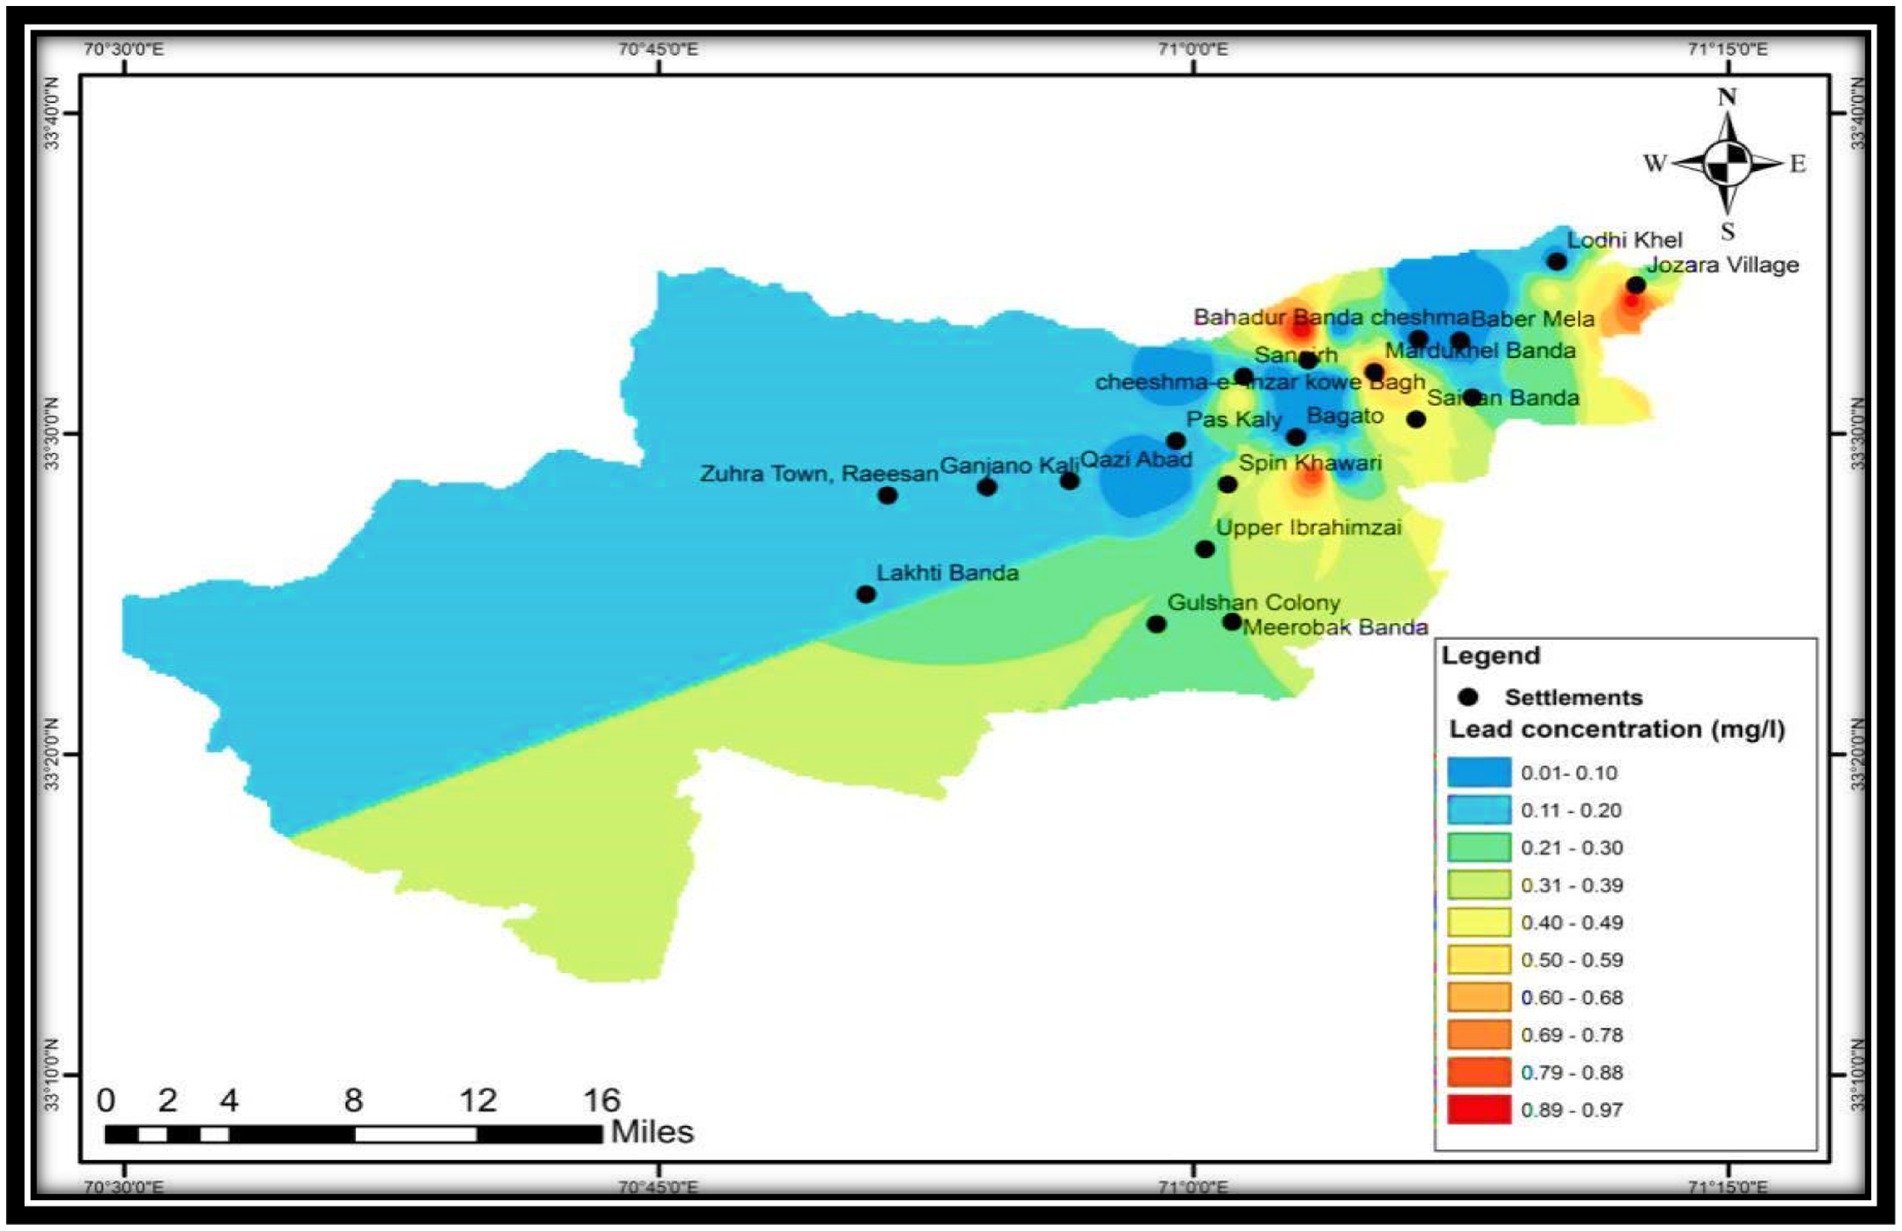
MAP 3. IDW prediction model representing lead measurements in the drinking water samples of district Hangu. The blue color represents a low Pb level. The yellow color in the map represents a moderate concentration; the red color vulnerability risk represents the area with the highest concentration of Pb.
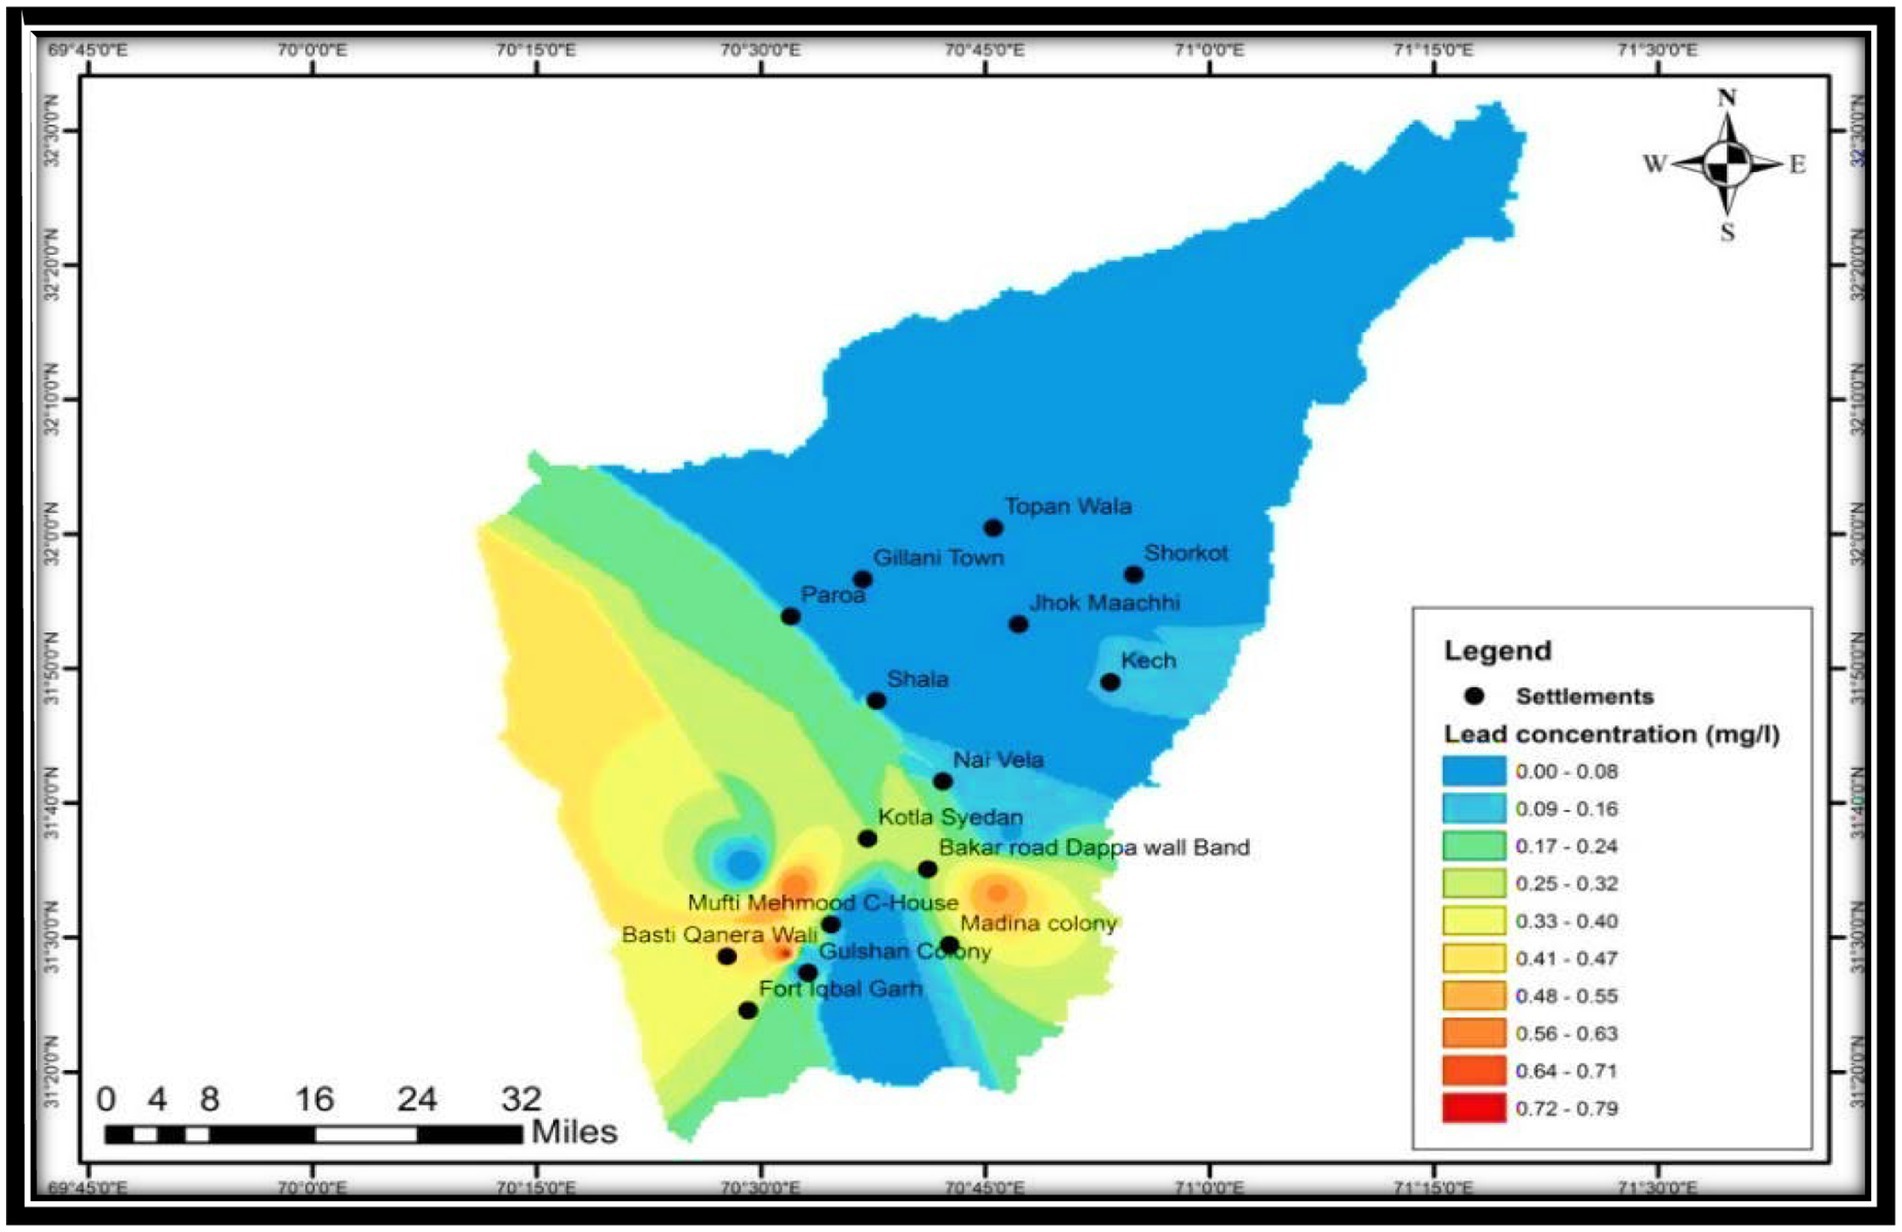
MAP 4. Predication model represents lead measurements in drinking water samples from district D.I. Khan. The blue color represents a low Pb level. The yellow color in the map represents a moderate concentration; the red color vulnerability risk represents the area with the highest concentration of Pb.
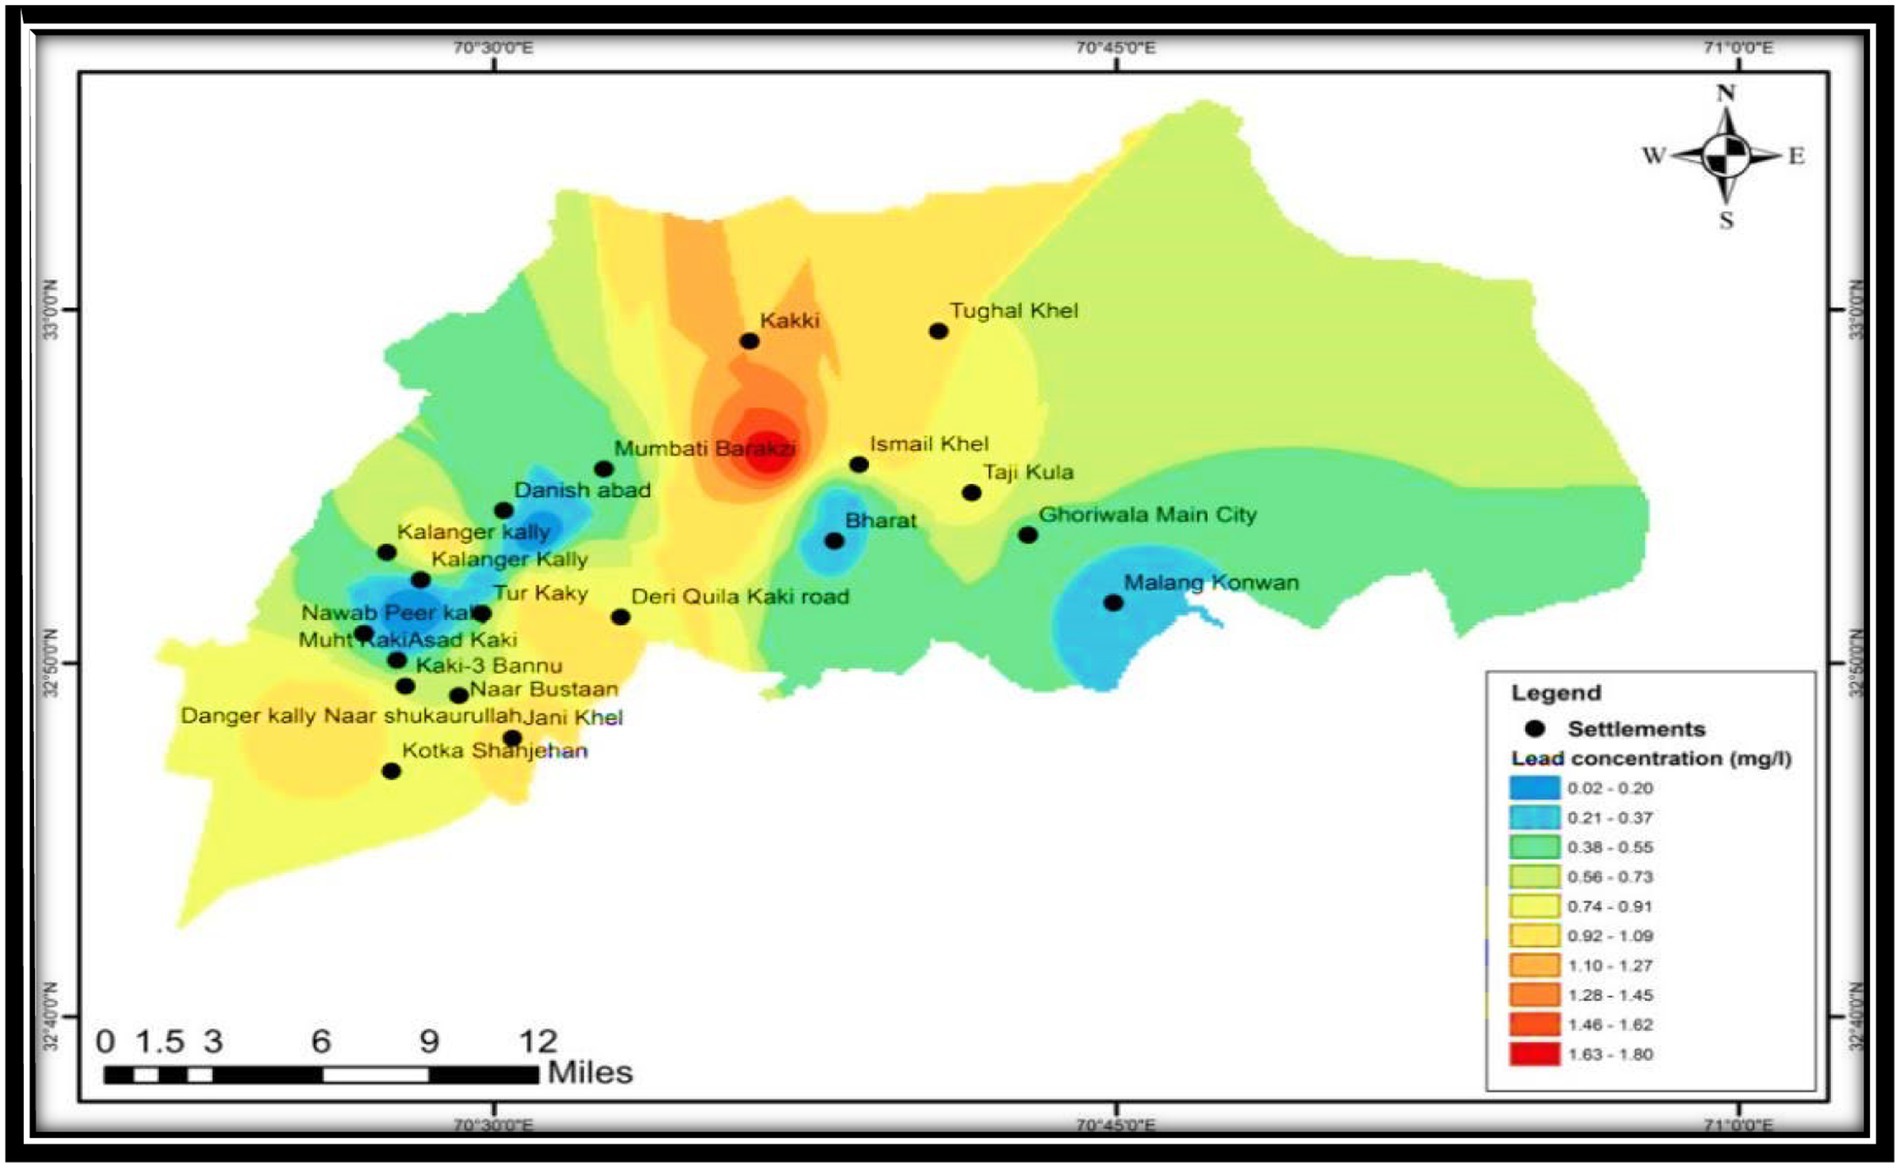
MAP 5. IDW prediction model representing lead measurements in the drinking water samples of district Bannu. The blue color represents a low Pb level. The yellow color in the map represents a moderate concentration; the red color vulnerability risk represents the area with the highest concentration of Pb.
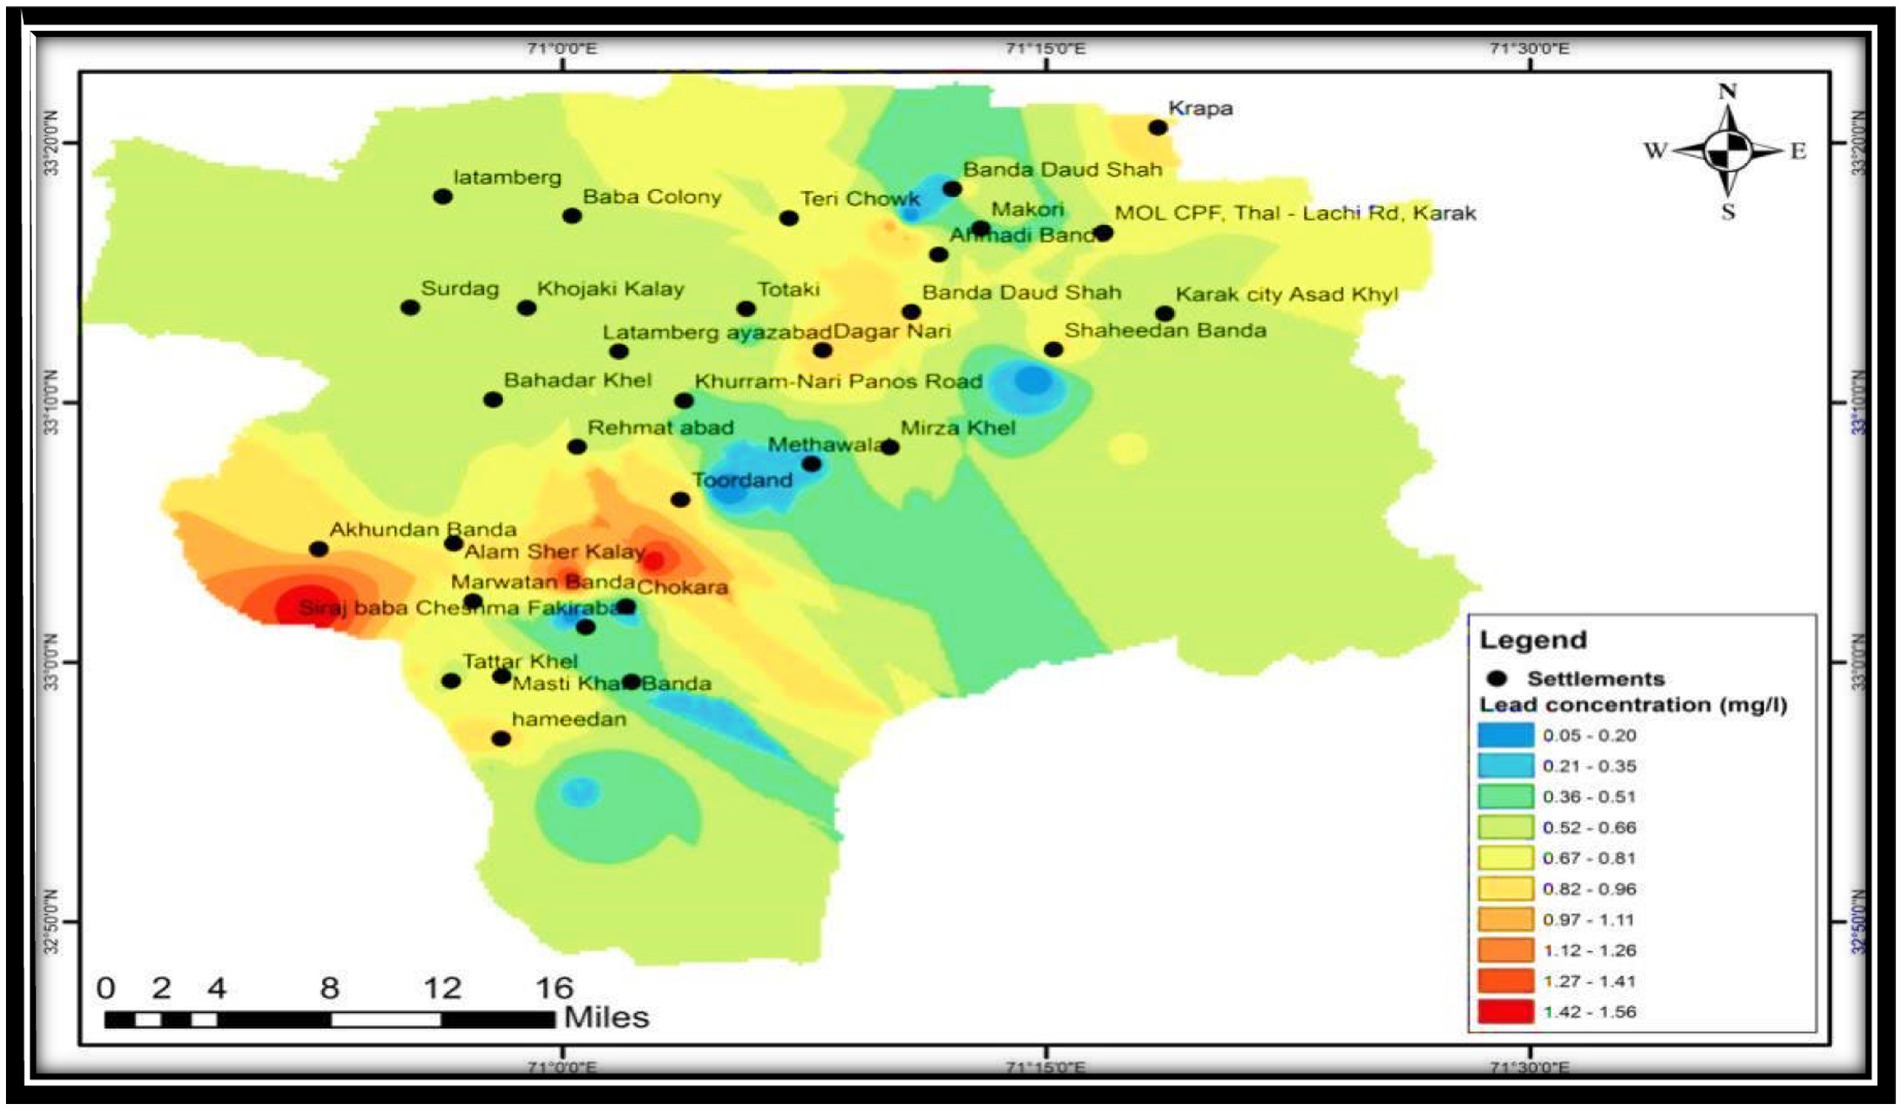
MAP 6. IDW prediction model representing lead measurements in drinking water samples from district Karak. The blue color represents a low Pb level. The yellow color in the map represents a moderate concentration; the red color vulnerability risk represents the area with the highest concentration of Pb.
4 Discussion
The findings of this study reveal substantial variations in lead (Pb) contamination in drinking water across the five studied districts: Kohat, Hangu, Dera Ismail Khan (D.I. Khan), Bannu, and Karak. Notably, Bannu recorded the highest mean Pb concentration (0.7203 mg/L) with a peak value of 1.809 mg/L, while Karak followed closely with a mean Pb concentration of 0.693 mg/L and a maximum of 1.572 mg/L. The presence of such elevated Pb levels is alarming, as chronic exposure is associated with severe neurotoxic and developmental health effects, particularly in children (Needleman, 2004; Lanphear et al., 2005). Risk characterization using hazard quotient (HQ) calculations further substantiated the potential health threats. Bannu and Karak exhibited critical risk levels, with HQ values surpassing 100 for children, indicating extreme neurotoxic and systemic health risks (United States Environmental Protection Agency (USEPA), 2000). Kohat and Hangu were categorized as high-risk regions, with HQ values for children exceeding 10, while D.I. Khan presented a moderate risk profile. These findings underscore the urgency of implementing effective water purification measures and regulatory interventions to mitigate Pb exposure in these regions (Sharma and Rehman, 2020). Geostatistical analysis using the Inverse Distance Weighting (IDW) interpolation method identified distinct Pb contamination hotspots across all five districts. In Kohat, highly affected locations included Gas-filled Sheikhan, Bezadi Cheker Koti, and Jangel Khel Buyanya Cheshma. Hangu’s contamination hotspots were concentrated around Jozara Water, Railway Road Hangu, and Gulshan Colony Cheshma. Similarly, elevated Pb levels in D.I. Khan were observed in Mufti Mehmood Circuit House, Madina Colony, and Gilani Town, while hotspot locations in Bannu included Kalanger, Tur Kaki, and Bharat. In Karak, critical contamination was recorded in areas such as Tehsil Circuit House, Surdag, Rehmat Abad, and Takht-e-Nasrati. The spatial distribution trends suggest that contamination sources are likely linked to local industrial activities, mining operations, and inadequate waste management practices (Nriagu, 1996; Xiao et al., 2019).
The IDW modeling results support previous research indicating that Pb contamination is often influenced by topography, industrial proximity, and natural geochemical processes (Li and Heap, 2014). Notably, areas at higher altitudes and near industrial zones exhibited relatively higher Pb concentrations, highlighting the need for targeted mitigation strategies. Studies have shown that such contamination often arises from anthropogenic sources, including industrial discharge, corrosion of lead-based plumbing materials, and atmospheric deposition from vehicular emissions (Goyer, 1996). Given that Pb has no known biological function and is toxic even at low concentrations, the long-term implications of exposure necessitate urgent intervention. Overall, the study underscores the critical need for regulatory oversight and remedial action in these high-risk regions (Xiao et al., 2019).
5 Conclusion
The findings of this study emphasize the critical issue of lead (Pb) contamination in drinking water across the five districts Kohat, Hangu, Dera Ismail Khan (D.I. Khan), Bannu, and Karak. The analysis revealed that Pb concentrations in all districts exceeded the WHO permissible exposure limit (0.01 mg/L), posing significant health risks. Among the areas studied, Bannu and Karak exhibited the highest contamination levels, with Pb concentrations reaching 1.809 mg/L and 1.572 mg/L, respectively. The hazard quotient (HQ) values for children in these districts exceeded 100, indicating extreme neurotoxic risks. The geostatistical analysis using the IDW modeling method effectively identified contamination hotspots, highlighting specific locations with elevated Pb levels. The high Pb concentrations observed suggest potential sources such as industrial emissions, mining activities, aging water supply infrastructure, and natural geochemical processes. The results emphasize the need for immediate intervention, including the implementation of advanced water treatment systems, strict regulatory measures to control Pb pollution, and public awareness campaigns on the dangers of lead exposure. Furthermore, continuous monitoring and predictive modeling using geostatistical techniques can aid in assessing long-term trends and ensuring sustainable water quality management. In conclusion, this study highlights the urgency of addressing Pb contamination in drinking water, particularly in high-risk areas like Bannu and Karak. The integration of geostatistical analysis provides a valuable approach for identifying contamination trends and guiding targeted mitigation strategies. Future research should focus on source apportionment studies and the development of cost-effective remediation technologies to ensure safe drinking water for affected populations.
6 Recommendation
To mitigate lead contamination in drinking water, immediate and long-term measures are essential. Short-term actions should include public awareness campaigns, provision of alternative water sources, installation of filtration systems, and regular water quality monitoring. In the long run, strict industrial regulations, infrastructure improvements, groundwater remediation, and integrated water resource management should be implemented. Government policies must enforce compliance, while community-based monitoring can enhance local engagement. Advanced research, geostatistical modeling, and epidemiological studies should be conducted to assess health risks and improve predictive analysis. International collaboration and funding from global organizations can further support sustainable solutions to ensure safe drinking water in affected regions.
Data availability statement
The original contributions presented in the study are included in the article/supplementary material, further inquiries can be directed to the corresponding authors.
Author contributions
HS: Investigation, Methodology, Conceptualization, Resources, Supervision, Formal analysis, Software, Data curation, Writing – review & editing, Writing – original draft. FA: Data curation, Validation, Project administration, Funding acquisition, Writing – review & editing. MS: Conceptualization, Resources, Supervision, Formal analysis, Software, Data curation, Writing – original draft, Writing – review & editing. FAA: Funding acquisition, Writing – review & editing. LA: Data curation, Validation, Writing – review & editing.
Funding
The author(s) declare that no financial support was received for the research and/or publication of this article.
Acknowledgments
The authors extend their appreciation to Abdullah Alrushaid Chair for Earth Science Remote Sensing Research at King Saud University, for funding.
Conflict of interest
The authors declare that the research was conducted in the absence of any commercial or financial relationships that could be construed as a potential conflict of interest.
Generative AI statement
The authors declare that no Gen AI was used in the creation of this manuscript.
Publisher’s note
All claims expressed in this article are solely those of the authors and do not necessarily represent those of their affiliated organizations, or those of the publisher, the editors and the reviewers. Any product that may be evaluated in this article, or claim that may be made by its manufacturer, is not guaranteed or endorsed by the publisher.
References
Ahmed, H. E. H., Mohammed, A. M. A., and Soylak, M. (2023). A magnetic solid phase extraction procedure for Pb (II) at trace levels on magnetic Luffa@ TiO2 in food and water samples. Food Chem. 428:136794. doi: 10.1016/j.foodchem.2023.136794
Alshehri, F., Almadani, S., El-Sorogy, A. S., Alwaqdani, E., Alfaifi, H. J., Alharbi, T., et al. (2021). Influence of seawater intrusion and heavy metals contamination on groundwater quality, Red Sea coast, Saudi Arabia. Marine Pollution Bulletin, 165:112094.
American Public Health Association (APHA). (2017). Standard methods for the examination of water and wastewater. Washington, D.C.: American Public Health Association (APHA).
Bellinger, D. C. (2013). Prenatal exposures to environmental chemicals and children's neurodevelopment: an update. Environ. Res. 126, 163–169.
Box, W., Järvelä, J., and Västilä, K. (2021). Flow resistance of floodplain vegetation mixtures for modelling river flows. J. Hydrol. 601:126593. doi: 10.1016/j.jhydrol.2021.126593
Chen, Y., Si, J., Wan, X., Wang, Y., Chen, A., and Jin, M. (2024). Sub-ppb detection limit of Cr, Pb, and cu in water by surface-enhanced LIBS with femtosecond laser. Spectrochim. Acta B At. Spectrosc. 213:106880. doi: 10.1016/j.sab.2024.106880
Ding, Q., Li, C., Wang, H., Xu, C., and Kuang, H. (2021). Electrochemical detection of heavy metal ions in water. Chem. Commun. 57, 7215–7231. doi: 10.1039/D1CC00983D
Environmental Protection Agency (EPA) (2021). National Primary Drinking Water Regulations. Washington, D.C.: U.S. Environmental Protection Agency.
Errico, A., Lama, G. F. C., Francalanci, S., Chirico, G. B., Solari, L., and Preti, F. (2019). Validation of global flow resistance models in two experimental drainage channels covered by Phragmites australis (common reed). In Proceedings of the 38th IAHR World Congress-Water Connecting the World, Ecol. Eng. Elsevier 133, 39–52.
Fang, Y., Yu, K., Ren, G., Wang, C., Zhou, Q., Che, G., et al. (2024). Fluorescence detection and effective adsorption of trace pb (II) based on nanofibrous metal-organic gel. Chem. Synth. 331, 1411–1413. doi: 10.1001/jama.2024.2103
Flores-Rojas, A. I., Medellín-Castillo, N. A., Cisneros-Ontiveros, H. G., Acosta-Doporto, G. A., Cruz-Briano, S. A., Leyva-Ramos, R., et al. (2024). Detection and mapping of the seasonal distribution of water hyacinth (Eichhornia crassipes) and valorization as a biosorbent of Pb (II) in water. Environ. Sci. Pollut. Res. 31, 40190–40207. doi: 10.1007/s11356-023-29780-3
Ghasemi, A., and Zahediasl, S. (2012). Normality tests for statistical analysis: a guide for non-statisticians. Int. J. Endocrinol. Metab. 10, 486–489. doi: 10.5812/ijem.3505
Goovaerts, P. (2001). Geostatistical approaches for incorporating elevation into the spatial interpolation of rainfall. J. Hydrol. Springer. 228, 113–129. Available at: https://link.springer.com/chapter/10.1007/978-94-010-0712-4_7
Goyer, R. A. (1996). “Toxic effects of metals: Lead” in Casarett and Doull’s toxicology: The basic science of poisons (McGraw-Hill), 691–736.
Griffith, D. A. (2005). Effective geographic sample size in the presence of spatial autocorrelation. Ann. Assoc. Am. Geogr. 95, 740–760. doi: 10.1111/j.1467-8306.2005.00484.x
Hasan, M. M., Salman, M. S., Hasan, M. N., Rehan, A. I., Awual, M. E., Rasee, A. I., et al. (2023). Facial conjugate adsorbent for sustainable Pb (II) ion monitoring and removal from contaminated water. Colloids Surf. A Physicochem. Eng. Asp. 673:131794. doi: 10.1016/j.colsurfa.2023.131794
Hasan, M., Ahsan, M., Shahid, M., Iqbal, S., Hussain, Z., Kumar, V., et al. (2023). Spatial distribution and health risk assessment of heavy metals in drinking water: a case study. Environ. Sci. Pollut. Res. 30, 6789–6805. doi: 10.1007/s11041-023-00515-5
Hengl, T., Heuvelink, G. B., and Stein, A. (2009). A generic framework for spatial prediction of soil variables based on regression-kriging. Geoderma 149, 169–177. doi: 10.1016/j.jhydrol.2009.07.007
Jjagwe, J., Olupot, P. W., Kulabako, R., and Carrara, S. (2024). Electrochemical sensors modified with iron oxide nanoparticles/nanocomposites for voltammetric detection of Pb (II) in water: a review. Heliyon 10:e29743. doi: 10.1016/j.heliyon.2024.e29743
Khan, S., Shahnaz, M., Jehan, N., Rehman, S., Shah, M. T., and Din, I. (2013). Drinking water quality and human health risk in Charsadda district, Pakistan. J. Clean. Prod. 60, 93–101. doi: 10.1016/j.jclepro.2012.02.016
Lama, G. F. C., Errico, A., Francalanci, S., Solari, L., Preti, F., and Chirico, G. B. (2019). Comparative analysis of modeled and measured vegetative Chézy’s flow resistance coefficients in a drainage channel vegetated by dormant riparian reed. Proceedings of the International IEEE Workshop on Metrology for Agriculture and Forestry, Portici, Italy, 180–184.
Lanphear, B. P., Hornung, R., Khoury, J., Yolton, K., Baghurst, P., Bellinger, D. C., et al. Low-level environmental lead exposure and children’s intellectual function: an international pooled analysis. Environ. Health Perspect. 113, 894–899. doi: 10.1289/ehp.7688
Li, J., and Heap, A. D. (2014). Spatial interpolation methods applied in the environmental sciences: a review. Environ. Model Softw. 53, 173–189. doi: 10.1016/j.envsoft.2013.12.008
Li, D., Liu, Y., Li, Y., Li, S., and Tang, Y. (2024). Sensitive and point-of-care detection of lead ion in river water mediated by terminal deoxynucleotidyl transferase. Sensors Actuators B Chem. 401:134909. doi: 10.1016/j.snb.2023.134909
Mohan, B., Kadiyan, R., Singh, K., Singh, G., Kumar, K., Sharma, H. K., et al. (2023). MOFs composite materials for Pb2+ ions detection in water: recent trends & advances. Microchem. J. 190:108585. doi: 10.1016/j.microc.2023.108585
Mohanadas, D., Rohani, R., Sulaiman, Y., Bakar, S. A., Mahmoudi, E., and Zhang, L. C. (2023). Heavy metal detection in water using MXene and its composites: a review. Mater. Today Sustain. 22:100411. doi: 10.1016/j.mtsust.2023.100411
Muneer, M., Khan, M. A., Shinwari, F. U., Ahmed, I., Siyar, S. M., Alshehri, F., et al. (2025). Assessment of groundwater intrinsic vulnerability using GIS-based DRASTIC method in district Karak, Khyber Pakhtunkhwa, Pakistan. Frontiers in Water, 7, 1540703.
Navas-Acien, A., Guallar, E., Silbergeld, E. K., and Rothenberg, S. J. (2007). Lead exposure and cardiovascular disease: a systematic review. Environ. Health Perspect. 115, 472–482. doi: 10.1289/ehp.9785
Needleman, H. L. (2004). Lead poisoning. Annu. Rev. Med. 55, 209–222. doi: 10.1146/annurev.med.55.091902.103653
Nriagu, J. O. (1996). A history of global metal pollution. Science 272, 223–224. doi: 10.1126/science.272.5259.223
Patrick, L. (2006). Lead toxicity, a review of the literature. Part I: exposure, evaluation, and treatment. Altern. Med. Rev. 11, 2–22.
Razali, N. M., and Wah, Y. B. (2011). Power comparisons of Shapiro-Wilk, Kolmogorov-Smirnov, Lilliefors, and Anderson-Darling tests. J. Stat. Model. Anal. 2, 21–33.
Reimann, C., and de Caritat, P. (1998). Chemical elements in the environment: Factsheets for the geochemist and environmental scientist : Springer Science & Business Media.
Roy, S., and Edwards, M. (2019). Preventing another lead (Pb) in drinking water crisis: lessons from the Washington DC and Flint MI contamination events. Curr. Opin. Environ. Sci. Health 7, 34–44. doi: 10.1016/j.coesh.2018.10.002
Salman, M. S., Znad, H., Hasan, M. N., and Hasan, M. M. (2021). Optimization of innovative composite sensor for Pb (II) detection and capturing from water samples. Microchem. J. 160:105765. doi: 10.1016/j.microc.2020.105765
Shah, M. T., Ahmed, M., Baig, M., Iqbal, M., Khan, H., Yousaf, A., et al. (2020). Assessment of heavy metal contamination in drinking water. Environ. Pollut. 258:113653.
Sharma, P., and Rehman, M. T. (2020). A review on sources, health effects, and control measures of lead exposure. Environ. Sci. Pollut. Res. 27, 22279–22302.
Triantafyllidou, S., and Edwards, M. (2012). Lead (Pb) in tap water and in blood: implications for lead exposure in the United States. Crit. Rev. Environ. Sci. Technol. 42, 1297–1352. doi: 10.1080/10643389.2011.556556
United States Environmental Protection Agency (USEPA). (2000). Risk assessment guidance for superfund. Volume I: human health evaluation manual. Washington, D.C.: United States Environmental Protection Agency (USEPA). EPA/540/1-89/002.
United States Environmental Protection Agency (USEPA). (2020). Lead and copper rule. Washington, D.C.: United States Environmental Protection Agency (USEPA).
(WHO) (2022b). Lead in drinking water: health implications and mitigation strategies. Geneva, Switzerland: World Health Organization (WHO).
Wu, D., Hu, Y., Cheng, H., and Ye, X. (2023). Detection techniques for lead ions in water: a review. Molecules 28:3601. doi: 10.3390/molecules28083601
Xia, L., Luo, F., Niu, X., Tang, Y., and Wu, Y. (2024). Facile colorimetric sensor using oxidase-like activity of octahedral Ag2O particles for highly selective detection of Pb (II) in water. Sci. Total Environ. 915:170025. doi: 10.1016/j.scitotenv.2024.170025
Xiao, J., Wang, L., Deng, L., and Jin, Z. (2019). Characteristics, sources, and health risk assessment of trace elements in groundwater in the North China plain. Sci. Total Environ. 666, 1122–1130.
Keywords: lead contamination, vulnerable population, risk, prediction, good health and wellbeing, ANOVA, WHO, lead (Pb)
Citation: Shakoor H, Alshehri F, Shahab M, Abanumay FA and Ali L (2025) Vulnerability and risk assessment of lead (Pb) concentrations in drinking water via statistical and geostatistical analyses. Front. Water. 7:1548110. doi: 10.3389/frwa.2025.1548110
Edited by:
Boris Faybishenko, Berkeley Lab (DOE), United StatesReviewed by:
Giuseppe Francesco Cesare Lama, University of Naples Federico II, ItalyGabriel Lobo, University of California, Berkeley, United States
Copyright © 2025 Shakoor, Alshehri, Shahab, Abanumay and Ali. This is an open-access article distributed under the terms of the Creative Commons Attribution License (CC BY). The use, distribution or reproduction in other forums is permitted, provided the original author(s) and the copyright owner(s) are credited and that the original publication in this journal is cited, in accordance with accepted academic practice. No use, distribution or reproduction is permitted which does not comply with these terms.
*Correspondence: Huma Shakoor, aHVtYXNoYWtvb3I4NUBnbWFpbC5jb20=; Muhammad Shahab, c2hhaGFiZ2VvMDdAZ21haWwuY29t