 Daisuke Komori
 Yuika Oyatsu4
 Muthiah Sadidah
- 1Green Goal Initiative, Tohoku University, Sendai, Japan
- 2Graduate School of Environmental Studies, Tohoku University, Sendai, Japan
- 3International Research Institute of Disaster Science, Tohoku University, Sendai, Japan
- 4Department of Civil Engineering and Architecture, Graduate School of Engineering, Tohoku University, Sendai, Japan
In conventional socio-hydrological research, no studies have developed a system dynamics model to capture the dynamics of pluvial floods alone, and the target areas have been large-scale, such as cities and river basins. Thus, the target social community is not single entity but rather multiple, encompassing various communities, including both disaster-stricken and non-disaster-stricken areas. In this study, we developed a system dynamics model to capture the dynamics of pluvial floods alone. We identified frequent pluvial flooding areas using flooding area records since 1993 for 25 years for only targeting disaster-stricken areas on a scale of 400–1,000 m2, and applied the developed model to these areas and verified that social vulnerability (levee effect and adaptation effect) could be explained by residents' flood memory estimated by the model. The adaptation effect, a phenomenon in which the continued memory of flooding enhances a society's ability to cope with flooding and reduces social vulnerability, occurred in both urban areas with public drainage systems and rural areas without public drainage systems. On the other hand, the levee effect, a phenomenon in which the frequency of flooding within the floodplain decreases by installing flood control facilities, the development of floodplain areas is promoted, increasing social vulnerability, and flood control facilities are enhanced to improve further flood control safety, which is a typical phenomenon involving the interaction between human activities and flooding, occurred only in rural areas. It was considered that residents' awareness of the increased flood risk in the area due to changes in land use from rice paddy fields to residential areas was lacking, as they had no prior experience with severe floods. In this study, by simplifying the analysis of disaster-stricken areas (frequent pluvial flooding areas), it was possible to capture the interaction between the simplified social community and flooding more directly, allowing the adaptation and levee effects to be more clearly captured. In future socio-hydrology research, it is essential to consider the scale of the analysis target.
1 Introduction
Pluvial flooding has had a strong and negative impact on many cities around the world for much of human history, particularly in recent decades (Hammond et al., 2015; Lowe et al., 2017; Wang et al., 2018). More than half of the global population resides in urbanized areas, and the frequency and intensity of hydro-meteorological extremes are increasing (Hirabayashi et al., 2021). Pluvial flooding will likely cause more significant losses in the coming decades. For example, in Japan, the number of human casualties caused by flooding has been decreasing over the long term due to the progress of flood control facilities and policies; however, in recent years, there has been an increase in the number of floods caused by urbanization and changes in land cover, as well as an increase in the number of torrential rains caused by climate change. There are concerns that the amount of flood damage caused by pluvial flooding will increase. In Wakayama City, a front brought down 122.5 mm of rain in 1 h on 11 November 2009, the highest amount ever recorded, causing one fatality, 612 buildings with water above the floor, and 1,768 buildings below the floor. The number of flooded houses due to the July 2018 heavy rain was approximately 28,000 nationwide, but about 15,000 were attributed to pluvial flooding in 88 cities, towns, and villages across 19 prefectures. Furthermore, the number of houses damaged by the 2019 East Japan Typhoon in October 2019 was 94,000, of which approximately 30,000 were destroyed by pluvial flooding. Thus, the scale of damage caused by pluvial flooding has increased nationwide in recent years. The frequency of torrential rainstorms has been increasing in recent years (IPCC-Intergovernmental Panel on Climate Change, 2023), and it is expected that the damage caused by pluvial flooding will become more severe and have a global scale.
In general, countermeasures for pluvial flooding include flood simulation using numerical models to estimate the flooded area, understanding the extent and duration of flooding in the event of an inundation, and alerting residents through maps and visual aids. In other words, this method involves identifying the current areas at risk and then taking measures to improve them. Since this method is the basic approach to taking measures, research to improve the model's accuracy is crucial for taking measures against pluvial flooding. However, flood simulations carried out under limited conditions at a certain point do not consider parameters such as urbanization in the target area. Therefore, while flood simulation may identify flood-prone areas in a city at a given time, it is challenging to comprehend the chronological transition process of vulnerable points as the city evolves over time. Based on the above, it is essential to understand the actual situation and changes in urban flooding as the city grows by analyzing chronological flood data from the past to the present.
Djamres et al. (2021) used flooding area records over seven years from 2008 to 2015 to identify frequent pluvial flooding and analyzed the topographical characteristics of Tangerang, Indonesia, using Principal Component Analysis (PCA). The results showed that 29% of pluvial flooding areas have low topographic similarity due to human activities, such as changes in the direction of surface flow caused by changes in the gradient of upstream conditions resulting from changes in land use and the capture of floodwater by dominant structures, including buildings and roads. Komori et al. (2022) used the government's 20 years of flooding area records to define “frequent pluvial flooding areas” where pluvial flooding damage frequently occurs. The topographical characteristics of “pluvial flooding areas” in Osaka and Nagoya were analyzed using PCA. The results showed that topographical characteristics alone could not explain pluvial flooding in Osaka City. By statistically analyzing the newly defined frequent pluvial flooding areas, they have quantitatively shown that the factors causing pluvial flooding have shifted from topographical characteristics to anthropological characteristics.
As described above, in addition to physical factors such as rainfall and topography, human-related factors can also contribute to water-related disasters, including pluvial flooding. In recent years, several methods have been proposed for evaluating social vulnerability to natural disasters, in addition to physical factors. Cutter et al. (1996) used factor analysis to construct a Social Vulnerability Index. Karunarathne and Gunhak (2020) also developed a Multi-Faceted Composite Social Vulnerability Index, which determines the components and weighting of vulnerability based on expert opinions. However, human society and water systems are not just related to each other but also interact with each other. A hydrological approach alone cannot understand this interaction between human society and water systems (Baldassarre et al., 2021). For this reason, the field of socio-hydrology, which integrates hydrological and social science perspectives, was proposed by Sivapalan et al. (2012).
As one of the studies in socio-hydrology, Baldassarre et al. (2013, 2015) applied a system dynamics model (SH model) that mathematically formulates the interaction between flood damage, flood memories, population, and flood control for a dynamic analysis of the interaction between human society and water system. Specifically, in two hypothetical societies—a “green society” with no embankments and a “technological society” with embankments—the memory of the green society is sustained as it is recovered with each flood, while in the technological society, the frequency of flooding is reduced by the embankments. Hence, the memory, which initially increases with each flood, temporarily decreases and almost disappears by the next flood, causing more severe damage. These are known as the “adaptation effect” and “levee effect” in flood management. The former is a phenomenon in which the continued memory of flooding enhances society's ability to cope with flooding, and social vulnerability is reduced (Baldassarre et al., 2019). At the same time, the latter is a phenomenon in which the frequency of flooding within the floodplain decreases by installing levees, the development of floodplain areas is promoted, increasing social vulnerability, and embankments are raised to improve further flood control safety, which is a typical phenomenon involving the interaction between human activities and flooding (White, 1945). Although this is a numerical experiment in a virtual society, it captures features generally consistent with common sense and understanding.
Research on the SH model for river flooding is being applied to various regions. Baldassarre et al. (2017) clarified the interaction between human society and the water system over the past 150 years in Rome, Italy. Ciullo et al. (2017) applied the SH model to Italy as a target area for a technological society that takes structural measures to prevent flooding and to Bangladesh as a target area for a green society that takes only non-structural measures, comparing the resilience of the two societies. Shibata et al. (2022) demonstrated the applicability of the SH model in Japan, specifically in the Nagano Prefecture Naganuma district, a region characterized by a technological society. In addition, Perera and Nakamura (Perera and Nakamura, 2022) improved the SH model to enable the integrated assessment of river and pluvial flooding in areas of Sri Lanka where these two types of flooding occur in combination. However, the SH model formula developed by Perera and Nakamura (Perera and Nakamura, 2022) is essentially a model based on river flooding, as it only incorporates the formula for pluvial flooding based on rainfall into the formula for river flooding. In other words, no studies currently apply the SH model to pluvial flooding alone. Furthermore, in conventional SH model research, the target area was on a large scale, such as a city or river basin. For example, the target area encompasses both disaster-stricken and non-disaster-stricken areas, resulting in a mixed social community that needs to be analyzed. Therefore, it is undeniable that much more research is still needed to capture the interaction between complex social communities and water systems.
Therefore, in this study, we developed an SH model that targets pluvial flooding alone in Wakayama City, where concerns have been raised about the increasing flood damage caused by pluvial flooding. In particular, to avoid the analysis of the interaction between the complex social communities and water systems, which is a mixture of both disaster-stricken areas and non-disaster-stricken areas such as previous studies, we identified the analysis target as “frequent pluvial flooding areas” (only disaster-stricken areas) based on Komori et al. (2022) and developed and applied an SH model that targets only pluvial flooding. The aim to analyze the interaction between simplified social communities and pluvial flooding by limiting the target area to “frequent pluvial flooding areas” is to verify the developed model by comparing the residents' flood memory estimated by the model and changes over time in social vulnerability, such as the levee effect and adaptation effect. Here, the levee effect in the case of pluvial flooding was considered in terms of urban flooding management through rainwater drainage facilities, not a levee for river flooding management.
2 Study area and material and methods
2.1 Study area
This study focused on Wakayama City, which has relatively high pluvial flooding damage. The selection criteria were based on the following items.
✓ The damage caused by pluvial flooding in the flood statistics must be substantial. This is because it is expected that in cities where the amount of damage caused by pluvial flooding is high, it will be possible to obtain many flood area records. As the number of cases of pluvial flooding is not recorded in the flood statistics, the amount of damage caused by pluvial flooding was used as a substitute value.
✓ The capital expenditure on the city's drainage project must be significant. This is because we thought that the more investment in a city's drainage projects, the more likely it is that pluvial flooding has occurred in the past.
Wakayama City ranked 13th in Japan regarding the amount of damage caused by pluvial flooding (1.98 billion yen on average from 2006 to 2012) and 5th in terms of the cost of drainage projects (114 million yen/m2 in 2016) (Ministry of Land, Infrastructure, Transport and Tourism, n.d.d).
2.2 Flooding area records
The frequent pluvial flooding areas were identified using the flooding area records based on Komori et al. (2022). The flooding area record is a map describing the type, timing, extent of flooding, and so on. It is created by municipalities as part of the flood damage statistics survey each time flooding occurs. This study identified the frequent pluvial flooding areas from 1993 to 2017.
2.3 Rainfall data
In this study, radar AMeDAS (Automated Meteorological Data Acquisition System) reanalysis rainfall data was used as the rainfall data. Radar AMeDAS analysis rainfall data is created by combining meteorological radar and AMeDAS observation rainfall. The mesh size varies depending on the observation period: from 1988 to March 2001, it was 5 km square; from April 2001 to December 2005, it was 2.5 km square; and from 2006 onwards, it was 1 km square. In addition, values are recorded every hour until May 2003 and every 30 min from June 2003 onwards.
2.4 National census: small area aggregation
This study used census data for small areas (towns and streets) from e-Stat, the government statistics portal site (e-Stat, n.d.a). The census is conducted every 5 years based on the Statistics Act to obtain basic data for various administrative measures and other purposes and to understand the realities of the people and households in Japan. The census of towns and streets was conducted in 1995 and includes data on population (total, male, female, foreign nationals) and the number of households.
2.5 Drainage system data
The drainage system coverage data was calculated based on the map of the areas where the public rainfall drainage system has been used in Wakayama City (Wakayama City, n.d.f). The map shows the type of rainfall drainage system (combined or separate) and the date when the system was used in each area. The data was copied onto a GIS, and each area's drainage system coverage rate was calculated.
2.6 Digital elevation model (DEM)
This study used the elevation data of the DEM of Fundamental Geospatial Data (Geographical Survey Institute, n.d.b). The Fundamental Geospatial Data is a database that the Basic Act established on the Advancement of Utilizing Geospatial Information, enacted in 2007, and for which development has been underway. Currently, the Geospatial Information Authority of Japan is playing a central role in its development. The developed Fundamental Geospatial Data is provided free of charge via the Internet. Domestic geospatial information is being developed with the exact location reference, making it possible to implement advanced uses such as superimposition smoothly.
This study used the 5 m mesh DEM provided by the Fundamental Geospatial Data in 2013. This digital elevation model uses 5 m × 5 m mesh, aerial laser surveying, and photogrammetry. Airborne laser surveys are mainly carried out in urban areas. They are created by interpolating the elevation values (ground data) of the measurement points that reach the ground surface in airborne laser surveys to create elevation values for the center points of the approximately 5 m mesh. The accuracy is within 0.3 m in elevation and 1.0 m in horizontal position. Photographic surveys are mainly carried out in urban areas and island areas. It is created by interpolating the elevation values of the center points of the approximately 5 m mesh from the elevation values measured by photogrammetry. The accuracy is within 0.7 m in elevation and 1.0 m in horizontal position. The target areas in this study were all areas created by aerial laser surveying.
2.7 Mesh data of land use classification
In this study, we used the mesh data of land use classification from the National Land Numerical Information (National Land Numerical Information, n.d.e) as the land use data. The National Land Numerical Information is a GIS database of basic information on the country, such as topography, land use, and public facilities. It was created to promote national land policies, such as the National Land Formation Plan and the National Land Use Plan. It is provided free of charge via the Internet by the Basic Act on the Advancement of Utilizing Geospatial Information.
The Land Use Subdivision Mesh is a database of land use in Japan, with each 100 m mesh containing information on each land use category. The land use categories include rice paddies, other agricultural land, forests, wastelands, building sites, arterial transport routes, lakes and marshes, and rivers. The data was created for eight fiscal years from 1976 to 2016. In 1976 and 1987, it was made using 1:25,000 topographic maps and 1:100 administrative data. From 1991 onwards, it was created using 1:25,000 topographic maps or electronic topographic maps and satellite images (Landsat, ALOS, SPOT, RapidEye, etc.). In this study, data from 1976, 1997 and 2014 were used.
2.8 SH model analysis
2.8.1 Development of the SH model for pluvial flooding
The SH model consists of the following equations: flood intensity F, flood protection level H, household density D, residents' flood memory M, flood damage L, and the increase in flood protection level after pluvial flooding R. The conventional SH model is designed for river flooding, so we have improved the equations for flood damage L and flood protection level H in the SH model to make it suitable for pluvial flooding. Flood damage was calculated using the precipitation in the target area rather than the high river water level. In addition, the flood protection level H of the SH model for pluvial flooding was calculated using the drainage system coverage rate in the area. The equations for the modified SH model are shown below Equations 1–6.
Flood intensity F:
where H_: flood protection level before flood (–), RF: rainfall per unit time (mm/h), αR: probability time rainfall (mm/h), RT: threshold value of rainfall that flood plains can store (mm/h), co: parameter related to rainfall and damage (mm/h).
Increase in flood protection level after flooding R:
where pd: parameter related to damage and the drainage system coverage rate.
Population density of the local community D, Flood protection level H, Residents' flood memory M:
where ρD: relative growth rate of the number of households (/year), αD: ratio of preparedness and awareness (–), μS: rate of residents' flood memory loss (/year), ∆(Ψ(t)): a function that becomes one during flooding and zero otherwise.
Flood damage L:
2.8.2 Selection of the study area
In this study, the study area was selected from the areas that had experienced multiple cases of pluvial flooding to analyze the dynamics of residents' memories in these areas. Therefore, we identified frequent pluvial flooding areas in Wakayama City using the method developed by Komori et al. (2022). Frequent pluvial flooding areas were defined as those that had experienced three or more pluvial flooding events in the 25 years from 1993 to 2017. As a result, 79 frequent pluvial flooding meshes on a 100 m scale were identified in Wakayama City. Subsequently, the adjacent frequent pluvial flooding meshes were integrated as one frequent pluvial flooding area, with 19 areas (Figure 1).
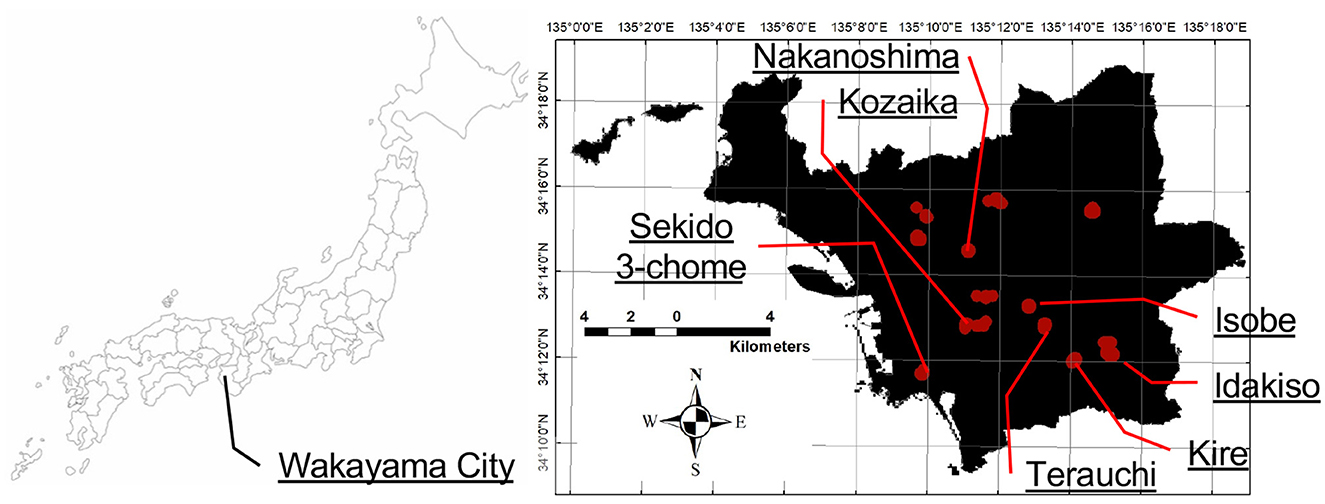
Figure 1. Distribution of frequent urban pluvial flooding areas and study areas in Wakayama city.
The flood protection level of the SH model, which was improved in the previous section, uses only the drainage system coverage rate. However, in addition to developing drainage systems, drainage channels and pump stations are also carried out to prevent pluvial flooding. In other words, it is possible that appropriate results cannot be calculated in areas where measures other than the development of drainage systems are being carried out. Therefore, areas where large-scale measures, such as the development of drainage channels, have been confirmed were excluded as study areas for the SH model. Seven areas with a high frequency of pluvial flooding were selected as study areas for applying the SH model.
The study areas for applying the SH model are shown in Figure 1. The study areas are divided into urban areas where public drainage systems have been built (Sekido 3-chome, Kozaika, Nakanoshima) and rural areas where they have not been built (Isobe, Terauchi, Kire, Idakiso). Hereafter, urban areas where public drainage systems have been built are referred to as Series 1, and rural areas where they have not been built are referred to as Series 2.
2.8.3 Initial conditions and input data
When applying the SH model, we assigned initial values to the model variables of flood protection level H and household density D. The flood protection level H was calculated using the drainage system coverage rate in the study area in 1992 (Chapter 2.4). The household density D was calculated by normalizing the household density in the study area in 1992, based on the national census. Table 1 shows the initial conditions for the flood protection level H, household density D and area for each study area.
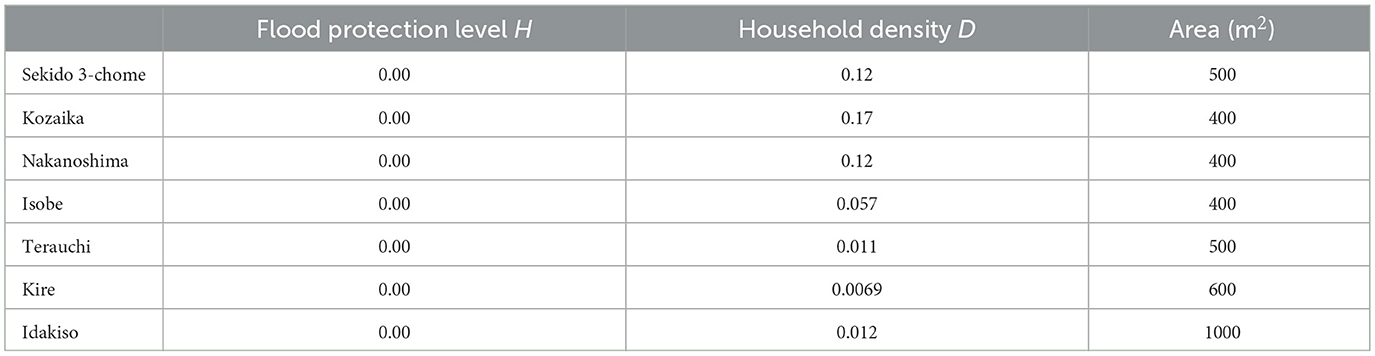
Table 1. Initial conditions for the flood protection level H, household density D, and area for each study area.
The input data used were the radar AMeDAS analysis rainfall data, which provided the annual maximum 1-h rainfall in the areas prone to internal flooding from 1993 to 2017. In Wakayama City, the pluvial flooding area record shows that no cases of pluvial flooding have occurred more than once a year. Therefore, the temporal scale of the SH model was set on an annual scale, and the maximum 1-h rainfall for the year was used. Only the years in which pluvial flooding was confirmed were included in this study, and rainfall data were used as input.
Generally, there is a time lag between flood damage and the implementation of countermeasures. In addition to flood damage, economic factors also play a role in the development of drainage systems. However, the flood protection level of the SH model is assumed to increase immediately after damage occurs and countermeasures are implemented. Therefore, there is a possibility that the flood protection level of the SH model does not accurately reflect the societal situation. Therefore, in this study, actual drainage system coverage rate data was input.
2.8.4 Parameter settings
The values of the parameters used are shown in Table 2.
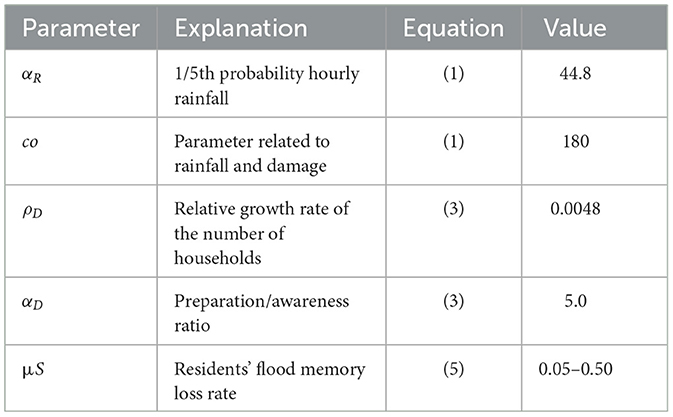
Table 2. The values of the model parameters.
In drainage coverage projects, the 1/5th to 1/10th probability time rainfall is used as the standard for drainage design. This study adopted a 1/5th probability hourly rainfall of 44.8 mm/h for Wakayama City as αR.
The relative growth rate of the number of households ρD was calculated by averaging the relative growth rates of the number of households in each year, which were calculated from the national census data over the period and were set to ρD = 0.0048.
The preparation/awareness ratio αD was set to 5.0, using the value from a previous study (Baldassarre et al., 2015). In previous studies, the residents' flood memory loss rate μS was given a range of values from 0.05 (Baldassarre et al., 2013) to 0.50 (Ciullo et al., 2017). Therefore, in this study, μS was set to a range of 0.05–0.50, and the dynamics of memory were analyzed. In addition, μS was calculated by dividing loge2 by the half-life of memory as described by Ridolfi et al. (2020). When the residents' flood memory loss rate μS is 0.05, 0.10, and 0.50, the half-life of memory is approximately 14, 7, and 1.4 years, respectively.
A sensitivity analysis was conducted on the parameter co, related to rainfall and damage, to obtain values that fit the actual observation data. co must be greater than the numerator in the exponential function in Equation 1 when calculating the flood intensity F. The numerator in the exponential function in Equation 1 is based on the amount of rainfall in the target area, so co needs to be a value greater than the amount of rainfall. The most considerable hourly rainfall in Wakayama Prefecture on record, as recorded by the Japan Meteorological Agency, was 145 mm/h at Shionomisaki (Japan Meteorological Agency, n.d.c), so we set co to be a value greater than 145, and in the sensitivity analysis, we gave co a range of 150 or more. We put the range for co to be 150–340 and calculated it in 10 increments. For accuracy verification, we used the RMSE (root mean square error) of the flood intensity F and the actual inundation area ratio for the years when flooding occurred. Since both the flood intensity F, which is calculated from the amount of rainfall and the flood protection level, and the actual inundation area ratio are indicators that show the degree of inundation, a linear relationship must be established. Therefore, the minimum RMSE of both indicators was adopted. The RMSE of both indicators was adopted. The results of the sensitivity analysis of co are shown in Table 3. The parameters of the SH model used in this study were set to values that commonly used in areas prone to urban flooding. Therefore, in this chapter, we used co = 180, which resulted in the lowest RMSE for the target area.
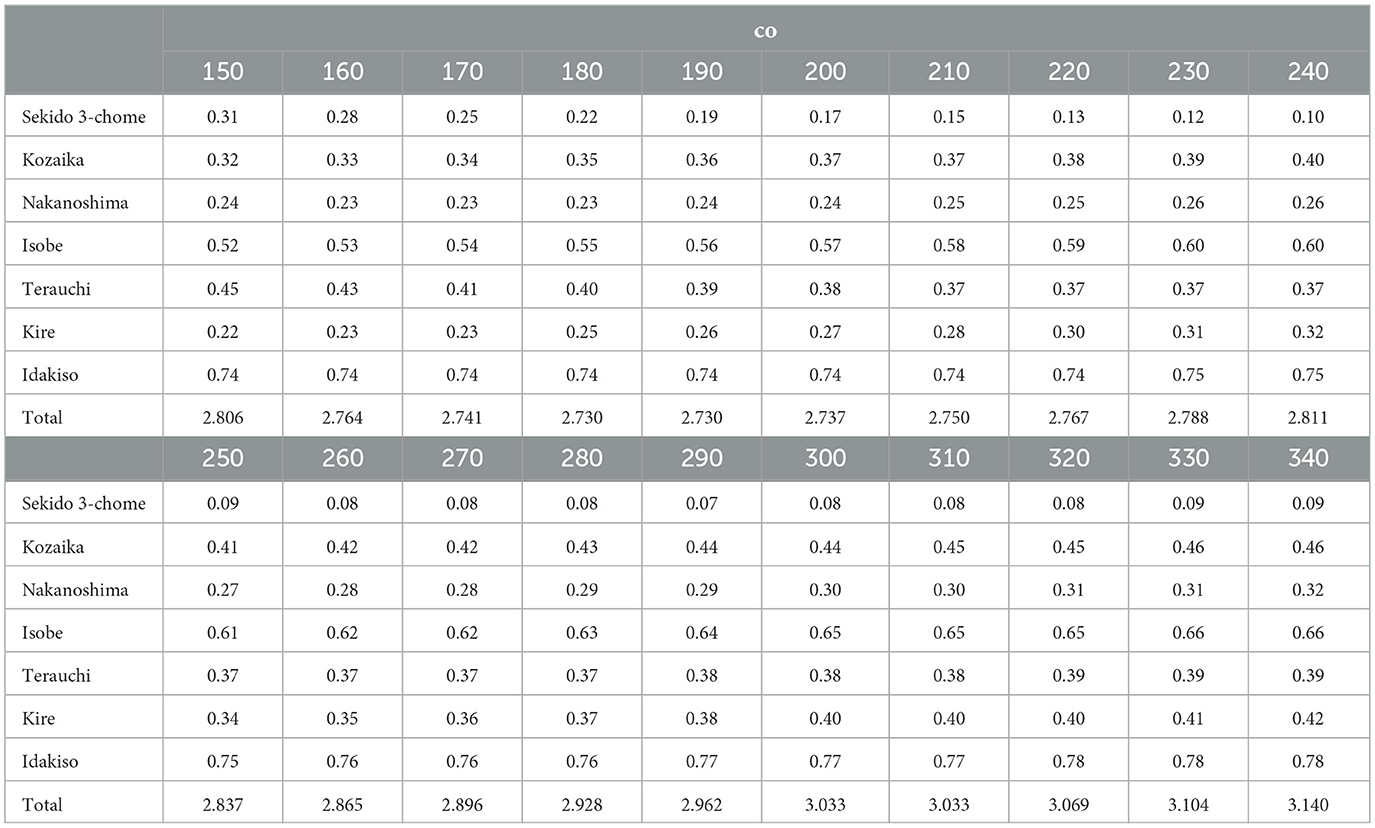
Table 3. The results of the sensitivity analysis of co.
2.8.5 Validation of model
To validate the residents' flood memory loss rate μS in the SH model, a survey was conducted to assess residents' awareness of flood hazards in each area of Wakayama City. The survey was conducted from December 22 to December 24, 2023. This survey involved interviews with all residents living in detached houses within the target areas to assess their perception of flood threat levels and experiences with flooding.
Furthermore, as verification data for the results of the SH model, the inundation area ratio due to pluvial flooding and the relative household density in the target area were calculated. The inundation area ratio due to pluvial flooding was created from the flood area map. The relative household density was derived from national census sub-area statistics and used to calculate the household density D.
3 Results and discussion
3.1 Application of the SH model
The results of applying the SH model to each area are shown in Figures 2–8. We defined F_ratio, which divides the inundation area ratio at the target areas by the flood intensity F. If the F_ratio is less than 1, it means that the actual damage was minor than the estimated result by the SH model, and if the F_ratio is greater than 1, it means that the damage was more significant than the calculated result by the SH model. Table 4 shows the F_ratios for each target area. The F_ratios for Isobe, Terauchi, and Idakiso in 2017 were 3.3, 2.3, and 4.2, respectively, which were more significant than those for other areas and years. In addition, the F_ratio was less than 0.30 in Terauchi and Idakiso in 2008 and Isobe in 2012. When the F_ratio is greater than 1, it was likely that factors other than the coverage of drainage systems were affecting the damage caused by pluvial flooding. This is thought to be due to changes in land use, the condition of waterways, and the lack of accumulated memories, as well as insufficient measures against pluvial flooding. The same is true for cases where the F-ratio is less than 1, and it is thought that this is because sufficient accumulated memory and preparations have been made for pluvial flooding. The influence of memory will be discussed in the next section. In addition, the areas where the F-ratio was particularly large or small were in Series 2, where public drainage systems had not been introduced. For example, in the areas in Series 2, waterways that are sometimes used for agricultural purposes are mainly used for rainwater drainage. Thus, we can infer that the factors affecting the occurrence of pluvial flooding, which are not considered in the SH model, have a more significant impact on the areas in Series 2.
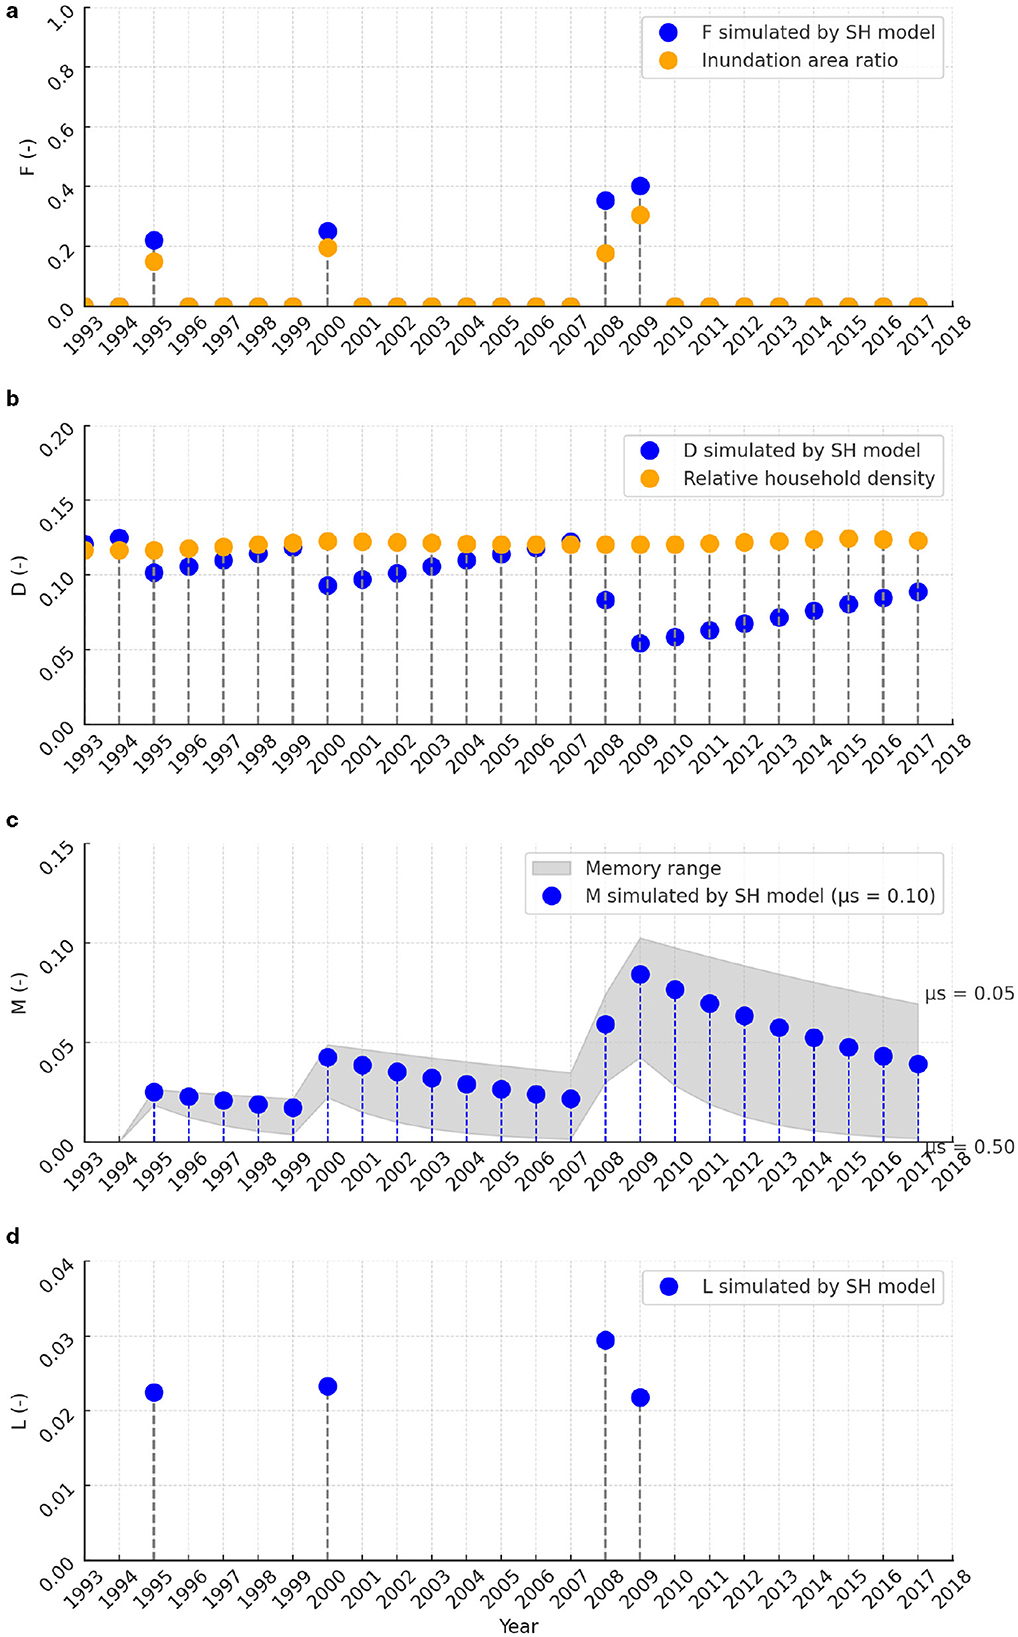
Figure 2. The results of applying the SH model to Sekido 3-chome (Series 1). (a) Flood intensity F, (b) Household density D, (c) Residents' flood memory M, (d) Flood damage D.
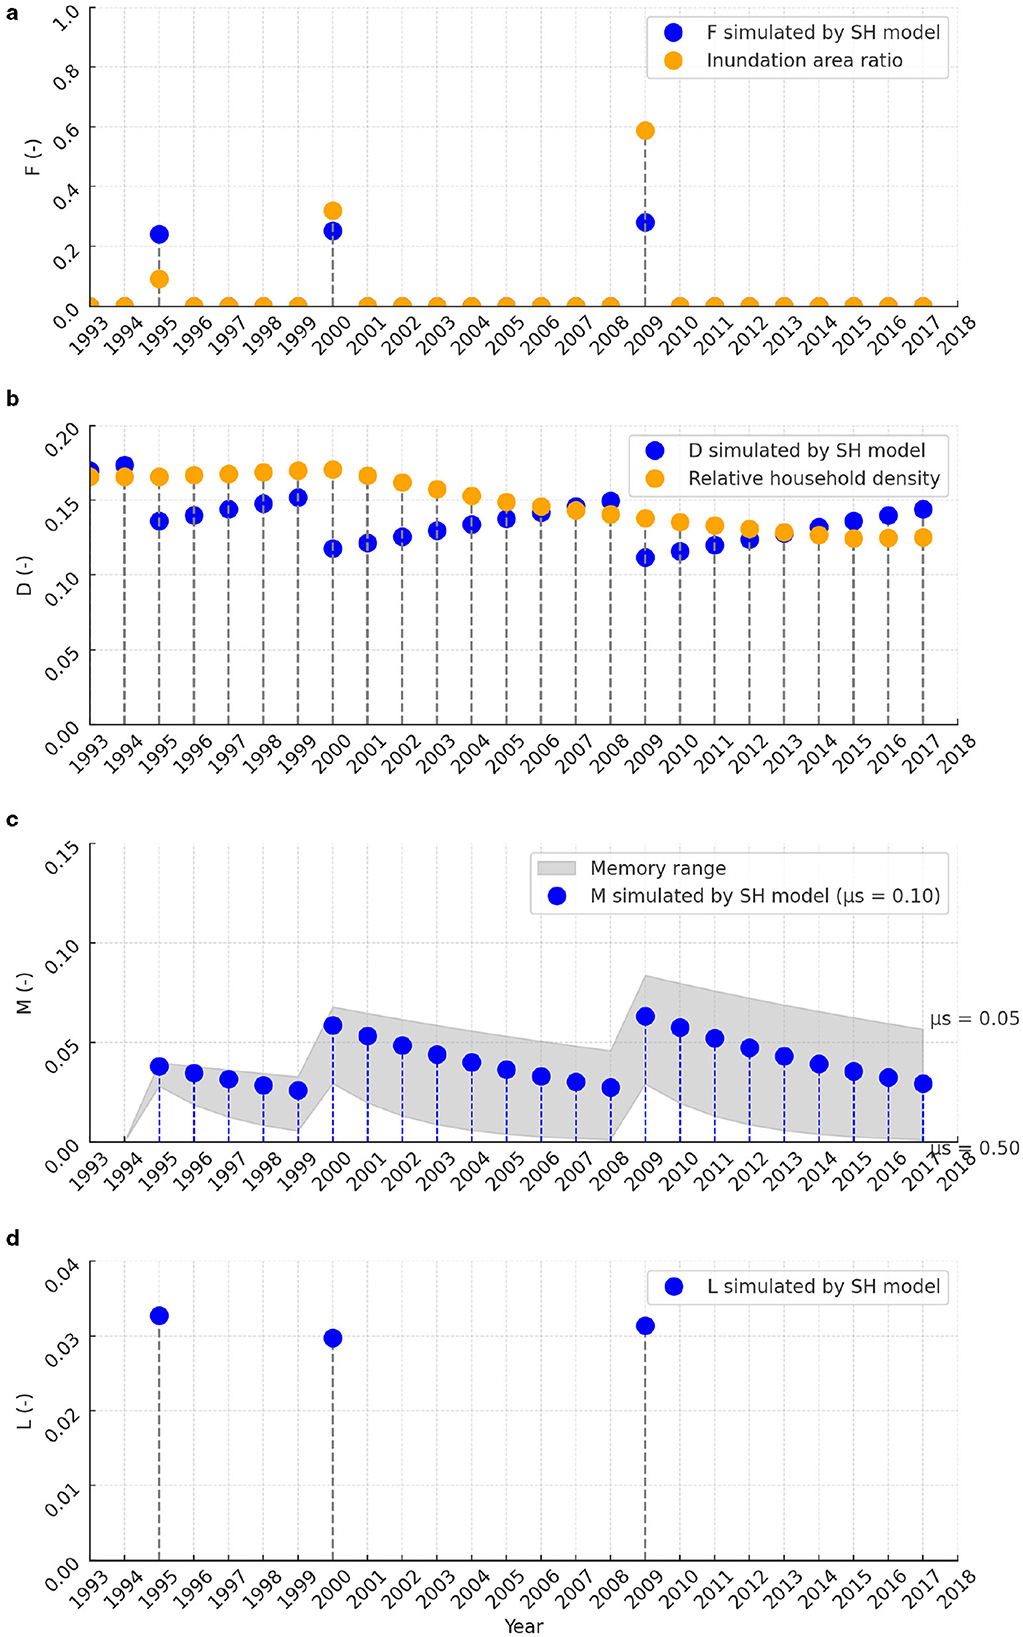
Figure 3. The results of applying the SH model to Kozaika (Series 1). (a) Flood intensity F, (b) Household density D, (c) Residents' flood memory M, (d) Flood damage D.
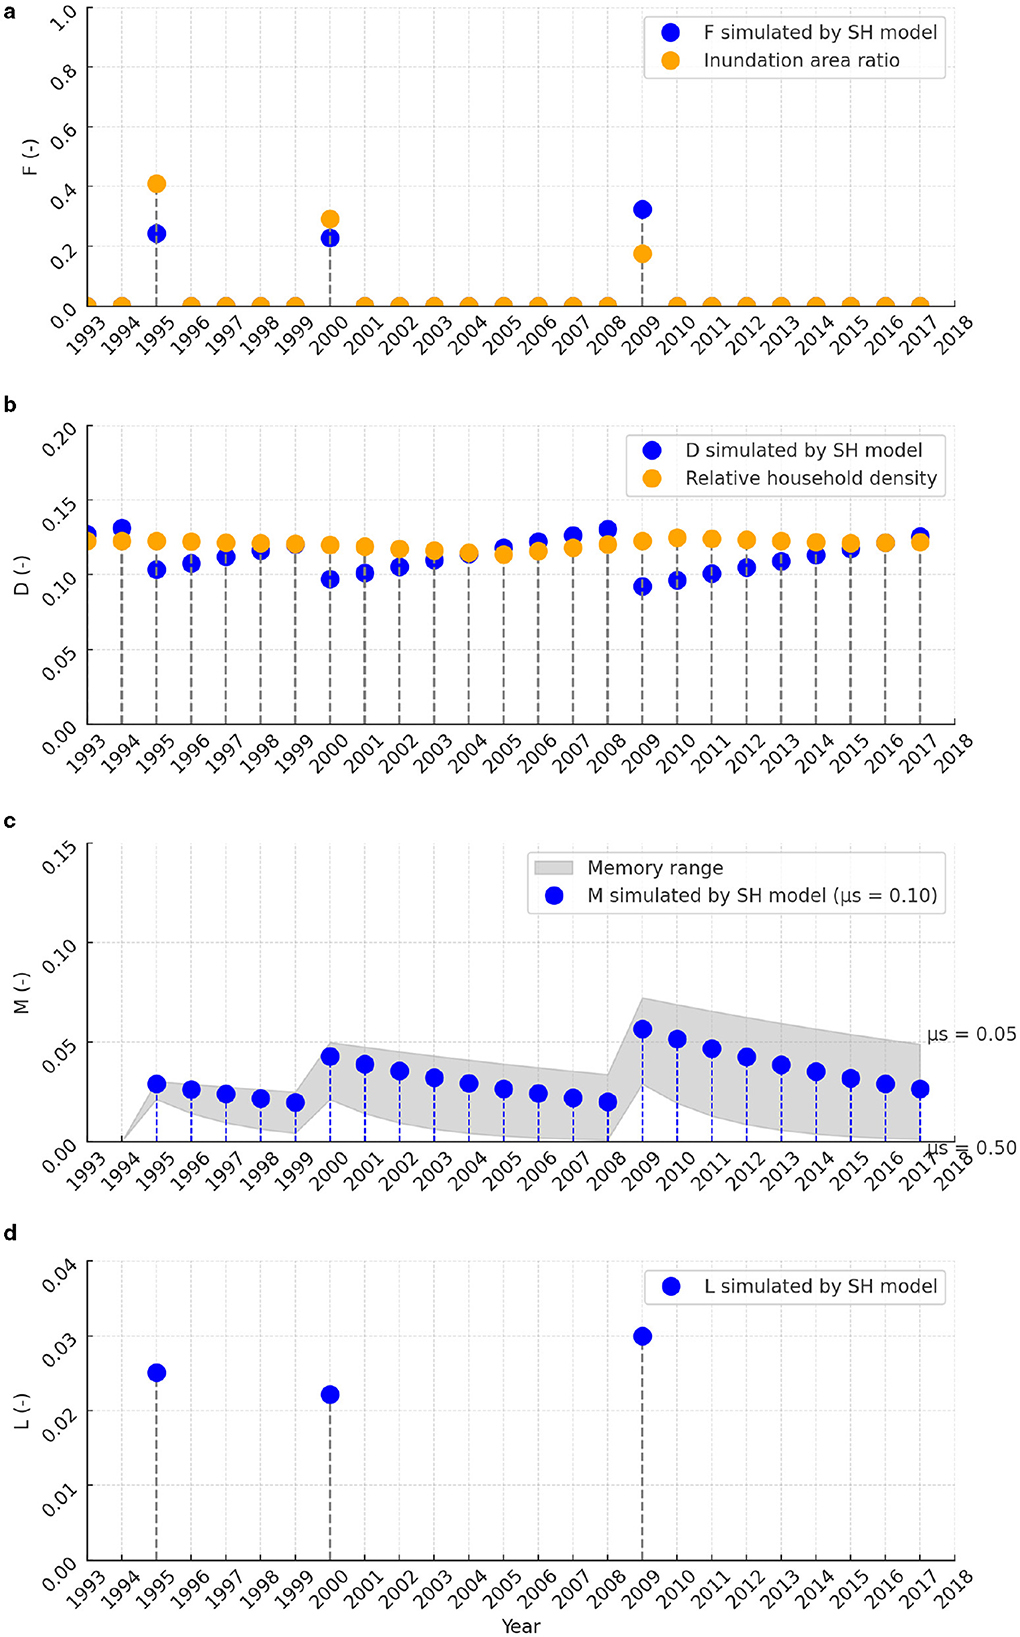
Figure 4. The results of applying the SH model to Nakanoshima (Series 1). (a) Flood intensity F, (b) Household density D, (c) Residents' flood memory M, (d) Flood damage D.
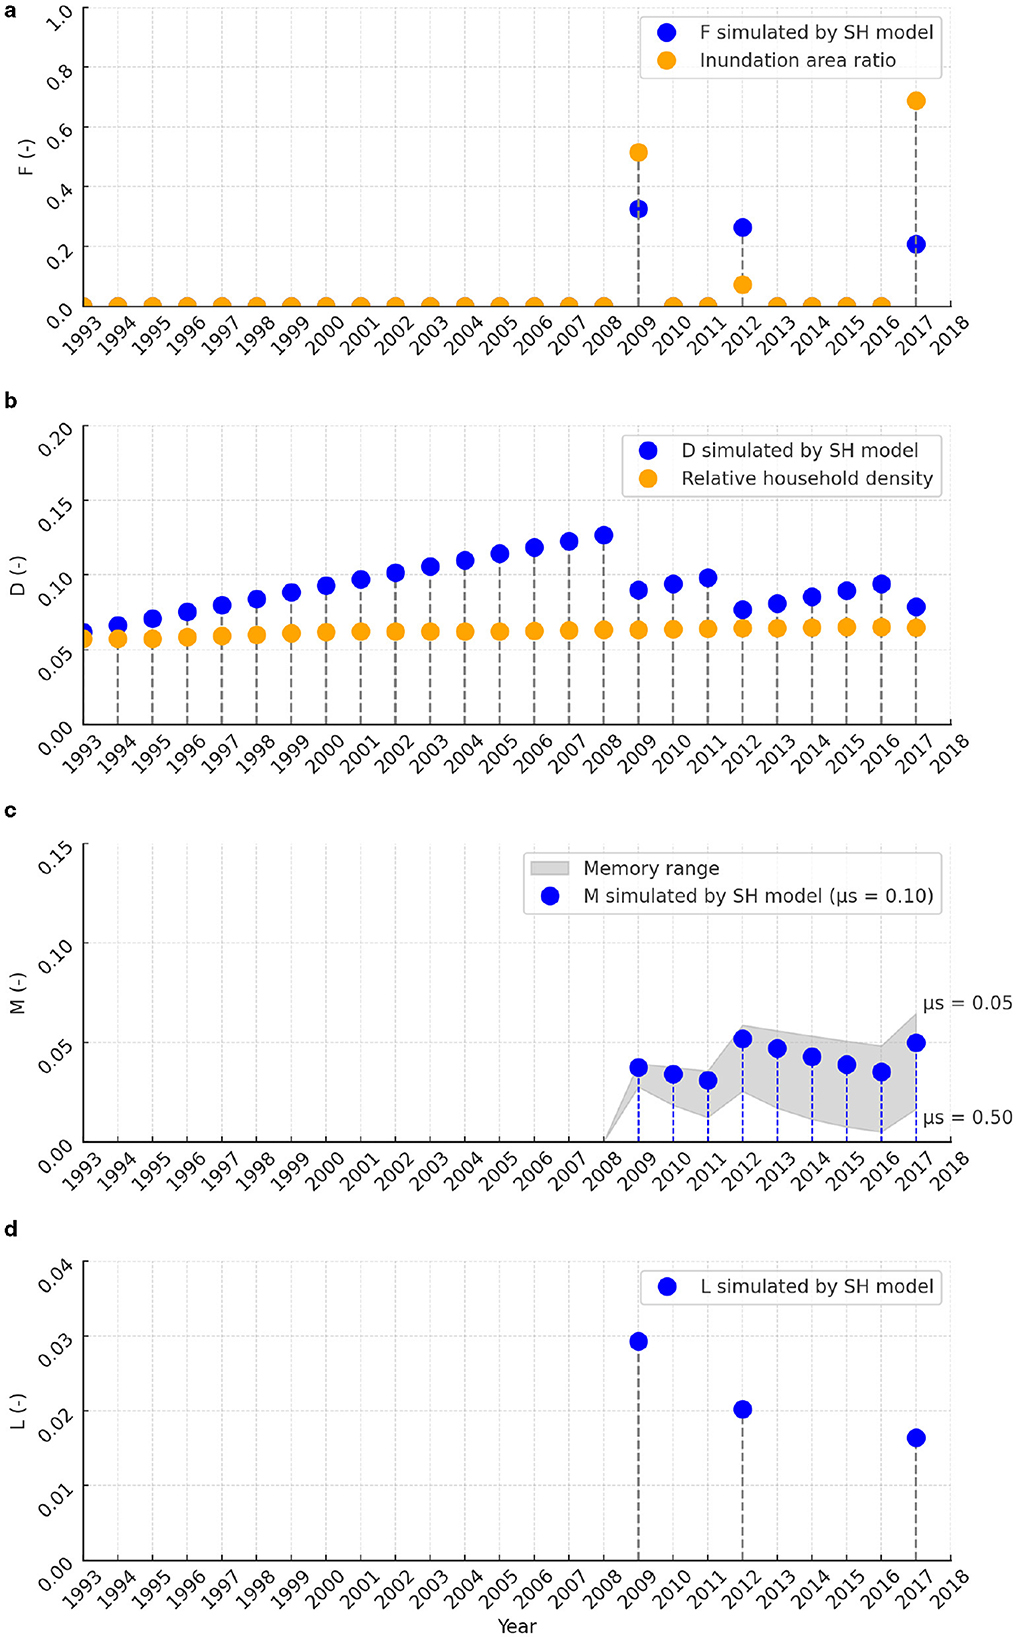
Figure 5. The results of applying the SH model to Isobe (Series 2). (a) Flood intensity F, (b) Household density D, (c) Residents' flood memory M, (d) Flood damage D.
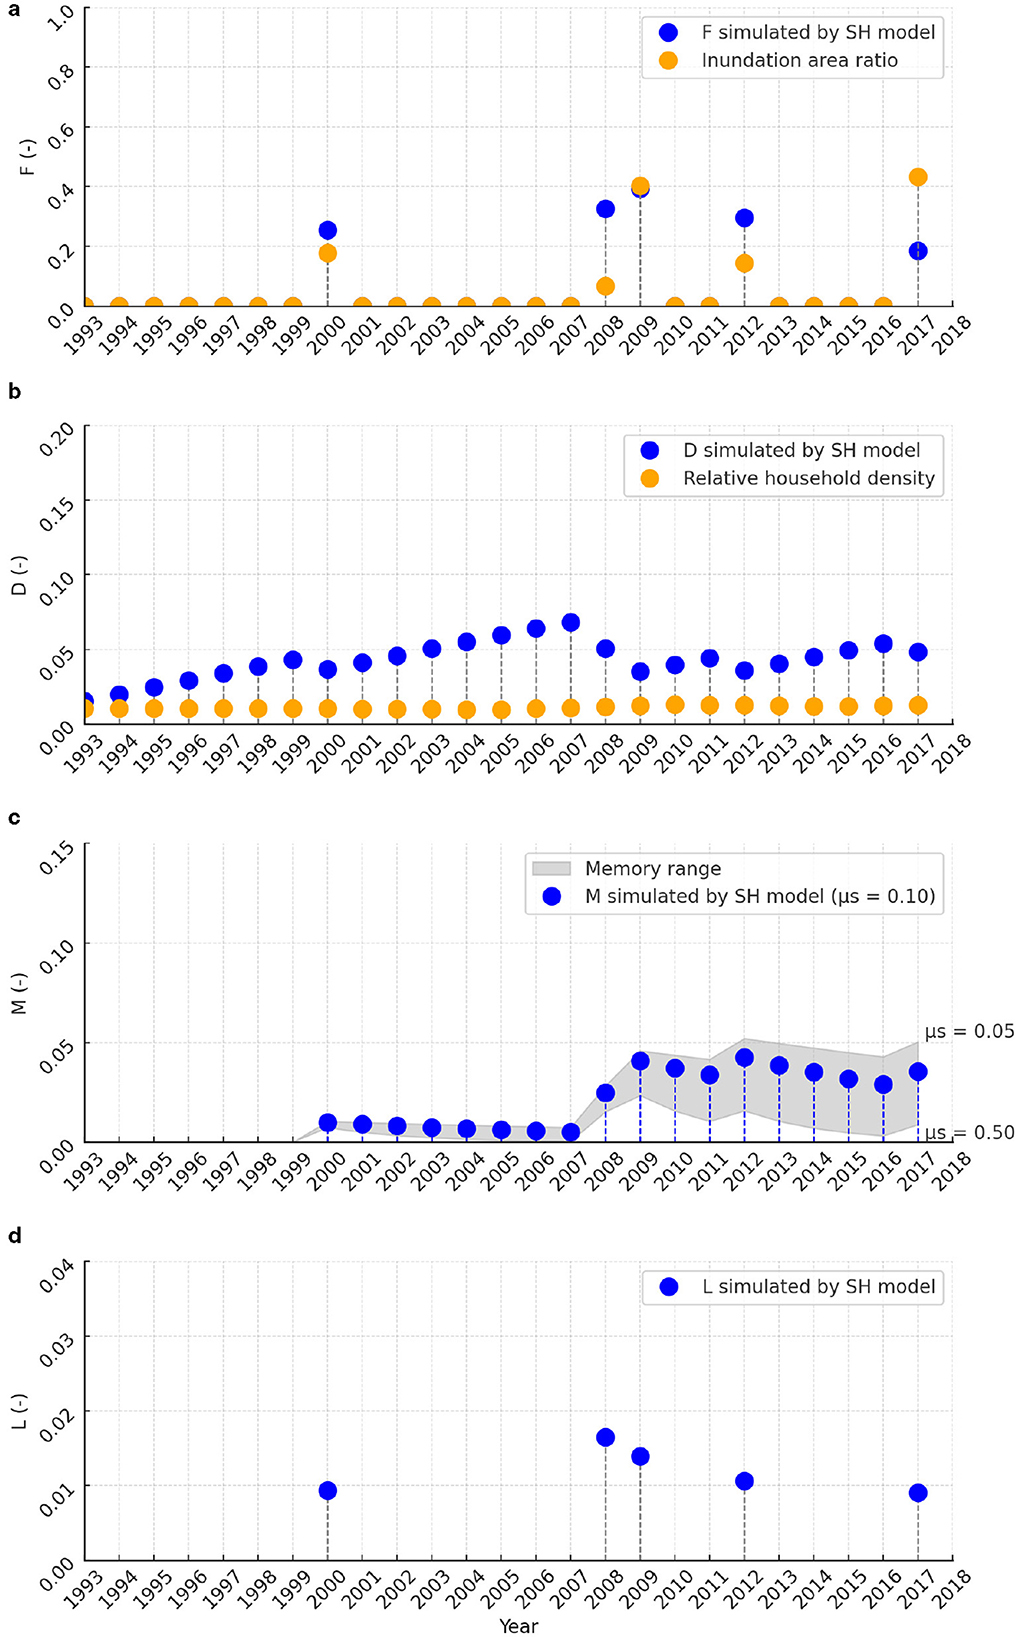
Figure 6. The results of applying the SH model to Terauchi (Series 2). (a) Flood intensity F, (b) Household density D, (c) Residents' flood memory M, (d) Flood damage D.
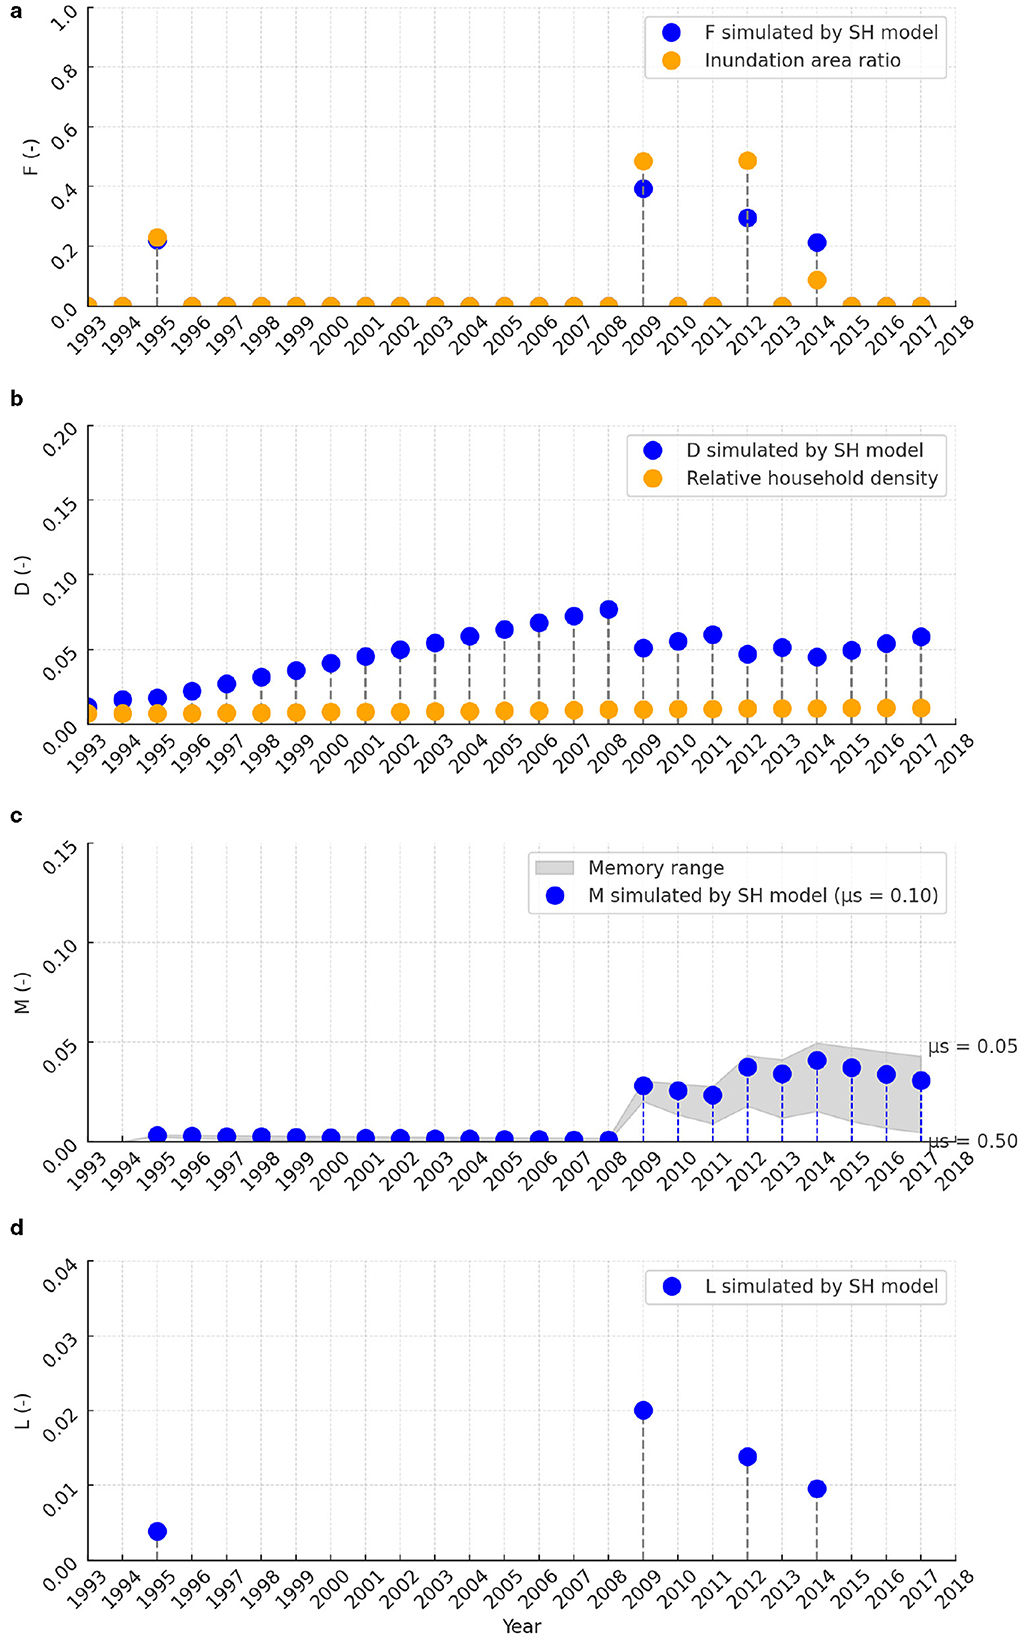
Figure 7. The results of applying the SH model to Kire (Series 2). (a) Flood intensity F, (b) Household density D, (c) Residents' flood memory M, (d) Flood damage D.
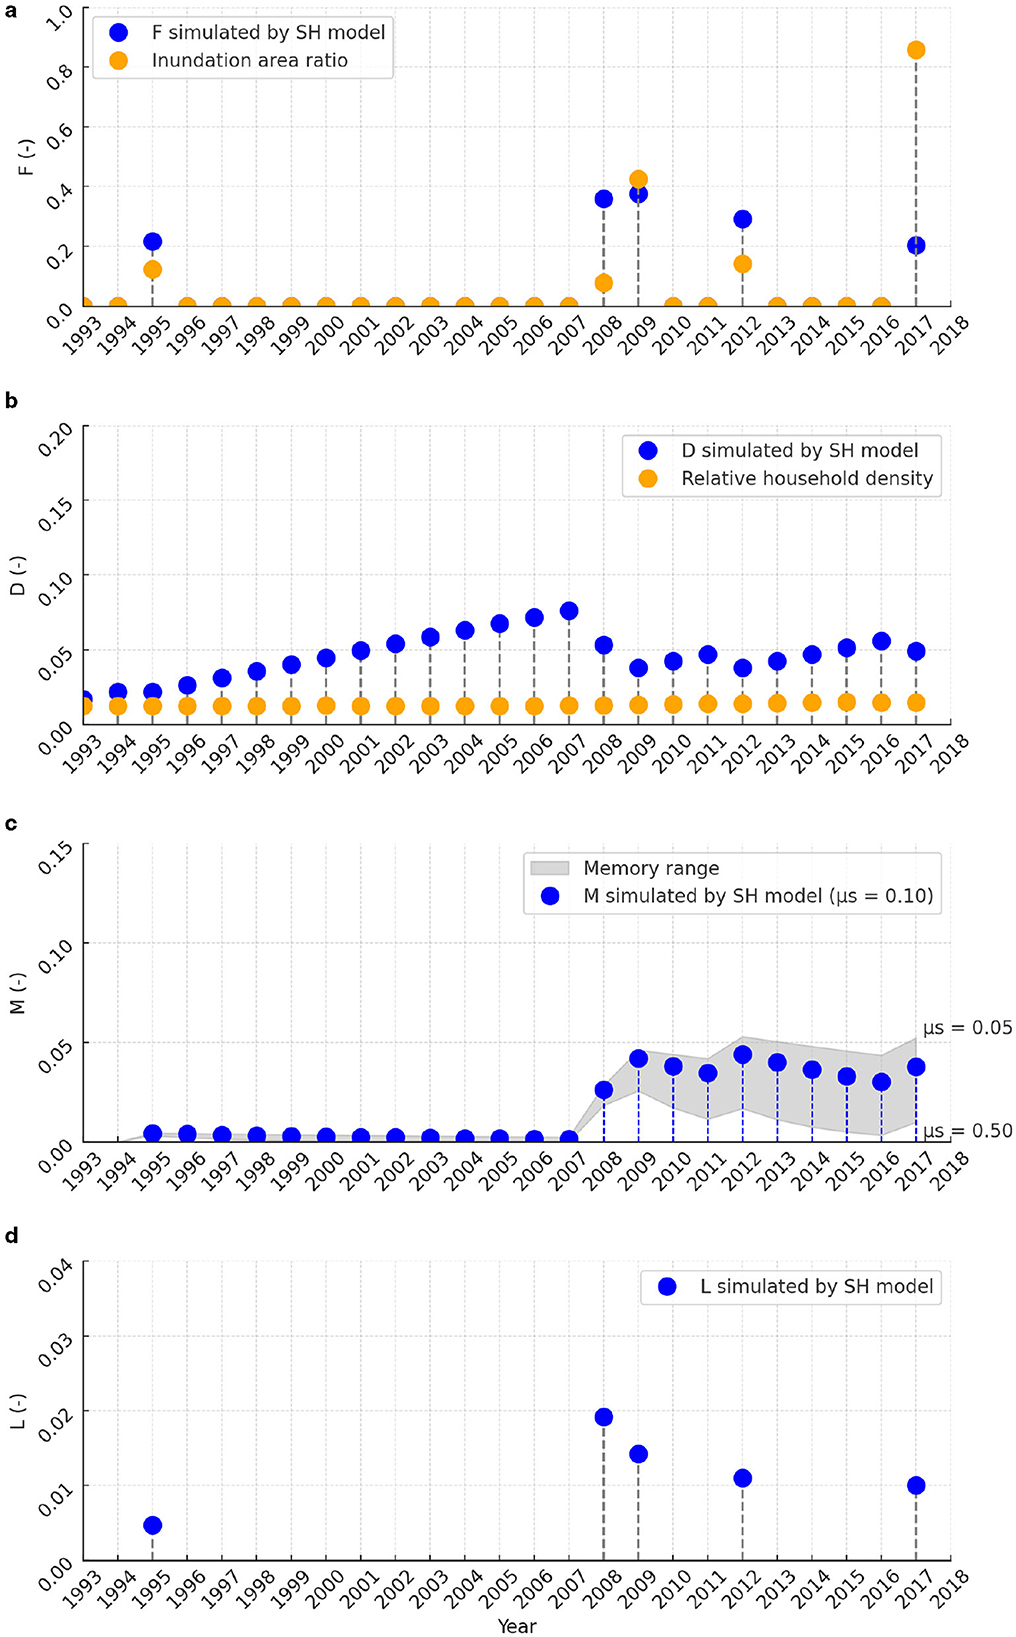
Figure 8. The results of applying the SH model to Idakiso (Series 2). (a) Flood intensity F, (b) Household density D, (c) Residents' flood memory M, (d) Flood damage D.
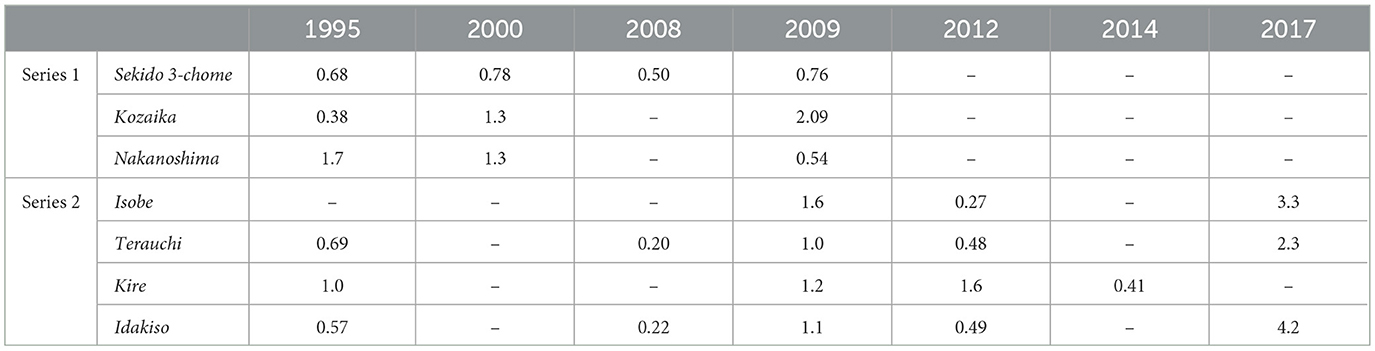
Table 4. The F_ratios for each target area.
The household density D of Series 1 captured the actual trend better than Series 2 (Figures 2–8). The results for household density D in Series 2 were higher than the exact values for the entire period. Urban areas, such as Series 1, are thought to be more likely to experience population growth, and areas with farmland, such as Series 2, are less likely to experience population growth to the same extent as urban areas. For this reason, it is thought that the relative growth rate ρD of the number of households given uniformly to the target area was too high to apply to the areas in Series 2. In addition, the results of the SH model showed more significant fluctuations than the actual household density. These reasons are that the areas to which the SH model has been applied in the past are large in scale, such as urban areas and river basins, and the relative growth rate ρD includes both the population decrease in disaster-stricken areas and the population increase due to economic growth outside the disaster-stricken areas, so it is thought that the population increase and decrease will be significant. On the other hand, in this study, only the disaster-stricken areas were targeted in a small area of 400–1,000 m2 (Table 1), so it is considered that the population increase due to economic growth outside the disaster-stricken areas was not strongly reflected.
The maximum value of the residents' flood memory M was 0.84 at Sekido 3-chome in 2009 (Figure 2). The maximum value of the residents' flood memory M for Series 1 was in the range of 0.057–0.084, and the maximum value of the residents' flood memory M for Series 2 was in the range of 0.041–0.052, so it was found that Series 1 had a higher residents' flood memory (Figures 2–8). In particular, the residents' flood memory M for Series 1 in Sekido 3-chome remained at a high value. This was likely due to the continuous occurrence of relatively sizeable pluvial flooding. In addition, it was confirmed that within the period, there were alternating periods of attenuation, during where the residents' flood memory M decreased, and periods of amplification, during where the residents' flood memory M increased. Furthermore, the same dynamics were observed when the residents' flood memory loss rate μS was varied between 0.05 and 0.50 (Figures 2–8).
We, therefore, evaluated the effect of the value of the residents' flood memory loss rate μS on household density D. We calculated the multiplier for household density D in the cases of μS = 0.05 and μS = 0.50, using household density D for μS = 0.10 as the standard. The results for the year with the most significant change in each area are shown in Table 5. Regarding the residents' flood memory loss rate μS = 0.05, the household density D was 0.99–1.0 times. In addition, when the residents' flood memory loss rate μS = 0.50, the household density D was 1.0 times. The area that changed the most for both μS = 0.05 and μS = 0.50 was Kozaika. From the above, when the residents' flood memory loss rate μS is in the range of 0.05–0.50, the impact of the residents' flood memory loss rate μS on the household density D is almost non-existent. One reason for this is that in Japan, the value of houses is higher than the damage caused by pluvial flooding, so it is thought that few people move even if they are affected by a disaster. In this application of the SH model, although there was no difference in the dynamics of residents' flood memory M due to differences in the residents' flood memory loss rate μS, and the effect on household density D was small, the determination of the residents' flood memory loss rate μS needs to be verified by conducting interviews with residents.
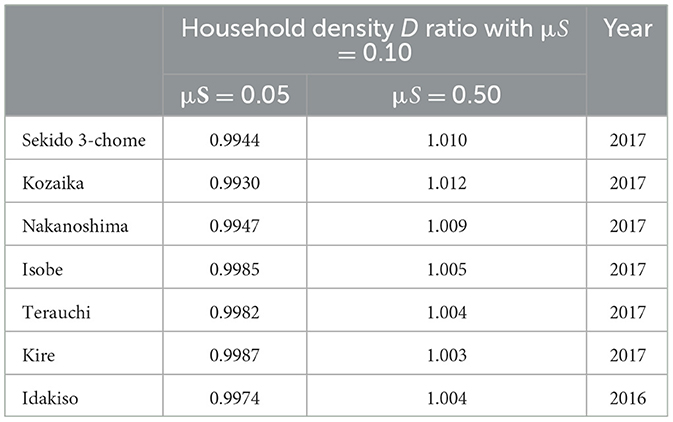
Table 5. The households density D as a multiple of the residents' flood memory loss rate μS.
Flood damage L is expressed as the product of flood intensity F and household density D. However, as mentioned above, although few people relocate their homes due to damage caused by pluvial flooding, the SH model assumes many people will relocate. Therefore, if damage caused by pluvial flooding occurs in succession, there is a high possibility that damage in later years will be underestimated. In fact, in all three areas of Sekido 3-chome, Terauchi and Idakiso, where pluvial flooding occurred in 2008 and 2009, the damage in 2009 was calculated to be small. Therefore, it was inferred that about flood damage L if modifying the household density D would result in a result that conformed to the actual damage.
3.2 Validation of the SH model by comparing the residents' flood memory and changes over time in social vulnerability
3.2.1 Validation of the residents' flood memory loss rate
To validate the residents' flood memory loss rate μS in the SH model, a survey was conducted to assess residents' awareness of flood hazards in each area of Wakayama City. The survey results are shown in Table 6. The results were summarized, by each area, the total number of responses, average length of residence, average household size, the average response to Question 1 “How much of a threat do you perceive flooding to be to yourself or your home?”, and Question 2 “the proportion reporting flood experience.” Question 1 was presented on a Five-point Likert scale from “1 Not a threat” to “5 A threat.” Question 2 was a yes/no question. Kozaika (Series 1), which had no experience of flooding, showed the lowest awareness of flooding, while Idakiso (Series 2), which had the highest experience of flooding, showed the highest awareness of flooding. A positive relationship was observed between awareness of flooding and experience of flooding.
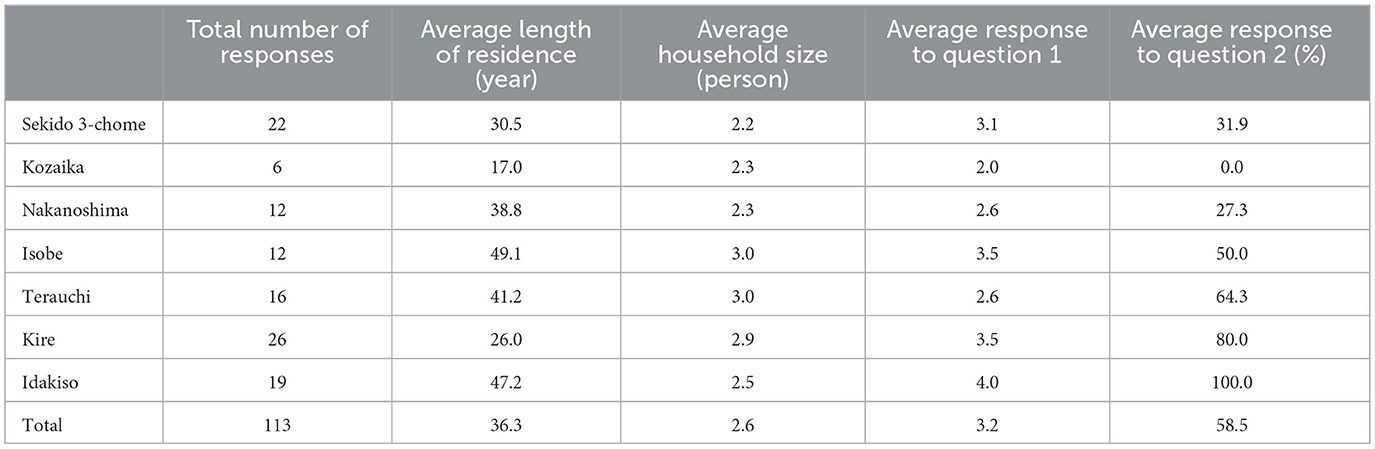
Table 6. The survey results of residents living in detached houses within the target areas.
Based on the survey results, the residents' flood memory loss rate μS was estimated. Responses to Question 1 of the survey were interpreted as the perceived threat level of flooding. For each area, risk perception in the base year was set as the maximum value of 5, and the half-life of risk perception from that year to 2023 was calculated. Here, the base year was defined as the last year within the target period for that study area where the flooded area ratio reached 50% or more of the maximum flooded area ratio. Then, referencing Ridolfi et al. (2020), the residents' flood memory loss rate μS was calculated by dividing 2 by the memory half-life. In addition, the calculation of the residents' flood memory loss rate μS for each area within each city utilized only responses from residents who had lived in that area prior to the base year. The overall residents' flood memory loss rate μS was calculated by taking the weighted average of the residents' flood memory loss rate μS for each area. The residents' flood memory loss rate μS for each area, as well as the weighted average residents' flood memory loss rate μS, is shown in Table 7. The weighted average residents' flood memory loss rate μS for Wakayama City was 0.05 at a city scale. The memory half-life is approximately 14 years. It should be noted that Perera and Nakamura (Perera and Nakamura, 2022) generally indicate that the residents' flood memory loss rate μS ranges from 0.05 to 0.50 at a large scale, and the results obtained from this survey broadly confirmed alignment with this value at a city scale.
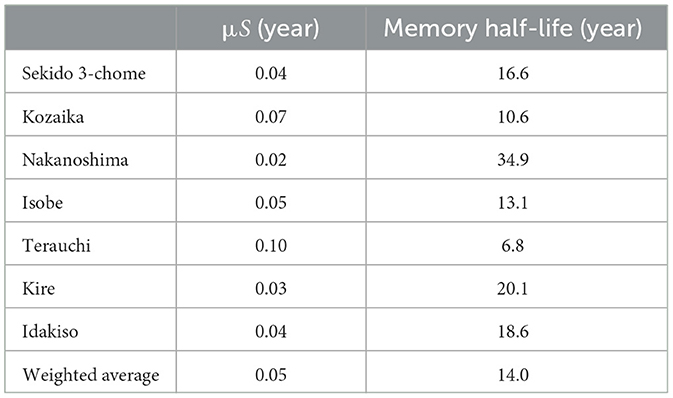
Table 7. The survey results of residents' flood memory loss rate μS for each area.
3.2.2 The residents' flood memory and adaptation effect
The areas where the adaptation effect was clearly expressed within the target area were Nakanoshima (Series 1) and Kire (Series 2) regardless of the presence or absence of public drainage systems. In Nakanoshima, the residents' flood memory M had accumulated since 1993. In contrast, in Kire, the residents' flood memory M was almost zero until 2009, after which it accumulated rapidly due to frequent flooding experiences from that point onwards. Therefore, the levee effect was also confirmed in Kire (see Section 3.2.2).
In Nakanoshima, the F-ratio was more significant than 1 in the 1995 and 2000 pluvial flooding events; however, in 2009, the F-ratio was 0.54, which was less than 1. The residents' flood memory M in the year prior to pluvial flooding was higher in 2008 than in 1994 and 1999. Therefore, it was inferred that in 2009, the adaptation effect of the accumulation of residents' flood memory M occurred, and the inundated area ratio was smaller than the flood intensity F estimated by the SH model. In addition, since the 2000 flood experience influenced the adaptive effects in the 2009 flood. Many previous studies (e.g., Baldassarre et al., 2017; Ciullo et al., 2017; Shibata et al., 2022; Perera and Nakamura, 2022) have treated the initial value of residents' flood memory M as zero. However, flood experiences prior to the target period influence the initial value of residents' flood memory M. Therefore, it is necessary to verify the initial value of residents' flood memory M in future studies.
In the case of Kire, as with Nakanoshima, the F-ratio was more significant than 1 for the 2009 and 2012 pluvial flooding events, but in 2014, the F-ratio was 0.41, which was less than 1. The residents' flood memory M in the year prior to pluvial flooding was higher in 2013 than in 2008 and 2011. Therefore, it is thought that damage was reduced in Kire due to the adaptation effect. In addition, the rainfall, flood intensity F, inundation area ratio, and residents' flood memory M for the 1995 and 2014 pluvial flooding events in Kire are shown in Table 8. The rainfall and estimated flood intensity F during the 1995 and 2014 pluvial flooding events were similar. The residents' flood memory M for the previous year was 0.034 larger in 2014. At this time, the inundation area ratio was 0.38 times that of 1995, indicating that the residents' flood memory M reduced damage by about 60%.
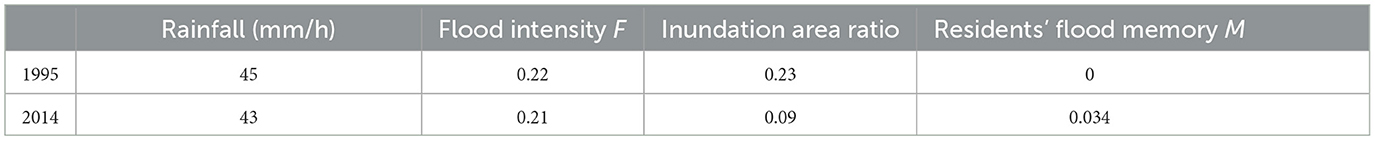
Table 8. The comparison of rainfall, flood intensity F, inundation area ratio, and residents' flood memory M for the 1995 and 2014 urban pluvial flooding in Kire.
3.2.3 The residents' flood memory and levee effect
The levee effects were confirmed in the target area of Kire (Series 2) and Isobe (Series 2) only in the absence of public drainage systems. Until the 1980s and 1960s, both Kire and Isobe were rural areas surrounded by rice paddy fields, which served as flood control basins to prevent pluvial flooding. Therefore, no public drainage systems have been constructed to date. However, in recent years, land use has shifted from rice paddy fields to urban areas, and the flood retention effect at the rice paddy fields has continued to decline, resulting in frequent pluvial flooding since 2009. As a result, the residents' flood memory M had almost zero until 2009, but it has rapidly accumulated since then due to frequent flooding experiences.
In the case of Kire, it was thought that the levee effect was confirmed during an urban pluvial flood in 2009. Although an urban pluvial flood occurred in Kire in 1995, no pluvial flooding occurred for the next 12 years, and the residents' flood memory M decreased to less than 0.001. This means that the residents' flood memory loss rate μS was 0.10, and the memory had reduced to 28% of the level it was at in 1995. It was inferred that when the flood occurred in 2009, the F-ratio was 1.2 because there was little memory accumulation.
Similarly, in Isobe, since there were no pluvial flooding incidents from 1993 to 2008, it is thought that when the incident occurred in 2009, there was minimal memory accumulation, and damage occurred with an F-ratio of 1.6 due to the levee effect. In addition, even if the same level of damage as in 2009 occurred before 1992, it was estimated that a similar result would be obtained because the residents' flood memory M in 2008 would be less than 0.0070.
4 Conclusions
We developed an SH model for pluvial flooding. We applied the developed model to the frequent pluvial flooding areas in Wakayama City and verified that social vulnerability (levee effect and adaptation effect) could be explained by residents' flood memory estimated by the model.
Adaptation effect occurred in both urban areas with public drainage systems (Series 1) and rural areas without public drainage systems (Series 2). In Series 1, pluvial flooding has occurred intermittently since 1993, and each time it has occurred, residents' flood memory has accumulated, and adaptation effects have emerged. On the other hand, in Series 2, which is surrounded by paddy fields with flood retarding functions, there had been no major flooding before 2009; however, frequent pluvial flooding since 2009 has led to the shortly accumulation of residents' flood memory and the emergence of adaptation effects. Additionally, because flood experiences prior to the target period influence the initial value of residents' flood memory, it is necessary to verify the initial value of residents' flood memory in future studies.
The levee effect occurred only in Series 2. In Series 2, it was considered that residents lacked awareness of the increased flood risk in the area due to land-use changes from rice paddy fields to residential areas. It was considered that residents' awareness of the increased flood risk in the area due to changes in land use from rice paddy fields to residential areas was lacking, as they had no prior severe flood experiences.
System dynamics modeling is a method of dynamic analysis based on strong correlations between elements. On the other hand, it is indisputable that when various communities are mixed within the social system under analysis, as in the conventional SH model, further research is needed to fully understand how the interactions between the complex social community and the water system can be captured. In this study, by simplifying the analysis target to only the disaster-stricken areas (frequent pluvial flooding area), it was possible to capture the interaction between the simplified social community and flooding more directly so that the adaptation and levee effects were more clearly captured. In future socio-hydrology research, it is essential to consider the scale of the analysis target.
In the future, quantitative verification of the model is expected to contribute to further improvements in the model, such as quantitative analysis of the effects of flood experience, disaster risk reduction (DRR) infrastructure, and DRR education on residents' flood memory dynamics, as well as modeling of residents' flood memory dynamics itself. A deeper understanding of the role of residents' flood memory in DRR is expected to contribute to the implementation of resident-participatory DRR policies and to the quantitative evaluation of DRR education aimed at enhancing residents' flood memory.
Data availability statement
The original contributions presented in the study are included in the article/supplementary material, further inquiries can be directed to the corresponding author.
Author contributions
DK: Conceptualization, Data curation, Formal analysis, Funding acquisition, Investigation, Methodology, Project administration, Resources, Software, Supervision, Validation, Visualization, Writing – original draft, Writing – review & editing. YO: Data curation, Formal analysis, Writing – original draft. MS: Writing – review & editing. KN: Writing – review & editing.
Funding
The author(s) declare that no financial support was received for the research and/or publication of this article.
Acknowledgments
This research was supported by CSIS Joint Research No. 1123, University of Tokyo. The pluvial flooding area record was provided by the River Planning Division, Water Management and Land Conservation Bureau, Ministry of Land, Infrastructure and Transport. The authors would like to express their gratitude.
Conflict of interest
The authors declare that the research was conducted in the absence of any commercial or financial relationships that could be construed as a potential conflict of interest.
The handling editor declared a past co-authorship with one of the authors DK.
Generative AI statement
The author(s) declare that no Gen AI was used in the creation of this manuscript.
Any alternative text (alt text) provided alongside figures in this article has been generated by Frontiers with the support of artificial intelligence and reasonable efforts have been made to ensure accuracy, including review by the authors wherever possible. If you identify any issues, please contact us.
Publisher's note
All claims expressed in this article are solely those of the authors and do not necessarily represent those of their affiliated organizations, or those of the publisher, the editors and the reviewers. Any product that may be evaluated in this article, or claim that may be made by its manufacturer, is not guaranteed or endorsed by the publisher.
References
Baldassarre, G., Cloke, H., Lindersson, S., Mazzoleni, M., Mondino, E., Mård, J., et al. (2021). Integrating multiple research methods to unravel the complexity of human-water systems. AGU Adv. 2, 1–6. doi: 10.1029/2021AV000473
Baldassarre, G., Saccà, S., Aronica, G. T., Grimaldi, S., Ciullo, A., and Crisci, M. (2017). Human-flood interactions in Rome over the past 150 years. Adv. Geosci. 44, 9–13. doi: 10.5194/adgeo-44-9-2017
Baldassarre, G., Sivapalan, M., Rusca, M., Cudennec, C., Garcia, M., Kreibich, H., et al. (2019). Sociohydrology: scientific challenges in addressing the sustainable development goals. Water Resour. Res. 55, 6327–6355. doi: 10.1029/2018WR023901
Baldassarre, G., Viglione, A., Carr, G., Kuil, L., Salinas, J. L., and Blöschl, G. (2013). Socio-hydrology: conceptualising humanflood interactions. Hydrol. Earth Syst. Sci. 17, 3295–3303. doi: 10.5194/hess-17-3295-2013
Baldassarre, G., Viglione, A., Carr, G., Kuil, L., Yan, K., Brandimarte, L., et al. (2015). Debates - perspectives on socio hydrology: capturing feedbacks between physical and social processes. Water Resour. Res. 51, 4770–4781. doi: 10.1002/2014WR016416
Ciullo, A., Viglione, A., Castellarin, A., Crisci, M., and Di Baldassarre, G. (2017). Socio-hydrological modelling of flood-risk dynamics: comparing the resilience of green and technological systems. Hydrol. Sci. J. 62, 880–891. doi: 10.1080/02626667.2016.1273527
Cutter, S. L., Bryan J Boruff, W., and Lynn, S. (1996). Vulnerability to environmental hazards. Prog. Hum. Geogr. 20, 529–539. doi: 10.1177/030913259602000407
Djamres, E. K. D., Komori, D., and Kazama, S. (2021). Topographical characteristics of frequent inland water flooding areas in Tangerang City, Indonesia. Front. Water 3:661299. doi: 10.3389/frwa.2021.661299
e-Stat (n.d.a). The Portal Site for Government Statistics. Available online at: https://www.e-stat.go.jp/ (in Japanese) (accessed July 3 2025).
Geographical Survey Institute (n.d.b). Ministry of Land Infrastructure, Transport and Tourism, Geographical Survey Institute, Basic Map Information. Available online at: http://www.gsi.go.jp/kiban/ (in Japanese) (accessed July 3, 2025).
Hammond, M. J., Chen, A. S., Djordjevic, S., Butler, D., and Mark, O. (2015). Urban flood impact assessment: a state-of-the-art review. Urban Water J. 12:14e29. doi: 10.1080/1573062X.2013.857421
Hirabayashi, Y., Tanoue, M., Sasaki, O., Zhou, X., and Yamazaki, D. (2021). Global exposure to flooding from the new CMIP6 climate model predictions. Sci. Rep. 11:3740. doi: 10.1038/s41598-021-83279-w
IPCC-Intergovernmental Panel on Climate Change (2023). Climate Change 2023. The Sixth Assessment Report (AR6) WG2-Climate Change 2022: Impacts, Adaptation, and Vulnerability. Available online at: https://hal.science/hal-03774939/document (Accessed October 11, 2025).
Japan Meteorological Agency (n.d.c). Various Data and Materials: Historical National Rankings. Available online at: https://www.data.jma.go.jp/obd/stats/etrn/view/rankall.php (in Japanese) (accessed July 3 2025).
Karunarathne, A. Y., and Gunhak, L. (2020). Developing a multi-facet social vulnerability measure for flood disasters at the micro-level assessment. Int. J. Disaster Risk Reduc. 49:10167. doi: 10.1016/j.ijdrr.2020.101679
Komori, D., Nakaguchi, K., Inomata, R., Oyatsu, Y., Tachikawa, R., and Kazama, S. (2022). Topographocal characteristics of frequent urban pluvial flooding areas in Osaka and Nagoya Cities, Japan. Water 14:2795. doi: 10.3390/w14182795
Lowe, R., Urich, C., Domingo, N. S., Mark, O., Deletic, A., and Arnbjerg-Nielsen, K. (2017). Assessment of urban pluvial flood risk and efficiency of adaptation options through simulationse A new generation of urban planning tools. J. Hydrol. 550, 355–367. doi: 10.1016/j.jhydrol.2017.05.009
Ministry of Land Infrastructure, Transport and Tourism (n.d.d). Statistics of Flood Damage. Available online at: https://www.mlit.go.jp/river/toukei_chousa/kasen/suigaitoukei/index.html (accessed July 3, 2025).
National Land Numerical Information (n.d.e). Ministry of Land Infrastructure, Transport and Tourism, National Land Numerical Information Download Service. Available online at: https://nlftp.mlit.go.jp/ksj/ (in Japanese) (accessed July 3, 2025).
Perera, C., and Nakamura, S. (2022). Improvement of socio-hydrological model to capture the dynamics of combined river and urban floods: a case study in Lower Kelani River Basin, Sri Lanka. Hydrol. Res. Lett. 16, 40–46. doi: 10.3178/hrl.16.40
Ridolfi, E., Albrecht, F., and Di Baldassarre, G. (2020). Exploring the role of risk perception in influencing flood losses over time. Hydrol. Sci. J. 65, 12–20. doi: 10.1080/02626667.2019.1677907
Shibata, N., Nakai, F., Otsuyama, K., and Nakamura, S. (2022). Socio-hydrological modeling and its issues in Japan: a case studying Naganuma District, Nagano City. Hydrol. Res. Lett. 16, 32–39. doi: 10.3178/hrl.16.32
Sivapalan, M., Savenije, H. H. G., and Blöschl, G. (2012). Socio-hydrology: a new science of people and water. Hydrol. Process. 26, 1270–1276. doi: 10.1002/hyp.8426
Wakayama City (n.d.f). Guide to My Town. Available online at: https://www2.wagmap.jp/wakayamacity/Portal (in Japanese) (accessed July 3 2025).
Wang, Y., Chen, A. S., Fu, G., Djordjevic, S., Zhang, C., and Savic, D. A. (2018). An integrated framework for high-resolution urban flood modelling considering multiple information sources and urban features. Environ. Model. Softw. 107, 85–95. doi: 10.1016/j.envsoft.2018.06.010
Keywords: socio-hydrology, frequent pluvial flooding, residents' flood memory, community scale, system dynamic analysis
Citation: Komori D, Oyatsu Y, Sadidah M and Nagami K (2025) Improvement of socio-hydrological model to capture the dynamics of pluvial floods: a case study in frequent pluvial flooding areas in Wakayama City, Japan. Front. Water 7:1553835. doi: 10.3389/frwa.2025.1553835
Received: 31 December 2024; Accepted: 29 September 2025;
Published: 23 October 2025.
Edited by:
Shinichiro Nakamura, Nagoya University, JapanReviewed by:
Aman Srivastava, Indian Institute of Technology Kharagpur, IndiaChamal Perera, University of Moratuwa, Sri Lanka
Copyright © 2025 Komori, Oyatsu, Sadidah and Nagami. This is an open-access article distributed under the terms of the Creative Commons Attribution License (CC BY). The use, distribution or reproduction in other forums is permitted, provided the original author(s) and the copyright owner(s) are credited and that the original publication in this journal is cited, in accordance with accepted academic practice. No use, distribution or reproduction is permitted which does not comply with these terms.
*Correspondence: Daisuke Komori, ZGFpc3VrZS5rb21vcmkuZThAdG9ob2t1LmFjLmpw