 Klaus Goergen
 Alexandre Belleflamme
 Suad Hammoudeh
 Jan Vanderborght
 Stefan Kollet
- 1Institute of Bio- and Geosciences (IBG-3, Agrosphere), Forschungszentrum Jülich, Jülich, Germany
- 2Centre for High-Performance Scientific Computing in Terrestrial Systems, Geoverbund ABC/J, Jülich, Germany
- 3Department of Earth and Environmental Sciences, Soil and Water Management, KU Leuven, Leuven, Belgium
In mid-July 2021, a quasi-stationary extratropical cyclone over parts of western Germany and eastern Belgium led to unprecedented sustained widespread precipitation, nearly doubling climatological monthly rainfall amounts in less than 72 h. This resulted in extreme flooding in many of the Eifel-Ardennes low mountain range river catchments with loss of lives, and substantial damage and destruction. Despite many reconstructions of the event, open issues on the underlying physical mechanisms remain. In a numerical laboratory approach based on a 52-member spatially and temporally consistent high-resolution hindcast reconstruction of the event with the integrated hydrological surface-subsurface model ParFlow, this study shows the prognostic capabilities of ParFlow and further explores the physical mechanisms of the event. Within the range of the ensemble, ParFlow simulations can reproduce the timing and the order of magnitude of the flood event without additional calibration or tuning. What stands out is the large and effective buffer capacity of the soil. In the simulations, the upper soil in the highly affected Ahr, Erft, and Kyll river catchments are able to buffer between about one third to half of the precipitation that does not contribute immediately to the streamflow response and leading eventually to widespread, very high soil moisture saturation levels. In case of the Vesdre river catchment, due to its initially higher soil water saturation levels, the buffering capacity is lower; hence more precipitation is transferred into discharge.
1 Introduction
During 14 and 15 July 2021, extreme flooding affected parts of western Germany and eastern Belgium, as well as parts of Luxembourg and the Netherlands (Cornwall, 2021; Davies, 2021a; Davies, 2021b; Mohr et al., 2023). In Germany and Belgium, the event caused more than 200 fatalities (EM-DAT, 2021). Widespread substantial damage and destruction of infrastructure and properties occurred, with aggregated losses of about US$ 58bn associated with the event (Munich Re, 2025). For Europe, these are extreme numbers associated with flooding in recent history (Paprotny et al., 2018).
An area most extensively affected was the Eifel-Ardennes low mountain range and parts of the Lower Rhine Embayment in western Germany, with Federal States North Rhine-Westphalia and Rhineland-Palatinate, and eastern Belgium, including some of the Meuse River tributaries (Lehmkuhl et al., 2022; Mohr et al., 2023) (Figure 1).
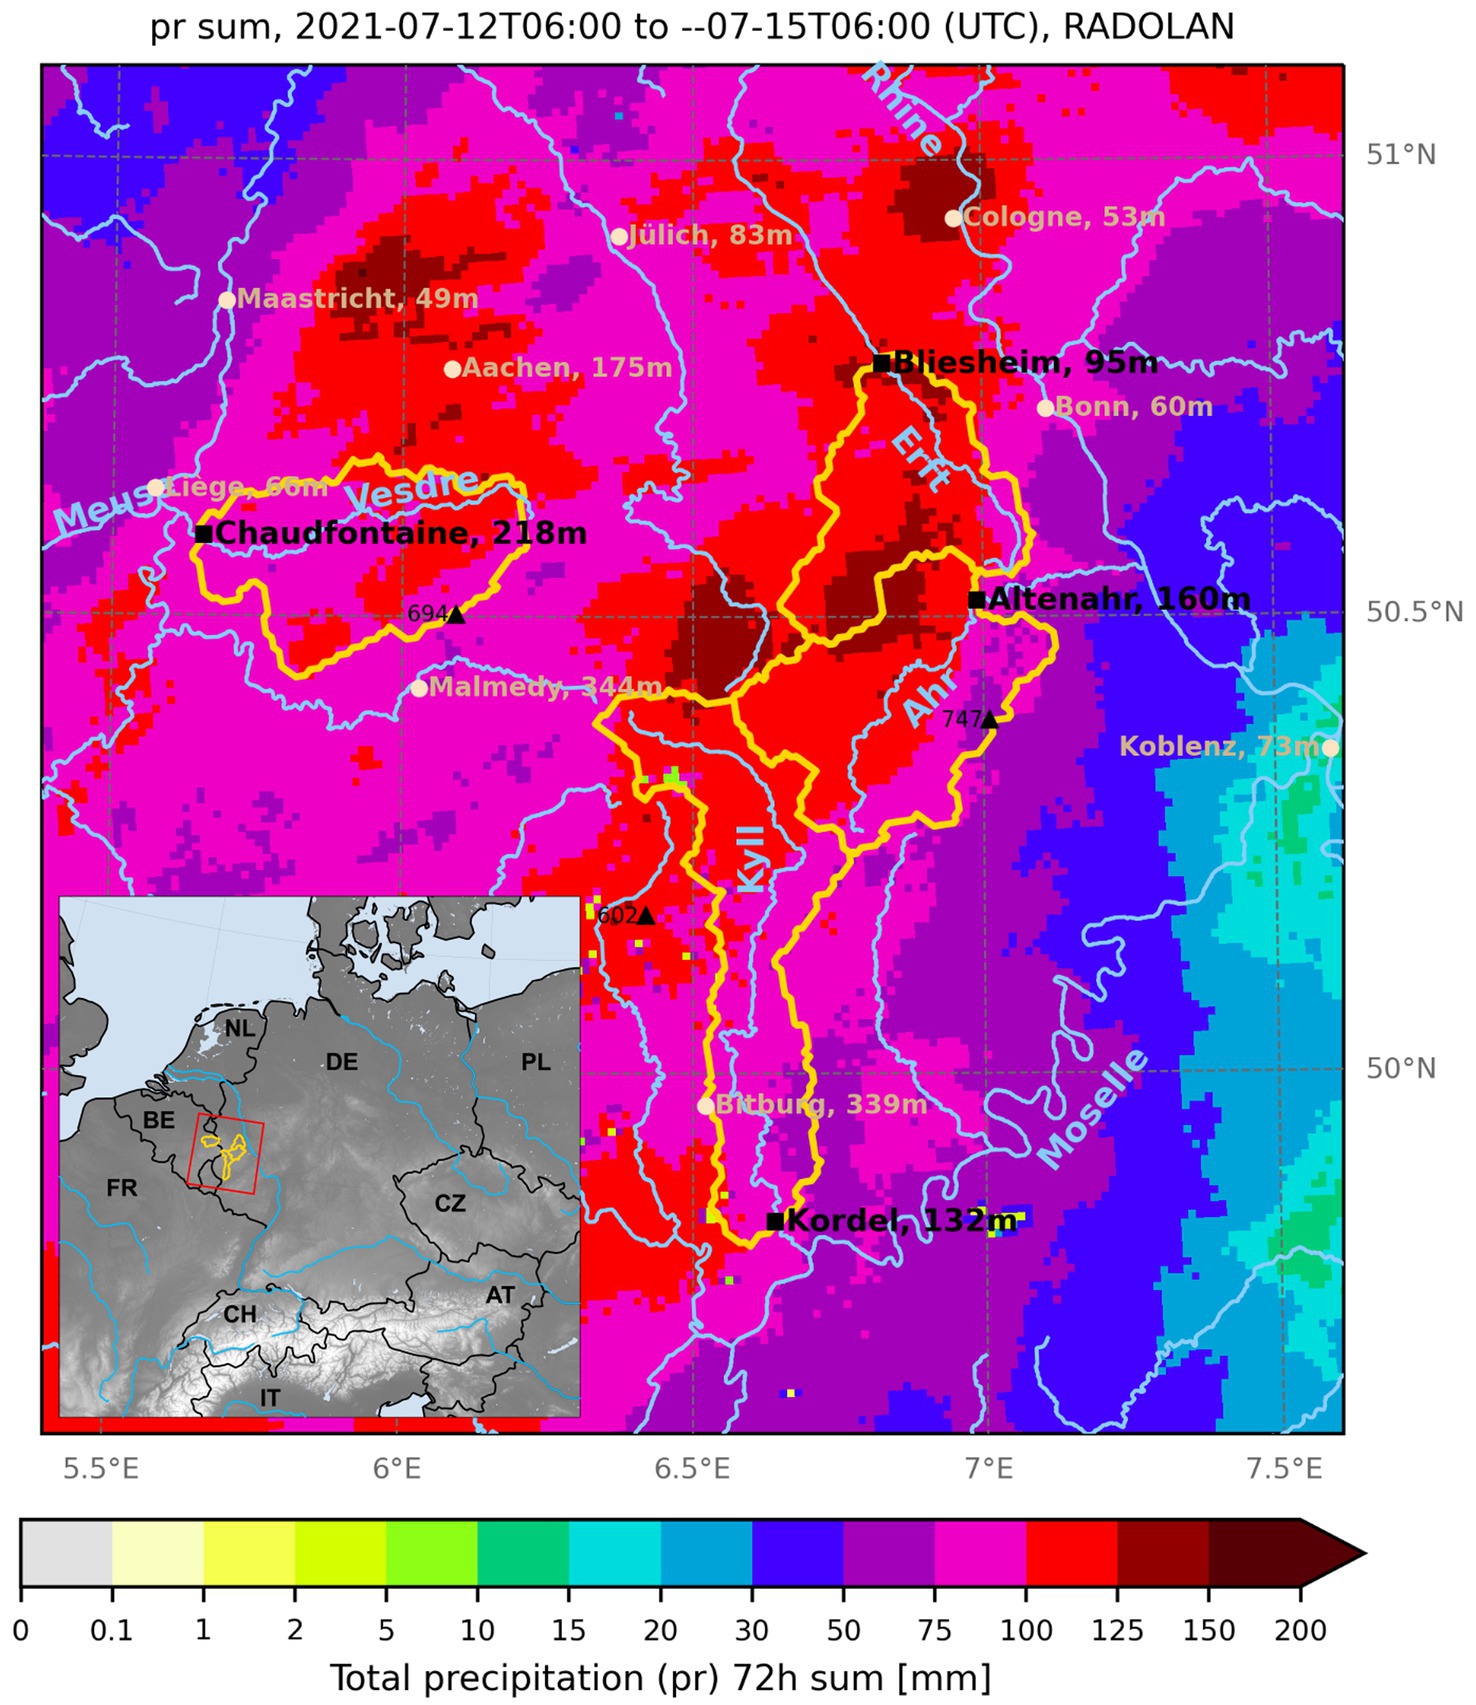
Figure 1. Geographic overview of the study region and 72 h accumulated hourly precipitation from Monday, 2021-07-12 06UTC, to Thursday, 2021-07-15 06UTC [mm 72 h−1]; please note the non-linear colorbar scale. The Eifel-Ardennes low mountain range lies between the rivers Moselle, Rhine, and Meuse; the triangle Jülich, Bliesheim, Cologne roughly borders the Lower Rhine Embayment. Yellow: ParFlow model catchment boundaries as used in the analysis. Black squares: gaging stations under consideration with place names. Bright blue: major rivers and their tributaries (those rivers under special consideration are labeled: Ahr, Erft, Kyll, Vesdre). Off white dots: city names for improved orientation. Low, interspersed precipitation values are artifacts in the radar-based data. Numbers behind place names give the mean altitude of the place or gage. The inset shows the topography of the complete 2,000 × 2,000 grid point ParFlow hydrologic model DE06 domain with the study region (red) and analysis catchments (yellow) and country borders (black). Data sources: DWD RADOLAN RW (precipitation) (Weigl and Winterrath, 2009; DWD, 2025); River and Catchment Characterization and Model database v2.1 (river network) (de Jager and Vogt, 2003).
Several studies investigated the 2021 flood event, e.g., in the realm of meteorological conditions, precipitation-runoff prediction, precipitation uncertainty or counterfactuals. Synoptic conditions, the hydrologic event description, including collected observations, the hydro-morphodynamics, the valley morphology, and changes thereof due to erosion, sediment and debris transport, that jointly contributed to the flood generation and evolution, are described, analyzed, and summarized comprehensively in the companion papers of Mohr et al. (2023) and Ludwig et al. (2023).
The first order driver of the extreme floods was widespread, persistent, and intense rain, associated with a quasi-stationary, blocked extratropical cyclone with an occluded front, orographic lifting at the Eifel-Ardennes low mountain range, and unstable moisture-laden air masses. These synoptic conditions were analyzed extensively, e.g., in reports by Junghänel et al. (2021) or Schäfer et al. (2021) with a focus on Germany and by Journée et al. (2023) for Belgium. In an extensive hindsight analysis of the event, the July heavy precipitation event was ranked by Ludwig et al. (2023) as one of the five heaviest precipitation events in Germany within the past 70 years. Figure 1 shows the observed 72 h precipitation sums preceding and during the built-up of the main flood events from 12 to 15 July based on the RADOLAN radar precipitation product (Weigl and Winterrath, 2009; DWD, 2025). Widespread precipitation totals exceeding 100 mm 72 h−1, locally up to 150 mm 72 h−1, and more than 75 mm 24 h−1 during 14 July, with local amounts up to 100 mm 12 h−1 during the afternoon of 14 July affected most of the drainage and river networks of the Eifel-Ardennes area north of the Moselle river, west of the Rhine river and east of the Meuse river on 14 and 15 July during the main flood events. Strongly impacted regions were in the catchments of the rivers Ahr, Erft, Kyll, Vesdre (see the catchments highlighted in Figure 1). Whether the extreme July 2021 precipitation can be attributed to climate change remains inconclusive in a study by Tradowsky et al. (2023); there is, however, an increased likelihood and severity of extreme precipitation events for the larger Western European region in a future climate.
Hydrologic observations of the event are either incomplete, as most gaging stations were destroyed, or existing rating curves cannot be applied to the stage observations that exceeded high water marks (McMillan et al., 2012; Roggenkamp et al., 2024). Mohr et al. (2023) contains hydrograph and water level reconstructions for some gages. Based on field surveys Roggenkamp et al. (2024) derive a peak discharge between 1,000 m3 s−1 and 1,250 m3 s−1 for the Ahr river at gage Dernau, which is five times larger than the previous peak discharge on record.
The 2021 event is usually characterized as a pluvially triggered flash flood (e.g., Lehmkuhl et al., 2022). A high antecedent precipitation, as an important preconditioning of the subsurface water storage, in combination with shallow soils, in many cases steep valley slopes, high gradient valleys, and heavy, widespread, persistent precipitation, that supposedly caused infiltration as well as saturation excess overland flow, are often considered as the root causes for the flood, with a further intensification and modulation through morphodynamic changes and debris transport in the river valleys (Lehmkuhl et al., 2022; Mohr et al., 2023; Roggenkamp et al., 2024). Another common explanation in this context, with a focus on soil water retention, assumes that shallow soils on top of impermeable bedrock have high infiltration rates, especially in forested areas through macropores, but only little buffering capacity. Once soils are saturated, precipitation water propagates to the streams through fast interflow along preferential flowpaths on top of impermeable bedrock, with little overland flow outside the riverbeds.
In Ludwig et al. (2023) the operational flood forecasting model LARSIM is able to reproduce the reconstructed Ahr flood discharge for a selected gage, based on observed precipitation and a storyline approach with pseudo global warming atmospheric simulations. Also, the lumped conceptual GR4H model and the integrated surface-subsurface hydrological model (ISSHM) ParFlow in the DE06 setup and configuration, as described below, can realistically reproduce some hydrographs, based on improved radar precipitation products and adjusted Manning’s roughness coefficients (Saadi et al., 2023). However, given the complexity and the morphodynamic changes during the event, streamflow parametrization tuning seems unfeasible. Also, the hydrodynamics of the event could be simulated for the lower Ahr river downstream of Altenahr at spatial resolutions down to 1 m with the RIM2D and SERGHEI models by Khosh Bin Ghomash et al. (2024). In a counterfactual precipitation scenarios study, Voit and Heistermann (2024) can generate peak flows, which are on average up to a factor 2 higher than the reconstructed discharge.
Still knowledge gaps exist, and debates continue on the physical mechanisms that generated the 2021 flood event. For example, many of the analyses see preferential flow and surface runoff as drivers of the rapid streamflow response. What to our knowledge has not been considered so far is that a rapid subsurface stormflow in hillslopes in the (shallow) vadose zone and saturated zone can be triggered by an intense rainfall event, which introduces a significant amount of water into the subsurface. This can produce a pressure wave. The celerity, i.e., the speed at which this pressure wave propagates, is much faster than the Darcy flux velocity. Such a pressure wave can lead to rapid subsurface hydrologic response processes, e.g., groundwater flooding in the river valley convergence zones with shallow water tables, increased river baseflow, or saturation excess overland flow (Rasmussen et al., 2000; McDonnell and Beven, 2014; Zhao et al., 2017). We hypothesize that this might also be one of the drivers for the magnitude and the rapid rise of the hydrographs during the 2021 event.
In this context, we reconstruct the event with a 52-member ensemble of the ISSHM ParFlow (Kollet and Maxwell, 2006, 2008; Kuffour et al., 2020), including the Common Land Model. ParFlow is run at a spatial resolution of 611 m with 15 vertical subsurface model levels down to 60 m depth for a mid-European model domain and provides a spatially and temporally consistent high-resolution reconstruction of the flood event. These ParFlow simulations allow studying the flood and ponding height generating processes in a numerical laboratory approach complementing existing and ongoing discussions and analyses of the 2021 flood event.
Physics-based ISSHMs such as ParFlow, where 2D/3D surface and subsurface hydrodynamics are treated in continuum approach allow for an explicit simulation of transport processes and feedbacks, toward more realistic process and terrestrial water cycle representations. ISSHMs show, e.g., added value due to redistribution of surface and groundwater, streamflow aquifer interactions, ponding and flowing water in river convergence zones, evolution of river networks, km-scale heterogeneity, hill-slope processes, including human interventions, etc. (Clark et al., 2017; Kollet et al., 2017; Brookfield et al., 2023).
Based on the uncalibrated physics-based ISSHM ParFlow, through a process-based analysis, the goals of this study are: (i) To demonstrate the prognostic capabilities of the ParFlow/CLM DE06 ensemble—originally set up for water resources applications—to show whether the dynamics and magnitude of the July 2021 flood event are captured; and (ii) to further explore the physical mechanisms that generated the horrendous flood wave and water ponding heights of more than 7 m on the valley floor over extremely short time scales of only a few hours. However, as the modeling approach is limited in the detailed representation of the complex small-scale topography and hydrogeology of the catchments, does neither resolve nor include any morphodynamic changes during the event, and cannot consider impacts due to infrastructures such as dams or obstruction at bridges, an exact reproduction of the reconstructed events is neither intended nor expected. We also do not touch upon any forecast aspect backed by model skill scores, despite the fact that the ParFlow ensemble we use is based on a forecast simulation. While we focus our analyses on four strongly affected catchments of the rivers Ahr, Erft, Kyll, Vesdre (see the catchments highlighted in Figure 1), the ISSHM provides a hydrologic reconstruction of the event at the local scale over the complete Eifel-Ardennes region. The results encompass the complete state of the hydrologic system from groundwater across the variably saturated soil zone to the land surface including streams and vegetation and allow to interrogate the evaluation of the hydrologic states that led up to the event.
After a brief description of the study region (Section 2.1), the model setup is presented (Section 2.2). In the ensuing sections, we focus on the hydrometeorological evolution of the July 2021 floods (Section 3.1), before studying the discharge, subsurface storage, and precipitation evolution in four severely affected, meso-scale catchments (Sections 3.2 and 3.3). Section 4 discusses the findings and concludes with a summary and outlook.
2 Materials and methods
2.1 Geographic setting and scope of the study
The Eifel-Ardennes low mountain region ranges between 200 and 500 m altitude. Mountain peaks reach up to 750 m (Figure 1). The river network is characterized by narrow valleys. Soils are generally shallow and rocky, prevailing are Cambisols and Luvisols according to the SoilGrids database (Hengl et al., 2017). The region is characterized by an oceanic, moist climate. Long-term mean annual precipitation sums in the area range between 600 mm per year in rain-shadowed regions of the Lower Rhine Embayment to 1,400 mm in the elevated parts of the Ardennes-Eifel. The four catchments under consideration are the Ahr (753 km2), Erft (549 km2), and Kyll (835 km2) in Germany, and the Vesdre (669 km2) in Belgium. Typical long-term mean average river discharge for the gages in Figure 1 is about 7 m3s−1 at Altenahr (Ahr), 2.5 m3s−1 at Bliesheim (Erft), 9 m3s−1 at Kordel (Kyll) and 10.6 m3s−1 at Chaudfontaine (Vesdre) (DGJ, 2025; SPW-MI, 2025).
Extreme rainfall happened on 13 and 14 July (see Figure 1; Section 3.1) with main flood events taking place on 14 and 15 July 2021 with discharge peaks occurring in the afternoon of 14 July and the morning hours of 15 July in the most affected catchments (Mohr et al., 2023). Our study encompasses a timespan from Tuesday, 13 July 2021 12UTC, to Friday, 23 July 2021 12UTC. All analyses are done for Coordinated Universal Time; this 2 h time delay with respect to local time needs to be considered when comparing to in-situ reconstructions of the events.
Many drainage and river networks in the Eifel-Ardennes region and part of the Lower Rhine Embayment were affected, i.e., damage was wide-spread. Other areas in North Rhine-Westphalia, Belgium, and the Netherlands also experienced severe flooding, as well as parts of Southern Germany, Switzerland, and Austria where flooding, flash floods, and mudflows happened (Mohr et al., 2023). In the following, we delineate the effective river catchments of the applied hydrologic model with reference to some main gaging stations; these model-defined catchments coincide with the real catchments. The selected gages are close to the river mouths. Except for the Vesdre river, gages and analysis catchments are also selected to avoid highly managed catchments.
2.2 Hydrologic model and experimental forecasting setup
The hydrologic model used in this study is ParFlow v3.8 in its GPU version (Hokkanen et al., 2021), a parallel, fully coupled, physically based ISSHM. ParFlow simulates surface flow with a 2D kinematic wave equation which acts as the upper boundary condition for the subsurface flow with the 3D Richards equation in a continuum approach (Kollet and Maxwell, 2006, 2008; Kuffour et al., 2020). The ParFlow built-in Common Land Model (CLM) parameterizes the moisture, energy, and momentum balances and determines the flux partitioning at the land surface as a function of the time-variable external atmospheric forcing, vegetation properties, and external parameter fields, such as land cover or rooting depth (Maxwell and Miller, 2005; Kollet and Maxwell, 2008). Through the land surface energy budget CLM resolves net precipitation from evapotranspiration, and interception over vegetated surfaces, and infiltration. The ParFlow simulations of this study are taken from an experimental, quasi-operational forecasting system for a hydrologic Germany domain with 2,000 × 2,000 model grid points, centered over Germany at 611 m spatial resolution (DE06) (see inset in Figure 1 for the complete model domain). The DE06 setup, configuration, external parameter fields and their generation, as well as the experiment design are introduced for the first time in detail in Belleflamme et al. (2023). In the DE06 setup, ParFlow has 15 vertical layers with a variable grid spacing ranging from 0.02 m at the land surface to 18 m near the bedrock resulting in a depth of 60 m using a terrain-following grid. The land sea mask and the D4 slopes are calculated from the Advanced Spaceborne Thermal Emission and Reflection Radiometer (ASTER) Global Digital Elevation Model (GDEM) at about 30 m resolution (Abrams et al., 2020). A hydrologically adjusted DEM from the MERIT database is used to adjust the slopes to follow the river trajectories (Yamazaki et al., 2019). The static land cover information is from a 100 m resolution 2018 Corine v20 version (CLC2018) (EEA, 2018), which is transferred to 18 International Geosphere-Biosphere Programme (IGBP) land cover types, that are translated to Plant Functional Types (PFTs) of CLM. Soil hydraulic parameters (porosity, permeability, Van Genuchten (1980) parameters saturated and residual water content, alpha, and N values) are derived through a remapping to USDA soil texture classes from SoilGrids v2017 at 250 m resolution (Hengl et al., 2017) and for hydrogeology the International Hydrogeological Map of Europe 1:1,500,000 (IHME) hydrogeological types are used (Duscher et al., 2015). Supplementary Figure S1 gives a spatial overview of some of the most relevant external parameters. The model timestep as well as the output interval is 1 h. ParFlow simulates the complete 3D subsurface water budget as well as the interactions at the surface. It must be emphasized that the DE06 simulations have undergone a careful setup and configuration (see Belleflamme et al., 2023) combined with a multi-decadal spinup, but other than that, the model is not calibrated or tuned at all, e.g., for soil moisture distributions or discharge.
Our flood event reconstruction makes use of three types of simulations taken from the stream of ParFlow DE06 hydrologic forecast simulations. The analysis timespan ranges from Tuesday, 13 July 2021 12UTC, to Friday, 23 July 2021 12UTC, encompassing the 14 and 15 July main event days and a single forecast initialization and time frame. The baseline is the 10-day deterministic DE06 ParFlow forecast driven by the ECMWF HRES deterministic weather forecast (Owens and Hewson, 2018) at 1 h temporal and 0.1 deg. spatial resolution (resampled to the 611 m ParFlow grid) as atmospheric forcing (ParFlow-HRES). To sample a large range of atmospheric conditions and precipitation forecasts, additional 50 ParFlow DE06 10-day forecast ensemble members are considered (ParFlow-ENS), driven by the 50-member ECMWF ENS probabilistic weather prediction ensemble. ParFlow-HRES and -ENS use the same initial conditions of 2021-07-13 12UTC, based on the ParFlow-CLIM climatology run. ParFlow-CLIM consists of a sequence of seamlessly concatenated 24 h deterministic ParFlow-HRES forecasts from 12UTC to 12UTC of the following day. ParFlow-CLIM simulations are initialized at 2007-01-01 from a multi-decadal spinup. Except for the atmospheric forcing, all simulations of the study use the same configuration and explicitly calculate overland flow.
The ParFlow DE06 forecasts are not associated with any official hydrologic forecasting or early warning system, the production is research-driven without any mandate or data delivery obligation. However, as the ISSHM is run daily since the beginning of 2021, is based on an automatic workflow, with a strict forecast clock, covers a national level, uses operational weather forecasts as a driver, and has been run with only few interruptions, we term the system “quasi-operational.”
The ParFlow model has been extensively tested, validated, and used in many different types of applications, Kuffour et al. (2020) provide an overview. Related to the flood event simulation skills of ParFlow needed for this study, Kollet et al. (2017) demonstrate in their ISSHM intercomparison study the physical models’ capability to simulate, e.g., hill-slope processes in an idealized tilted v-catchment setup. Lapides et al. (2020) find a good agreement of ParFlow’s overland flow simulation with an analytical solution to the kinematic wave equation and lab experiments. In a real data parameter and input uncertainty study, Pomeon et al. (2020) use a high resolution ParFlow for flash flood hindcasting with NSE values of up to 0.85.
The ParFlow DE06 setup and configuration underlying this study was evaluated by Belleflamme et al. (2023) with respect to important water cycle components: monthly volumetric soil moisture anomalies from 2011 to 2020 show a spatial mean root mean square error (RMSE) of 0.02m3 m−3 when compared to ESA CCI satellite data, and a Pearson correlation coefficient (r) of >0.5 for 80% of the grid elements; evapotranspiration is compared to the GLEAM dataset with an RSME of 0.15 mm day−1 and r > 0.5 for 86% grid elements; water table depth yields in a comparison with 5,799 wells from 2011 to 2016 an RSME of 0.32 m and r > 0.5 for 49% of the wells; river discharge at 231 GRDC gages shows from 2011 to 2019 a r > 0.5 at 96% of the gages and at 70% of the gages the Nash–Sutcliffe efficiency score (NSE) is improved compared to the mean flow benchmark. The ParFlow DE06 setup and configuration is also used in Saadi et al. (2023) who can reproduce reconstructed Eifel rivers’ hydrographs in model parameter and atmospheric forcing sensitivity study. Thus, we are confident that the relevant processes are adequately represented in the model and provide a consistent and interpretable spatiotemporal view of the event.
3 Results
3.1 Atmospheric drivers and soil moisture evolution
The synoptic situation characterizing the low-pressure system which caused the wide-spread large rainfall amounts (see Figure 1) has been extensively analyzed, e.g., by the DWD (Junghänel et al., 2021), the RMI (2021), or the ECMWF (2021) and comprehensive analysis in Ludwig et al. (2023). The ECMWF HRES and ENS41 weather forecasts, Figures 2A–D,I–K taken from the ParFlow-HRES and ParFlow-ENS41 atmospheric forcing, show that the flood-causing rain events were mainly restricted to July 13 and July 14 along a stationary front. We show the ENS41 ECMWF weather forecast ensemble member as it yields the highest discharge in our simulations (see Section 3.2). According to the meteorological analysis by the DWD (Junghänel et al., 2021), based on the observational HYRAS dataset (Razafimaharo et al., 2020), the 30-year July spatio-temporal average precipitation for the Ahr catchment is 70 mm vs. 115 mm 72 h−1 from July 12 to 14; for the Erft catchment numbers are 68 mm month−1 vs. 130 mm 72 h−1, and for the Kyll catchment 73 mm month−1 vs. 126 mm 72 h−1. Precipitation rates during July 13 were on average below 25 mm day−1 for the German catchments. The maximum hourly precipitation rates anywhere in the catchment from RADOLAN observations were 24.3 mm h−1 for the Ahr, 31.8 mm h−1 for the Erft, 24.4 mm h−1 for the Kyll, and 17.0 mm h−1 for the Vesdre throughout July 13 and 14. This suggests that sustained, wide-spread intense rainfall, instead of convectively driven rain bursts, triggered the flood, which resulted ultimately in saturation excess instead of infiltration excess runoff production. Most rain gage precipitation amounts reached record highs beyond 100-year return periods; many measured more than 150 mm in 24 h (Junghänel et al., 2021). Considering the HYRAS numbers above it should be noted that the RADOLAN radar observations are exceeded in the radar climatology RADKLIM dataset by DWD (Winterrath et al., 2017) with more widespread > 100 mm 72 h−1 precipitation, or quantitative precipitation estimates products in Saadi et al. (2023) with > 150 mm 24 h−1.
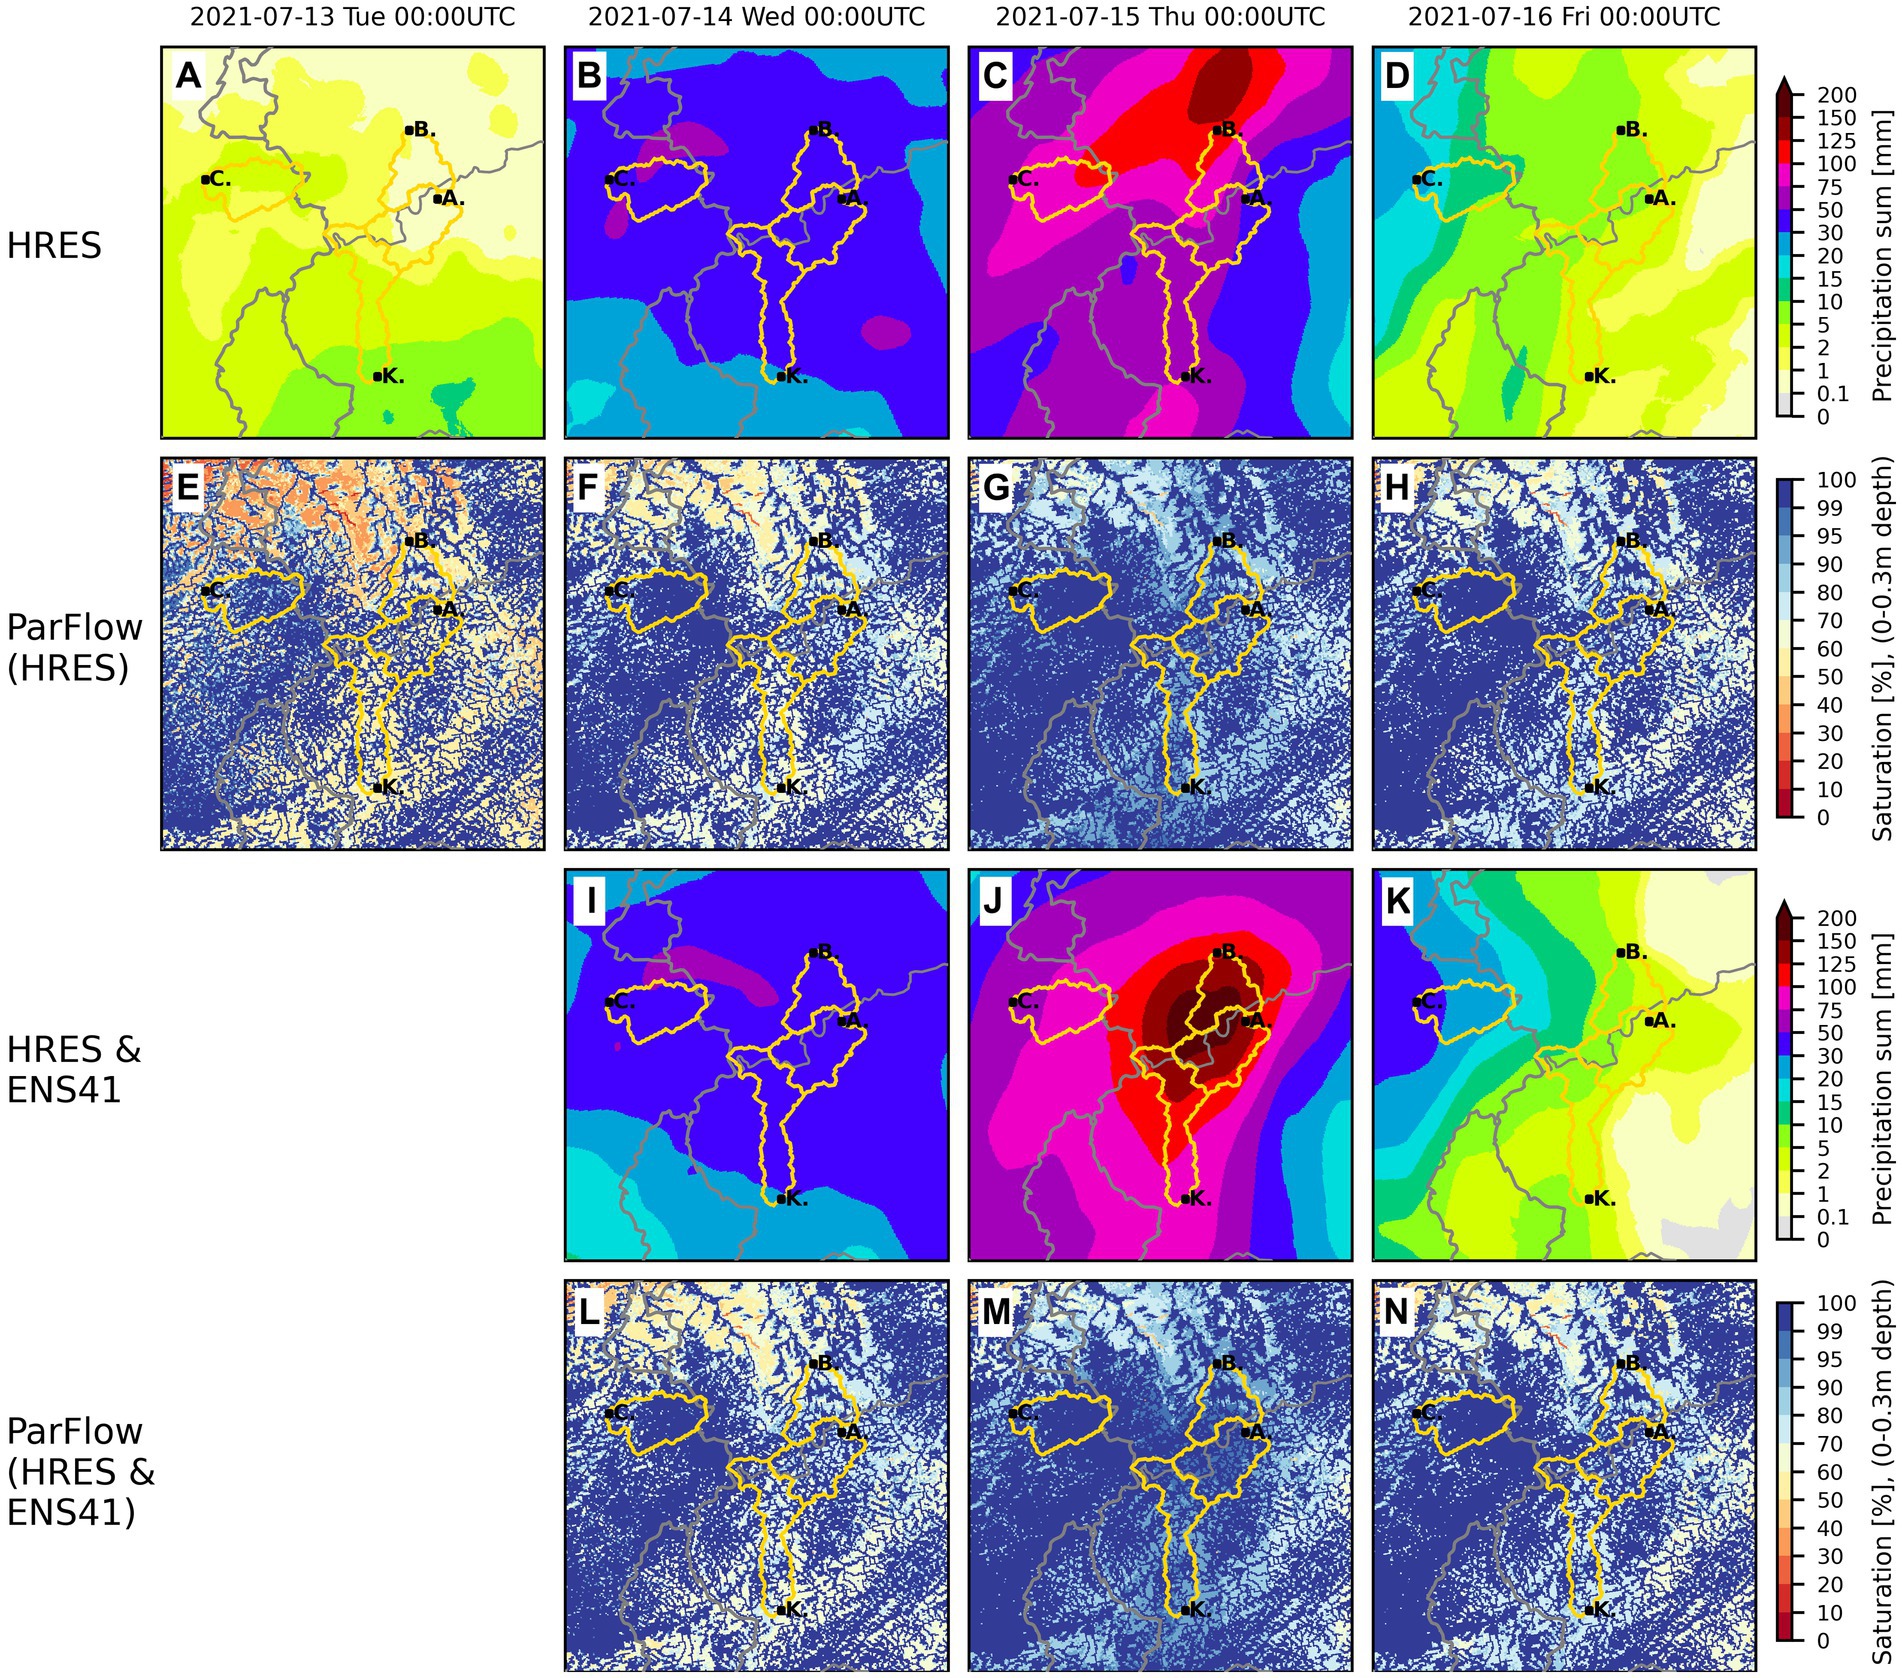
Figure 2. Temporal evolution of precipitation and soil moisture over the study area. First row (A–D): 24 h precipitation sums [mm d−1] from ECMWF HRES deterministic forecasts at the time indicated above the plot. Second row (E–H): Soil water saturation [%], instantaneous field at 00UTC, mean of the upper 0.3 m (5 model layers) from ParFlow-HRES. Third and fourth row (I–N): As (A–H), but for ECMWF ENS41 forecast and ParFlow-ENS41 simulation. The instantaneous soil water saturation always results from the field of 24 h precipitation sums shown above. Because the ParFlow-HRES and -ENS41 runs are started at 2021-07-13 12UTC with the same initial conditions, the HRES and ENS41-based fields in column 1 are the same; the precipitation sums at 2021-07-14 00UTC (B) are a combination of HRES (00 to 12UTC) and ENS41 (12 to 24UTC). Please note the non-linear scaling of the color bars.
The ECMWF forecasted daily precipitation sums in Figure 2 resemble the order of magnitude of the aforementioned precipitation amounts from different observational products. The smooth precipitation fields result from the bicubic resampling of the atmospheric forecasts to the 611 m ParFlow grid. As outlined in the introduction, our study does not depend on an exact reproduction of the observed hydrometeorological extreme events in terms of the spatial distribution, timing, and precipitation rates, as our interest is in the dynamics and the physical mechanisms of the event. The ECMWF HRES 24 h accumulated precipitation field of 2021-07-15 00UTC (Figure 2C) does not resemble the radar-based observation of Figure 1, irrespective of the difference in the aggregation time span. Using the same color scale, ECMWF ENS41 more closely resembles the peak precipitation in the center of the analysis domain and the vicinity of the affected rivers’ source areas; for many grid elements more than 150 mm total precipitation were forecasted on for July 14 (Figure 2J).
In both ParFlow simulations shown, the intense precipitation, especially during 14 July (Figures 2A–D,I–K), results in a sharp increase in instantaneous soil water saturations of the upper 0.3 m in Figures 2E–H,L–N which coincides with the spatial distribution of precipitation. In ParFlow-HRES the spatial average soil water saturation over the entire analysis region (Figure 1) increases from 70% on 13 July at 00UTC to 75% saturation on 14 July and to 88% on 15 July. Hence, the soils in large parts of the catchments still have some capacity to store parts of the precipitation at the onset of the event. Spatial averages over the four analysis catchments show maximum saturation values between 91% for the Erft and 97% for the Vesdre catchment. From the four analysis catchments, the Vesdre catchment in ParFlow-CLIM shows a notably different preconditioning Figure 2E with saturations greater than 95% for most grid elements and nearly full saturation at the onset of the event (Figures 2F,L). Section S2 of the supplement contains a comparison of the ParFlow volumetric soil moisture to the ESA-CCI satellite observations.
3.2 Flood characteristics
Figure 3 shows the hydrographs at Altenahr, Bliesheim, Kordel, and Chaudfontaine gage locations (see Figures 1, 2). Discharge is derived from ParFlow’s overland flow calculation at these locations in the river convergence zones.

Figure 3. Discharge (Q) [m3s−1] for four gages of the analysis catchments. (A) Ahr river catchment, gage Altenahr, (B) Erft river catchment, gage Bliesheim, (C) Kyll river catchment, gage Kordel, (D) Vesdre river catchment, gage Chaudfontaine. Note the initialisation time at 2021-07-13 12UTC from the ParFlow-CLIM simulation from where the different model realizations diverge (ParFlow-CLIM, -HRES, -ENS[1...50]). Blue solid line: ParFlow-HRES; bright blue solid line: ParFlow-CLIM; blue/bright blue shaded area: minimum and maximum / 25th and 75th quantile of ParFlow-ENS[1…50]; blue dashed line: median of ParFlow-ENS; thick blue dotted line: hydrograph of peak discharge ParFlow run (HRES and ENS-41) (HRES causes peak discharge for Chaudfontaine); red solid line: pre-July 2021 observed peak discharge in [m3s−1] from DGJ (2025) and SPW-MI (2025); gray numbers (Qpeak_rec), upper right corner: estimated and reconstructed 2021 flood discharge in [m3s−1] from Dewals et al. (2021) and Mohr et al. (2023).
The ParFlow-HRES baseline Altenahr and Chaudfontaine hydrographs (Figures 3A,D) are characterized by steep rises during 14 July afternoon and peak discharge during the night from 14 to 15 July and during the day of 15 July, as an immediate response to the precipitation forcing (Figures 2, 4). The ParFlow-HRES Kordel and Bliesheim hydrographs show a similar behavior, albeit with a much lower peak discharge (Figures 3B,C). In all cases the historical pre-July 2021 maximum discharge values for the investigated gages Altenahr (HHQ = 236m3s−1), Bliesheim (HHQ = 56m3s−1), Chaudfontaine (HHQ = 275m3s−1), Kordel (HQQ = 218m3s−1) (DGJ, 2025; SPW-MI, 2025) are clearly exceeded (except for Kordel) in the ParFlow simulations (Figure 3), which agrees with observed event exceedances of water levels as compiled soon after the event in Kreienkamp et al. (2021). Except for Chaudfontaine the daily 12UTC reinitialized ParFlow-CLIM discharge matches ParFlow-HRES which hints to a good HRES forecast skill and indicates that the frequent atmospheric forcing reinitialization in ParFlow-CLIM does not affect the simulation’s temporal consistency.
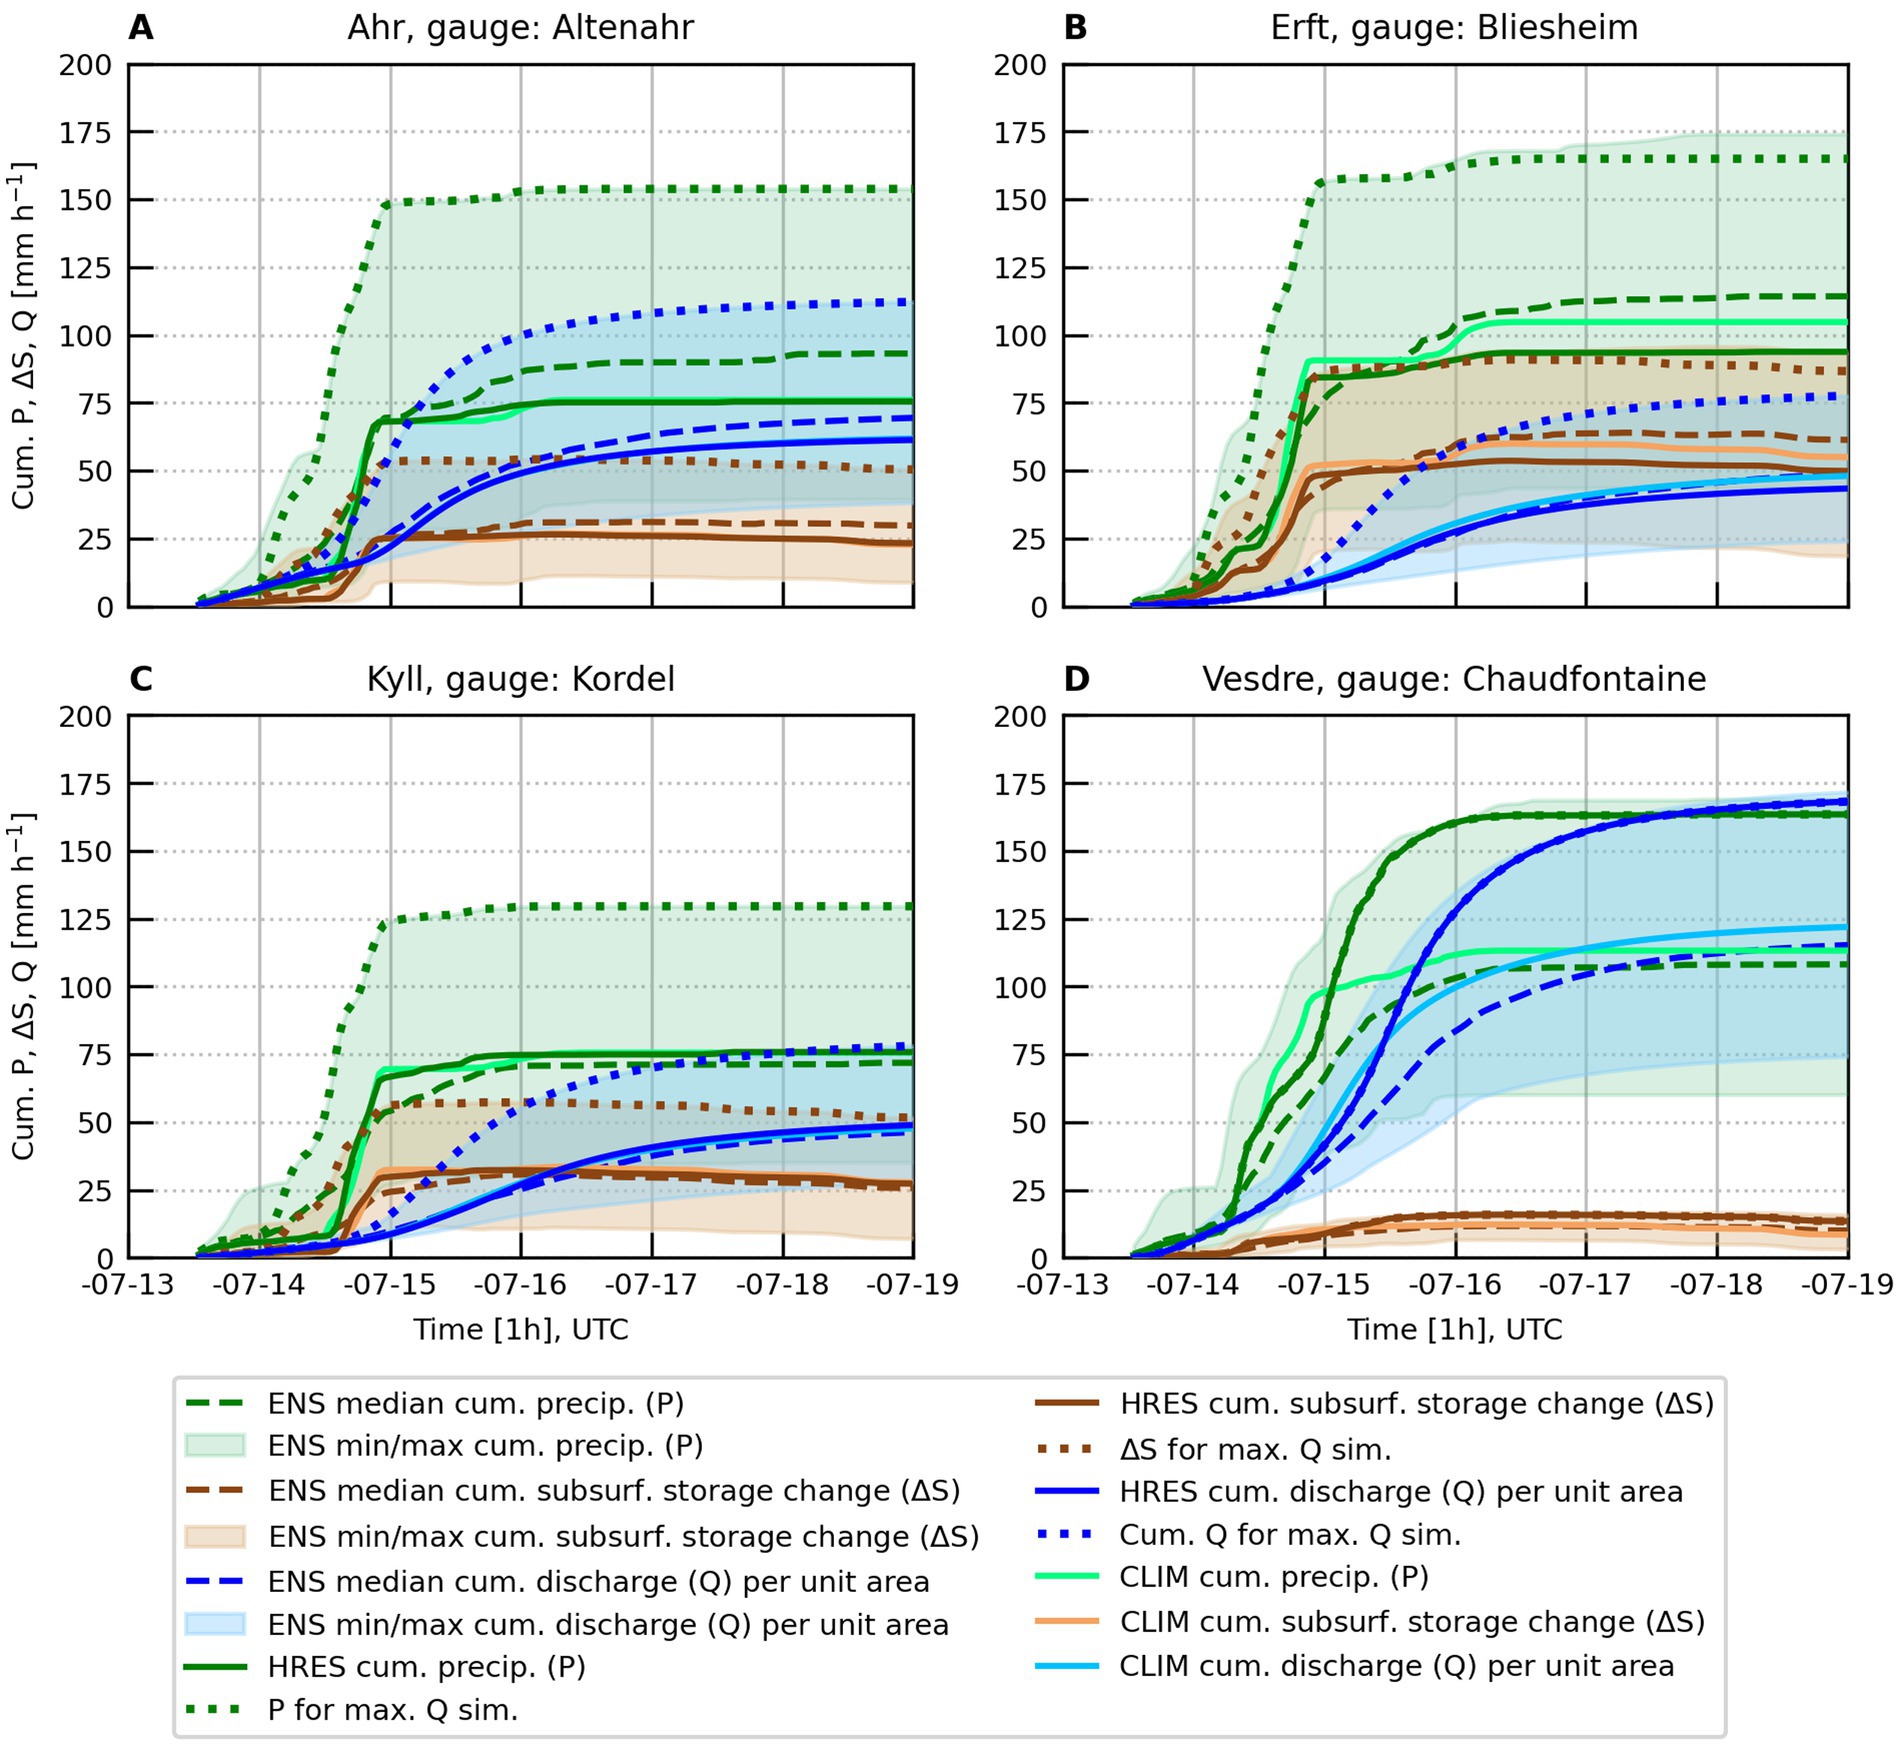
Figure 4. For the gaged catchment areas as defined in Figures 1, 2 of the (A) Ahr, (B) Erft, (C) Kyll, (D) Vesdre catchments: Cumulative precipitation (P, green colors), discharge (Q, blue colors), and total subsurface storage change (ΔS, brown colors) per unit catchment area in [mm h−1] with respect to 2021-07-13 12UTC. Light green: ECMWF-HRES precipitation for ParFlow-CLIM; green: ECMWF-HRES precipitation for ParFlow-HRES; green shading: minimum and maximum of ECMWF-ENS[1…50]; green dashed line: median of ECMWF-ENS[1…50]; thick green dotted: precipitation of peak discharge ParFlow runs (HRES and ENS-41). Light blue/brown solid line: ParFlow-CLIM discharge/storage; blue/brown solid line: ParFlow-HRES discharge/storage; blue/brown shaded area: ParFlow-ENS[1…50] minimum and maximum discharge/storage; blue/brown dashed line: ParFlow-ENS[1…50] median discharge/storage; thick blue/brown dotted line: discharge/storage of peak discharge ParFlow runs (HRES and ENS-41). For Chaudfontaine peak discharge is caused by HRES and curves are overlain.
The large precipitation bandwidth in the ECMWF driving data ensemble with reference to timing, total amounts, intensity, and spatial distribution (data not shown) leads to highly differing hydrographs and discharge peaks simulated by ParFlow, as indicated by the shading in Figure 3. In a study by Saadi et al. (2023), that investigated the effect of different quantitative precipitation estimate datasets from meteorological radar observations, ParFlow peak discharge with a DE06-derived configuration also shows a large bandwidth.
The ParFlow-ENS41 for Altenahr, Bliesheim, and Kordel and ParFlow-HRES for Chaudfontaine yield the highest peak-flows. Although the study’s primary goal is not to exactly reproduce the event, the ISSHM ParFlow can capture the timing, evolution, and the order of magnitude of the reconstructed event remarkably well, if only those ParFlow simulations out of the 52 simulations are considered which yield the highest discharge (thick blue dotted line in Figure 3). The behavior of this hindcast ensemble clearly underlines the importance of using large atmospheric forcing data ensembles and many hydrologic ensemble members, as emphasized also, e.g., by Cloke and Pappenberger (2009) or Harrigan et al. (2023).
Mohr et al. (2023), their Table 1 and Figure 6 for Germany, and Dewals et al. (2021) for Belgium give overviews of the event’s approximated hydrographs and water stages or peak discharge values, that could be estimated or reconstructed (Figure 3, gray numbers in the plots), despite largely incomplete hydrologic observations due to many destroyed gaging stations, and the fact that empirical water stage-discharge relationships are not applicable under such extreme flood conditions.
The event’s extremeness becomes even more obvious when considering the detailed reconstructions and event descriptions in DGJ (2025), Mohr et al. (2023) or Roggenkamp et al. (2024). The long-term mean discharge of the Ahr river at gage Altenahr is 6.3m3s−1; the daily mean discharge was approximated to about 600 m3s−1 (±50 m3s−1) on July 15, as opposed to the previously highest daily mean of 162 m3s−1 on 21 December 1993. On 14 July the water level was about 1 m at 10UTC, which equals about 60m3s−1 discharge, reaching about 550 m3s−1 between 19 and 20 CEST before the measurements ceased. In the Roggenkamp et al. (2024) reconstruction a peak discharge is quantified between about 1,000 m3s−1 and 1,250 m3s−1 with a water level above the riverbed of about 6 m for the place of Dernau, shortly downstream of gage Altenahr. These values exceed the previous highest peak on instrumental record of about 236 m3s−1 with water levels of about 3.7 m on 2 June 2016 by up to a factor of 5 (DGJ, 2025; Roggenkamp et al., 2024).
One of the main results of this study is the proven capability of the ParFlow ISSHM, in its DE06 setup and configuration designed for water resources forecasts, to capture the extreme July 2021 flood event without any additional calibration or tuning.
3.3 Storage buffer characteristics
To better understand the ambient hydrologic conditions that led to the event and its evolution, we estimate and inspect the storage buffer of the different watersheds, which strongly impacts the onset and peak of flooding. Figure 4 juxtaposes the cumulative precipitation forcing and discharge responses at the gages per unit catchment area of the different ParFlow simulations, and in addition also the total subsurface water storage change since the start of the simulation. The storage is calculated from the relative saturation output of ParFlow, based on the model porosities and layer thicknesses.
In our purely model-based assessment, the July 2021 hydrometeorological extreme event is constrained to 14 and 15 July. The large precipitation bandwidth of the ECMWF-ENS ensemble, ranging for example in the Ahr catchment from precipitation totals from 2021-07-13 12UTC to -07-15 00UTC from about 15 mm 36 h−1 to about 150 mm 36 h−1 is characteristic for all catchments. For the actual event, the ECMWF-HRES sums and the median of the ECMWF-ENS show a similar behavior. The steep and steady rise of ECMWF-HRES and ECMWF-ENS median cumulative precipitation in the forecasts agrees with the assessment from Section 3.1. Precipitation fell nearly entirely during the 2nd half of 14 July and caused the extreme runoff generation and flooding in the Kyll and Ahr river valleys and along the Erft in the Lower Rhine Embayment region late on 14 July and on 15 July. The Vesdre catchment received about the same amount of precipitation during 14 July, but with an earlier onset and a slower temporal evolution of the flooding.
The order of magnitude of ECMWF-HRES precipitation totals matches with radar observations (see Figure 1) and analyses in Ludwig et al. (2023) or Saadi et al. (2023), however with an underestimation of about 15-20 mm 36 h−1 for the Ahr, Erft, and Kyll catchments (data not shown). The coarser resolution atmospheric model runs, such as the 9 km resolution ECMWF-HRES and 18 km -ENS datasets are typically associated with a lower extreme event precipitation intensity (e.g., Ban et al., 2021). This also shows with the highest precipitation sums (which also cause the highest discharge). Precipitation rates between the ECMWF-ENS41 and ECMWF-HRES are very similar, however the ECMWF-ENS41 precipitation onset is about 12 h earlier in case of Ahr, Erft and Kyll catchments and yields eventually about double the precipitation amount than ECMWF-HRES. In general, many ECMWF-ENS ensemble members produce plausible precipitation amounts.
The lower slopes of the cumulative runoff as opposed to the cumulative precipitation indicate that water continues to infiltrate. The Ahr and Kyll catchments show a behavior where on average about one third of the total precipitation is buffered by the subsurface. For the Erft catchment buffering capacity is about half of the precipitation. In the Vesdre catchment with higher initial saturation levels (Figure 2) and less subsurface buffer, about all precipitation is transformed into discharge, with a time lag of about 24 h. The ratios of storage change to the precipitation sum ratios remain similar for all simulations per catchment, starting off from the same initial conditions at 2021-07-13 12UTC, which indicates that infiltration continued and storage capacity is not yet exceeded.
Per unit catchment area, the cumulative discharge-precipitation ratios at 2021-07-17 00UTC for the highest discharge simulations are 71% (ParFlow-ENS41) (110 mm discharge vs. 155 mm precipitation) for the Ahr, 46% (73 mm discharge vs. 160 mm precipitation) for the Erft, 57% (74 mm discharge vs. 129 mm precipitation) for the Kyll, and 96% (ParFlow-HRES) (157 mm discharge vs. 163 mm precipitation) for the Vesdre.
This, as well as the fact that the ENS precipitation ensemble and runoff ensemble do only partly overlap, indicates a substantial buffering capacity in the modeled system, which is reflected also in the estimation of the cumulative subsurface water storage change (Figure 4). The modeled buffering capacity also reduces the spread in the hydrological response with respect to the atmospheric forcing in almost all catchments.
The 2nd main result of the study is that for the Ahr, Erft, and Kyll catchments between about 30 and 50% of the precipitation can infiltrate, avoiding even higher discharge peaks, despite already high antecedent soil moisture saturation. For the Vesdre catchment with less subsurface buffer, about all precipitation transforms into discharge.
4 Discussion
In this study, we used the ISSHM ParFlow in a high-resolution experimental, quasi-operational forecasting setup for water resources assessments, to provide a spatially and temporally consistent event reconstruction and an analysis of the hydrologic characteristics and physical mechanisms that led to the extreme July 2021 flood event and its evolution in the Eifel-Ardennes low mountain range in western Germany and eastern Belgium.
In a purely simulation-driven numerical laboratory approach, without specific additional calibration or tuning, ParFlow with the DE06 setup and configuration can reproduce the extreme July 2021 flood event in a hindcast ensemble with a lead time of 24 h in terms of magnitude, timing, and location when compared to available information from detailed reconstructions of the floods. This is also due to the driving ECMWF-HRES and -ENS precipitation forecasts, whose large variance encompasses the observed precipitation amounts.
In terms of the hydrologic modeling, the study shows that an uncalibrated physically based ISSHM can simulate extreme events that are beyond the currently available observational data records, which arguably renders calibration meaningless. This demonstrates the prognostic capabilities of the ParFlow DE06 ensemble. Thus, the proposed modeling approach is an applied, highly versatile monitoring and forecasting system especially useful in ungaged or data-scarce regions, and when trans-regional or transnational exchange of data is limited. The high-resolution model approach, that can be run efficiently on state-of-the-art GPU-clusters, cannot only be used for water resources applications, but is able to capture the sub-daily dynamics of extreme flooding and provide useful information at the local scale.
Despite the successful reproduction of the July 2021 flood event, the simulation-driven numerical laboratory approach has uncertainties and limitations which affect the results. For example, external surface and subsurface parameters are simplified. The ParFlow DE06 setup uses a very recent, but static land cover dataset. The soil and subsurface hydraulic properties, i.e., the description of the complex hydrogeology of the Eifel-Ardennes region, are based on SoilGrids soil texture classes, which are reclassified into U. S. Department of Agriculture (USDA) soil types to be used with the USDA ROSETTA pedotransfer function model (Schaap et al., 2001) for Van Genuchten parameters. Below the SoilGrids depth-to-bedrock the permeability, porosity, Van Genuchten parameters saturated and residual water content, n and alpha, are assigned to IHME hydrogeological types. In the DE06 setup, the Manning’s surface roughness coefficient is constant; in their study on the July 2021 flood, Saadi et al. (2023) used spatially varying Manning’s parameters to obtain reconstructed peak discharge, which may help to adjust the model to changing morphodynamics in the river valleys during the event. The 611 m horizontal grid spacing does not resolve the very steep and narrow river valleys of the Eifel-Ardennes mid mountain ranges; the scale-consistent river parameterization as developed by Schalge et al. (2019) for ParFlow is not used. A first order uncertainty additionally exists through the atmospheric forcing data. In our study this is accounted for by using the 50-member ECMWF-ENS forecast in conjunction with the ECMWF-HRES forecast, which introduces a considerable resolution gap (18 km and 9 km versus 0.611 km). Even for high-resolution meteorological radar quantitative precipitation estimates, Saadi et al. (2023) documented underestimations of the RADOLAN data of up to 20%. Because the hindcast ensemble is based on quasi-operational forecasting simulations and the goal is to demonstrate the capabilities of this quasi-operational setup, we only consider precipitation induced uncertainties.
Note, ParFlow ISSHM in the DE06 setup reaches reconstructed discharge magnitudes (Figure 3) at the four analysis gages, when those hydrologic model ensemble members (ParFlow-ENS41, ParFlow-HRES) are considered that are driven by the highest cumulative precipitation amount from the atmospheric forecasts. By tuning (reducing) Manning’s coefficient with historical flood events and landscape and soil heterogeneity in the DE06 setup, Saadi et al. (2023) simulate the reconstructed peak discharge also with a precipitation forcing equivalent to ECMWF-HRES. In this study, because DE06 is always forced with an atmospheric ensemble, the event is albeit captured. Also, ECMWF-HRES is close to RADOLAN precipitation sums, which are arguably too low when compared to quantitative precipitation estimates based on different radar retrieval algorithms in Saadi et al. (2023) or with reprocessed RADKLIM data (Winterrath et al., 2017; DWD, 2025). Furthermore, the extensive DE06 evaluation by Belleflamme et al. (2023) yields good agreement with observations and the DE06 setup and configuration needs to be suitable for a wide range of applications and catchments without additional tuning. Because of the physical consistency of the ISSHM ParFlow simulations, the DE06 ensemble can be used to further explore the physical mechanisms that generated the widespread extreme flood and water ponding heights in Eifel-Ardennes valleys during the 2021 event. Due to the surface and subsurface water interaction, the dynamics of the 2021 flood event in our modeling study are different than those of flash floods, that develop rapidly and are dominated by infiltration excess overland flow.
An important driving mechanism for the extreme July 2021 flood event was sustained, intense rainfall over a timespan of about 12 h over the almost complete area of the catchments under consideration. The high average amounts of catchment-wide precipitation might have caused fast pressure responses of the drainage system in the center of the valleys, leading to rapidly rising hydrographs and eventually high discharge peaks along the river networks. Considering the ParFlow-ENS41 simulation in the Ahr, Erft, and Kyll catchments, we hypothesize that the slope of the cumulative discharge per unit catchment area in Figure 4, which is smaller than the slope for cumulative precipitation and subsurface storage change, might be indicative of a relatively slow interflow, i.e., the contribution to the river discharge at the gage is delayed due to slow subsurface water movement. The fast reaction of the hydrograph at the gages (Figure 3, dotted lines) with only little temporal delay to the precipitation signal (Figure 4, dotted lines) might however be an indication of a strong and fast pressure response in the subsurface, i.e., a pressure wave, induced by heavy precipitation loading, that propagated quickly through saturated soils eventually leading to high exfiltration in the river valleys, i.e., the convergence zones, with high water tables, accompanied by little sheet flow outside the river channels.
The initial soil moisture state is highly relevant in the initiation and evolution of flooding, especially with widespread intense precipitation events that affect the complete catchment, because soil moisture storage acts as an effective precipitation buffer (Merz et al., 2020). However, contrary to common beliefs, a considerable soil moisture buffer exists in our study during the onset of the event. Also, given the complex topography, and varying valley cross sections with funneling effects and blocking situations due to debris, accurate discharge forecasts are arguably impossible under these conditions. Thus, instead of focusing only on discharge, the study additionally interrogated the spatiotemporal evolution of the storage buffer characteristics, which are a key factor in the generation and magnitude of the flood event.
In the simulations, the upper soil in the Ahr, Erft and Kyll catchments can buffer between about one third to one half of the precipitation that does not contribute immediately to the streamflow response. This in turn suggests that under higher ambient soil moisture conditions at the beginning of the precipitation event, discharge and peak flows may be even larger, which is disconcerting in view of the experienced catastrophic destruction and loss of lives. In case of the Vesdre catchment, due to its initial moisture state with higher soil water saturation levels, the buffering capacity is lower; hence more runoff is simulated in comparison to the other catchments.
This study adds a process-based analysis to the body of existing literature on the 2021 Eifel-Ardennes flood. With the ParFlow DE06 setup and configuration the capability of a transferable, uncalibrated ISSHMs is demonstrated to identify a combination of critical hydrometeorological system states in advance of an extreme event and to simulate and reconstruct the flood event based on simulated initial conditions. Given the large ensemble precipitation spread with even higher plausible daily precipitation sums, and the importance of the soil water buffer, sensitivity studies could be designed to systematically quantify the discharge behavior of flood-prone mesoscale catchments with similar topographic conditions under different initial soil moisture conditions in combination with large-scale, extreme precipitation ensembles.
Data availability statement
The datasets presented in this study can be found in online repositories. The names of the repository/repositories and accession number(s) can be found at: https://doi.org/10.26165/JUELICH-DATA/GROHKP.
Author contributions
KG: Conceptualization, Data curation, Formal analysis, Funding acquisition, Investigation, Methodology, Project administration, Resources, Software, Supervision, Validation, Visualization, Writing – original draft. AB: Conceptualization, Data curation, Formal analysis, Methodology, Resources, Software, Visualization, Writing – original draft. SH: Data curation, Resources, Software, Writing – original draft. JV: Conceptualization, Methodology, Supervision, Writing – original draft. SK: Conceptualization, Formal analysis, Methodology, Resources, Software, Supervision, Writing – original draft.
Funding
The author(s) declare that financial support was received for the research and/or publication of this article. This study was supported by the Helmholtz Association Knowledge Transfer project ADAPTER (WT-0104) and through the BMBF BioökonomieREVIER funding scheme with its “BioRevierPlus” project (funding ID: 031B1137D/031B1137DX) with its Innovation Laboratory Digital Geosystem Rhineland Region. The authors gratefully acknowledge the Earth System Modeling Project (ESM) for funding this work by providing computing time on the ESM partition of the supercomputer JUWELS at Jülich Supercomputing Centre (JSC).
Acknowledgments
The RADOLAN precipitation radar data are from the German Weather Service (DWD). Acknowledgement is made also for the use of ECMWF’s computing, archive facilities and data in this research. We acknowledge the supercomputing support as well as computational and storage resources provided to us by the Jülich Supercomputing Centre (JSC) through the Simulation and Data Laboratory Terrestrial Systems of the Centre for High-Performance Scientific Computing in Terrestrial Systems (Geoverbund ABC/J) and the JSC, Germany.
Conflict of interest
The authors declare that the research was conducted in the absence of any commercial or financial relationships that could be construed as a potential conflict of interest.
Generative AI statement
The authors declare that no Gen AI was used in the creation of this manuscript.
Publisher’s note
All claims expressed in this article are solely those of the authors and do not necessarily represent those of their affiliated organizations, or those of the publisher, the editors and the reviewers. Any product that may be evaluated in this article, or claim that may be made by its manufacturer, is not guaranteed or endorsed by the publisher.
Supplementary material
The Supplementary material for this article can be found online at: https://www.frontiersin.org/articles/10.3389/frwa.2025.1571704/full#supplementary-material
Abbreviations
ASTER, Advanced Spaceborne Thermal Emission and Reflection Radiometer; CLC, Corine Land Cover; DE06, ParFlow Setup for Hydrological Germany at 611 m Horizontal Grid Spacing; GDEM, Global Digital Dlevation Model; GRDC, Global Runoff Data Center; IGBP, International Geosphere-Biosphere Programme; ISSHM, Integrated Surface-Subsurface Hydrologic Model; IHME1500, International Hydrogeological Map of Europe 1:1,500,000; LARSIM, Large Area Runoff Simulation Model; MERIT, Multi-Error-Removed Improved-Terrain; PFT, Plant Functional Types; RADOLAN, Radar-Online-Aneichung; RADKLIM, Radarklimatologie; USDA, U. S. Department of Agriculture.
References
Abrams, M., Crippen, R., and Fujisada, H. (2020). ASTER global digital elevation model (GDEM) and ASTER global water body dataset (ASTWBD). Remote Sens. 12:1156. doi: 10.3390/rs12071156
Ban, N., Caillaud, C., Coppola, E., Pichelli, E., Sobolowski, S., Adinolfi, M., et al. (2021). The first multi-model ensemble of regional climate simulations at kilometer-scale resolution, part I: evaluation of precipitation. Clim. Dyn. 57, 275–302. doi: 10.1007/s00382-021-05708-w
Belleflamme, A., Goergen, K., Wagner, N., Kollet, S., Bathiany, S., El Zohbi, J., et al. (2023). Hydrological forecasting at impact scale: the integrated ParFlow hydrological model at 0.6 km for climate resilient water resource management over Germany. Front. Water 5:1183642. doi: 10.3389/frwa.2023.1183642
Brookfield, A. E., Ajami, H., Carroll, R. W. H., Tague, C., Sullivan, P. L., and Condon, L. E. (2023). Recent advances in integrated hydrologic models: integration of new domains. J. Hydrol. 620:129515. doi: 10.1016/j.jhydrol.2023.129515
Clark, M. P., Bierkens, M. F. P., Samaniego, L., Woods, R. A., Uijlenhoet, R., Bennett, K. E., et al. (2017). The evolution of process-based hydrologic models: historical challenges and the collective quest for physical realism. Hydrol. Earth Syst. Sci. 21, 3427–3440. doi: 10.5194/hess-21-3427-2017
Cloke, H. L., and Pappenberger, F. (2009). Ensemble flood forecasting: a review. J. Hydrol. 375, 613–626. doi: 10.1016/j.jhydrol.2009.06.005
Cornwall, W. (2021). Europe's deadly floods leave scientists stunned. Science 373, 372–373. doi: 10.1126/science.373.6553.372
Davies, R. (2021a). Germany – Fatalities, Evacuations, Dozens Feared Missing After Severe Flooding. Available online at: https://floodlist.com/europe/germany-floods-july-2021 (Accessed February 2, 2025).
Davies, R. (2021b). Belgium – Thousands Evacuate Floods as Death Toll Rises. Available online at: https://floodlist.com/europe/floods-belgium-july-2021 (Accessed February 2, 2025).
de Jager, A., and Vogt, J. (2003). Rivers and Catchments of Europe - Catchment Characterisation Model (CCM). Available online at: http://data.europa.eu/89h/8c681046-726b-413d-aff8-b1afebd73c0a (Accessed February 2, 2025).
Dewals, B., Erpicum, S., Pirotton, M., and Archambeau, P. (2021). “Extreme floods in Belgium. The July 2021 extreme floods in the Belgian part of the Meuse basin”, in: Hydrolink 2021/4. International Association for Hydro-Environment Engineering and Research (IAHR). 104–107. Available online at: https://www.iahr.org/library/hydrolink?hid=412 (Accessed February 2, 2025).
Duscher, K., Günther, A., Richts, A., Clos, P., Philipp, U., and Struckmeier, W. (2015). The GIS layers of the “international hydrogeological map of Europe 1:1,500,000” in a vector format. Hydrogeol. J. 23, 1867–1875. doi: 10.1007/s10040-015-1296-4
DWD (2025). RADOLAN: Analysen radarbasierter stündlicher (RW) und täglicher (SF) Niederschlagshöhen. Available online at: https://www.dwd.de/DE/leistungen/radolan/radolan.html (Accessed February 5, 2025).
ECMWF (2021). 202107 - Rainfall - Germany and Belgium. Available online at: https://confluence.ecmwf.int/display/FCST/202107+-+Rainfall+-+Germany+and+Belgium (Accessed February 3, 2025).
EEA (2018). Copernicus Land Monitoring Service, Corine Land Cover 2018. Available online at: https://land.copernicus.eu/pan-european/corine-land-cover/clc2018 (Accessed February 3, 2025).
EM-DAT (2021). 2021-0411, severe floods; Germany, Belgium. In: The International Disaster Database. Available online at: https://doi.org/10.17616/R3QQ1X (Accessed February 3, 2025).
Harrigan, S., Zsoter, E., Cloke, H., Salamon, P., and Prudhomme, C. (2023). Daily ensemble river discharge reforecasts and real-time forecasts from the operational global flood awareness system. Hydrol. Earth Syst. Sci. 27, 1–19. doi: 10.5194/hess-27-1-2023
Hengl, T., Mendes de Jesus, J., Heuvelink, G. B. M., Ruiperez Gonzalez, M., Kilibarda, M., Blagotić, A., et al. (2017). SoilGrids250m: global gridded soil information based on machine learning. PLoS One 12:e0169748. doi: 10.1371/journal.pone.0169748
Hokkanen, J., Kollet, S., Kraus, J., Herten, A., Hrywniak, M., and Pleiter, D. (2021). Leveraging HPC accelerator architectures with modern techniques — hydrologic modeling on GPUs with ParFlow. Comput. Geosci. 25, 1579–1590. doi: 10.1007/s10596-021-10051-4
Journée, M., Goudenhoofdt, E., Vannitsem, S., and Delobbe, L. (2023). Quantitative rainfall analysis of the 2021 mid-July flood event in Belgium. Hydrol. Earth Syst. Sci. 27, 3169–3189. doi: 10.5194/hess-27-3169-2023
Junghänel, T., Bissolli, P., Daßler, J., Fleckenstein, R., Imbery, F., Janssen, W., et al. (2021). Hydro- klimatologische Einordnung der Stark- und Dauerniederschläge in Teilen Deutschlands im Zusammenhang mit dem Tiefdruckgebiet “Bernd” vom 12. bis 19. Juli 2021. Deutscher Wetterdienst, Offenbach am Main. Available online at: https://www.dwd.de/DE/leistungen/besondereereignisse/niederschlag/20210721_bericht_starkniederschlaege_tief_bernd.html (Accessed February 2, 2025).
Kollet, S. J., and Maxwell, R. M. (2006). Integrated surface–groundwater flow modeling: a free-surface overland flow boundary condition in a parallel groundwater flow model. Adv. Water Resour. 29, 945–958. doi: 10.1016/j.advwatres.2005.08.006
Kollet, S. J., and Maxwell, R. M. (2008). Capturing the influence of groundwater dynamics on land surface processes using an integrated, distributed watershed model. Water Resour. Res. 44:W02402. doi: 10.1029/2007WR006004
Kollet, S. J., Sulis, M., Maxwell, R. M., Paniconi, C., Putti, M., Bertoldi, G., et al. (2017). The integrated hydrologic model Intercomparison project, IH-MIP2: a second set of benchmark results to diagnose integrated hydrology and feedbacks. Water Resour. Res. 53, 867–890. doi: 10.1002/2016WR019191
Khosh Bin Ghomash, S., Apel, H., and Caviedes-Voullième, D. (2024). Are 2D shallow-water solvers fast enough for early flood warning? A comparative assessment on the 2021 Ahr valley flood event. Nat. Hazards Earth Syst. Sci. 24, 2857–2874. doi: 10.5194/nhess-24-2857-2024
Kreienkamp, F., Philip, S. Y., Tradowsky, J. S., Kew, S. F., Lorenz, P., Arrighi, J., et al. (2021). Rapid attribution of heavy rainfall events leading to the severe flooding in Western Europe during July 2021. World Weather Attribution. Available online at: https://www.worldweatherattribution.org/heavy-rainfall-which-led-to-severe-flooding-in-western-europe-made-more-likely-by-climate-change/ (Accessed February 3, 2025).
Kuffour, B. N. O., Engdahl, N. B., Woodward, C. S., Condon, L. E., Kollet, S., and Maxwell, R. M. (2020). Simulating coupled surface–subsurface flows with ParFlow v3.5.0: capabilities, applications, and ongoing development of an open-source, massively parallel, integrated hydrologic model. Geosci. Model Dev. 13, 1373–1397. doi: 10.5194/gmd-13-1373-2020
Lapides, D. A., David, C., Sytsma, A., Dralle, D., and Thompson, S. (2020). Analytical solutions to runoff on hillslopes with curvature: numerical and laboratory verification. Hydrol. Process. 34, 4640–4659. doi: 10.1002/hyp.13879
Lehmkuhl, F., Schüttrumpf, H., Schwarzbauer, J., Brüll, C., Dietze, M., Letmathe, P., et al. (2022). Assessment of the 2021 summer flood in Central Europe. Environ. Sci. Eur. 34:107. doi: 10.1186/s12302-022-00685-1
DGJ (2025). Deutsches Gewässerkundliches Jahrbuch im Internet. Available online at: https://dgj.de (Accessed February 3, 2025).
Ludwig, P., Ehmele, F., Franca, M. J., Mohr, S., Caldas-Alvarez, A., Daniell, J. E., et al. (2023). A multi-disciplinary analysis of the exceptional flood event of July 2021 in Central Europe – part 2: historical context and relation to climate change. Nat. Hazards Earth Syst. Sci. 23, 1287–1311. doi: 10.5194/nhess-23-1287-2023
Maxwell, R. M., and Miller, N. L. (2005). Development of a coupled land surface and groundwater model. J. Hydrometeorol. 6, 233–247. doi: 10.1175/JHM422.1
McDonnell, J. J., and Beven, K. (2014). Debates - the future of hydrological sciences: a (common) path forward? A call to action aimed at understanding velocities, celerities and residence time distributions of the headwater hydrograph. Water Resour. Res. 50, 5342–5350. doi: 10.1002/2013WR015141
McMillan, H., Krueger, T., and Freer, J. (2012). Benchmarking observational uncertainties for hydrology: rainfall, river discharge and water quality. Hydrol. Process. 26, 4078–4111. doi: 10.1002/hyp.9384
Merz, R., Tarasova, L., and Basso, S. (2020). The flood cooking book: ingredients and regional flavors of floods across Germany. Environ. Res. Lett. 15:114024. doi: 10.1088/1748-9326/abb9dd
Mohr, S., Ehret, U., Kunz, M., Ludwig, P., Caldas-Alvarez, A., Daniell, J. E., et al. (2023). A multi-disciplinary analysis of the exceptional flood event of July 2021 in Central Europe – part 1: event description and analysis. Nat. Hazards Earth Syst. Sci. 23, 525–551. doi: 10.5194/nhess-23-525-2023
Munich Re (2025). Flood risks on the rise - greater loss prevention is needed. Available online at: https://www.munichre.com/en/risks/natural-disasters/floods.html (assessed February 3, 2025).
Owens, R. G., and Hewson, T. D. (2018). ECMWF forecast user guide. Available online at: https://doi.org/10.21957/m1cs7h (Assessed February 3, 2025).
Paprotny, D., Sebastian, A., Morales-Nápoles, O., and Jonkman, S. N. (2018). Trends in flood losses in Europe over the past 150 years. Nat. Commun. 9:1985. doi: 10.1038/s41467-018-04253-1
Pomeon, T., Wagner, N., Furusho, C., Kollet, S., and Reinoso-Rondinel, R. (2020). Performance of a PDE-based hydrologic model in a flash flood modeling framework in sparsely-gauged catchments. Water 12:2157. doi: 10.3390/w12082157
Rasmussen, T. C. Jr., Baldwin, R. H., Dowd, J. F., and Williams, A. G. (2000). Tracer vs. pressure wave velocities through unsaturated Saprolite. Soil Sci. Soc. Am. J. 64, 75–85. doi: 10.2136/sssaj2000.64175x
Razafimaharo, C., Krähenmann, S., Höpp, S., Rauthe, M., and Deutschländer, T. (2020). New high-resolution gridded dataset of daily mean, minimum, and maximum temperature and relative humidity for Central Europe (HYRAS). Theor. Appl. Climatol. 142, 1531–1553. doi: 10.1007/s00704-020-03388-w
RMI (2021). Ce que l'on sait sur les pluies exceptionnelles des 14 et 15 juillet 2021 [online]. Available online at: https://www.meteo.be/fr/infos/actualite/ce-que-lon-sait-sur-les-pluies-exceptionnelles-des-14-et-15-juillet-2021 (Accessed February 3, 2025).
Roggenkamp, T., Herget, J., and Roggenkamp, T. (2024). Flood reconstruction – the unexpected rather frequent event at river Ahr in July 2021. Glob. Planet. Chang. 240:104541. doi: 10.1016/j.gloplacha.2024.104541
Saadi, M., Furusho-Percot, C., Belleflamme, A., Chen, J.-Y., Trömel, S., and Kollet, S. (2023). How uncertain are precipitation and peak flow estimates for the July 2021 flooding event? Nat. Hazards Earth Syst. Sci. 23, 159–177. doi: 10.5194/nhess-23-159-2023
Schaap, M. G., Leij, F. J., and van Genuchten, M. T. (2001). ROSETTA: a computer program for estimating soil hydraulic parameters with hierarchical pedotransfer functions. J. Hydrol. 251, 163–176. doi: 10.1016/S0022-1694(01)00466-8
Schäfer, A., Mühr, B., Daniell, J. E., Ehret, U., Ehmele, F., Küpfer, K., et al. (2021). Hochwasser Mitteleuropa, Juli 2021 (Deutschland), Bericht Nr. 1 “Nordrhein-Westfalen & Rheinland-Pfalz”. Karlsruhe: Center for Disaster Management and Risk Reduction Technology (CEDIM), Forensic Disaster Analysis (FDA) Group.
Schalge, B., Haefliger, V., Kollet, S., and Simmer, C. (2019). Improvement of surface run-off in the hydrological model ParFlow by a scale-consistent river parameterization. Hydrol. Process. 33, 2006–2019. doi: 10.1002/hyp.13448
SPW-MI (2025). Hydrological statistical yearbook. Available online at: http://voies-hydrauliques.wallonie.be/opencms/opencms/fr/hydro/Archive/annuaires/index.html (Accessed February 3, 2025).
Tradowsky, J. S., Philip, S. Y., Kreienkamp, F., Kew, S. F., Lorenz, P., Arrighi, J., et al. (2023). Attribution of the heavy rainfall events leading to severe flooding in Western Europe during July 2021. Clim. Chang. 176:90. doi: 10.1007/s10584-023-03502-7
Van Genuchten, M. T. (1980). A closed-form equation for predicting the hydraulic conductivity of unsaturated soils. Soil Sci. Soc. Am. J. 44, 892–898. doi: 10.2136/sssaj1980.03615995004400050002x
Voit, P., and Heistermann, M. (2024). A downward-counterfactual analysis of flash floods in Germany. Nat. Hazards Earth Syst. Sci. 24, 2147–2164. doi: 10.5194/nhess-24-2147-2024
Weigl, E., and Winterrath, T. (2009). Radargestützte Niederschlagsanalyse und -vorhersage (RADOLAN, RADVOR-OP). Promet 35, 78–86. Available online at: http://nbn-resolving.de/urn:nbn:de:101:1-2017012510513.
Winterrath, T., Brendel, C., Hafer, M., Junghänel, T., Klameth, A., Walawender, E., et al. (2017). Erstellung einer radargestützten Niederschlagsklimatologie. Berichte des Deutschen Wetterdienstes 251, Deutscher Wetterdienst, Offenbach am Main. Available online at: https://opendata.dwd.de/climate_environment/GPCC/radarklimatologie/Dokumente/Endbericht_Radarklimatologie_final.pdf (Accessed February 5, 2025).
Yamazaki, D., Ikeshima, D., Sosa, J., Bates, P. D., Allen, G. H., and Pavelsky, T. M. (2019). MERIT hydro: a high-resolution global hydrography map based on latest topography datasets. Water Resour. Res. 55, 5053–5073. doi: 10.1029/2019WR024873
Keywords: integrated hydrological model, ParFlow, July 2021 flood, Eifel-Ardennes, terrestrial water cycle
Citation: Goergen K, Belleflamme A, Hammoudeh S, Vanderborght J and Kollet S (2025) The July 2021 flood event in the Eifel-Ardennes mountains as simulated by the high-resolution integrated hydrologic model ParFlow. Front. Water. 7:1571704. doi: 10.3389/frwa.2025.1571704
Edited by:
Oliver S. Schilling, University of Basel, SwitzerlandReviewed by:
Michael Tso, UK Centre for Ecology and Hydrology (UKCEH), United KingdomMaria Staudinger, University of Zurich, Switzerland
Copyright © 2025 Goergen, Belleflamme, Hammoudeh, Vanderborght and Kollet. This is an open-access article distributed under the terms of the Creative Commons Attribution License (CC BY). The use, distribution or reproduction in other forums is permitted, provided the original author(s) and the copyright owner(s) are credited and that the original publication in this journal is cited, in accordance with accepted academic practice. No use, distribution or reproduction is permitted which does not comply with these terms.
*Correspondence: Klaus Goergen, ay5nb2VyZ2VuQGZ6LWp1ZWxpY2guZGU=