 Fayaz Ullah Shinwari1
 Urooj Liaquat1
 Mumtaz Ali Khan1*†
 George Kontakiotis2*
 Panayota Makri2
 Vasiliki Lianou2
 Assimina Antonarakou2
- 1Department of Earth & Environmental Sciences, Bahria University Islamabad, Islamabad, Pakistan
- 2Department of Historical Geology and Paleontology, Faculty of Geology and Geoenvironment, National and Kapodistrian University of Athens, Athens, Greece
In Islamabad, groundwater is an essential resource that supports industrial, agricultural, and home use despite growing demand and fast urbanization. However, worries about anthropogenic influences causing its quality to decline make region-specific assessment necessary for sustainable management. This work uses an integrated strategy that combines field sampling, GIS-based spatial interpolation, and Water Quality Index (WQI) analysis to evaluate the hydrochemical properties and geographical variability of groundwater quality in Islamabad. 37 borewell samples in all were gathered, examined for physico-chemical characteristics, and their WQI values were calculated. The findings showed that, for drinking purposes, 5.41% of samples were rated as “Excellent,” 86.49% as “Good,” and 8.11% as “Poor.” Inverse Distance Weighted (IDW) interpolation was used to estimate the depth of the water table spatially. The results showed that the depth varied between 25 and 399 feet, with shallower zones signaling enhanced accessibility and recharging, while statistical analysis revealed only a weak association between depth and water quality, suggesting additional factors contribute to contamination. No significant linear trends were found by depth-wise hydrochemical regression, however elevated quantities of sulfate, carbonate (CO₃2−), sodium carbonate (Na₂CO₃), and Nitrates (NO₃−) were found in shallow aquifers by depth-wise hydrochemical investigation, indicating the influence of fertilizer leaching or surface activities. The geochemical evolution with depth was demonstrated by the increasing quantities of sodium bicarbonate (NaHCO₃), chloride (Cl−), and sodium chloride (NaCl) found in deeper aquifers. Notably, because of the higher concentrations of TDS, EC, chloride, and Nitrates, the Tarnol region displayed the highest risk of contamination. In addition to highlighting the necessity of depth-informed aquifer protection and land use restriction to guarantee long-term water security for Islamabad’s expanding population. The results of statistical regression provide additional support for these conclusions, demonstrating the intricacy of the factors influencing groundwater contamination and emphasizing the necessity of multivariate techniques in future monitoring plans.
1 Introduction
It is commonly acknowledged that groundwater is the most important freshwater resource on Earth, meeting household, agricultural, and industrial demands. Particularly in areas with limited surface water, it makes up more than 80% of the world’s usable water storage (Tirkey et al., 2013). Groundwater is essential to the daily needs of about two billion people (Kemper, 2004). It is a preferable source of drinking water since it is less susceptible to contamination than surface water because of natural filtration processes such ion exchange and microbial activity in soil [U.S. Environmental Protection Agency (EPA), 1985; Rahman, 2008; Shirazi et al., 2012]. Due to these benefits as well as its function in sustaining ecosystems and river base flows, this limited resource is becoming more and more dependent on humans worldwide, which has resulted in overexploitation.
The Capital Development Authority (CDA) is principally responsible for managing Islamabad’s water supply, which is supplied by surface water from the Simly and Khanpur Dams. Additionally, about 190 tube wells in nearby districts—both privately and publicly operated—provide about 30% of the city’s water. Notwithstanding these sources, the anticipated demand of 407 million cubic meters (MCM) per year is greatly exceeded by the existing peak supply of 141 MCM. Without a corresponding increase in water storage capacity, this disparity is predicted to deepen as the city’s population rises from 1.095 million in 2018 to 1.67 million by 2030 (United Nations, 2018).
About 30 kilometers away, Rawal Dam adds more water from precipitation (30–40%) and glacial melt (about 60%) (Abbas et al., 2015). The Rawal Water Treatment Plant treats the water from this source before it is distributed across the city (Basharat, 2019), while the Islamabad Sewage Treatment Plant treats wastewater before it is released into Rawal Lake (Hassan and Hanif, 2014). The region is now more dependent on groundwater as a result of industrialization and urbanization, which have severely depleted the region’s water supplies.
Islamabad’s dependence on limited groundwater supplies is growing as surface water resources become scarcer. Groundwater, which is being over extracted, is the only source of energy for some industries and residential areas. Significantly, sections I-8, I-9, and I-10 in the Margalla highlands show deepening water tables, which suggest a growing Depth to Water (DTW). This tendency is predicted to intensify in the near future, creating significant concerns to water security, unless data-driven solutions and strategic planning are implemented (Shinwari et al., 2025).
Groundwater quality evaluations have historically been limited in their regional extent by their reliance on isolated laboratory data. Geographic Information Systems (GIS) have been utilized in previous research to map the sources of contamination and locate possible hotspots for pollution (Rahman, 2008; Shirazi et al., 2012). But by combining depth profile analysis and Water Quality Index (WQI) classification, this work expands on earlier efforts and provides a more thorough understanding of groundwater conditions in both vertical and horizontal dimensions.
This study analyzes depth-wise variations in pollution and water quality metrics while visualizing geographical variation in groundwater quality using GIS technology. Physical, chemical, and biological markers are among the various datasets that the WQI unifies into a single, interpretable value (Dahan et al., 2009; Yogendra and Puttaiah, 2003). This index is a useful tool for resource managers and policymakers since it has been used worldwide to assess the suitability of water for irrigation and drinking (Rishnaiah et al., 2009).
By integrating subsurface profiling, WQI classification, and GIS-based mapping, the study provides a new approach to managing groundwater resources in the region. Finding susceptible areas, monitoring trends in depth, and assisting with well-informed decision-making for long-term sustainability are all improved by this integrated approach (Prasad et al., 2025).
2 Study area
The Islamic Republic of Pakistan’s capital city is situated, Islamabad lies between 33.49°N and 33.75°N latitude, and 72.83°E and 73.17°E longitude. According to UN World Urbanization Prospects (United Nations, 2018), there were 40,000 people living in the country in 1950, 110,000 in 1995, 678,000 in 2005, 1.095 million in 2018, and 1.67 million people are expected to live there by 2030. These figures cover Islamabad’s urban agglomeration, which normally comprises both the city’s population and that of its surrounding suburbs. The city satisfies all requirements for long-term planning and is a “unique” example of a major new metropolis that is “planned for the future and built for the present,” according to Frantzeskakis (2009). Its approximate area is 906 km2, and it is situated between 400 and 650 meters above sea level. The several residential sectors that make up the study area are represented by Zones I through V.
The seasons are as follows: fall (September to October), winter (November to February), spring (March to April), summer (May to June), and monsoon (July to August). The climate is humid and subtropical most of the time (Naeem et al., 2018). The highest recorded temperature in Islamabad was 46.5°C in June 2005, making it the warmest month overall. In 2010, there were four consecutive days with a high temperature above 40°C. However, data show that the summer months of 2018 witnessed temperatures ranging from 30 to 44°C. There were eleven days in 1993 and 2012 when the temperature rose above 44°C.
In Islamabad groundwater dynamics are greatly impacted by the distinct monsoon season (July to August) and humid subtropical environment. Because it increases infiltration, heavy monsoon rainfall directly aids groundwater replenishment. On the other hand, by speeding up the leaching of pollutants from waste sites and causing surface runoff to carry pollutants from agricultural and urban areas, these heavy rains also increase the risk of groundwater contamination (Krishnaswamy et al., 2013; Shinwari et al., 2025). Additionally, high summer temperatures, which can reach as high as 46.5°C and frequently surpass 40°C, can increase the solubility and mobility of pollutants, making it more difficult for them to migrate into groundwater (Barbieri et al., 2023).
In terms of geology, Butt et al. (2015) state that there are a few alluvial deposits, limestone, and tertiary sandstone. The study area’s geographical indication is shown in Figure 1.
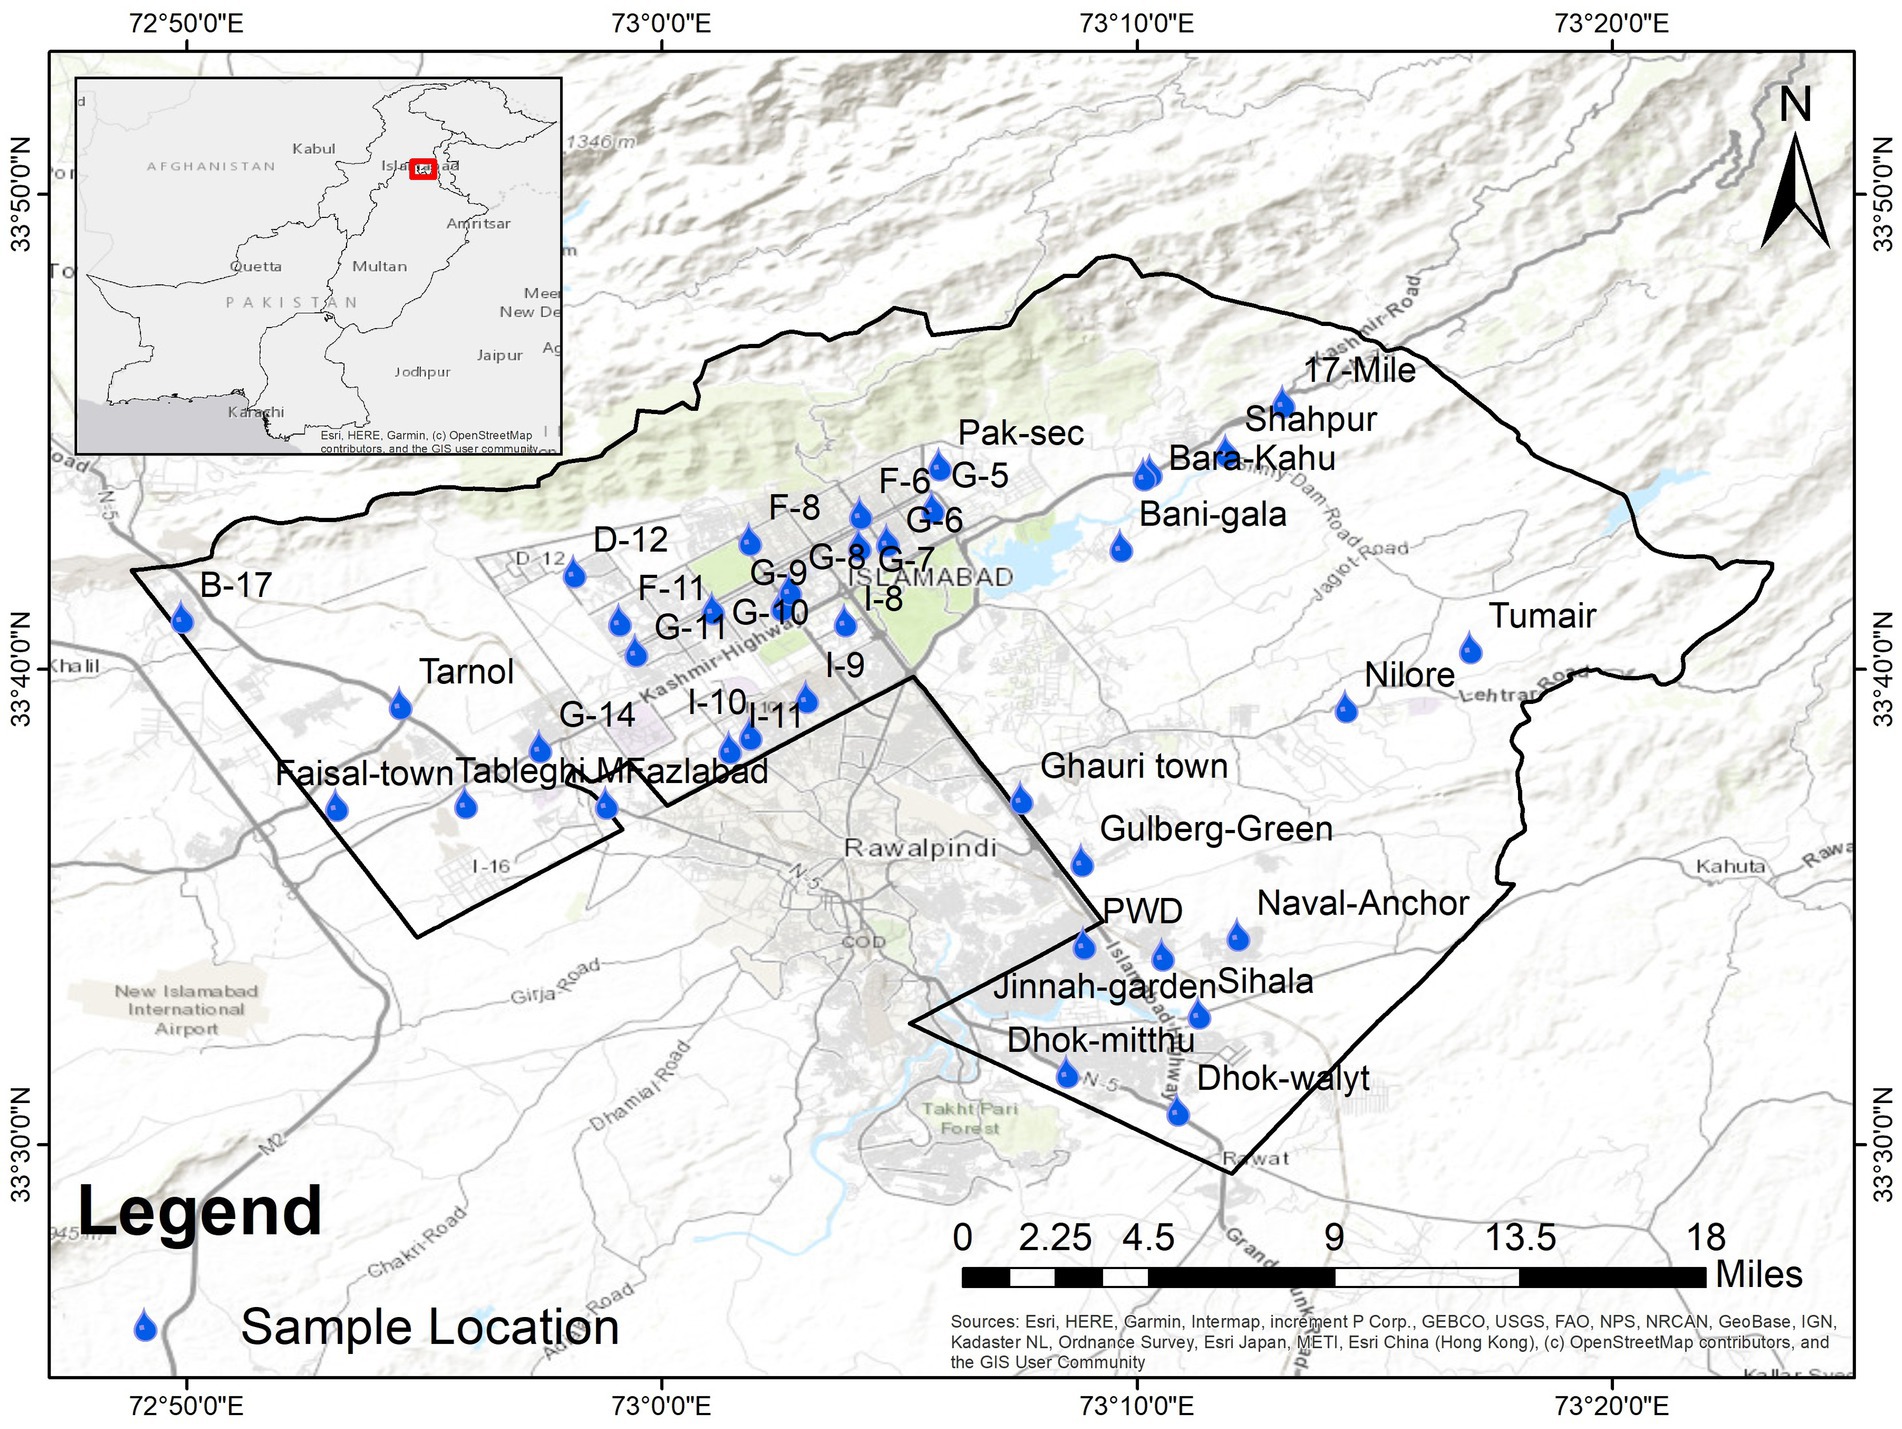
Figure 1. Groundwater sampling locations in the Islamabad Capital Territory, Pakistan. The study area (Islamabad) is indicated by the red box in the broader context of Pakistan.
The area’s groundwater storage capacity is mostly attributed to the alluvial deposits, which hold a substantial amount of water (Wahab et al., 2012). On the other hand, the characteristics of these geological formations, or aquifer media, significantly influence the susceptibility to pollution. Studies using models like DRASTIC have shown that areas with larger sediment sizes within the alluvial deposits, limestone, or sandstone formations tend to exhibit increased permeability, which speeds up the movement of pollutants and makes them more susceptible to contamination (Shinwari et al., 2025).
3 Materials and methods
3.1 Data collection and analysis
As seen in Figure 1, 37 samples, specifically well-bores, were gathered for physical and chemical investigation from different parts of Islamabad. The grab (or catch) sample methods specified by the APHA (1998) were followed while collecting samples for analysis in sterile vials. Numerous chemical and physical characteristics, including TDS, pH, Temperature, Alkalinity, Sulphates, Nitrates, Chloride, and others, were analyzed using the techniques described in APHA (1998). Chemicals and reagents of analytical grade were all used. The solutions were made with double-distilled, or D. D., water. A methodological flowchart can be seen as Figure 2.
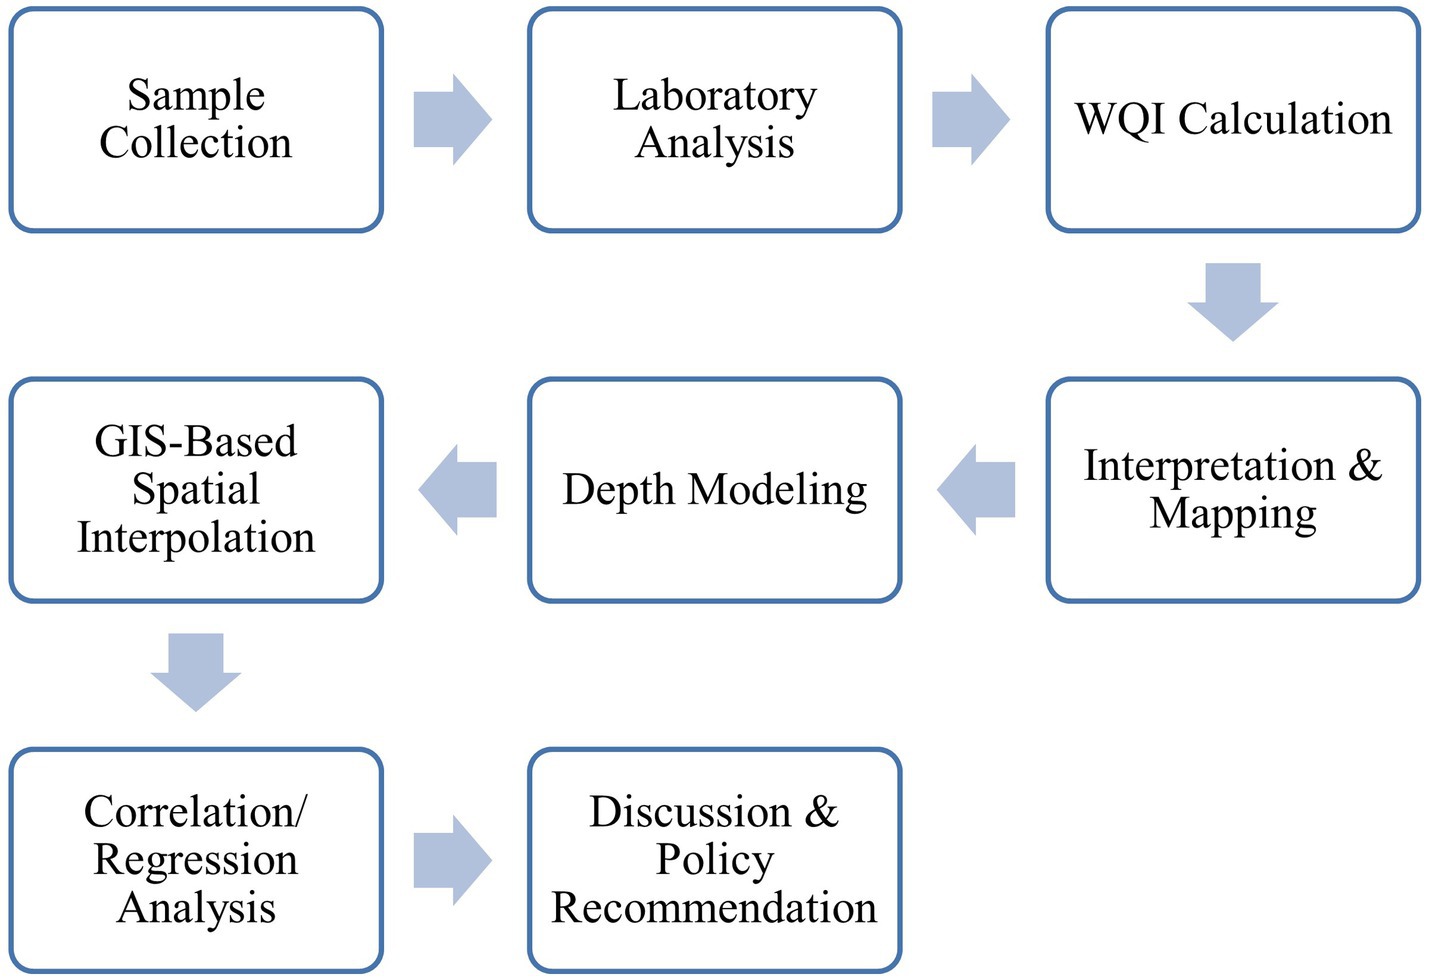
Figure 2. Workflow detailing the process of groundwater quality analysis.
To guarantee broad spatial coverage and hydrogeochemical diversity, 37 borewell groundwater samples were gathered around Islamabad. Accessibility, regional dispersion, and land use diversity were taken into consideration while calculating the number. Compared to earlier research in the same area, like Shabbir and Ahmad (2015), who used just nine borewells to evaluate the groundwater quality in Islamabad, this method improves spatial representation. Purposively chosen sampling locations were chosen from Islamabad’s Zones I–V in order to include regions close to recognized sources of pollution, such as urban runoff zones and wastewater discharge points, as well as to capture differences in land use (residential, industrial, and agricultural).
A methodical procedure that included sample collection and subsequent laboratory work was used for the analysis of the samples. Physical and chemical parameters were the two main ones that were measured after collection. Beakers, graduated cylinders, multiparameter testers, and distilled water were employed as preparation tools for the physical parameter study. The physical parameters that were analyzed were salts, temperature, pH, total dissolved solids (TDS), and electrical conductivity (EC). These characteristics are important markers of possible groundwater pollution.
A variety of assays were used in chemical analysis to ascertain the ions and chemicals present in the water samples. In the carbonate test, for example, methyl orange indicator and hydrochloric acid (HCl 0.1 M) were used, and the endpoint was determined by monitoring the color shift from orange to pink. In a similar vein, potassium chromate and silver Nitrates (AgNO3 0.01 M) were used in Mohr’s method to quantify the amounts of chlorides. Standard laboratory apparatus, such as burettes, Erlenmeyer flasks, and pH meters, were used for these tests as well as others for Alkalinity, Total hardness (TH), Sulphates, and Nitrates. Precise protocols were followed to guarantee correct results.
A Turbidity meter was utilized to calculate the turbidity of water samples. One vial held a 10 mL sample, which was then put into the meter. Turbidity data were obtained by measuring the light scattering produced by suspended particles in the water. To ensure accuracy and consistency, every measurement was meticulously documented. With the use of these meticulous methods, the study sought to examine Islamabad’s groundwater quality in its entirety, providing important information for determining whether or not it is suitable for drinking.
All analysis tools were calibrated on a regular basis, and the standard procedures described in APHA (1998) were adhered to in order to guarantee the data’s dependability. Depending on the particular test, the predicted analytical uncertainty for key ions and physical parameters varied from ±2 to ±5%. Selected samples were measured three times to ensure uniformity, and laboratory errors were kept to a minimum by using quality control standards.
3.2 GIS analysis
The coordinates of the sampling sites were noted for this study using a handheld GPS unit. After that, a point layer containing these locations was loaded into GIS software. A numeric code was given to each sample point and kept in the point attribute table. Each site’s sample code was included in a database file with separate columns for each chemical parameter’s value. The creation of spatially distributed maps for particular water quality metrics and the Water Quality Index (WQI) for drinking water were made easier by this geodatabase. Furthermore, several metrics related to irrigation water were mapped, such as the permeability index (PI), sodium percentage (Na+%), sodium adsorption ratio (SAR), residual sodium carbonate (RSC), and magnesium hazard (MH). The spatial analyst module of ArcGIS (version 10.8) software’s Inverse Distance Weighted (IDW) raster interpolation approach was used to outline the locational distribution of different water contaminants.
IDW was chosen for this investigation because it is straightforward, easy to use, and appropriate for datasets with a small sample size and uneven spatial distribution. Kriging has statistical benefits, but the current dataset did not meet the requirements of spatial autocorrelation that Kriging demands. Furthermore, IDW has been successfully applied for comparable groundwater assessments in earlier research conducted in Islamabad (Shabbir and Ahmad, 2015). Although the small sample size prevented cross-validation or the computation of error metrics like RMSE (Root Mean Square Error), we see this as a restriction. Such criteria would enable a more thorough assessment of interpolation accuracy in further research with bigger datasets.
3.3 Appraisal of water quality
The Weighted Arithmetic Index approach was used to determine the groundwater’s Water Quality Index (WQI) (Sahu and Sikdar, 2008). A total of eleven physico-chemical parameters were employed, including Turbidity, Alkalinity, pH, EC, TDS, Salts, Carbonates, Nitrates, Sulphates annd Chlorides.
The relative health significance of each characteristic was used to determine its weight (wᵢ), which ranged from 1 to 5. After that, the relative weight (Wᵢ) was calculated using Equation 1:
The quality rating (qᵢ) was calculated by Equation 2:
where Cᵢ is the observed concentration and Sᵢ is the WHO standard value (WHO, 2011).
The sub-index (SIᵢ) was determined by Equation 3:
Finally, the WQI was calculated by summing all sub-indices, as in Equation 4:
Then, according to Sahu and Sikdar (2008), the WQI values were divided into three groups: excellent, good and poor.
4 Results
4.1 Spatial analysis of groundwater quality
4.1.1 Physical parameters
4.1.1.1 pH
Drinking water quality is greatly influenced by pH, which is a crucial indicator of hydrogen ion concentration in a sample of water. The pH range of 6.5 to 8.5 is recommended by the WHO for safe drinking water (Khan et al., 2013). The pH levels in this study varied from 6.73 to 7.83 (Figure 3A), indicating generally acceptable drinking water conditions. Using this data, a spatial distribution map of pH values was made throughout Islamabad, giving a clear picture of the quality of the water in various locations.
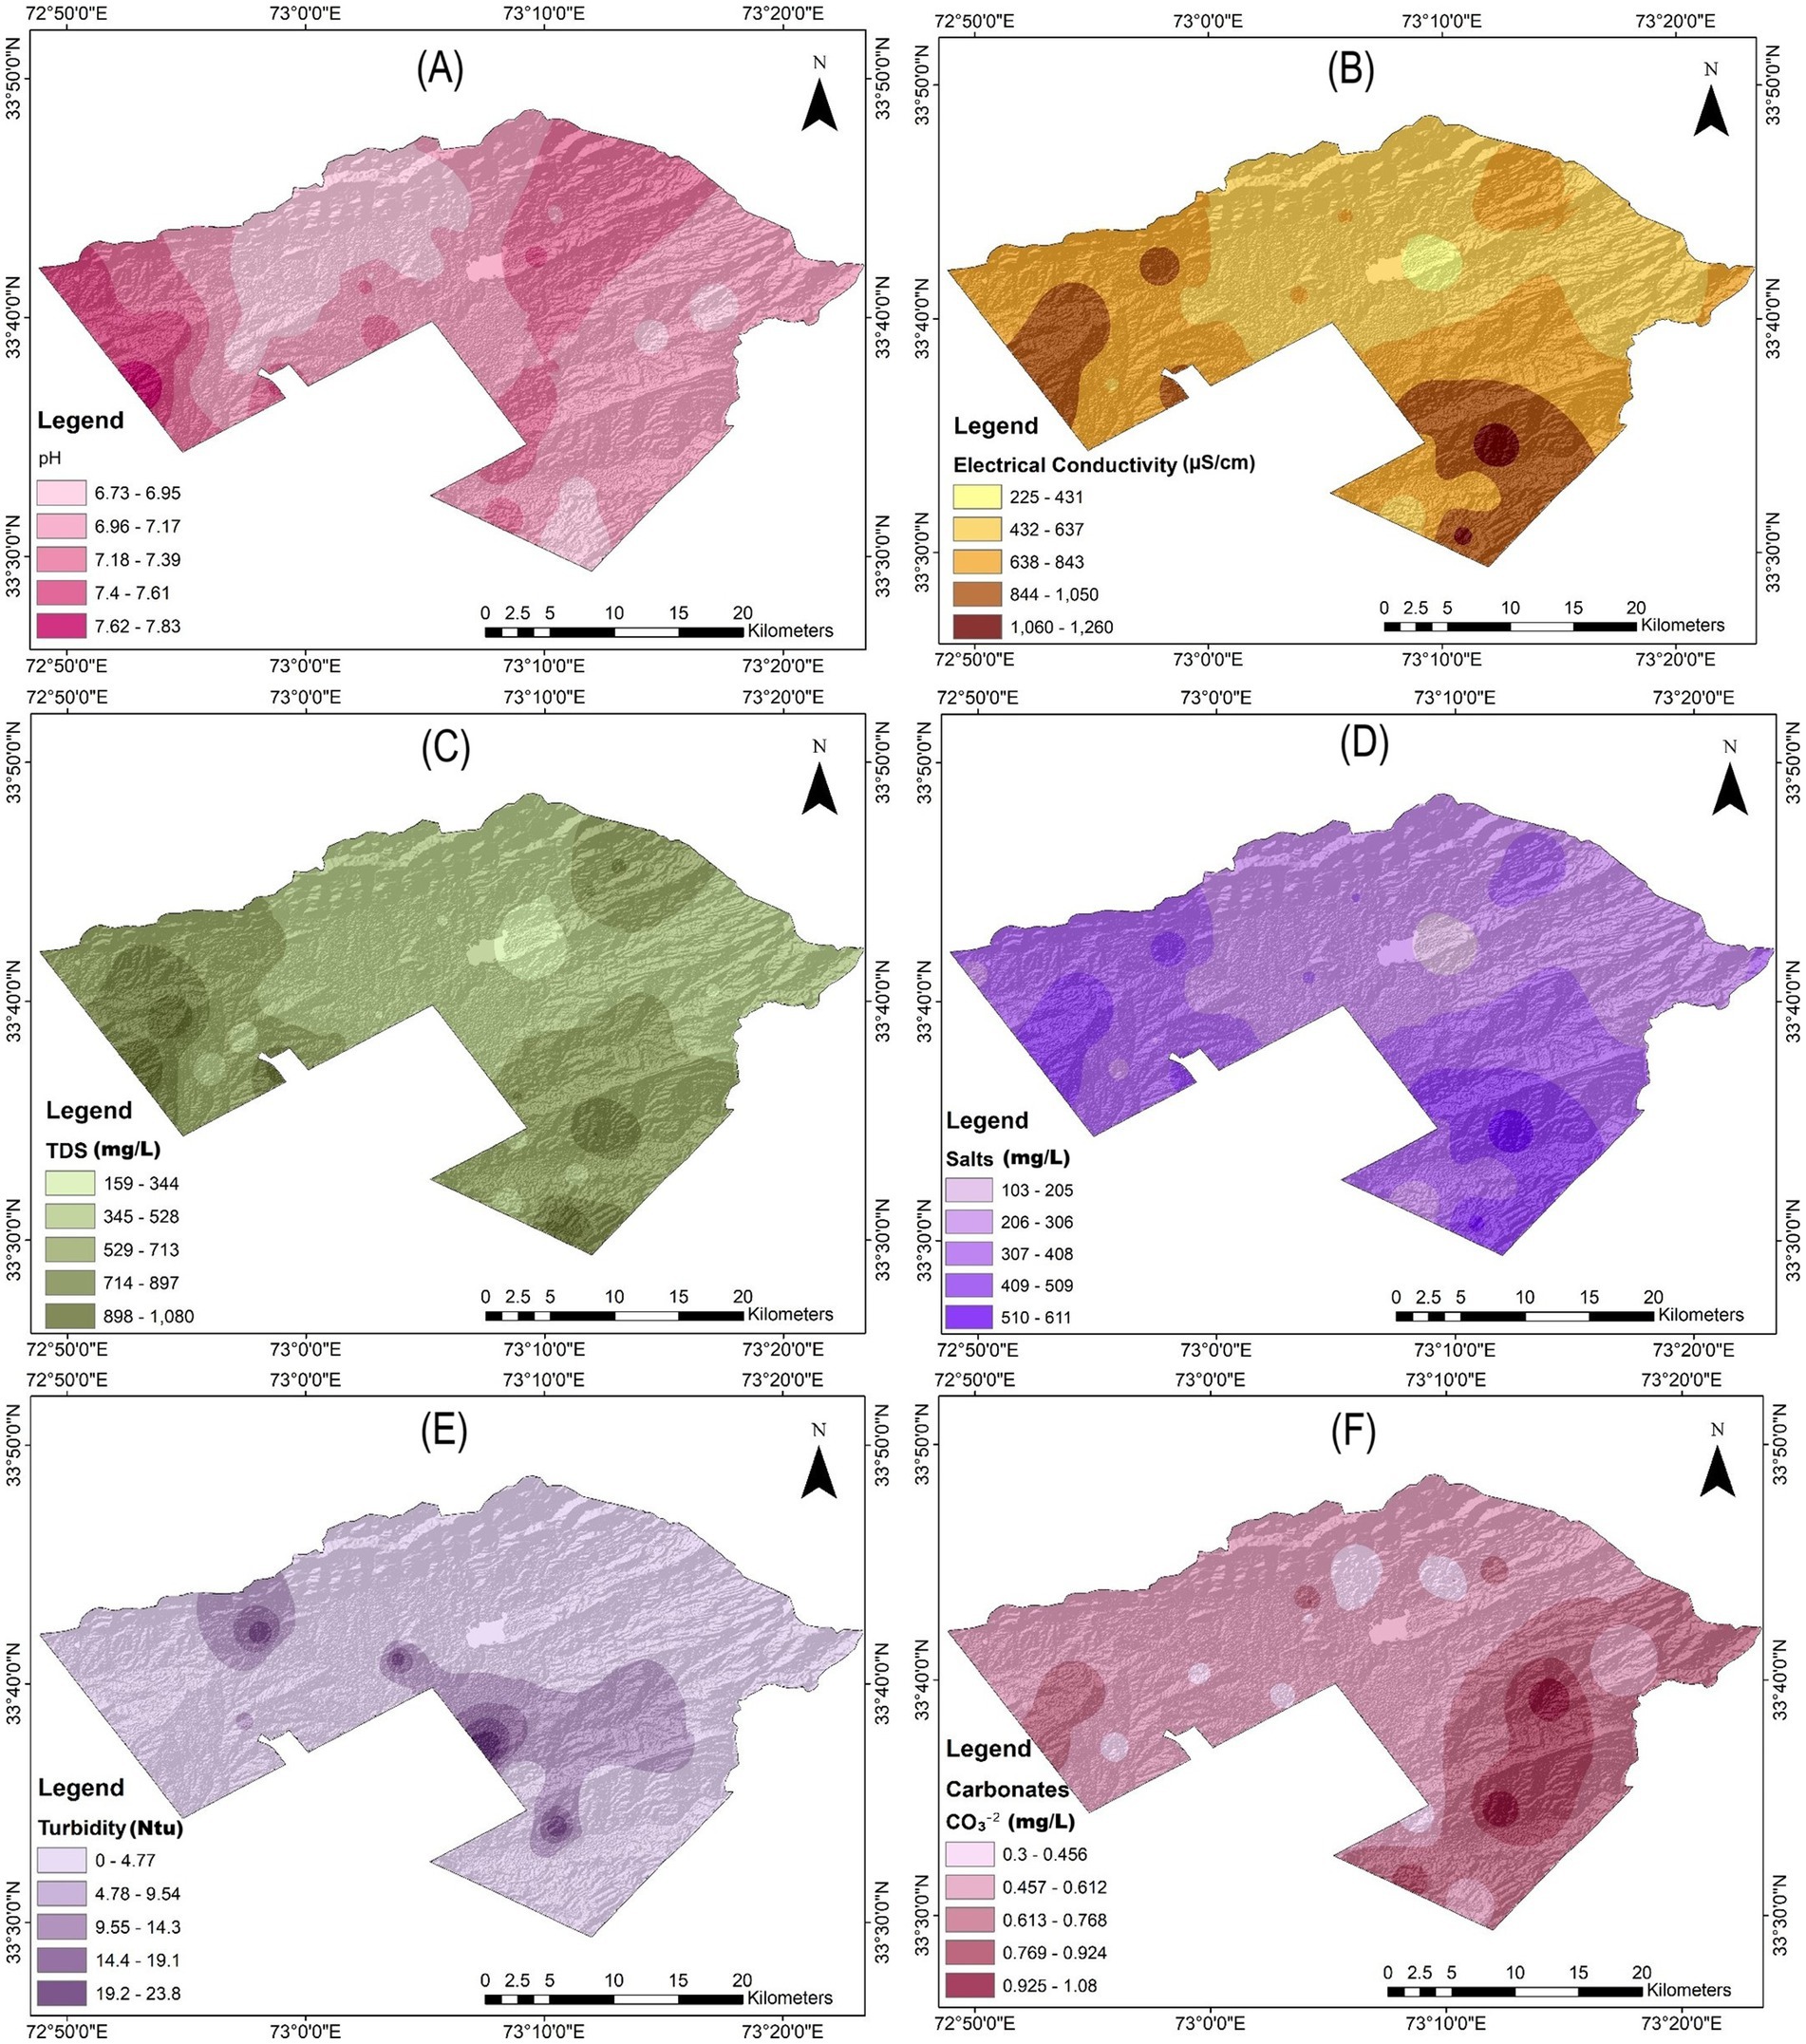
Figure 3. Spatial distributions of pH (A), electric conductivity (B), TDS (C), salts (D), turbidity (E), and carbonates (F).
4.1.1.2 Electrical conductivity (EC)
The ability of water to conduct electricity, which is a reflection of its ion concentration, is measured by its electrical conductivity. It has a close relationship with total dissolved solids (TDS) and is a trustworthy indication of the availability of salt minerals in the water. The WHO states that 1,000 cm is the highest allowable level of electrical conductivity in drinking water (Khan et al., 2013). Different conductivity levels were discovered during the study, and they were plotted to illustrate their spatial distribution throughout Islamabad and identify probable mineral pollution hotspots (Figure 3B).
4.1.1.3 Total dissolved solids (TDS)
TDS quantifies the amount of soluble organic and inorganic salts present in water. A maximum TDS level of 500 mg/L is advised by the WHO for drinking water (Malik, 2000). Water with high Total Dissolve Solids (TDS) levels may be highly mineralized and so unfit for human consumption. TDS readings in this study varied from 159 to 1,080 mg/L, and maps of the spatially distributed data were made to show these differences (Figure 3C). This data is essential for locating areas where possible problems with water quality may arise.
4.1.1.4 Salts and temperature
The aesthetic qualities of water can be influenced by a variety of salts, including Nitrates, carbonates, bicarbonates, chlorides, and sulfates. A 200 mg/L maximum salt concentration is advised by the WHO. Concentrations of salt were monitored to range from 103 to 611 mg/L in the current analysis (Figure 3D). In addition to being an indirect sign of contamination, temperature affects the proliferation of microorganisms. The study’s average temperature was 12.0°C, and the pH values ranged from 7.0 to 8.5.
4.1.1.5 Turbidity
Turbidity, the impurity or cloudiness of water brought on by suspended particles, can be a sign of contamination and be dangerous to one’s health. Gastrointestinal illnesses are linked to higher levels of turbidity (Malik, 2000). Certain water samples in this study had turbidity, whereas others did not. Areas with possible problems for the quality of the water were identified by mapping the spatial distribution of turbidity levels (Figure 3E).
4.1.2 Chemical parameters
4.1.2.1 Carbonates
Both surface and subterranean waters frequently include carbonates due to the breakdown of carbonate minerals. Water chemistry depends on the existence of carbonate ions (CO3−2) and bicarbonate ions (HCO3−), which determine alkalinity and total hardness. The concentrations of different carbonates were mapped in this study to illustrate their regional distribution in the groundwater of Islamabad (Figures 3F, 4A–C). This examination aids in comprehending the water’s chemical makeup and suitability for a range of applications.
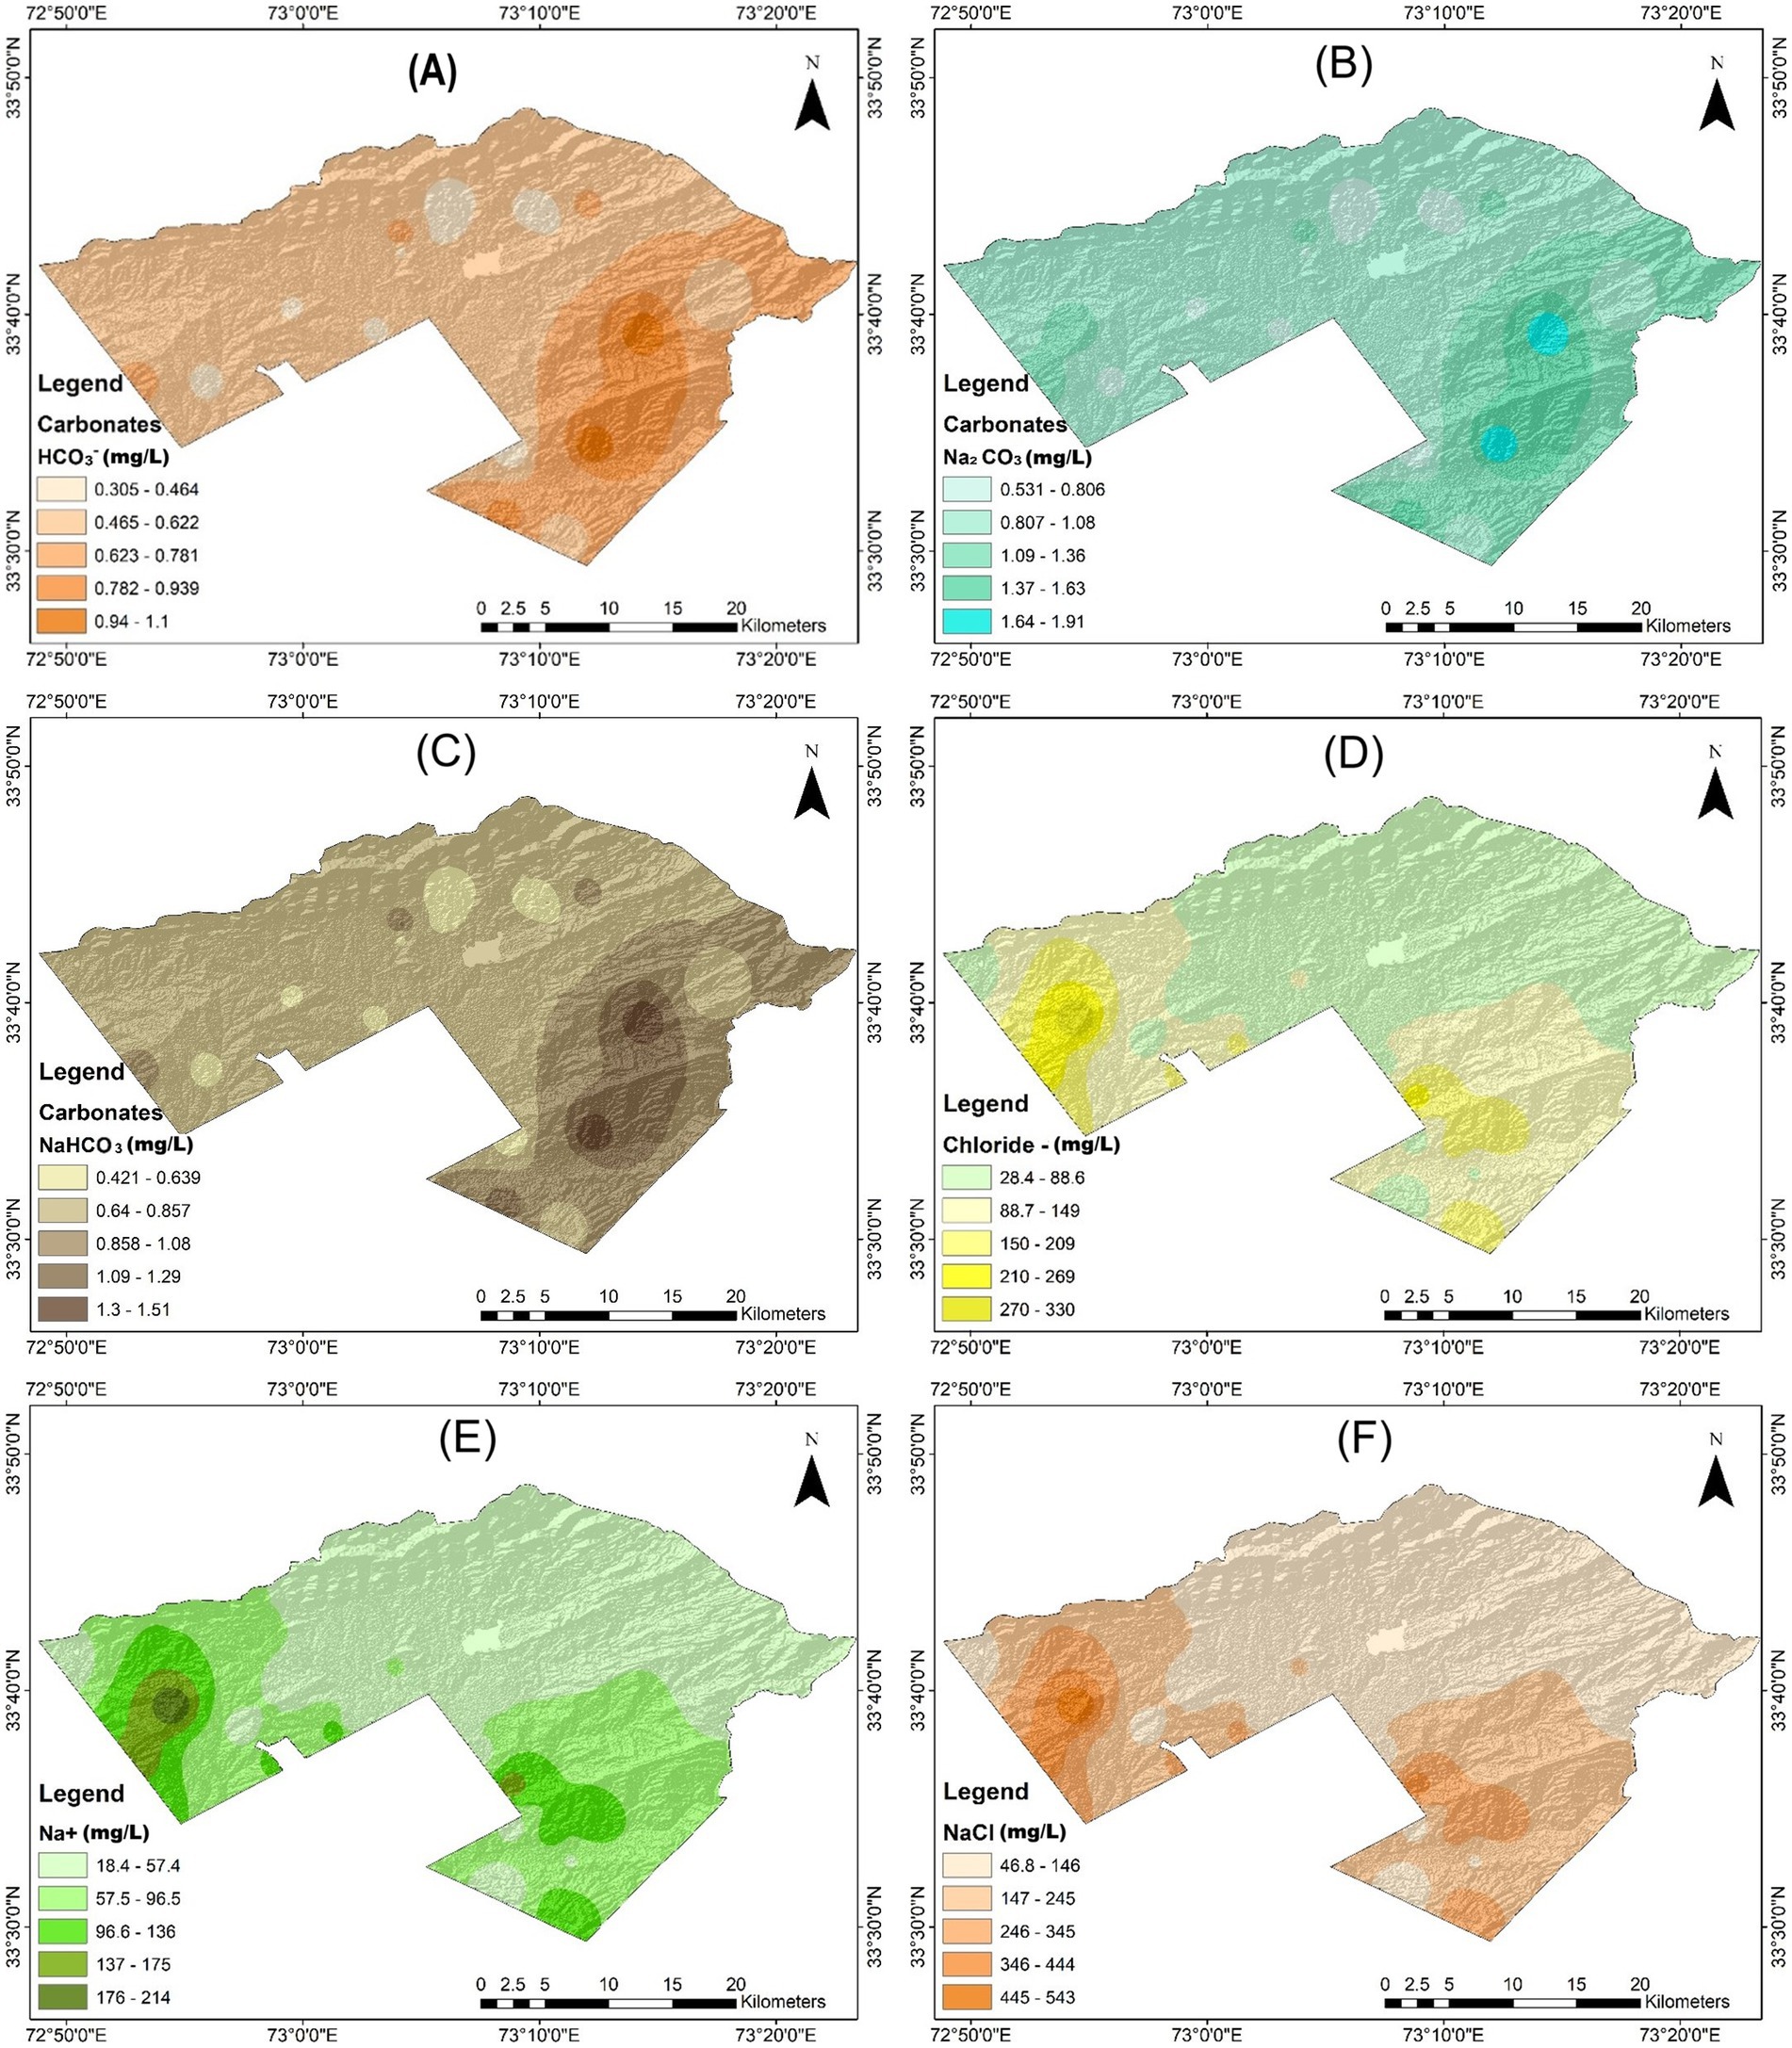
Figure 4. Spatial distributions of Carbonates HCO₃− (A), Carbonates Na2CO3 (B), Carbonates NaHCO3 (C), Cl− (D), Na+ (E), and NaCl (F).
4.1.2.2 Chlorides
Both natural and man-made processes, such as the dissociation of salts like KCl, CaCl2, and NaCl, can release chloride ions into the water, mostly in the form of sewage pollution and industrial waste. A maximum chloride content of 250 mg/L is advised by the WHO (Malik, 2000). Chloride concentrations in this study varied from 18 to 214 mg/L. In order to pinpoint possible contaminated sites and provide guidance for water quality management, maps showing the spatial distribution of chloride concentrations were produced (Figures 4D–F).
4.1.2.3 Total Hardness
The elements carbonates, bicarbonates, chlorides, sulfates, calcium, and magnesium are responsible for producing hard water. The maximum amount of total hardness that can be present in drinkable water, as determined by PCRWR and WHO rules, is 500 mg/L. According to Khan et al. (2013), high levels of total hardness can cause scaling, corrosion, and health problems such kidney stones and stomach ailments. Spatial map was used to illustrate the total hardness values, which ranged from 420.4 to 1,050 mg/L, according to the study (Figure 5A).
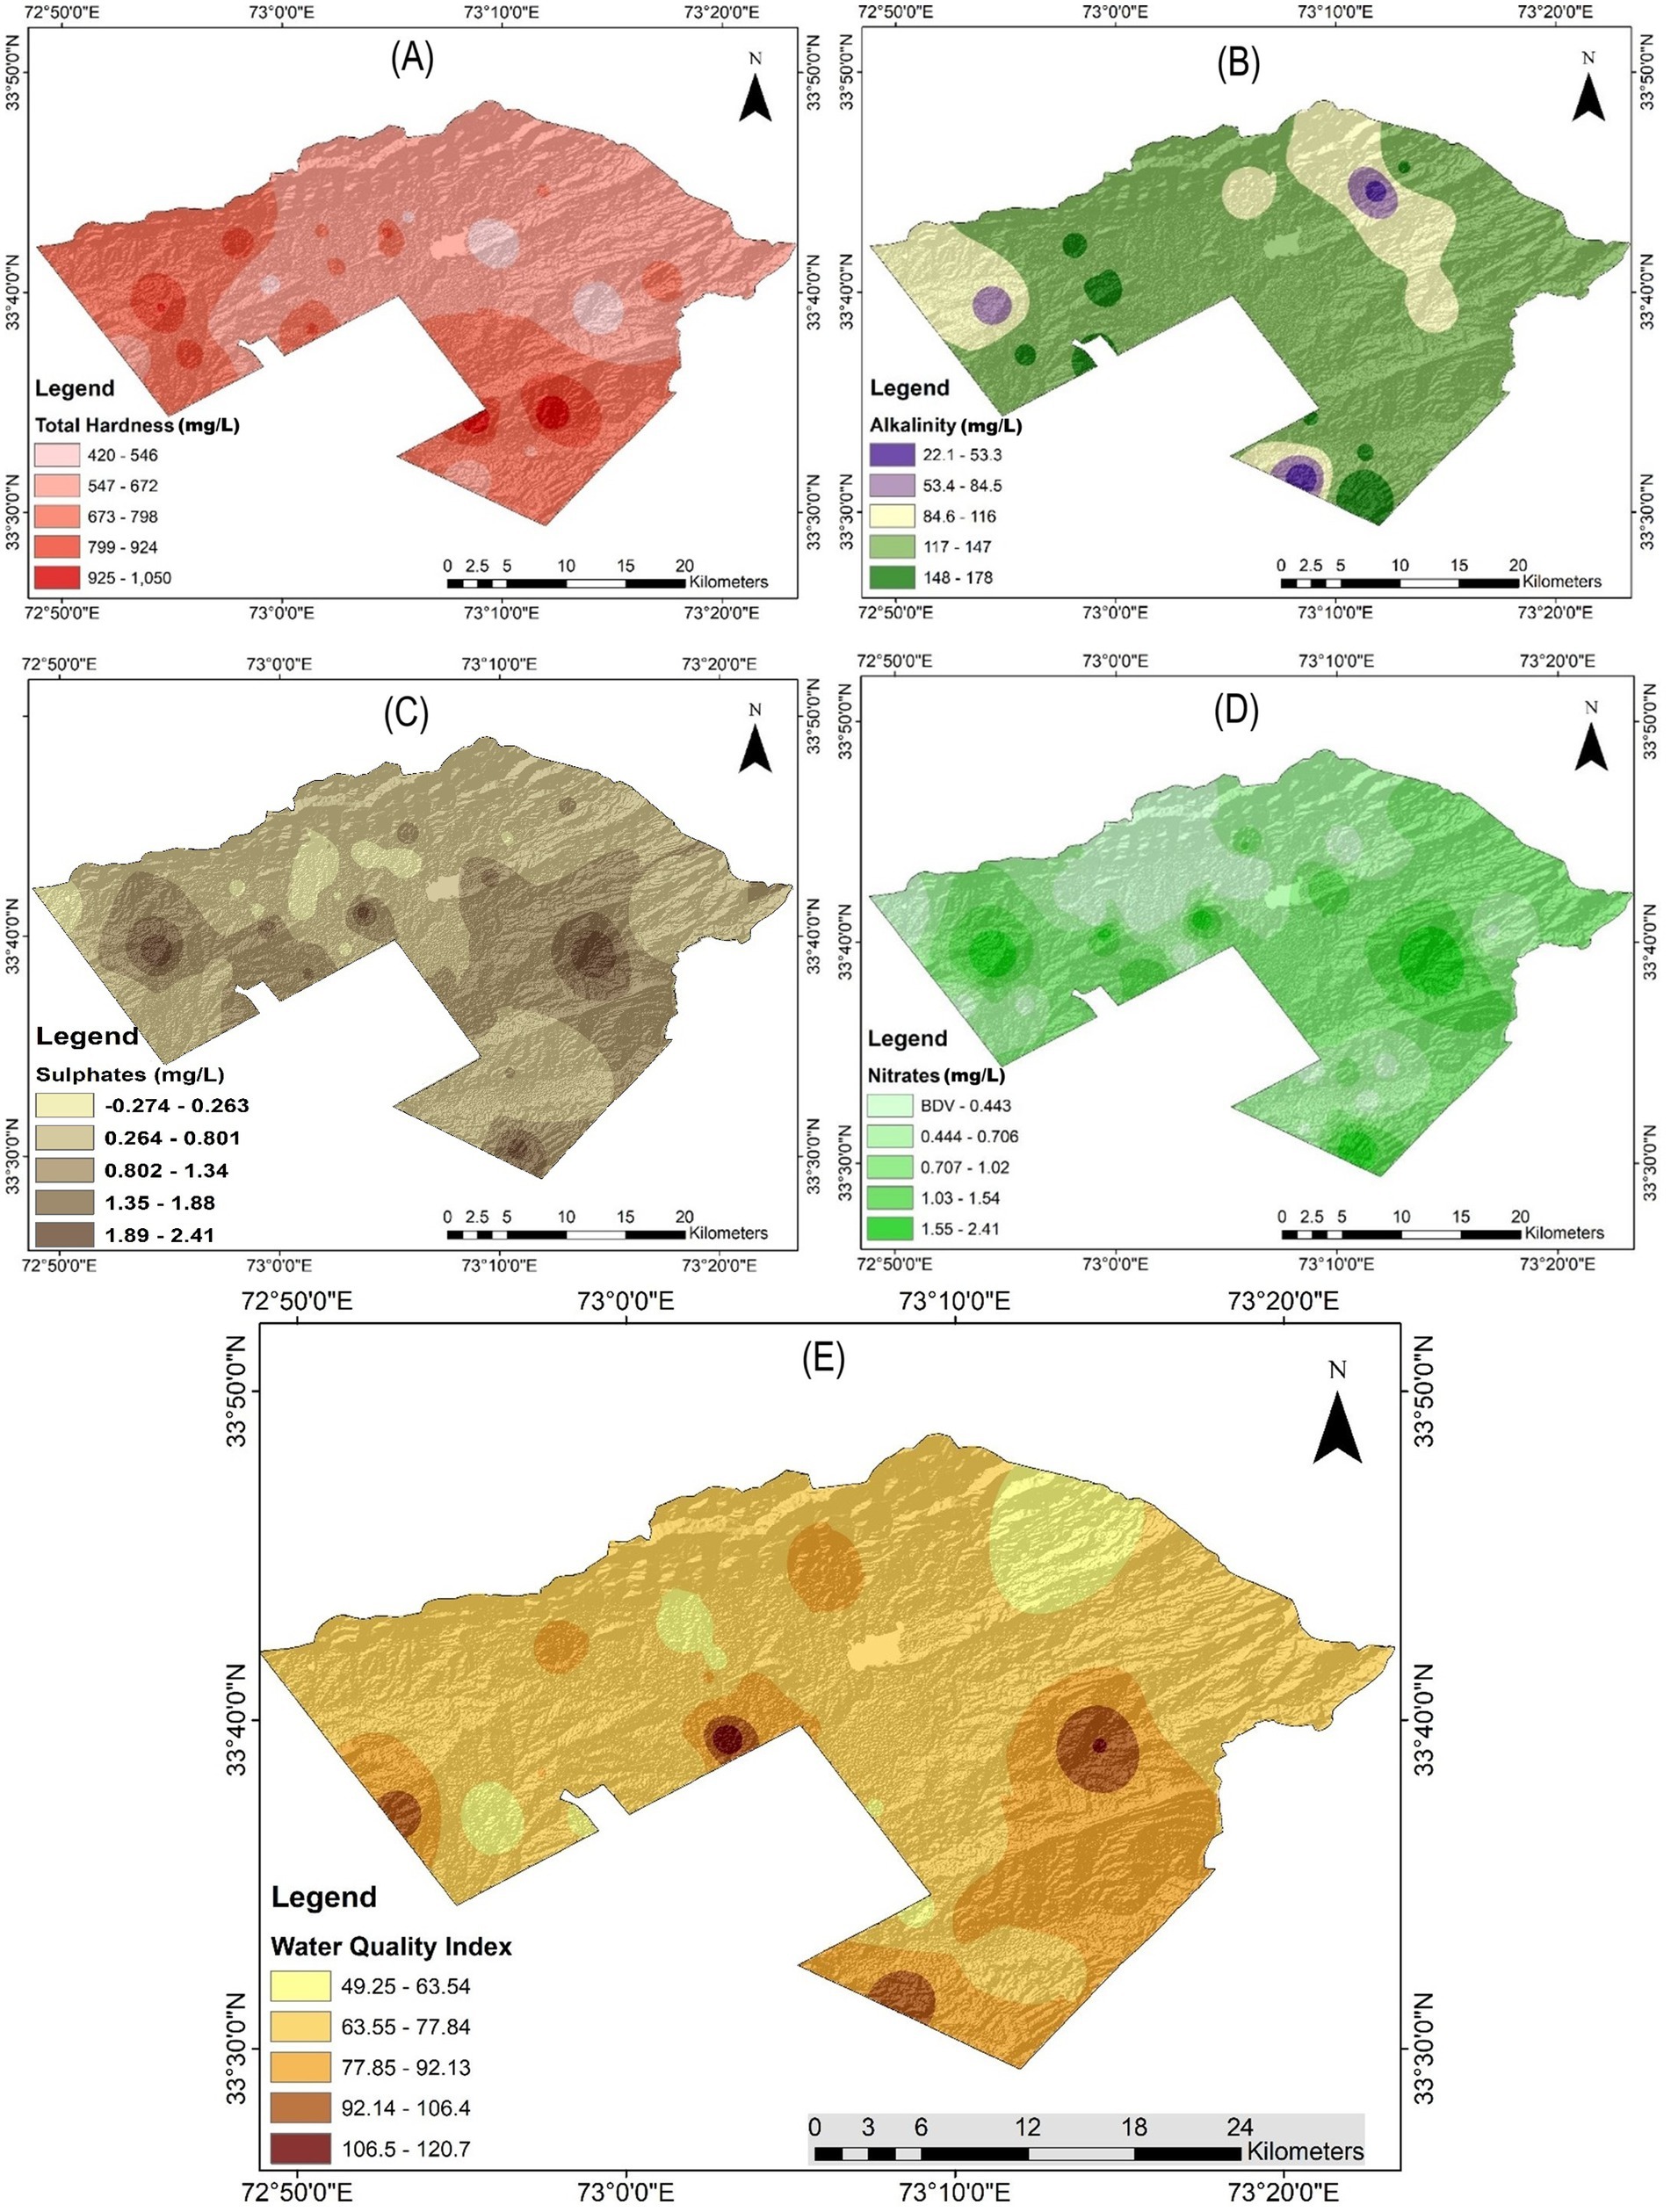
Figure 5. Spatial distributions of Total Hardness (A), Alkalinity (B), Sulphates (C), Nitrates (D), and Water Quality Index (E).
4.1.2.4 Alkalinity
Water’s alkalinity, which is mostly caused by ions like sulfates, bicarbonates, and chlorides, is a measure of how well it neutralizes acidity. Water alkalinity is influenced by a number of processes, such as mineral weathering and biological absorption. A 200 mg/L alkalinity threshold is advised by the WHO. Total alkalinity in this study varied from 22.4 to 178.2 mg/L, and spatial distribution maps showed these changes between sampling sites (Figure 5B).
4.1.2.5 Sulphates and nitrates
Smaller concentrations of Sulphates ions have little effect on the taste of water, but larger concentrations can have negative health effects. A maximum sulfate content of 250 mg/L is advised by the WHO. Sulphates levels in this study ranged from 0 to 2.41 mg/L, showing notable departures from the recommended ranges. A vital nutrient called Nitrates frequently signals pollution from organic waste. Different Nitrates levels were detected in the investigation; some samples had amounts well below allowable limits, while others had levels as high as 2.4 mg/L. To find possible contaminated sites and guide water quality management plans, spatial distribution maps for Sulphates and Nitrates (Figures 5C,D) were made.
4.2 Water quality index (WQI)
The general acceptability of groundwater for particular uses, such drinking, is represented numerically by the Water Quality Index (WQI). It combines several physico-chemical properties into one easily comprehensible number. Policymakers, researchers, and the general public can use this index to assess and track trends in water quality. Each parameter’s significance in the WQI computation is determined by its intended purpose, which is typically for human consumption, and possible health effects. Figure 5E shows the spatial distribution of WQI values.
Lastly, the values from Equations 3, 4 are added to Equation 2 to determine the total of the individual values, which is how the water quality index (WQI) for each sample is determined. Three categories are created from the water based on the obtained water quality index (WQI) values (Table 1).
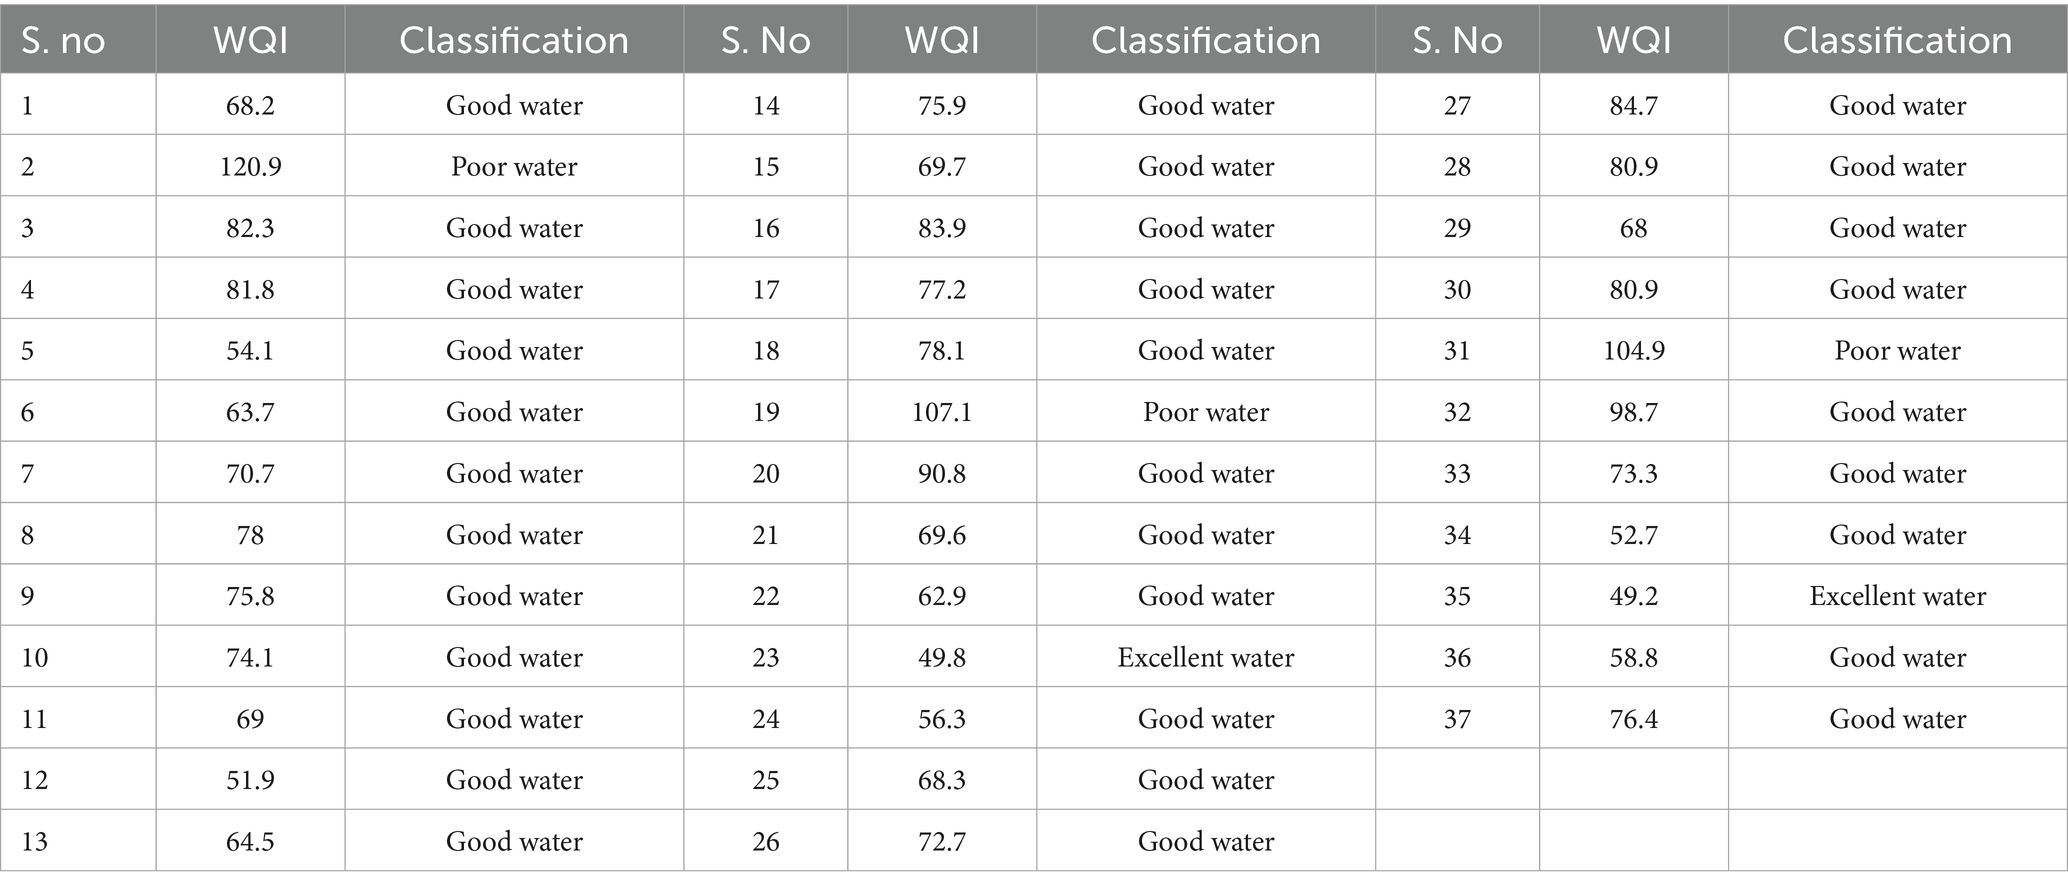
Table 1. Calculation of WQI for individual water samples.
According to Sahu and Sikdar (2008), these classifications include excellent, good and poor. The results of the groundwater testing showed that 86.4% of the samples had “good water,” 8.1% had “poor water,” and the remaining 5.4% samples had “excellent water.” The places where wastewater was disposed of were closer to regions with poor water quality. The water was classified into several groups according to the water quality index (WQI) in compliance with the water grading recommendations in Table 2, which were also approved (Sahu and Sikdar, 2008). Most areas surrounding the wastewater discharge site had acceptable to excellent water quality based on these requirements, with fewer exceptional water discoveries. Near the wastewater disposal site, most of the water quality was poor. Haq and Cheema (2011) have indicated that industrial and urban waste pose a threat to the quality of groundwater in the Rawalpindi and Islamabad region. The main source of this contamination is the Korang and Lai Nullah Rivers’ replenishment mechanism, which transfers 0.545 million m3/day of water. Trash disposal and the sewage system are two more important factors that contribute to high concentration (see Figure 6).
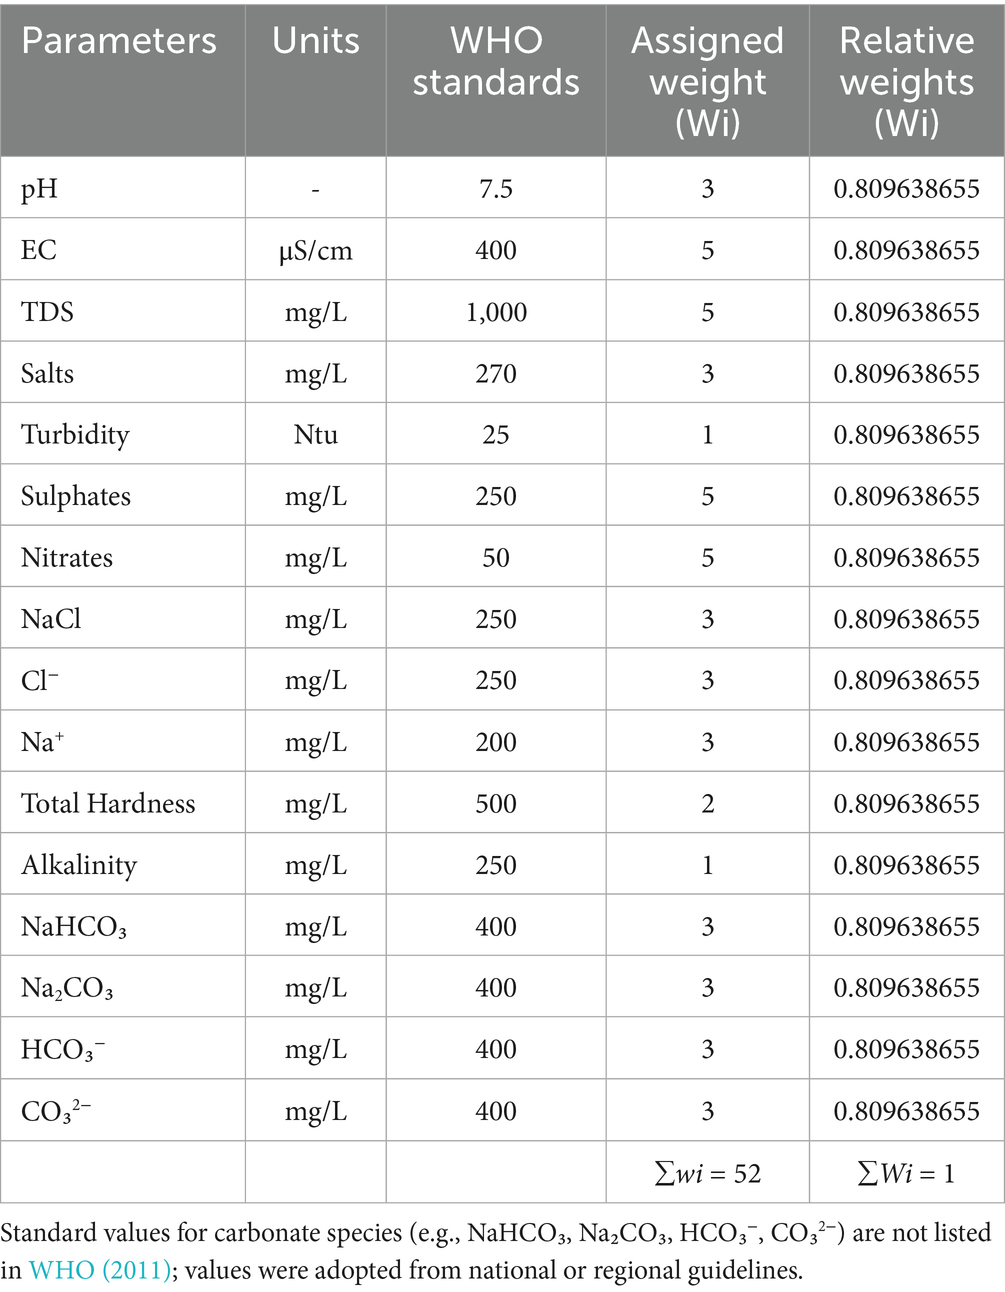
Table 2. The weight and relative weight of a few selected parameters of the Islamabad groundwater, as well as standard values provided by the WHO (2011).
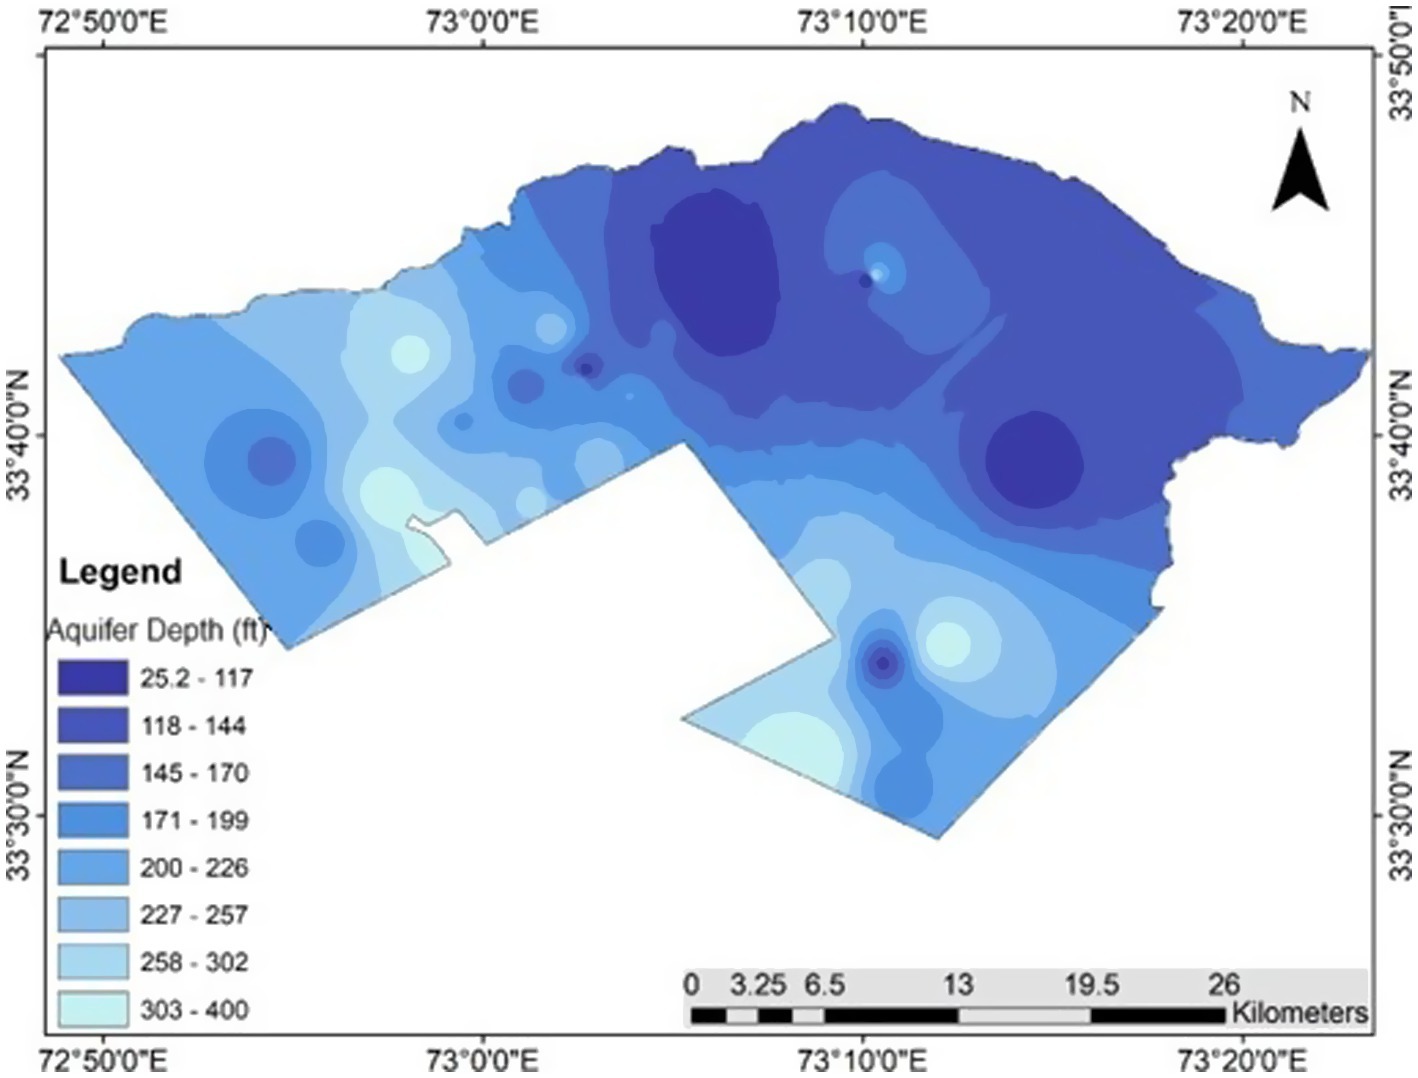
Figure 6. Water table depth of Islamabad.
As determined by WHO (2011) drinking water standards and backed by earlier research (Rishnaiah et al., 2009; Sahu and Sikdar, 2008), the allocated weights (wi) represent the relative impact of each parameter on human health. Less important metrics like turbidity and alkalinity were given lower values, while parameters with a stronger impact on health and quality, such EC, TDS, Nitrates, and Sulphates, were given higher weights.
4.3 Correlation of water table depth with hydrochemical variations
Using a collection of 37 well readings, the water table was created using Geographic Information System (GIS) techniques. A continuous geographic representation of the water table depth, spanning from 25 feet to 399 feet, was produced throughout the study area by using kriging interpolation. Significant differences are seen on the generated map, where deeper regions correspond to poorer groundwater availability while shallower depths indicate greater groundwater accessibility and possible recharging zones.
By dividing borewells into shallow and deep groups according to their overall depth, depth-based chemical variation was deduced. Comparative analysis was carried out across boreholes of different depths rather than taking several vertical samples from individual wells.
At various depths, the study shows clear chemical differences. Higher levels of electrical conductivity (EC), total dissolved solids (TDS), chloride (Cl−), and sulfate (SO₄2−) were found in shallower areas, suggesting a stronger impact from surface contamination and possible human activity. Higher quantities of calcium (Ca2+), magnesium (Mg2+), and bicarbonate (HCO₃−) were found in deeper water table areas, on the other hand. This is probably because of longer water-rock interactions and greater mineral dissolution.
The findings provide critical insights into the spatial distribution of the water table and associated hydrochemical patterns, supporting effective groundwater resource management. The distribution of water table depths appears in patch-like formations, suggesting that the underlying aquifer media is structured as lens-shaped geological units (Smedley, 2001).
4.4 Regression analysis
A very weak linear association between the water table depth and the Water Quality Index (WQI) was found by regression analysis, which produced a very low R-squared value of 0.0157 (Figure 7). This indicates that changes in depth alone account for just 1.57% of the variation in WQI. The relationship is statistically negligible and unimportant for making predictions because of its low explanatory power.
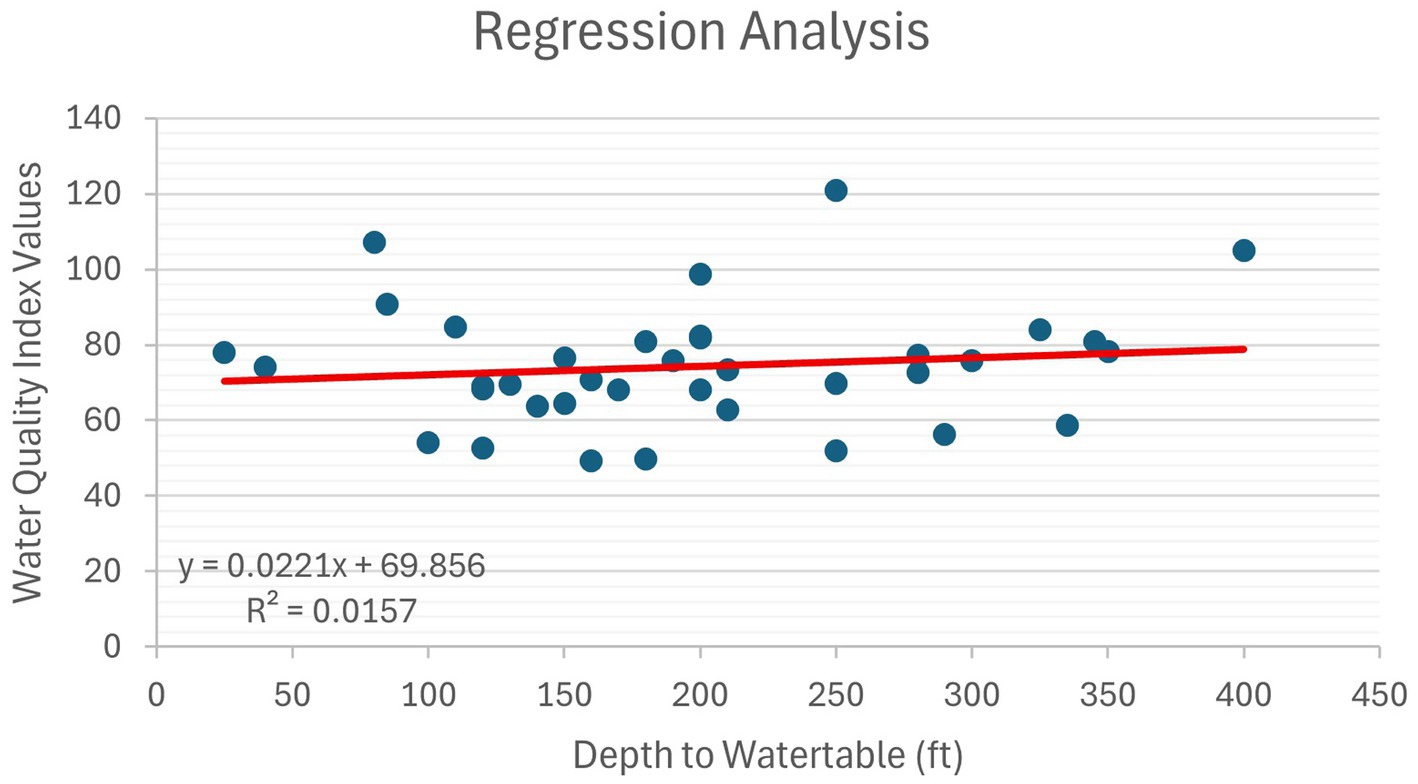
Figure 7. Linear regression between WQI and water table depth. The low R2 value (0.0157) indicates a weak correlation, suggesting that depth alone does not control groundwater.
The intricacy of the variables affecting groundwater quality in the research region is demonstrated by this outcome. Rather than just water table depth, variations in WQI are probably caused by a mix of land use patterns, aquifer properties, recharge mechanisms, and localized contamination sources. The linear model’s low explanatory power suggests that other analytical techniques might be more appropriate.
To better capture multivariate influences on groundwater quality, especially in areas with larger and more diverse datasets, future research may benefit from using more reliable statistical techniques like multiple regression, principal component analysis (PCA), or machine learning models (e.g., random forest).
4.5 Descriptive statistics of hydrochemical parameters
Descriptive statistics were computed for each of the major physico-chemical parameters in order to give a statistical overview of groundwater quality throughout the study region. For 16 measured indicators, including as pH, electrical conductivity (EC), total dissolved solids (TDS), main ions (e.g., Cl−, SO₄2−, Na+), and others, Table 3 shows the minimum, maximum, mean, and standard deviation values. This synopsis supports further spatial and depth-based interpretations covered in the ensuing sections and aids in quantifying the variability of water quality.
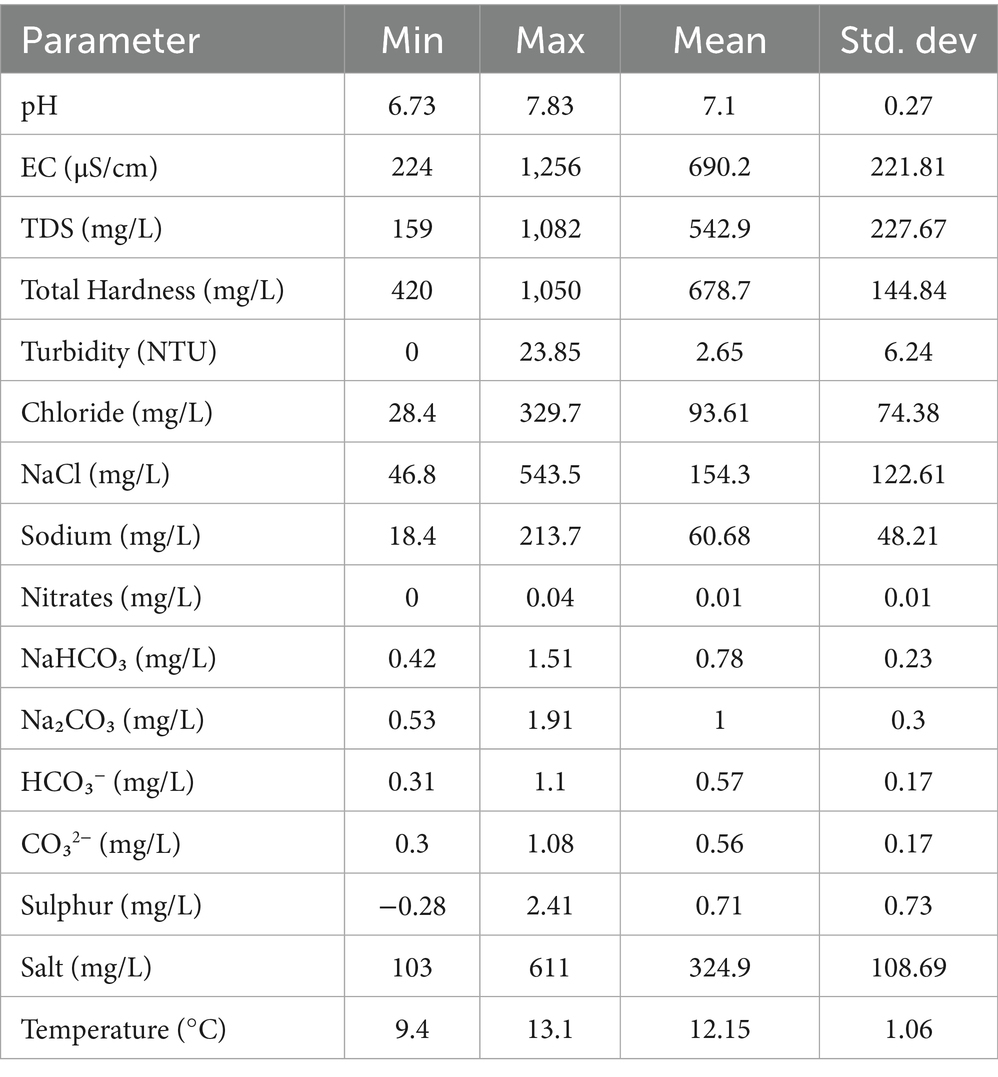
Table 3. Descriptive statistics of groundwater hydrochemical parameters in Islamabad.
4.6 Linear regression analysis of WQI with hydrochemical parameters
The findings of several linear regression studies that were performed to evaluate the correlation between the Water Quality Index (WQI) and different hydrochemical factors, such as depth, are shown in Table 4. Each regression model’s R-squared value, regression coefficient p-value, coefficient, and 95% CI are shown in the table.
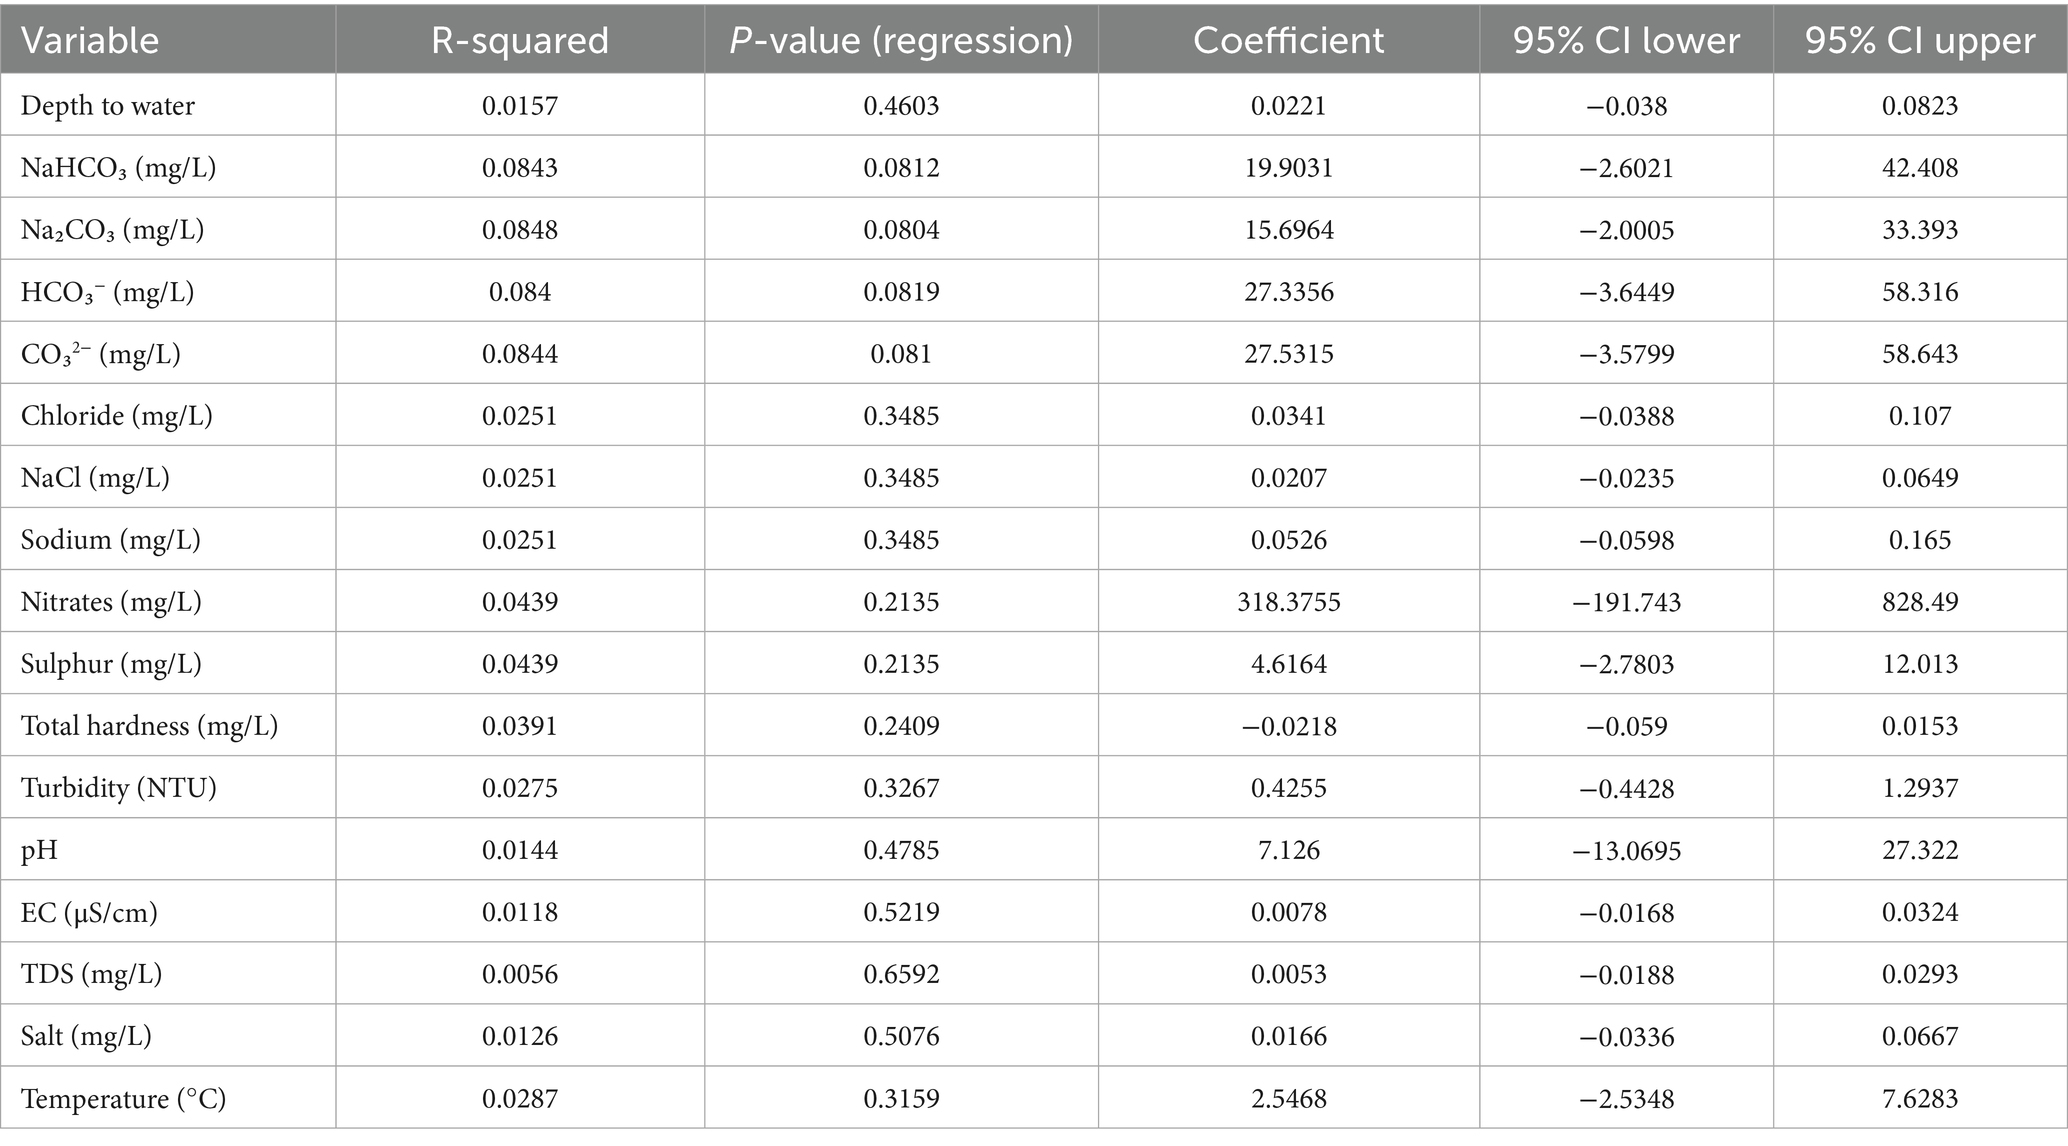
Table 4. Individual linear regression results for water quality index (WQI) with hydrochemical parameters and depth, including R-squared, P-values, coefficients, and 95% confidence intervals.
According to the p-values, there was no statistically significant linear association between WQI and any of the specific hydrochemical parameters or depth (p > 0.05). The 95% confidence intervals for each regression coefficient, which continuously encompass 0, lend more credence to this. These individual models’ R-squared values were likewise low, indicating that each parameter alone only accounts for a small percentage of the variance in WQI.
5 Discussion
Water table depth and groundwater chemistry research conducted in Islamabad provide important new information about the availability and quality of water in the area. As per the Water Quality Index (WQI), most water samples are categorized as “Good Water,” signifying that the groundwater in Islamabad is generally safe to drink. A limited percentage of samples, nevertheless, fit the “Poor Water” description. In places where pollution is more likely to occur, such as those near industrial zones or wastewater discharge points, this emphasizes the necessity for ongoing monitoring and control to prevent the degradation of water quality.
The presence of higher sulfate levels, high total dissolved solids (TDS), and total hardness in some samples indicates that specific regions of the aquifer are more vulnerable to contamination in terms of chemical composition (Troudi et al., 2020; Yarlanki et al., 2025). Both natural geological formations and human actions, such as the discharge of industrial waste and agricultural runoff, can produce these toxins (Akhtar et al., 2021). Significantly beyond the WHO recommendation limits, the study’s findings of excessive sulfate levels raise worries about possible health consequences, such as gastrointestinal discomfort, while the high total hardness in water poses threats to infrastructure and public health, including pipe scaling and appliance damage (Navarro and Zagmutt, 2009; Pizarro et al., 1999).
Recent regional investigations have proven that both natural and man-made factors influence the variation in groundwater quality in Islamabad. According to the current study, regions with higher urban densities, wastewater discharge, and uncontrolled land use also had higher Nitrates and EC concentrations. These regions align with high-susceptibility zones recognized by Shinwari et al. (2025), who mapped aquifer vulnerability throughout Islamabad using a GIS-based DRASTIC model. Their findings draw attention to certain polluted locations, like Rawal Lake and the National Agricultural Research Center, where inappropriate fertilizer and waste management greatly increase the danger of contamination.
Fertilizer leaching is another way that peri-urban agricultural activities raise Nitrates and Sulphates levels. The region’s shallow unconfined aquifers make it much more susceptible to surface contamination. These results lend credence to the idea that surface land use and waste management methods have a direct impact on groundwater quality, highlighting the necessity of aquifer conservation, integrated urban planning, and focused monitoring.
The study also highlights the spatial variability of the water table, with depths ranging from 25 to 399 feet. Shallow water tables are generally associated with higher recharge potential and better accessibility, making them more desirable for water extraction. In contrast, deeper water tables pose greater challenges for groundwater extraction and are often more susceptible to long-term depletion or contamination due to slower recharge rates (Foster et al., 2013). The use of GIS and IDW interpolation techniques allowed for the creation of a detailed water table depth map, providing a clear visual representation of water accessibility across the region (Khouni et al., 2021). This model is a crucial tool for city planners and policymakers, enabling them to identify areas where sustainable water management practices are most needed.
Given the rapid urbanization and industrialization of Islamabad, it is imperative to adopt sustainable groundwater management strategies. Increasing demand for water, driven by population growth and industrial needs, puts significant pressure on the city’s limited groundwater resources. To address these challenges, infrastructure improvements for water treatment are necessary, particularly in areas with substandard water quality. Furthermore, public education campaigns promoting efficient water use and protection of recharge zones will help safeguard this critical resource for future generations. Seasonal variations in groundwater depth and quality are not recorded because the study is based on samples taken during a single season (the pre-monsoon dry period). This is acknowledged as a drawback, and multi-seasonal evaluations could be advantageous for subsequent research.
Although the study’s findings support the general safety of Islamabad’s groundwater, they also highlight the necessity of proactive management techniques. The city can protect its water supplies for long-term use by enacting stronger rules on industrial discharge, improving wastewater treatment facilities, and guaranteeing sustainable groundwater extraction. Maintaining a dependable and secure groundwater supply for Islamabad’s citizens will require a comprehensive strategy combining technology advancements like GIS modeling, environmental preservation, and regulatory enforcement as the city continues to grow.
Alluvial deposits, sandstone, and limestone formations make up Islamabad’s subsurface hydrogeology, which forms unconfined to semi-confined aquifers. Shinwari et al. (2025) claim that differences in sediment size have a major impact on aquifer permeability, with fractured sandstone and coarse-grained alluvium encouraging faster groundwater flow and greater susceptibility to contamination. Because pollution transfer is enhanced in recharge zones and shallow aquifers, these formations are particularly vulnerable. Furthermore, surface runoff and infiltration patterns are significantly influenced by the research area’s topography. According to Shinwari et al. (2025), the region’s slope varies from 0° to 64.8°, with the majority of the land falling between 0° and 6.1°, indicating fairly gentle terrain. The hydrogeological significance of structural and slope-based variability is further highlighted by the fact that such low slopes promote increased infiltration rates and localized recharging while simultaneously raising the risk of pollution accumulation in low-lying zones.
The vast majority of the research area is covered by urban land cover, which has a strong influence on groundwater quality (Shinwari et al., 2025). Urban areas increase impervious surface area, which decreases natural recharge and speeds up runoff, especially in areas with extensive infrastructure and people. This increases the movement of surface pollutants into shallow aquifers, including sewage leaks, heavy metals, and oil residues. Thus, the spatial trends of increased contamination in densely populated regions are supported by the prevalence of urban land use throughout Islamabad, underscoring the necessity of focused monitoring and enhanced waste management techniques in these locations.
The interaction between natural geochemical processes and human-induced contamination is shown in the vertical distribution of groundwater ions in Islamabad. Lowered Nitrates (NO₃−), carbonate (CO₃2−), and sodium carbonate (Na₂CO₃) concentrations at shallow depths are probably caused by fertilizer runoff, septic tank discharges, and the infiltration of organic waste (Covington et al., 2023; Shinwari et al., 2025). Sulfur compounds can come from both natural processes like the oxidation of sulfide minerals and man-made sources like industrial discharge. The breakdown of carbonate-rich rocks and soil minerals also contributes to the buildup of carbonates at shallow depths (Khan et al., 2013). On the other hand, geogenic processes including extended water–rock interaction, cation exchange, and upward migration of deeper saline water are suggested by increased concentrations of electrical conductivity (EC) and chloride (Cl−) in deeper aquifers (Edet and Okereke, 2001). The idea that natural geochemical evolution is the main process in deeper groundwater chemistry is supported by the absence of surface pollution indicators at depth.
6 Conclusion
This study offers a comprehensive evaluation of the groundwater quality in Islamabad using depth profiling, hydrochemical analysis, and GIS-based spatial modeling. Although the majority of samples were rated as “Good” by the Water Quality Index (WQI), several zones—especially those close to wastewater discharge areas—exceeded WHO criteria for electrical conductivity, TDS, sulfates, and chloride.
According to spatial and depth-based modeling, deeper aquifers have higher levels of bicarbonates and chloride because of long-term mineral dissolution and water–rock interactions, while shallow aquifers are more vulnerable to anthropogenic pollution. Regression and significance tests, among other statistical analyses, revealed only a minimal association (R2 = 0.0157, p > 0.05) between water table depth and WQI, indicating that a combination of depth-independent surface and subsurface factors influence groundwater quality.
The depth-stratified hydrochemical profiling and simultaneous use of WQI, GIS modeling, and regression-based validation—a methodology not before used in Islamabad—are what make this work innovative. This gives urban designers a multifaceted view of groundwater vulnerabilities, both lateral and vertical.
Implications for policy and management include:
• Tighter control over the discharge of wastewater from homes and businesses
• Zoning protections in high-risk recharge regions (such as Tarnol)
• Investing in infrastructure for centralized treatment as well as point-of-use filtering
This study encourages evidence-based decision-making to assist safe and sustainable groundwater management in the context of Islamabad’s fast urbanization.
6.1 Recommendations
• Targeted monitoring: Pay close attention to groundwater quality monitoring in high-risk locations, such as Tarnol, and close to wastewater discharge zones.
• Pollution mitigation: Implement more stringent regulations for the disposal of industrial and domestic wastewater.
• Infrastructure improvement: To handle different pollution threats, invest in both household-level filtration systems and centralized treatment facilities.
• Groundwater management and zoning: Implement regulatory zoning to limit drilling in areas that are susceptible to recharge and promote sustainable extraction limitations.
• Education and public awareness: Expand public education initiatives to support groundwater recharge zone preservation and water conservation.
• Predictive modeling: To estimate future contamination hazards, employ predictive models that integrate climate data and land use change.
• Institutional coordination: To harmonize groundwater governance policies, encourage cooperation between water utilities, local government, and environmental agencies.
Data availability statement
The original contributions presented in the study are included in the article/supplementary material, further inquiries can be directed to the corresponding author.
Author contributions
FS: Investigation, Methodology, Software, Writing – original draft. UL: Formal analysis, Investigation, Methodology, Writing – original draft. MK: Conceptualization, Supervision, Visualization, Writing – review & editing. GK: Data curation, Resources, Validation, Writing – review & editing. PM: Data curation, Funding acquisition, Validation, Writing – review & editing. VL: Data curation, Funding acquisition, Project administration, Validation, Writing – review & editing. AA: Data curation, Project administration, Resources, Validation, Writing – review & editing.
Funding
The author(s) declare that no financial support was received for the research and/or publication of this article.
Conflict of interest
The author(s) declare that the research was conducted in the absence of any commercial or financial relationships that could be construed as a potential conflict of interest. The authors declare no conflict of interest.
Generative AI statement
The author(s) declare that no Gen AI was used in the creation of this manuscript.
Publisher’s note
All claims expressed in this article are solely those of the authors and do not necessarily represent those of their affiliated organizations, or those of the publisher, the editors and the reviewers. Any product that may be evaluated in this article, or claim that may be made by its manufacturer, is not guaranteed or endorsed by the publisher.
References
Abbas, S., Hashmi, I., Rehman, M. S. U., Qazi, I. A., Awan, M. A., and Nasir, H. (2015). Monitoring of chlorination disinfection by-products and their associated health risks in drinking water of Pakistan. J. Water Health 13, 270–284. doi: 10.2166/wh.2014.212
Akhtar, N., Ishak, M. I. S., Bhawani, S. A., and Umar, K. (2021). Various natural and anthropogenic factors responsible for water quality degradation: a review. Water 13:2660. doi: 10.3390/w13192660
APHA. (1998). Standard Methods for the Examination of Water and Wastewater. 20th Edition, American Public Health Association, American Water Works Association and Water Environmental Federation, Washington DC, USA.
Barbieri, M., Barberio, M. D., Banzato, F., Billi, A., Boschetti, T., Franchini, S., et al. (2023). Climate change and its effect on groundwater quality. Environ. Geochem. Health 45, 1133–1144. doi: 10.1007/s10653-021-01140-5
Basharat, M. (2019). “Water management in the Indus Basin in Pakistan: challenges and opportunities” in Indus River Basin. eds. S. I. Khan and T. E. Admas III. (United States: Elsevier), 375–388.
Butt, A., Shabbir, R., Ahmad, S. S., and Aziz, N. (2015). Land use change mapping and analysis using remote sensing and GIS: a case study of Simly watershed, Islamabad, Pakistan. Egypt. J. Remote Sens. Space Sci. 18, 251–259. doi: 10.1016/j.ejrs.2015.07.003
Covington, M., Martin, J., Toran, L., Macalady, J., Sekhon, N., Sullivan, P., et al. (2023). Carbonates in the critical zone. Earth’s Fut. 11:e2022EF002765. doi: 10.1029/2022EF002765
Dahan, O., Talby, R., Yechieli, Y., Adar, E., Lazarovitch, N., and Enzel, Y. (2009). In situ monitoring of water percolation and solute transport using a vadose zone monitoring system. Vadose Zone J. 8, 916–925. doi: 10.2136/vzj2008.0187
Edet, A., and Okereke, C. (2001). A regional study of saltwater intrusion in southeastern Nigeria based on the analysis of geoelectrical and hydrochemical data. Environ. Geol. 40, 1278–1289. doi: 10.1007/s002540100313
U.S. Environmental Protection Agency (EPA) (1985). Compilation of air pollution emission factors, AP-42. NC: Research Triangle Park.
Foster, S., Chilton, J., Nijsten, G. J., and Richts, A. (2013). Gro undwater—a global focus on the ‘local resource. Curr. Opin. Environ. Sustain. 5, 685–695. doi: 10.1016/j.cosust.2013.10.002
Frantzeskakis, I. M. (2009). Islamabad, a town planning example for a sustainable city. Sustain. Dev. Plan. IV 120, 75–85. doi: 10.2495/SDP090081
Haq, I., and Cheema, W. A. (2011). Adverse effects of poor wastewater management practices on ground water quality in Rawalpindi and mitigation strategies. Available online at: http://www.wasa.rda.gov.pk/MD_Papers/Paper_for_Engineering_congress.pdf
Hassan, M., and Hanif, S. (2014). Physical, chemical and microbiological analysis of the water quality of Rawal Lake, Pakistan. Int. J. Agric. Res. Innov. Technol. 4, 28–31. doi: 10.3329/ijarit.v4i1.21087
Kemper, K. E. (2004). Groundwater—From development to management. Hydrogeol. J. 12, 3–5. doi: 10.1007/s10040-003-0300-6
Khan, N., Hussain, S. T., Saboor, A., Jamila, N., and Kim, K. S. (2013). Physicochemical investigation of the drinking water sources from Mardan, Khyber Pakhtunkhwa, Pakistan. Int. J. Phys. Sci. 8, 1661–1671. doi: 10.5897/IJPS2013.3999
Khouni, I., Louhichi, G., and Ghrabi, A. (2021). Use of GIS based inverse distance weighted interpolation to assess surface water quality: case of Wadi El bey, Tunisia. Environ. Technol. Innov. 24:101892. doi: 10.1016/j.eti.2021.101892
Krishnaswamy, J., Bonell, M., Venkatesh, B., Purandara, B. K., Rakesh, K., Lele, S., et al. (2013). The groundwater recharge response and hydrologic services of tropical humid forest ecosystems to use and reforestation: support for the “infiltration-evapotranspiration trade-off hypothesis”. J. Hydrol. 498, 191–209. doi: 10.1016/j.jhydrol.2013.06.034
Malik, A. H. (2000). Integrated urban Lei River (North Pakistan) water resources management. Int. J. Water Res. Dev. 16, 97–117. doi: 10.1080/07900620048546
Naeem, S., Cao, C., Qazi, W., Joharestani, M. Z., Chen, W., Acharya, B., et al. (2018). Studying the association between green space characteristics and land surface temperature for sustainable urban environments: an analysis of Beijing and Islamabad. ISPRS Int. J. Geo Inf. 7:38. doi: 10.3390/ijgi7020038
Navarro, I., and Zagmutt, F. J. (2009). “Chemical health risks” in Urban water security: Managing risks. eds. B. J. Cisneros and J. B. Rose (London, UK: CRC Press), 53–133.
Pizarro, F., Olivares, M., Uauy, R., Contreras, P., Rebelo, A., and Gidi, V. (1999). Acute gastrointestinal effects of graded levels of copper in drinking water. Environ. Health Perspect. 107, 117–121. doi: 10.1289/ehp.99107117
Prasad, M., Sunitha, V., Balaji, E., Reddy, B. M., Sudharshan Reddy, Y., and Kumar, B. P. (2025). “Application of water quality index, hierarchical cluster analysis, pollution index of groundwater and geospatial Technologies in Evaluating the water quality: a study from Mangampeta barytes mine area, South India” in Groundwater resource management planning strategies: A geospatial approach. eds. V. Sunitha, B. M. Reddy, Y. S. Reddy, M. Prasad, B. P. Kumar, and E. Balaji, vol. 1. (Switzerland: Springer Nature Switzerland), 745–774.
Rahman, A. (2008). A GIS based DRASTIC model for assessing groundwater vulnerability in shallow aquifer in Aligarh, India. Appl. Geograp. 28, 32–53. doi: 10.1016/j.apgeog.2007.07.008
Rishnaiah, C. R., Sadashivaiah, C., and Ranganna, G. (2009). Assessment of water quality index for the ground water in Tumkur taluk. E J. Chem. 2009, 523–530. doi: 10.1155/2009/757964
Sahu, P., and Sikdar, P. K. (2008). Hydrochemical framework of the aquifer in and around East Kolkata wetlands, West Bengal India. Environ. Geol. 55, 823–835. doi: 10.1007/s00254-007-1026-4
Shabbir, R., and Ahmad, S. S. (2015). Use of geographic information system and water quality index to assess groundwater quality in Rawalpindi and Islamabad. Arab. J. Sci. Eng. 40, 2033–2047. doi: 10.1007/s13369-015-1697-7
Shinwari, F. U., Khan, M. A., Siyar, S. M., Liaquat, U., Kontakiotis, G., Zhran, M., et al. (2025). Evaluating the contamination susceptibility of groundwater resources through anthropogenic activities in Islamabad, Pakistan: a GIS-based DRASTIC approach. Appl Water Sci 15:81. doi: 10.1007/s13201-025-02063-2
Shirazi, S. M., Imran, H. M., and Akib, S. (2012). GIS-based DRASTIC method for groundwater vulnerability assessment: a review. J. Risk Res. 15, 991–1011. doi: 10.1080/13669877.2012.686053
Tirkey, A. S., Pandey, A. C., and Nathawat, M. S. (2013). Use of satellite data, GIS and RUSLE for estimation of average annual soil loss in Daltonganj watershed of Jharkhand (India). J. Remote Sens. Technol. 1, 20–30. doi: 10.18005/JRST0101004
Troudi, N., Hamzaoui-Azaza, F., Tzoraki, O., Melki, F., and Zammouri, M. (2020). Assessment of groundwater quality for drinking purpose with special emphasis on salinity and nitrates contamination in the shallow aquifer of Guenniche (northern Tunisia). Environ. Monit. Assess. 192, 1–19. doi: 10.1007/s10661-020-08411-0
United Nations. (2018). World urbanization prospects: the 2018 revision. Available online at: https://population.un.org/wup/Publications/Files/WUP2018-FinalReport.pdf
Wahab, A., Saeed, K., Azam, M., and Nasir, S. (2012). Distribution and status of threatened species of Freshwater Turtles in selected areas of Indus River System. Islamabad, Pakistan: Zoological Survey of Pakistan, Ministry of Climate Chnafe.
Yarlanki, V. K., Vadithya, G. N., Etikala, B., and Golla, V. (2025). Hydrogeochemical characterization and source evaluation of groundwater contamination in parts of the Uddanam CKDu area, southern India: integrating statistical, geochemical modeling, pollution, and health indices. Int. J. Environ. Res. 19, 1–24. doi: 10.1007/s41742-024-00730-2
Keywords: sustainable water supply, groundwater quality, water table depth, water quality index (WQI), geographic information system (GIS)
Citation: Shinwari FU, Liaquat U, Khan MA, Kontakiotis G, Makri P, Lianou V and Antonarakou A (2025) Hydrochemical zonation and depth-based vulnerability of groundwater in Islamabad using GIS and WQI techniques. Front. Water. 7:1581668. doi: 10.3389/frwa.2025.1581668
Edited by:
Daniela Ducci, University of Naples Federico II, ItalyReviewed by:
Mariachiara Caschetto, University of Milano-Bicocca, ItalyBalaji Etikala, Yogi Vemana University, India
Mohamed A. E. AbdelRahman, National Authority for Remote Sensing and Space Sciences, Egypt
Heba El-Bagoury, Port Said University, Egypt
Copyright © 2025 Shinwari, Liaquat, Khan, Kontakiotis, Makri, Lianou and Antonarakou. This is an open-access article distributed under the terms of the Creative Commons Attribution License (CC BY). The use, distribution or reproduction in other forums is permitted, provided the original author(s) and the copyright owner(s) are credited and that the original publication in this journal is cited, in accordance with accepted academic practice. No use, distribution or reproduction is permitted which does not comply with these terms.
*Correspondence: Mumtaz Ali Khan, bXVtdGF6a2hhbkBidWkuZWR1LnBr; George Kontakiotis, Z2tvbnRha0BnZW9sLnVvYS5ncg==
†ORCID: Mumtaz Ali Khan, orcid.org/0000-0001-6660-0859