 Ahmed S. Alghamdi
 Amr Mohamed Mahmoud
 Sultan Ahmed
- Water Technologies Innovation Institute and Research Advancement (WTIIRA), Saudi Water Authority (SWA), Jubail, Saudi Arabia
This study investigates the potential for energy reduction in a full-scale Seawater Reverse Osmosis (SWRO) desalination plant through hybrid integration with Pressure Retarded Osmosis (PRO). A pilot test using a 60 m2 PRO membrane kit helped determine key operating parameters, including draw solution (DS) pressure and resulting dilution fluxes. Subsequently, a full-scale analysis was conducted with 650 m2 of PRO membrane area. The integration demonstrated up to 12.56% reduction in specific energy consumption under optimized conditions. Energy savings were found to correlate positively with lower feed pressures, higher brine availability, and optimal dilution rates, while being negatively impacted by pressure losses and high DS-to-FS flow ratios. The study confirms the viability of PRO-SWRO hybridization as a method for enhancing desalination energy efficiency, and highlights areas for further optimization in membrane design and hydraulic configuration.
Introduction
Several configurations have been developed over the years to enhance the energy efficiency of Seawater Reverse Osmosis (SWRO) desalination plants (Schunke et al., 2020). Among the emerging alternatives, salinity gradient energy—often referred to as “blue energy” (Yip et al., 2016; Lanjewar et al., 2020)—has gained attention as a stable and renewable source. Unlike solar and wind power, which suffer from intermittent availability and fluctuating capacity factors between 10 and 30% depending on the region and season (Yip et al., 2016; Sterl et al., 2018; Warsinger et al., 2022; Al Mashrafi et al., 2022), salinity gradient energy offers continuous operation potential when fed by constant seawater and brine sources (Kurihara and Takeuchi, 2018; Bharadwaj et al., 2016).
Pressure Retarded Osmosis (PRO) is one of the promising technologies to harness this gradient by transferring water from a low-salinity feed solution (FS) to a high-salinity draw solution (DS), thereby generating hydraulic pressure that can be used to recover energy. This energy can either drive a turbine or exchange pressure with other streams to reduce the energy required for desalination processes (Kurihara and Takeuchi, 2018). The amount of energy generated depends primarily on the osmotic pressure difference between the FS and DS (Kurihara and Takeuchi, 2018; Abdelkader, 2022; Amy et al., 2017), with theoretical maxima occurring at half the pressure differential (Abdelkader, 2022; Matsuyama et al., 2021). However, real-world energy extraction is limited by factors such as internal and external concentration polarization (ICP and ECP), salt permeation, membrane tortuosity, and other design-specific parameters (Abdelkader and Sharqawy, 2022; Darwish et al., 2014).
In this study, we evaluate the additional energy savings achievable by integrating PRO with SWRO using pre-treated seawater as the FS and SWRO brine as the DS. A parametric analysis was conducted to examine the influence of key variables such as DS feed pressure, FS feed pressure, pressure losses, ERD efficiency, and dilution flow rate on net energy recovery.
While several prior studies have investigated the integration of PRO in SWRO systems, most of them were limited to small-scale experiments or theoretical modeling, often reporting energy savings in the range of 3–10% under idealized conditions (Al Mashrafi et al., 2022; Kurihara and Takeuchi, 2018; Abdelkader and Sharqawy, 2022). In contrast, this study builds on real-world operational data and evaluates a parametric range using scaled-up PRO membrane area (650 m2), yielding up to 12.56% energy savings. This makes the present study one of the few to demonstrate such significant energy reduction under realistic conditions, supporting the practical feasibility of PRO-SWRO hybridization in commercial desalination plants.
The background of PRO studies is presented in Section 2. The adopted methodology to quantify energy savings from PRO-SWRO hybrid configurations compared to a conventional SWRO configuration is discussed in Section 3. The influence of operating parameters such as DS and FS feed pressures, DS pressure losses, flow ratios, and dilution is presented in Section 4. Throughout this work, the terms “PRO-SWRO hybrid” and “SWRO-PRO hybrid” are used interchangeably, although the diluted DS is not used as a feed stream for the SWRO unit.
Background
Desktop tests were conducted (shown in Figure 1) using seawater (SW) as the Feed Solution (FS) and SWRO brine (BR) as the Draw Solution (DS) with the PRO desktop kit which contains a single PRO membrane. Initially, 15 bar was considered as the optimal DS feed pressure. Further tests were also conducted by varying the DS feed pressure in gradual increments of 5 bar from 5 bar to 30 bar. The module in the PRO pressure vessel was a hollow fibre membrane made from cellulose triacetate (CTA) with an inner diameter of 105 μm, an outer diameter of 200 μm and 60 m2 membrane surface area. The results of the desktop studies are shown in Table 1.
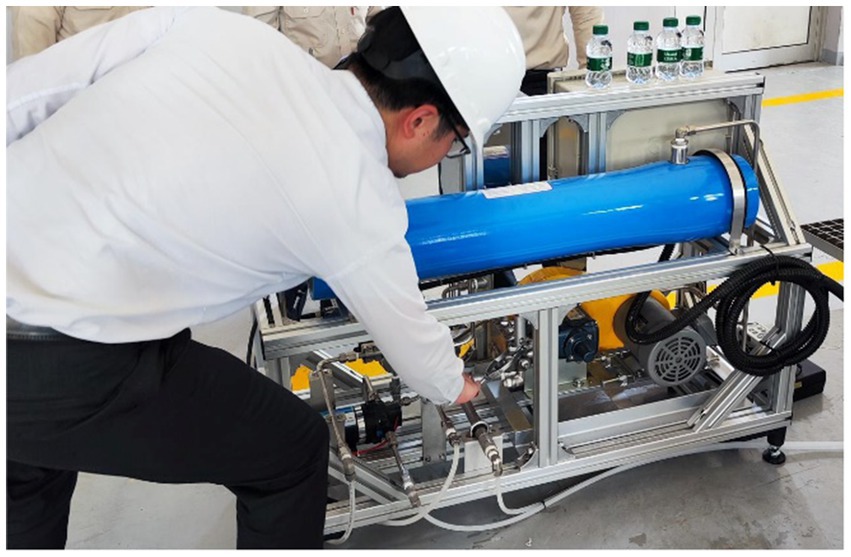
Figure 1. The PRO desktop test kit used in the studies.
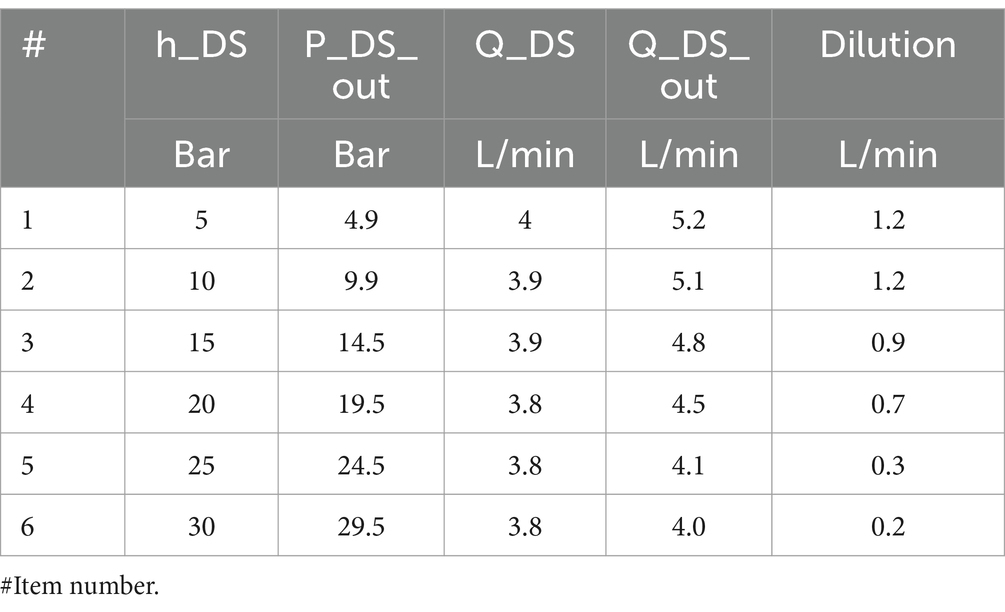
Table 1. DS feed pressure (h_in), DS outlet pressure (h_out), DS inlet flow rate (Q_DS), DS outlet flow rate (Q_DS_out) and the resulting dilution rate obtained from PRO desktop tests.
The optimization studies carried out to determine the DS feed pressure where the maximum power is generated are shown in Figure 2. When the DS feed pressure was 20 bar, maximum amount of power was generated. These findings were further used to carry out the parametric studies which are discussed in the following sections.
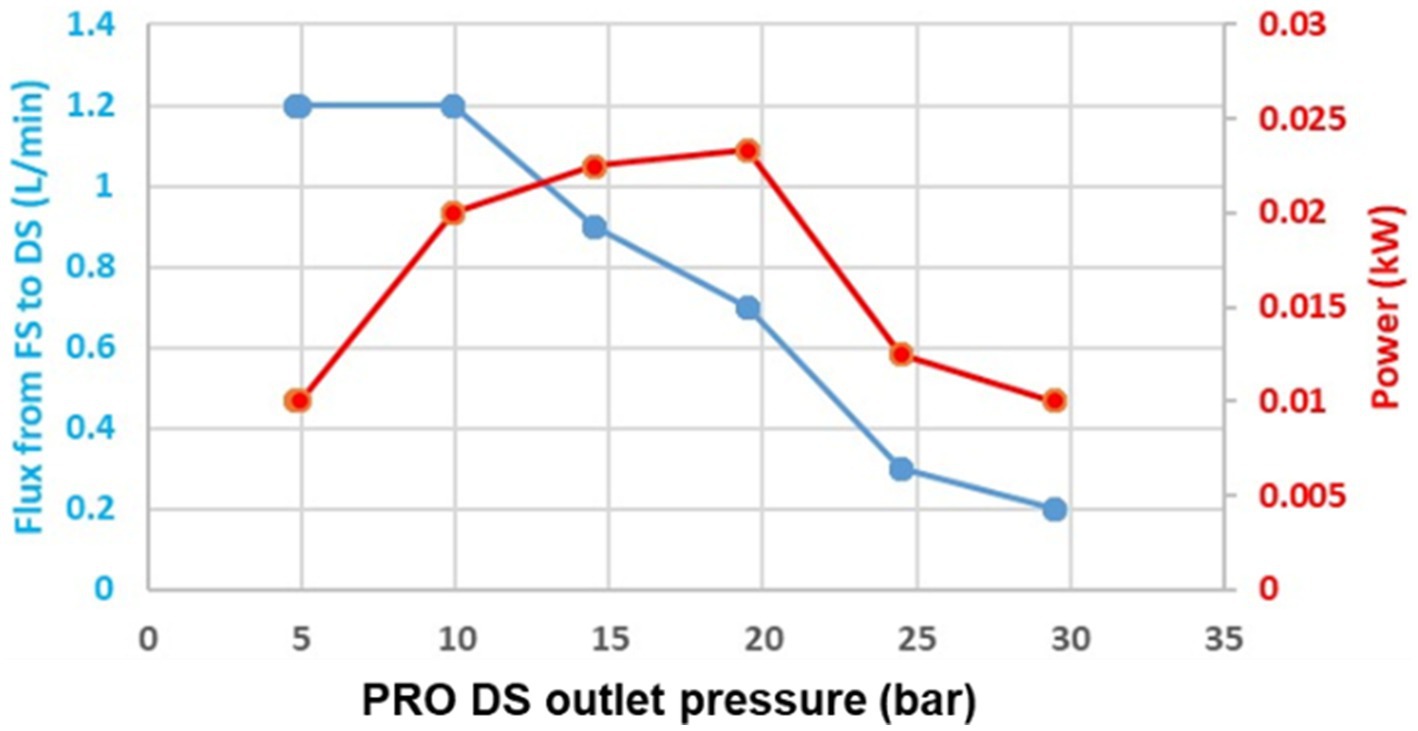
Figure 2. Optimization studies on the generation of power using the PRO desktop unit. Seawater was used as the FS and SWRO brine was used as the DS. The optimum DS feed pressure for maximum power generation was found to be 20 bar.
Methodology
A schematic wherein the transfer of net energy generated in the PRO system after accounting for auxiliary consumption through an ERD to the SWRO system is shown in Figure 3. The SWRO system itself is kept unchanged, i.e., the interface conditions such as the high pressure (HP) pump outlet pressure, the inlet and the outlet pressures of the ERD, and the permeate production are assumed to remain unchanged. However, the pressure on the suction side of the HP pump can be changed by using an ERD between the DS stream of PRO and the feed stream of SWRO before the HP pump.
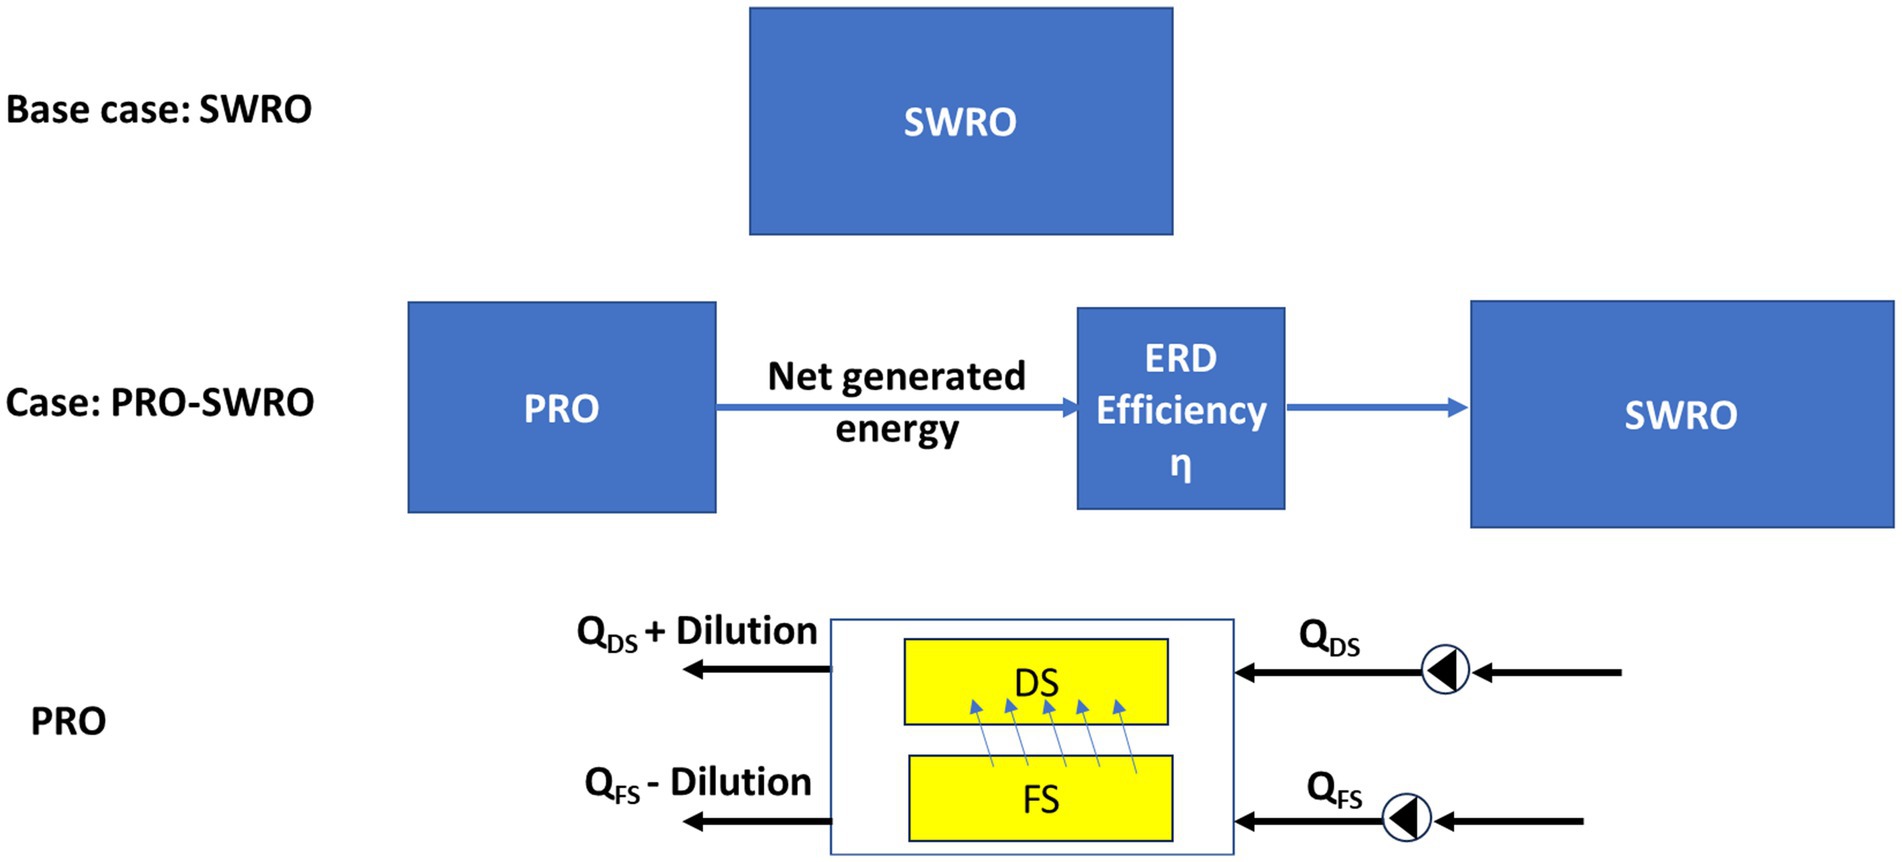
Figure 3. Schematic showing the transfer of energy from the PRO system to the SWRO system. Also shown is the effect of dilution, i.e., flow from the FS side to the DS side in PRO.
Energy transfer from the PRO system to the SWRO system
Energy is generated in the PRO system due to the dilution of the Draw Solution (DS) by the flow from the Feed Solution (FS). The amount of dilution depends on the DS and FS used, the salinities of the solutions and the pressure applied. Certain amount of salts also pass from the FS side to the DS side in PRO. As the reduction in salinity of the DS is of no significant consequence in this study, it is a topic for another manuscript.
Base case
Figure 4 shows the SWRO base case configuration which is a schematic representation of one of the trains in a real plant after the cartridge filters (CF).
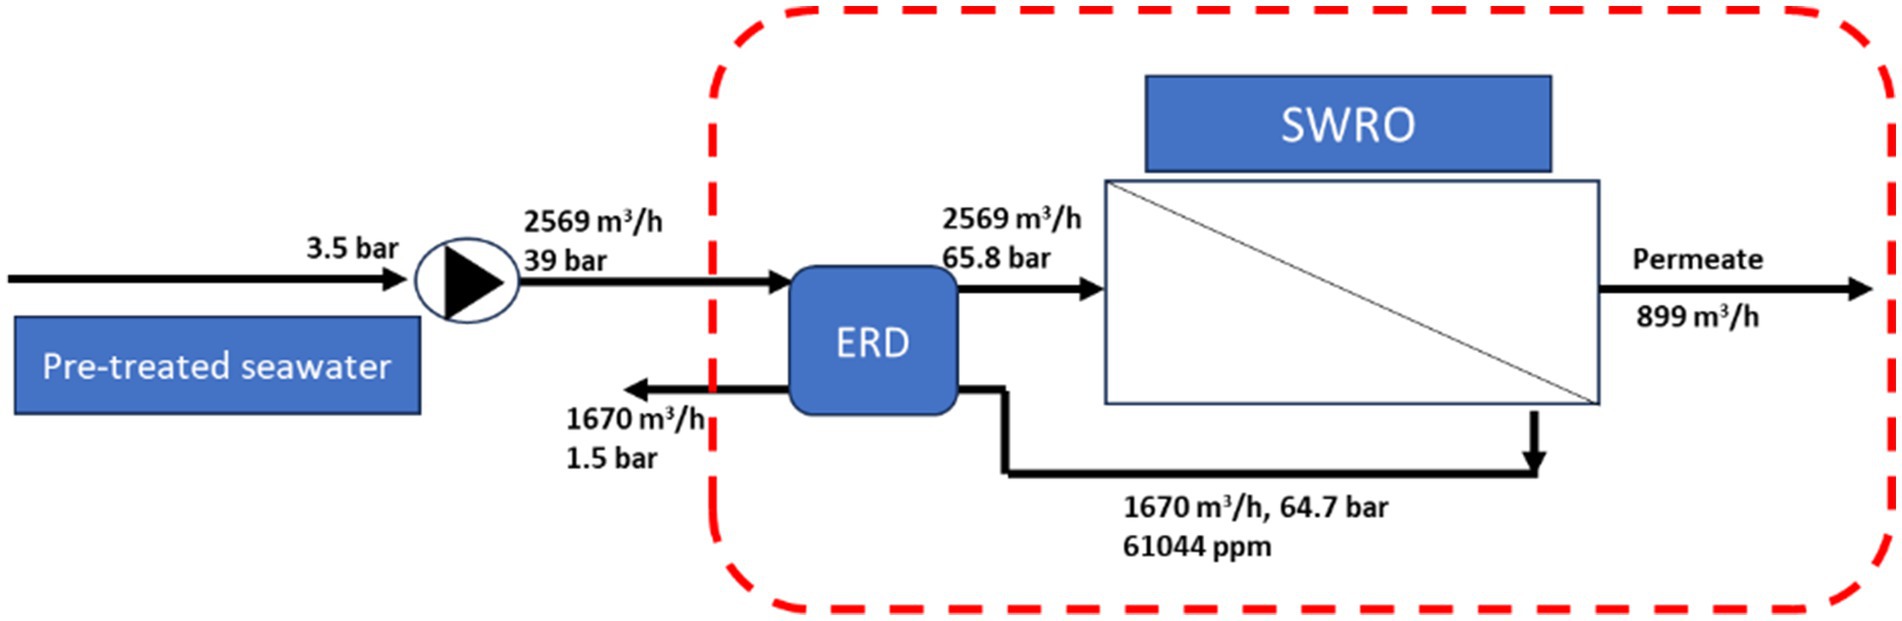
Figure 4. SWRO base case configuration considered in the studies. No changes are made in the area bounded by the red dashed line.
PRO-SWRO case
Figure 5 shows the PRO-SWRO configuration which was considered in the studies. The area bounded by the red dashed line was kept unchanged in the base case and the PRO-SWRO case. Bigger PRO hollow fibre membrane modules with a total membrane area of 650 m2, an inner fibre diameter of 105 μm and an outer fibre diameter of 200 μm were considered for PRO-SWRO hybridization studies. As desktop tests were conducted using the hollow fibre membranes with an area of 60 m2, the flows were assumed to increase proportionally to the ratio of the area of the bigger membranes and the area of the smaller membranes. A provision was also made to add additional brine (Q_BR) to the PRO as DS, if it was available in the desalination plant with the objective of studying its influence on energy savings.
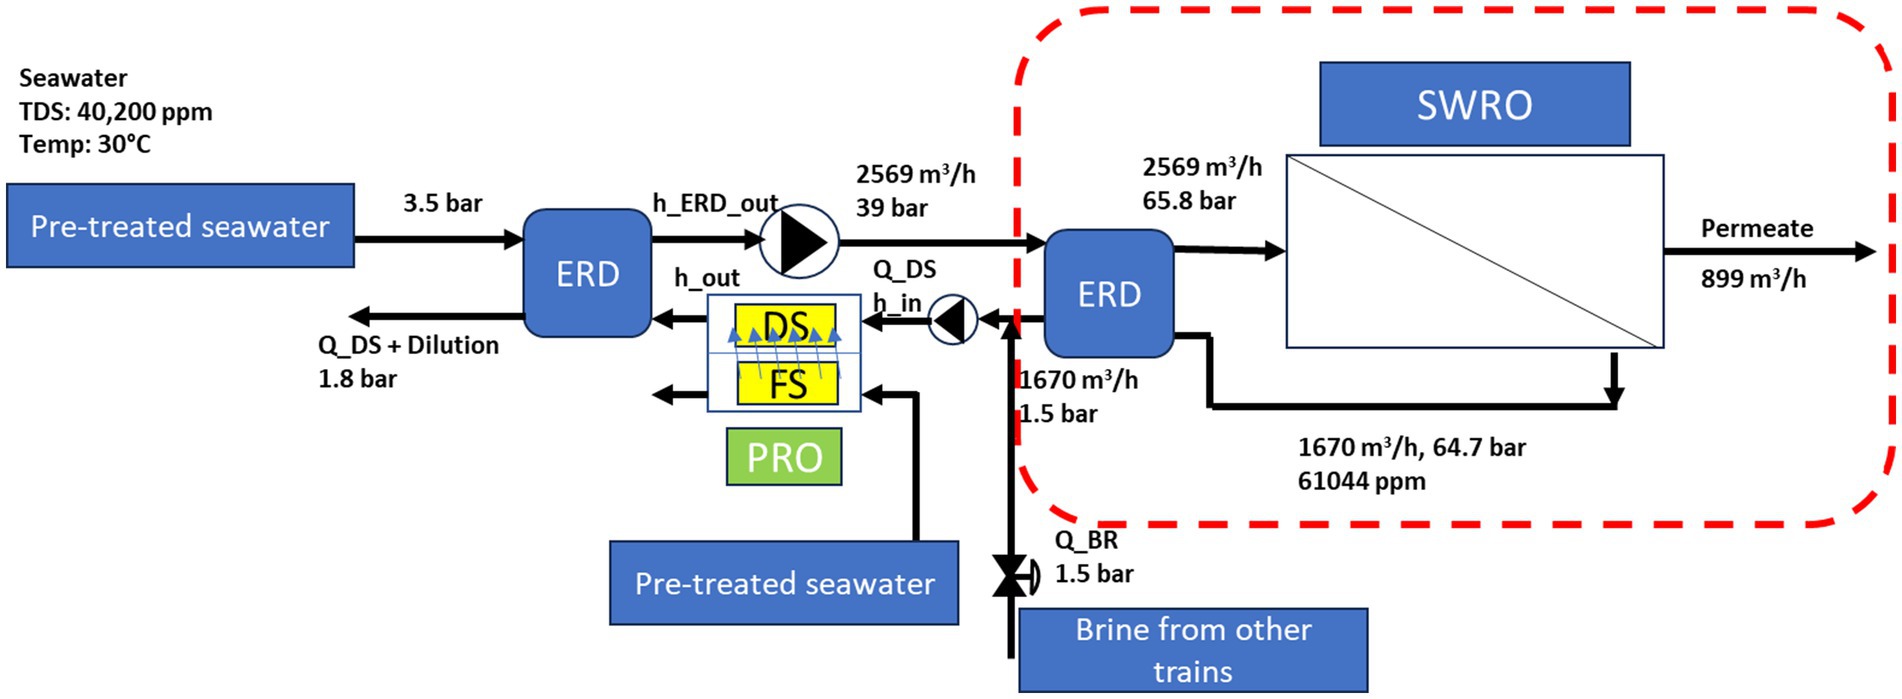
Figure 5. PRO-SWRO hybrid configuration considered in the study*.
Figure 5 shows the added system, the conditions in the area bounded by the red dashed line remain the same as in the base case. The parameters which were varied were the flowrate of DS (Q_DS), the feed pressure of DS (h_in), the outlet pressure of DS after PRO (h_out) and the amount of additional brine considered (Q_BR).
The scaling from 60 m2 to 650 m2 was based on proportional membrane area and flow assumptions, maintaining similar membrane type and operating pressure. While hydraulic similarity (e.g., pressure drops, flow distribution) was assumed, we acknowledge that actual large-scale systems may introduce channeling or non-uniform flow distribution, which should be validated in future pilot-scale implementation.
The energy generated and transferred from the PRO system to the SWRO system is calculated based on Equations 1–9. Auxiliary consumption, pressure losses (∆h_PRO and ∆h_other), and ERD efficiency are integrated into the model, as further explored in the results section.
Energy generated by the PRO system
Energy generated by the PRO system is given by equation:
Where, is the head of DS after the PRO system.
The net energy generated by the PRO system () is the difference between the energy generated by the PRO system () and the auxiliary consumption in the PRO system ().
Auxiliary consumption includes the energy required by the pump used to feed the DS into the PRO () and also the energy required to pump the FS into the PRO (). If the FS is made to flow under gravity, then will be zero. Furthermore, the pressure losses after the PRO system () can also be included under auxiliary losses () by reducing the head output by the PRO (). These are discussed in later sections. is the pressure loss on the DS side in the PRO system.
Energy transferred to the SWRO system
The energy transferred to the SWRO system from the PRO system depends on the efficiency of the ERD used and can be estimated as
Energy saved in the SWRO system
Energy is saved in the SWRO system by the transfer of energy from the PRO system to the SWRO system and can be calculated as
A parametric analysis was performed to study the influence of different parameters on the total amount of energy contributed by the PRO system to the SWRO system. The following parameters/a combination of parameters were considered: DS feed pressures, pressure losses in the system on the DS side, ERD efficiencies, usage of additional brine as DS, flow rates of FS, FS feed pressures, and dilution rate of DS by FS.
Results and discussion
The specific energy consumption in the SWRO base case is 2.84 kWh/m3. For the PRO with SWRO case, when the DS feed pressure is 20 bar with no pressure losses, the DS flow rate and the dilution rate are 3.8 L/min and 0.7 L/min, respectively with an ERD having 98% efficiency. Under the optimal parametric conditions tested in this study, the maximum observed energy savings reached 12.56% (0.36 kWh/m3). However, this value should be interpreted as a peak scenario based on modeled performance, rather than a statistically averaged result. Further experimental repetition is required to validate this figure with statistical certainty.”
To further understand the influence of the parameters listed in the previous section, a parametric analysis was carried out and the results are presented in this section.
a Effect of various DS feed pressures and DS side pressure losses on energy savings
Figure 6 shows the possible savings in energy at various DS feed pressures. The highest amount of energy saving is seen in the 20 bar DS feed pressure case. With an increase in the pressure losses, a decrease in energy savings is observed. 100% additional brine was considered in these cases with an ERD having 98% efficiency, a FS feed pressure at 0.25 bar and the dilution flow rates as seen in the desktop tests (Table 2).
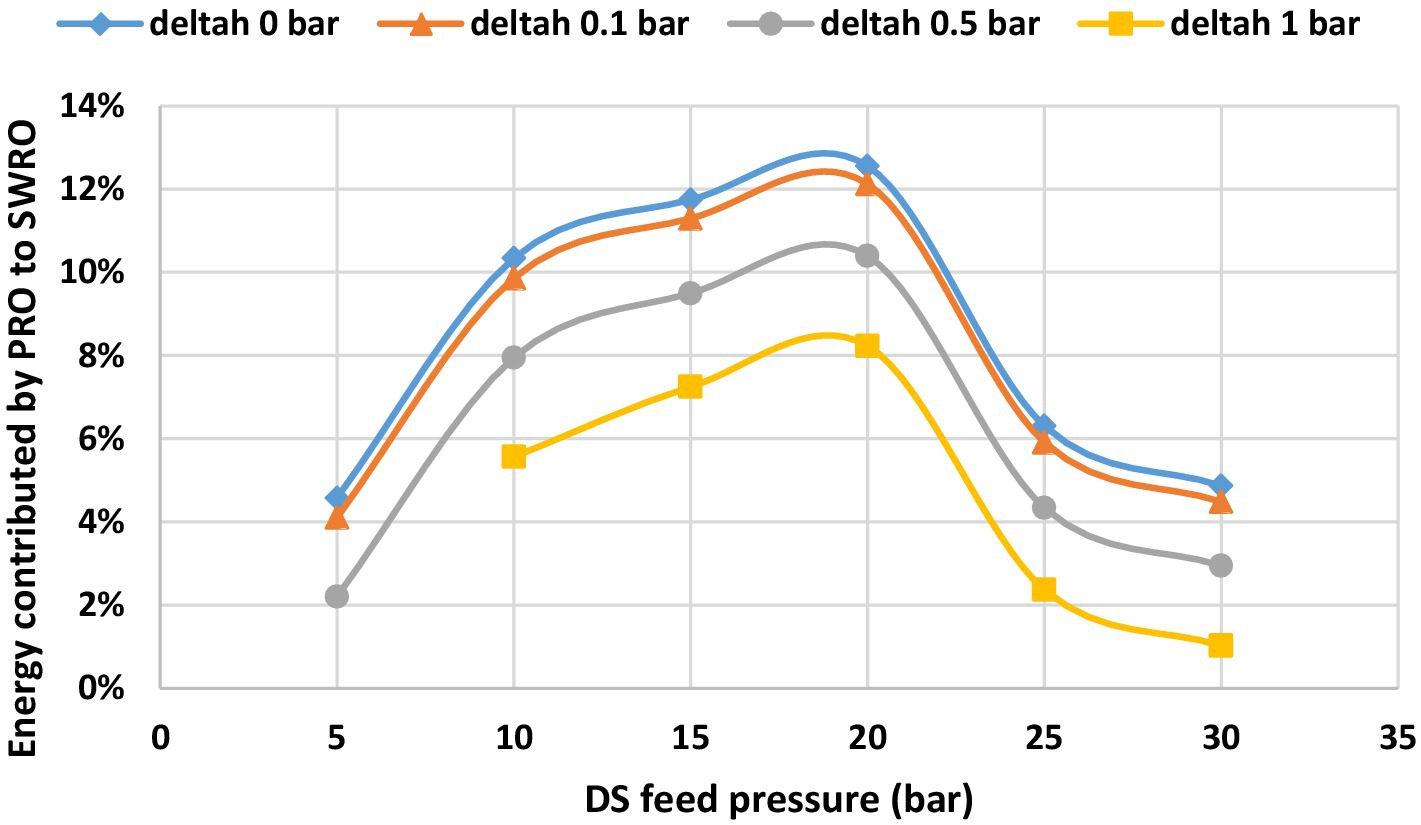
Figure 6. Effect of different DS feed pressures and DS pressure losses on energy savings.
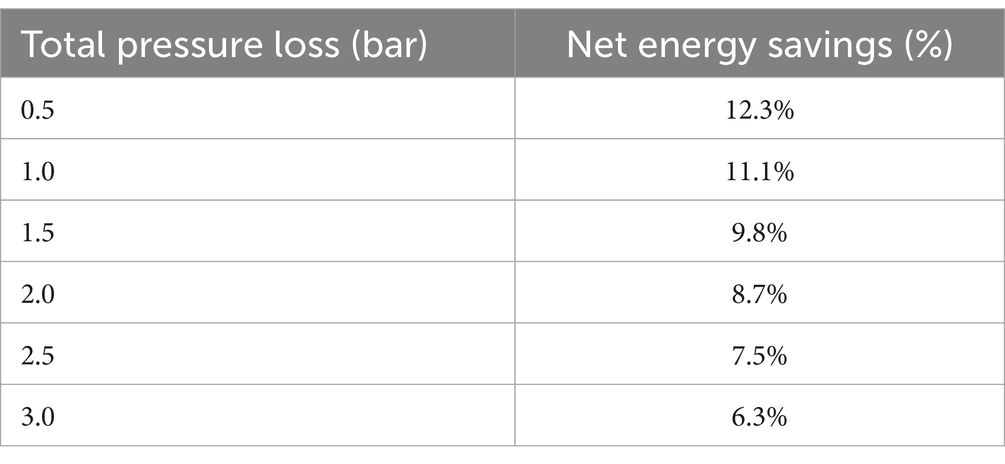
Table 2. Effect of total pressure loss (Δh) on net energy savings.
These values reflect realistic loss ranges observed in hollow fibre PRO modules in commercial applications. Reducing system pressure losses—through optimal piping layout, module arrangement, and minimizing friction—is critical for maximizing energy recovery.
b Effect of ERD efficiency on energy savings
As the efficiency of the ERD increases, the amount of energy saved in the SWRO system increases. Figure 7 illustrates how energy savings scale with ERD efficiency across various DS pressures. In this study, we simulated efficiencies ranging from 40 to 98%. As shown, energy savings increase almost linearly with ERD efficiency, reinforcing the importance of using advanced ERD units in hybrid configurations.
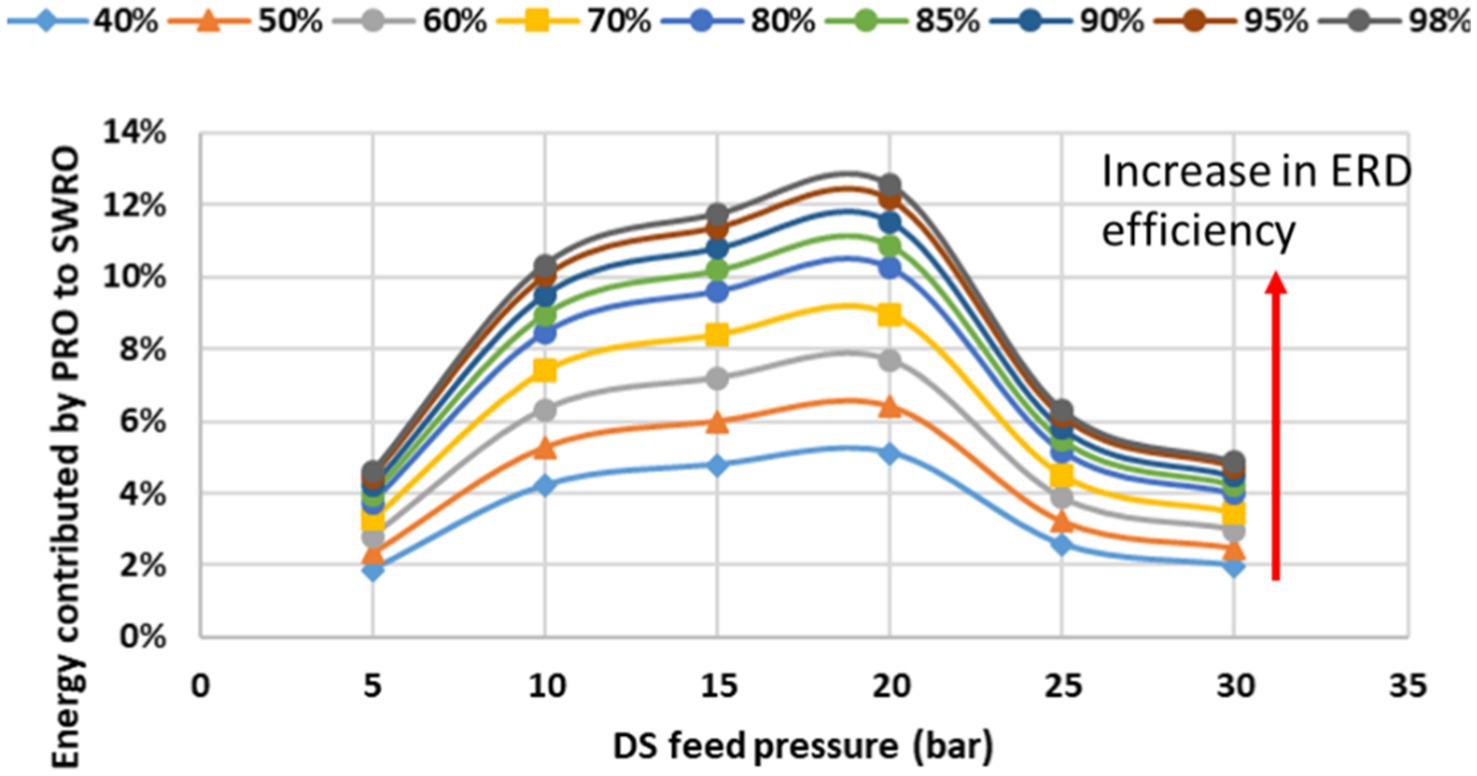
Figure 7. Effect of ERD efficiency on the energy saved at different DS feed pressures.
For instance, reducing ERD efficiency from 98 to 85% resulted in a drop in energy savings from 12.56% to ~10.4%. This sensitivity should be considered in technology selection and during plant operation where flow and pressure conditions may deviate from nominal values as seen in the desktop tests (see Table 1).
a. Effect of additional brine quantity on energy savings
Figure 8 highlights the impact of supplying additional brine as DS in the PRO system. With limited brine availability from a single train, energy gains are marginal. When more brine is available (e.g., from parallel SWRO trains), the osmotic pressure difference increases, leading to higher dilution and energy yield. However, this must be balanced with the capital cost of additional PRO modules and the associated increase in FS volume required for dilution.
a. c Effect of dilution flow variation on energy savings
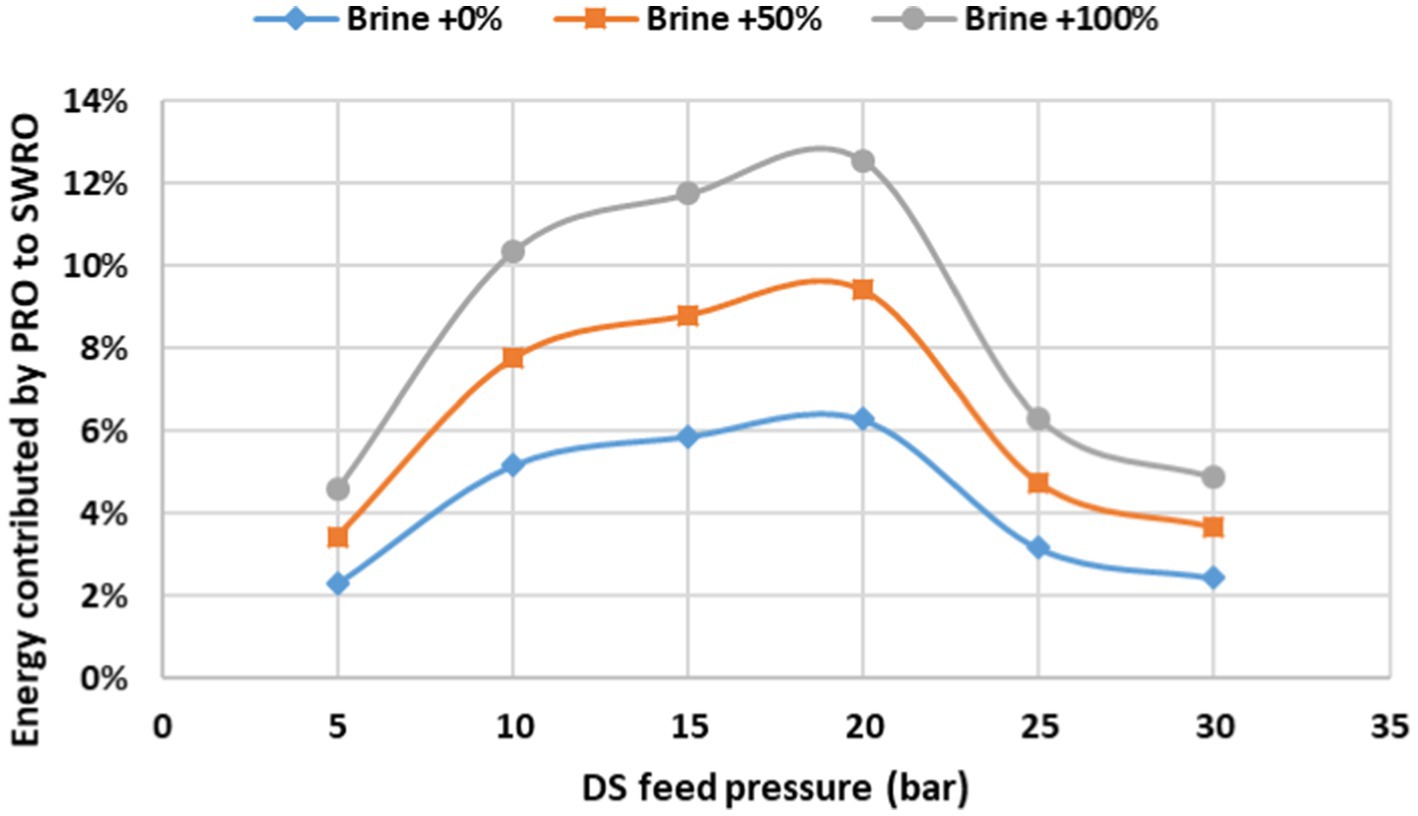
Figure 8. Effect of different amounts of additional brine flow on energy savings at different DS feed pressures.
The dilution of DS was found to be 18% (0.7 L/min) in the 20 bar DS feed pressure case and was calculated based on the difference between the DS flow out of the PRO system and the DS flow into the PRO system. As only one element was tested, there is always a chance for variation in dilution flows. Furthermore, it is a common practice among SWRO membrane manufacturers to usually assign some variation to the flow in membrane datasheets (+/− 20%). Therefore, the dilution flow was considered as measured in the desktop experiments along with an increment of 5% up to a maximum of 20% of the observed flow.
As shown in Figure 9, energy savings increase with dilution flow rate. A ± 20% range in dilution flow (based on desktop test variation and manufacturer tolerances) was evaluated. With higher dilution, more water crosses from FS to DS, increasing net energy. Higher ERD efficiency further amplifies this gain.
e Effect of different DS to FS flow rate ratios on energy savings
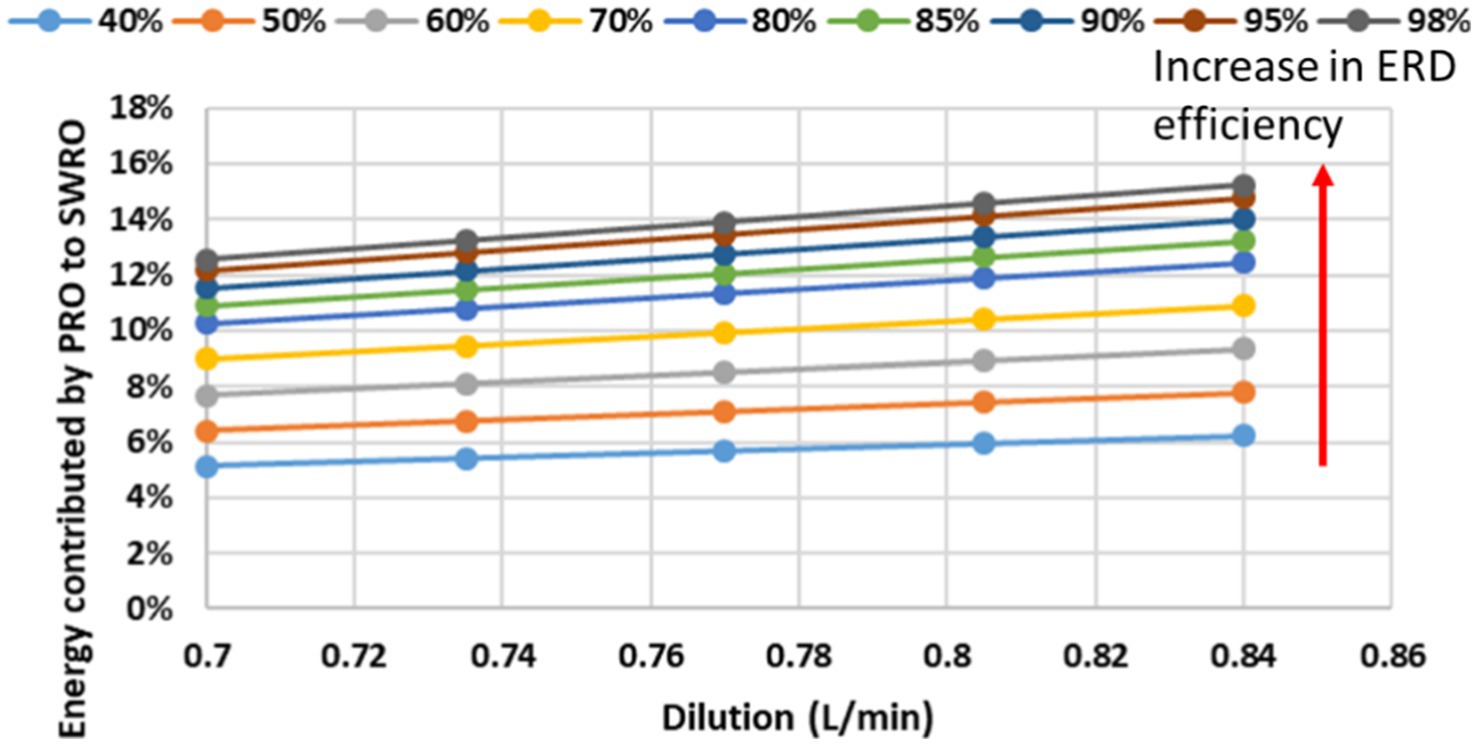
Figure 9. Effect of variation in dilution at 5% increment at various ERD efficiencies on energy savings. A maximum of 20% increase in dilution was considered.
As the FS flow rate increases, the amount of energy saved decreases primarily because of the pumping power required, which falls under auxiliary consumption in the PRO system.
FS flow rate should also be enough to sustain the dilution of DS. The DS to FS flow rate ratios considered in this study are 2, 1.75, 1.5, 1.25, 1, 0.75 and 0.5. (e) DS to FS flow ratio optimization.
Figure 10 explores the effect of varying DS: FS flow ratios. While increasing FS flow improves dilution, it also increases auxiliary pumping energy. Based on our analysis, an optimal DS: FS ratio was observed between 1.25 and 1.5, where energy recovery and auxiliary consumption are balanced. Operating outside this range reduces net savings due to diminishing returns or excessive FS pumping demand.
f Effect of FS feed pressure and DS outlet pressure on energy savings
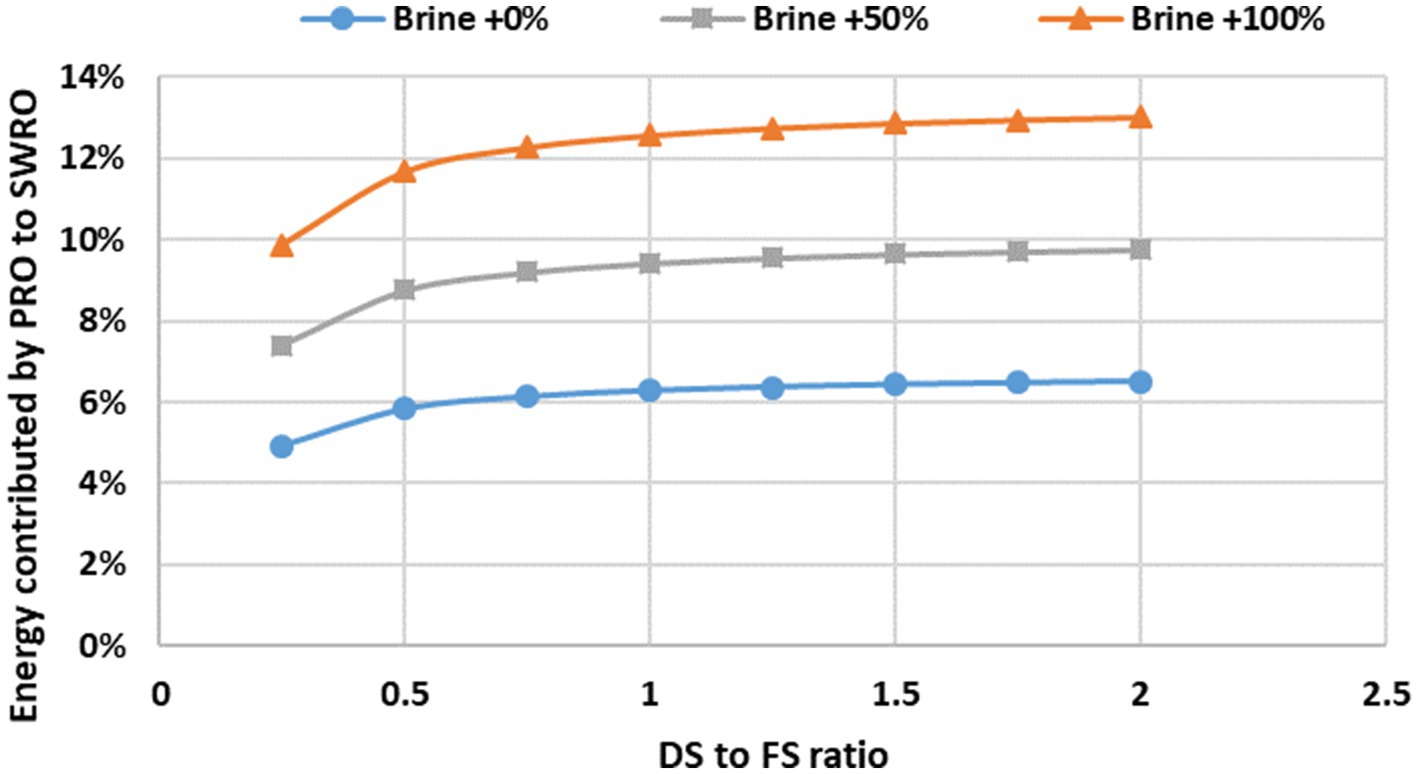
Figure 10. Effect of different DS to FS flow ratios and additional brine flow on energy savings.
When the DS solution is fed into the PRO at 20 bar with 100% additional brine, the efficiency of the ERD is taken as 98% and the dilution flow rate is maintained similar to that observed in the desktop tests, a decrease in energy savings is seen with an increase in the FS feed pressure. Savings decrease further with an increase in the pressure losses on the DS side. The increase in FS feed pressure results in an increase in the auxiliary energy consumption, thus decreasing the net energy generated by the PRO system. Figure 11 shows that increasing FS feed pressure decreases overall energy savings due to increased auxiliary energy consumption. This trend is amplified when DS-side pressure losses are also high. System design should aim to keep FS feed pressure as low as possible while maintaining sufficient flow for dilution.
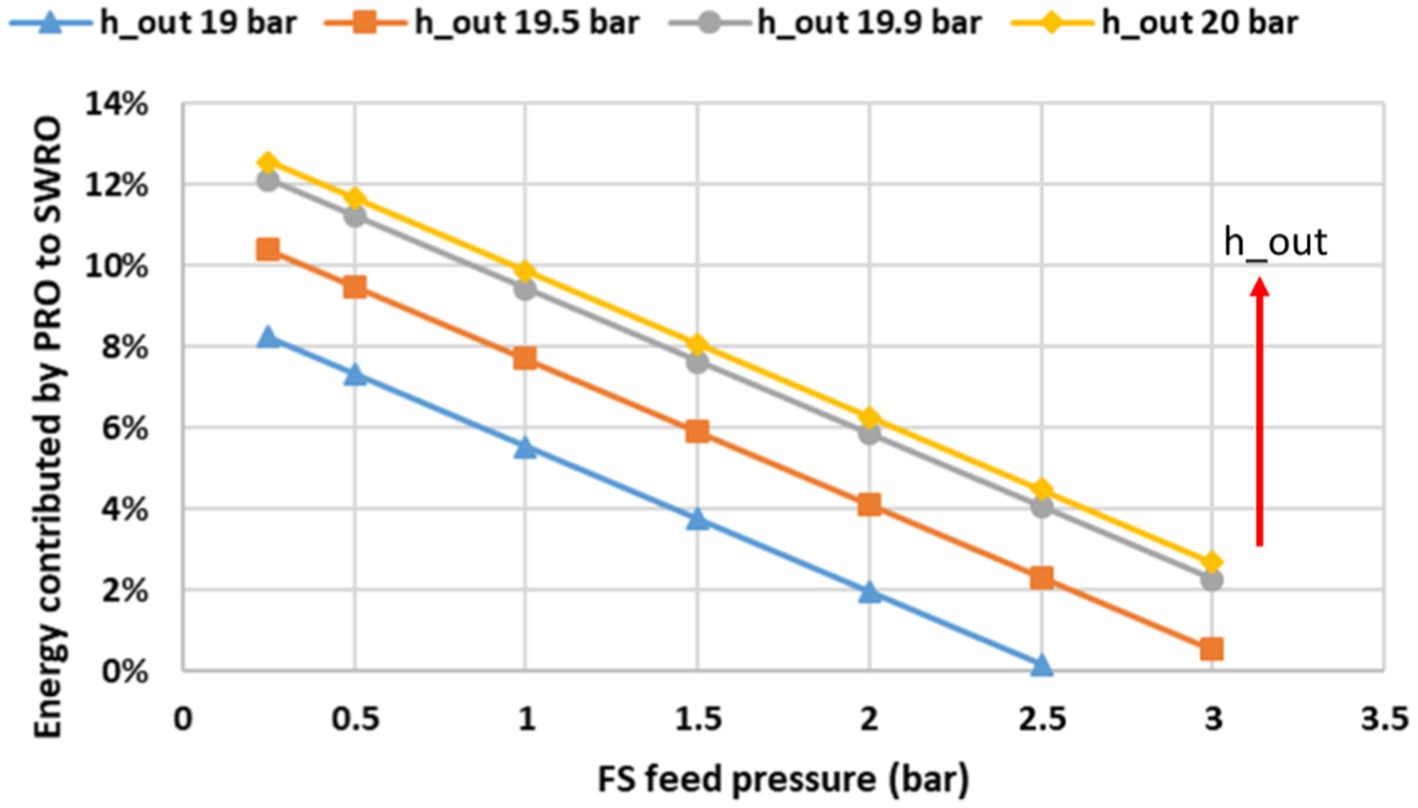
Figure 11. Effect of different FS feed pressures on energy savings at different outlet DS pressures (h_out).
Additionally, while increased FS feed pressure negatively impacts energy savings due to higher auxiliary consumption, it may also influence system design trade-offs. For instance, higher pressure can enable the use of more compact membrane modules or shorter PRO loops, potentially reducing system footprint. However, this comes at the cost of increased operating energy, highlighting the need for balance in system optimization.
g Effect of ERD efficiencies and FS feed pressure
As the FS feed pressure increases, the energy saved decreases due to the increase in auxiliary power consumption in the PRO-SWRO system. Therefore, it is essential to use a high efficiency ERD when using high FS feed pressures. As illustrated in Figure 12, energy recovery drops with increasing FS feed pressure—more so at lower ERD efficiencies. High-efficiency ERDs help compensate partially for this loss, but minimizing FS pressure remains essential.
h Influence of brine salinity variability
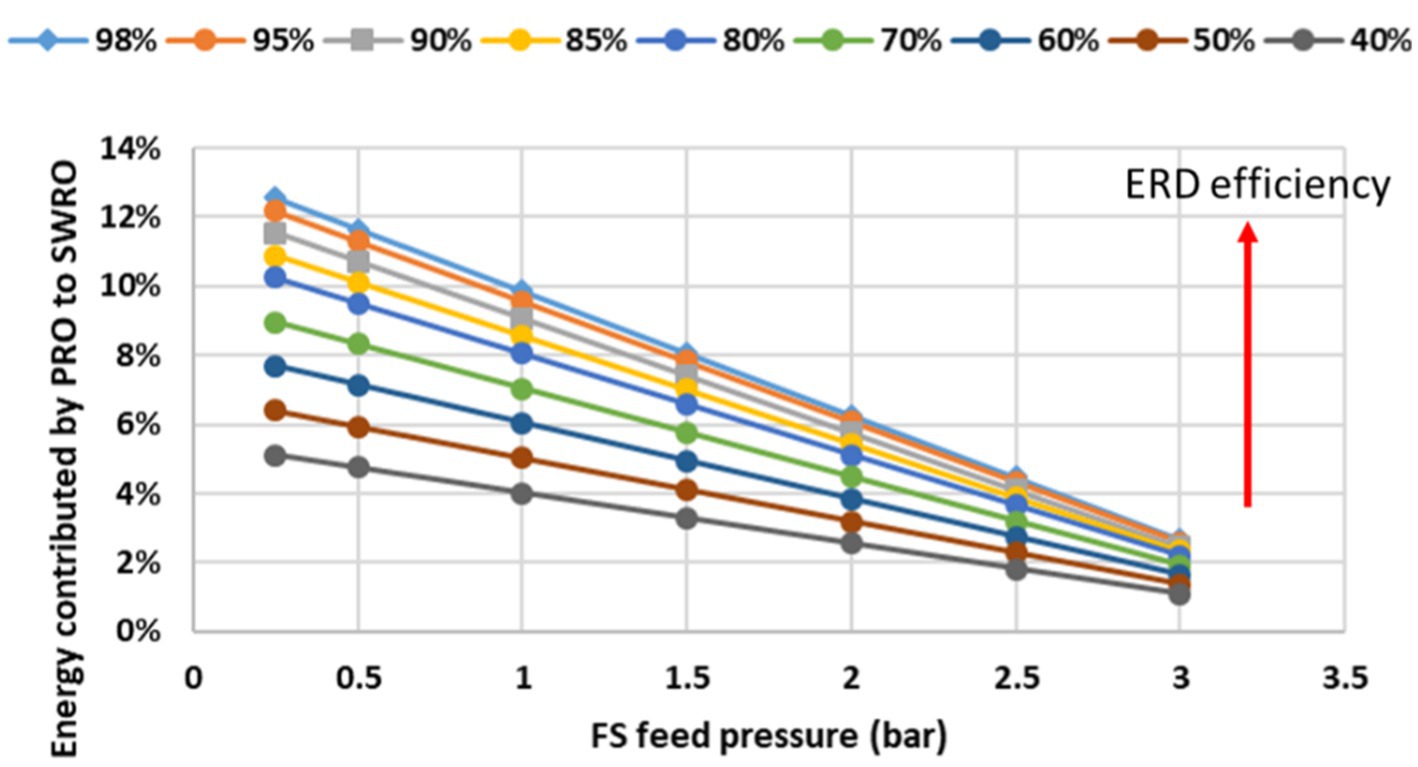
Figure 12. Effect of different ERD efficiencies on energy savings at different FS feed pressures.
In this study, an average brine salinity was assumed based on historical plant data. However, in real operation, brine salinity can vary by ±5–10% depending on intake temperature, membrane recovery rate, and pre-treatment system efficiency. These variations affect osmotic pressure differential, thus impacting dilution rate and energy output. Future dynamic models should incorporate these effects to refine energy predictions.
Considerations of long-term fouling
This analysis is based on short-term performance modeling and does not account for membrane fouling. In practical systems, long-term scaling and biofouling, particularly in high-salinity DS streams like SWRO brine, may reduce membrane permeability and affect dilution rates. Pilot-scale testing should evaluate fouling potential and test cleaning protocols to maintain long-term system performance.
Conclusions and recommendations
This study explored the potential of integrating Pressure Retarded Osmosis (PRO) into a Seawater Reverse Osmosis (SWRO) desalination system using SWRO brine as the draw solution (DS) and pre-treated seawater as the feed solution (FS). Through desktop tests and parametric modeling, a hybrid configuration was developed using scaled-up hollow fibre PRO membranes with a surface area of 650 m2. The optimal draw solution feed pressure was found to be 20 bar, resulting in the highest observed energy contribution from the PRO system.
Under optimal operating conditions—specifically, a DS pressure of 20 bar, ERD efficiency of 98%, and a dilution rate of 0.7 L/min—up to 12.56% energy savings in the SWRO system were possible. This value exceeds those typically reported in prior studies (3–10%) and reflects a near-realistic plant-scale configuration. The study also identified critical parameters affecting energy recovery: pressure losses in the DS loop, FS feed pressure, ERD efficiency, and dilution rate between DS and FS streams. Increases in FS feed pressure and DS-to-FS flow ratio were shown to reduce net energy recovery due to higher auxiliary energy demands.
To further advance the implementation of PRO-SWRO hybrid systems, the following recommendations are proposed:
• Pilot-scale trials under continuous operation to validate modeled results and assess long-term reliability.
• Hydraulic simulations to minimize DS-side pressure losses and optimize piping layout.
• Assessment of membrane performance under real seawater conditions, focusing on fouling resistance, dilution behavior, and salt leakage.
• Techno-economic analysis to evaluate capital and operational costs for full-scale deployment.
• Integration strategies for multiple brine sources in large desalination plants to maximize DS availability.
These steps will be essential to confirm the scalability and robustness of PRO-SWRO hybrid systems as a viable pathway to reduce energy consumption in modern desalination operations.
Data availability statement
The original contributions presented in the study are included in the article/supplementary material, further inquiries can be directed to the corresponding author.
Author contributions
AA: Conceptualization, Funding acquisition, Investigation, Methodology, Project administration, Resources, Software, Supervision, Validation, Visualization, Writing – original draft, Writing – review & editing. AM: Investigation, Methodology, Validation, Visualization, Writing – review & editing. SA: Data curation, Formal analysis, Funding acquisition, Investigation, Writing – review & editing.
Funding
The author(s) declare that no financial support was received for the research and/or publication of this article.
Conflict of interest
The authors declare that the research was conducted in the absence of any commercial or financial relationships that could be construed as a potential conflict of interest.
Generative AI statement
The authors declare that no Gen AI was used in the creation of this manuscript.
Publisher’s note
All claims expressed in this article are solely those of the authors and do not necessarily represent those of their affiliated organizations, or those of the publisher, the editors and the reviewers. Any product that may be evaluated in this article, or claim that may be made by its manufacturer, is not guaranteed or endorsed by the publisher.
References
Abdelkader, B. A. (2022). Experimental and numerical investigations of salinity gradient energy harvesting by pressure retarded osmosis. Guelph, ON: University of Guelph.
Abdelkader, B. A., and Sharqawy, M. H. (2022). Challenges facing pressure retarded osmosis commercialization: a short review. Energies 15:7325. doi: 10.3390/en15197325
Al Mashrafi, S., Diaz-Elsayed, N., Benjamin, J., Arias, M. E., and Zhang, Q. (2022). An environmental and economic sustainability assessment of a pressure retarded osmosis system. Desalination 537:115869. doi: 10.1016/j.desal.2022.115869
Amy, G., Ghaffour, N., Li, Z., Francis, L., Linares, R. V., Missimer, T., et al. (2017). Membrane-based seawater desalination: present and future prospects. Desalination 401, 16–21. doi: 10.1016/j.desal.2016.10.002
Bharadwaj, D., Fyles, T. M., and Struchtrup, H. (2016). Multistage pressure-retarded osmosis. J Non-Equilibrium Thermodynamics 41:17. doi: 10.1515/jnet-2016-0017
Darwish, M. A., Abdulrahim, H. K., Hassan, A. S., Mabrouk, A. A., and Sharif, A. O. (2014). The forward osmosis and desalination. Desalin. Water Treat. 57, 4269–4295. doi: 10.1080/19443994.2014.995140
Kurihara, M., and Takeuchi, H. (2018). SWRO-PRO system in “mega-ton water system” for energy reduction and low environmental impact. Water 10:48. doi: 10.3390/w10010048
Lanjewar, S., Mukherjee, A., Rehman, L. M., and Roy, A. (2020). Blue energy and its potential: the membrane based energy harvesting. Adv. Membr. Technol. 32:171. doi: 10.5772/intechopen.86953
Matsuyama, K., Makabe, R., Ueyama, T., Sakai, H., Saito, K., Okumura, T., et al. (2021). Power generation system based on pressure retarded osmosis with a commercially-available hollow fibre PRO membrane module using seawater and freshwater. Desalination 499:114805. doi: 10.1016/j.desal.2020.114805
Schunke, A. J., Herrera, G. A. H., Padhye, L., and Berry, T.-A. (2020). Energy recovery in SWRO desalination: current status and new possibilities. Front. Sustain. Cities 2:9. doi: 10.3389/frsc.2020.00009
Sterl, S., Liersch, S., Koch, H., Lipzig, N. P. M. V., and Thiery, W. (2018). A new approach for assessing synergies of solar and wind power: implications for West Africa. Environ. Res. Lett. 13:094009. doi: 10.1088/1748-9326/aad8f6
Warsinger, D. M., Rao, A., Das, A., Alnajdi, S., and Naderi, A. (2022). integrating wave-powered batch reverse osmosis with pressure retarded osmosis for higher efficiency desalination method, marine energy collegiate competition 2022. West Lafayette: Purdue University.
Keywords: pressure retarded osmosis (PRO), seawater reverse osmosis (SWRO), energy recovery device (ERD), draw solution (DS), feed solution (FS), energy efficiency
Citation: Alghamdi AS, Mahmoud AM and Ahmed S (2025) Energy savings in SWRO desalination via PRO hybridization: a parametric study. Front. Water. 7:1583063. doi: 10.3389/frwa.2025.1583063
Edited by:
Shailendra Kumar Shukla, Banaras Hindu University, IndiaReviewed by:
Vinay Kumar, University of the Incarnate Word, United StatesVikash Kumar Chauhan, Indian Institute of Technology Bombay, India
Copyright © 2025 Alghamdi, Mahmoud and Ahmed. This is an open-access article distributed under the terms of the Creative Commons Attribution License (CC BY). The use, distribution or reproduction in other forums is permitted, provided the original author(s) and the copyright owner(s) are credited and that the original publication in this journal is cited, in accordance with accepted academic practice. No use, distribution or reproduction is permitted which does not comply with these terms.
*Correspondence: Ahmed S. Alghamdi, YWFsLWdoYW1kaTM0YWNjYkBzd2NjLmdvdi5zYQ==