 Estefania Carpio-Vallejo
 Urda Düker
 Regina Nogueira
- Institute of Sanitary Engineering and Waste Management, Leibniz University, Hannover, Germany
In the face of growing climate change challenges and increasing uncertainty over water availability, roof-harvested rainwater emerges as a promising alternative source in urban settings. At the Welfengarten campus, rainwater from the main building's roof feeds a pond that overflows into a park. However, concerns arise about potential waterborne diseases affecting children interacting with the pond. This study assessed the microbiological water quality of the urban pond and the associated health risks. Bi-monthly water sampling was conducted in 2020 and 2021, field observations documented interactions with the pond, and a microbial risk assessment quantified health risks from recreational exposure, addressing a critical gap in urban water safety research. Microbial analysis showed Total coliforms (4.41 × 101 to 2.42 × 10³ MPN/100 mL), E. coli (5.20 × 100 to 4.61 × 10² MPN/100 mL), Enterococci (1.60 × 101 to 1.73 × 10³ MPN/100 mL), Salmonella spp. (2.00 × 10² to 2.10 × 10⁴ CFU/100 mL) and P. aeruginosa (4.00 × 100 to 6.00 × 10³ MPN/100 mL). QMRA results showed maximum daily infection probabilities of 3.18 × 10⁻¹ for Enterococci and 2.48 × 10⁻¹ for Salmonella spp., exceeding the USEPA benchmark (3.60 × 10⁻²), while other bacteria remained below it. Given the lack of water quality guidelines for these environments, regular monitoring, particularly during summer, is recommended to safeguard public health and guide future water management policies.
1 Introduction
The concept of the Sustainable Development Goals (SDGs) aimed at creating a set of 26 universal objectives to address the pressing environmental, social and economic challenges that our world has confronted during the past decades. Among these challenges, water stands out as a critical resource that intersects with every dimension of these goals (Wong et al., 2020). Every year, cities around the world face the challenges of rapidly growing populations and constrained access to potable water resources, making cities a key focal point for the application of sustainable development strategies (Imteaz et al., 2022).
These challenges are exacerbated by the effects of climate change, particularly its impact on the ability of existing water systems to provide adequate quantity and quality of water (IRP, 2018; UNEP, 2015). Furthermore, approximately 50% of the world's drinking water supply is derived from groundwater sources, increasing the pressure on these resources and leading to aquifer depletion as the demand for clean groundwater increases (Sarma and Singh, 2021). This highlights the need for effective use of alternative water resources in urban areas, such as roof-harvested rainwater (RHRW), which can also be applied to promote groundwater recharge (Nachson et al., 2022).
To tackle these pressing issues, the United Nations/Word Level Bank High-Level Panel on Water has formulated an Action Plan. This Plan centers on reinforcing water data and promoting evidence-based decisions, assessing the value of water in terms of sustainability, efficiency and costs, and encouraging the adoption of sustainable water management practices that enhance resilience, water governance and social inclusion (HLPW, 2018). Urban water management must evolve to become more integrative and adaptive, considering factors that impact both social and technical dimensions. This requires a shift of the existing infrastructure and institutional framework to align with the goal of creating sustainable green cities (Wong et al., 2020).
In recent years, several water initiatives have emerged to achieve sustainable urban water management. Examples include Water-Sensitive cities, Sponge Cities, Low Impact Development infrastructures (LID), among others. These innovative concepts have paved the way for new water features in urban areas to reduce the burden on sewer systems during intense storm events and to make rainwater available for other uses, including recreation and infiltration (Jiang et al., 2018; Rahoui, 2021). Previously, the concept of pond harvesting systems was only applied in rural settings; however, there is a growing need to explore this alternative in urban areas as part of nature-based solutions (NBS) (Zabidi et al., 2020).
Despite their growing popularity and multifunctional benefits, urban ponds remain largely under-monitored for microbiological safety, particularly in Europe. Recreational exposure to these water bodies poses potential health risks due to the presence of pathogenic microorganisms (Islam et al., 2021). Urban ponds can act as reservoirs for bacterial pathogens, which can proliferate in such environments and pose significant health risks through dermal contact or ingestion (Leonard et al., 2018). Children, due to their lower immunity and behaviors that increase exposure (e.g., hand-to-mouth contact, splashing), are particularly vulnerable (Wade et al., 2022). To assess these health risks associated with pathogen exposure, we used the quantitative microbial risk assessment (QMRA) approach.
Climate change is contributing to the emergence and spread of water- and vector-borne diseases across Europe. Changing precipitation patterns, high temperatures and extreme weather events can significantly influence the transmission dynamics and persistence of pathogens in the environment, increasing the risk of infections related to E. coli, Salmonella, Campylobacter, and making diseases such as Leptospira interrogans and Vibrio infections more frequent in Germany and overall, in Europe. Illnesses linked to Campylobacter and Salmonella are also on the rise (Arikan and Cakir, 2023).
Globally, around 830,000 deaths occur each year because of diarrheal diseases linked to inadequate drinking water, sanitation and hygiene. In Europe, this burden remains significant, with an estimated of seven daily deaths from the same causes. Between 2010 and 2021, the most frequently reported outbreaks in the region were related to shigellosis, E. coli diarrhea, hepatitis A and cryptosporidiosis (WHO, 2022). Recent data show that in 2022 Europe reported 1,822 cases of Shiga toxin-producing E. coli (STEC), with over 80% infected in Germany, even though waterborne transmission is less frequent, it remains a relevant concern (Withworth, 2024). Despite these findings, comprehensive and up-to-date data specifically related to the occurrence of these pathogens in recreational water bodies in Germany and Europe remain scarce, highlighting the need for systematic monitoring and targeted research to better understand and manage health risks in urban water environments.
Mitigating environmental challenges requires synergistic collaboration and strong commitments from both public and private organizations. Among these, Higher Education Institutions (HEIs) play a key role in fostering sustainability through internal and external commitments, including policies, campus management, environmental initiatives, curricula and research programs (Barreiros et al., 2024). HEIs not only empower students with the knowledge and the tools to address environmental challenges but also cultivate sustainable behaviors, particularly in water use.
As integral components of urban environments, HEIs contribute significantly to the implementation and achievement of the SDGs. Concepts such as “green campus” and “sustainable campus” have gained momentum, reflecting institutional efforts toward environmental responsibility. A sustainable campus reflects the integration of environmental sciences and best practices, embedding sustainability across management, teaching and research areas (Sugiarto et al., 2022).
To develop sustainable campuses, a multifaceted approach considering several strategies is required, strategies that address behavioral aspects, strategies in the learning instrument aspects, and strategies improving campus infrastructure. Many universities have strategically implemented sustainable campus initiatives, among them we can mention the University of Florence, which has embedded sustainability into its institutional framework by establishing clear strategies and structured initiatives, including green buildings, waste management and sustainable mobility (Fissi et al., 2021). This highlights the crucial role of leadership in successfully implementing sustainable campus practices. Similarly, the adoption of environmentally friendly technology in the learning processes has paved the way for sustainable e-learning, promoting resource efficiency and reducing environmental impact (Abdillah et al., 2018).
Water quality in universities also plays a critical role in sustainable campus development. The University of Tianjin has integrated a green campus model that incorporates the use of rainwater harvesting and a sustainable water circulation system, demonstrating effective water resource conservation (Peng et al., 2018). Recognizing the growing importance of sustainable campus management, institutions worldwide need to prioritize energy conservation, resource efficiency and waste reduction. At the Leibniz University Hannover (LUH) water management is a key pillar of its environmental sustainability efforts, reinforcing the broader role of HEIs in fostering responsible resource management and advancing the achievement of the SDGs (Schmiedner, 2019).
The case study described in the present work took place in the Welfengarten campus of the Leibniz University of Hanover. This study is meaningful as it addresses a critical gap in the application of Quantitative Microbial Risk Assessment (QMRA) to rainwater-fed urban ponds used informally for recreation in Europe. While urban ponds are increasingly being integrated in green urban design, there is a lack of safety guidelines and microbial risk data specific to these settings. Previous studies have highlighted the potential health risks associated with exposure to pathogens in urban water bodies (Stec et al., 2022; vOon et al., 2023; Baral et al., 2018; Ziółek et al., 2024); however, comprehensive risk assessments tailored to European urban ponds remain scarce. By applying QMRA in this context, our findings contribute valuable insights that can inform evidence-based public health protections and guide the design of future NBS initiatives. There are two main objectives of this study: (a) to estimate the annual infiltration of pond water into the groundwater and its microbiological water quality, and (b) to assess the microbial health risks with a particular focus on gastrointestinal diseases and skin infections in children as a result of their exposure to pond water.
2 Materials and methods
2.1 Study area and system description
Located in the Nordstadt district of Hannover, Germany, the Welfengarten Park covers ca. 0.12 km2 and is situated at 52.38406°N, 9.71730°E, directly behind the main building of the Leibniz Universität Hannover. The park is open to the public, and in summer, citizens gather on the lawns around the pond (Figure 1). Children and dogs frequently play near the pond and interact with the water, while several other animals can be observed in the pond and in the surrounding areas.
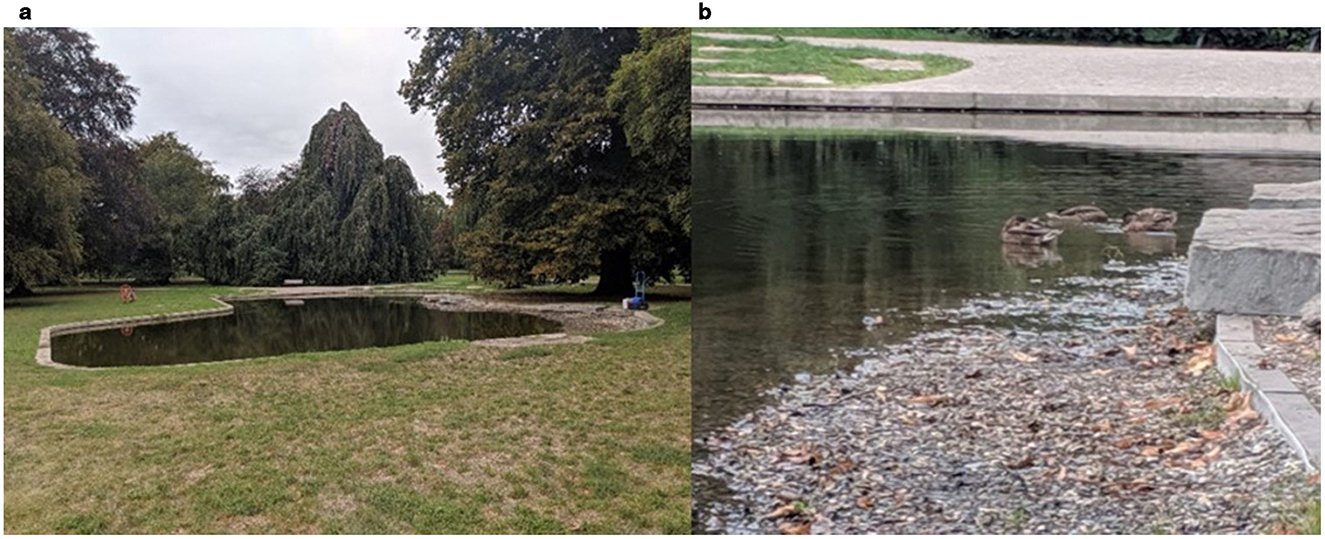
Figure 1. (a) Pond in the Welfengarten park in the city of Hannover. (b) Detail of the pond showing the presence of ducks and organic debris.
The pond stores rainwater that is harvested from the university's roof and allows the overflow to infiltrate into the lawn, recharging the groundwater. The pond has a surface area of 410 m2 with an associated infiltration area spanning approximately 1,300 m2. The volumetric capacity of the ponds is 493 m3, and it is replenished by rainwater harvested from the roof of the main building of the Leibniz University. The rainwater collection system encompasses a 1,053 m2 roof area, which is connected to the pond by a PVC pipe. The inlet structure where the rainwater flows into the pond also serves as a sand trap. We conducted a comprehensive analysis of the microbiological water quality of the pond.
2.2 Sampling design and procedure
Sampling was conducted under clear-sky conditions, with ambient temperatures ranging from 20°C to 24°C. The lowest temperatures were recorded in September 2020 and May 2021, while the highest occurred in July of both years.
The pond, situated at 52.38406°N, 9.71730°E, approximately at 55 m above sea was sampled twice per month at surface level (~15 cm depth), following standard sampling procedures, from June to September 2020 and from May to August 2021. The variation in sampling months between the 2 years was due to logistical constraints, including limited personnel availability and disruptions caused by the COVID-19 pandemic in May 2020.
To avoid external contamination during sampling, the glass bottles were carefully handled by their base, avoiding contact between hands and the bottle opening or interior. Bottles were submerged with their opening pointed downward and then tilted upward to collect water at the target depth. Submersion was done carefully to avoid stirring bottom sediments of the pond and to minimize contact with the pond banks during sampling, as described in (US Environmental Protection Agency Science Ecosystem Support Division Athens, 2016).
Fifteen samples were collected using pre-cleaned and sterilized 1 liter borosilicate glass bottles. Samples were immediately stored in cooled transport boxes at 4°C and transported to the laboratory for microbiological analysis within 24 h of collection.
2.3 Physicochemical and hydrological analyses
2.3.1 Physicochemical parameters
Key physicochemical parameters, including dissolved oxygen (DO), pH, electrical conductivity and water temperature, were measured in situ at the surface level (approximately 15 cm depth) of the pond during each sampling event. Measurements were taken using a MultiLine® Multi 3630 IDS digital multi-parameter portable meter (WTW, Germany), ensuring accurate and consistent monitoring under field conditions. The device was calibrated prior to each sampling campaign according to the manufacturer's instructions.
2.3.2 Water balance of the urban pond
To estimate the potential water infiltration contributing to groundwater recharge, we calculated the total amount of rainwater harvested from the roof and direct precipitation into the pond based on Equations (1), (2) (EPA, 2020). Subsequently, we subtracted the estimated evaporation employing the evaporation rate reported by NLWKN (2016), which represents the average conditions for Hannover.
2.4 Microbiological analysis
To quantify the concentrations of Total coliforms, E. coli, Enterococci, and P. aeruginosa, we used IDEXX test kits: ColilertTM, EnterolertTM, and PseudalertTM (IDEXX Canada, ASTM Method #D6503-99). For each analysis, a 100 mL water sample was poured into sterile bottles (Carl Roth, Karlsruhe), after which the appropriate reagent was added and the bottle gently shaken until fully dissolved. Prepared samples were incubated for 24 ± 2 h at the temperatures recommended by the manufacturer: Total coliforms and E. coli at 35°C ± 0.5°C, Enterococci at 41°C ± 0.5°C and P. aeruginosa at 38°C ± 0.5°C. Following the incubation period, Quantitray™ wells were examined and the number of positive wells was used to calculate the Most Probable Number (MPN) according to IDEXX reference tables. For Total coliforms, yellow wells were counted, for E. coli, yellow wells exhibiting fluorescence under UV light were counted, for P. aeruginosa and Enterococci, fluorescent wells under UV light were recorded, with fluorescence indicating the presence of the target organism (IDEXX Laboratories, 2019).
The detection of Salmonella spp., Vibrio spp., Listeria monocytogenes, and Campylobacter spp. was carried out using selective culture methods following routine protocols from the Institute of Food Science and Human Nutrition, Leibniz University Hannover.
For the analysis of Salmonella spp., 100 μl of undiluted, 1:10 and 1:100 diluted water samples were plated in triplicate onto modified BPLS agar plates (Oxoid, Wesel, Germany). Plates were incubated at 35°C ± 0.5°C for 24 ± 2 h. Presumptive Salmonella colonies, exhibiting morphology consistent with Salmonella spp., characterized by pink-red coloration with a red halo, were enumerated. Quality control was maintained throughout the analysis by including Salmonella enterica subsp. enterica (DSMZ No. 5569) as a positive control. For each dilution, colony counts from triplicate plates were averaged. The concentration of presumptive Salmonella spp. was then calculated by multiplying the average colony count by the inverse of the dilution factor and adjusting for the plated volume, and the results were expressed as CFU/100 mL.
For the detection of Listeria monocytogenes, 100 μl of undiluted, a 1:10 and a 1:100 diluted water samples were plated in triplicate onto Brilliance™ Listeria Agar plates (Oxoid, Wesel, Germany). Plates were incubated at 36 ± 1°C for 24 ± 2 h and then extended to 48 ± 2 h due to initial absence of visible colonies. Quality control was ensured by including Listeria monocytogenes DSMZ No. 20600 as a positive control.
Campylobacter spp. was cultured by plating 100 μL of undiluted, 1:10, and 1:100 diluted water samples in triplicate onto Campylobacter selective agar plates. To establish the required microaerophilic conditions, CampyGen™ gas-generating sachets (Oxoid) were used. The plates were incubated at 42°C ± 1°C for 48 ± 2 h. Quality control was ensured using Campylobacter jejuni ATCC 33560 as a positive control.
For the analysis of Vibrio spp., 100 μL of undiluted, 1:10, and 1:100 diluted water samples were plated in triplicate onto TCBS agar plates (Oxoid, Wesel, Germany). Plates were incubated at 35°C ± 1°C for 24 ± 2 h. Quality control was ensured using Vibrio cholerae ATCC 14035 as a positive control.
Sterile phosphate-buffered saline (PBS) was used as blank control in each analytical batch across all microbiological assays to control de sterility of the medium.
2.5 Field observations for exposure assessment
While video surveillance is a commonly used tool to collect data during field observations, we selected a different method due to strict data protection regulations in Germany. Therefore, we used an adapted version of the Burano method (Riege and Schubert, 2002) to conduct field observations at the pond.
In the present study, the Burano method was tailored to observe and record the behavior of individuals engaging in recreational activities involving contact with pond water.
Observations were carried out during our water sampling campaigns. In total, we conducted five visits with a duration of 60 min each. In the visits, we collected and recorded information using a spatially referenced site map, noting the type of water contact (e.g., hand, foot, full-body immersion) and the estimated duration of exposure for each observed event (see Supplementary Figure 1).
2.6 Health risk assessment
For this study, the health risk assessment considered Total coliforms, E. coli, Enterococci, and Salmonella spp. to account for the probability of gastrointestinal illness, while P. aeruginosa was used to assess the probability of infection through dermal exposure. Vibrio spp., Listeria monocytogenes, and Campylobacter spp. were not included in the risk assessment as their concentrations were below the limit of detection.
Our risk assessment focused specifically on children, due to their lower immunity against pathogens and infections. Children are also more likely to engage in hand-to-mouth contact while playing in or near water, increasing their risk of exposure, and their tendency to ingest more water during recreational activities such as wading or splashing (Sinclair et al., 2009).
Two primary exposure routes were considered based on typical recreational behavior: hand-to-mouth contact (QHM) and ingestion of water droplets resulting from splashing (QD) (see Section 2.6.2). Given the similarity of our study with the exposure routes analyzed previously by De Man et al. (2014), we adopted the parameter framework from their work to perform our calculations. However, the specific frequency values of events such as hand-to-mouth contact and the unintentional ingestion of water droplets were derived from our field observations and fitted to a gamma distribution to better represent their probabilistic nature in the subsequent calculations.
The quantitative microbial risk assessment (QMRA) approach was chosen to quantify the likelihood of adverse health outcomes to children associated with microbial exposure. This framework integrates data of the targeted microorganisms, their environmental behavior, exposure pathways and host susceptibility (CAMRA, 2021; Carpio-Vallejo et al., 2024; WHO, 2016).
2.6.1 Hazard identification
The primary microbial hazards evaluated in this study were Total coliforms, E. coli, Enterococci, Salmonella spp., and P. aeruginosa. These bacteria were selected due to their relevance as fecal indicator bacteria (FIB) and their potential to cause waterborne infections through recreational exposure. While Total coliforms, E. coli and Enterococci are standard indicators of fecal contamination, Salmonella spp. represent a well-known enteric pathogen, and P. aeruginosa is an opportunistic pathogen with relevance in dermal infections, particularly in immunocompromised individuals and children.
It is important to note that our microbial analytical methods did not specifically identify pathogenic strains of E. coli and Enterococci. In the case of Salmonella spp., enumeration was based on presumptive colonies grown on selective media. Therefore, a conservative “worst -case scenario” approach was applied in the risk assessment, using dose-response models and parameters associated with ETEC O111 (CAMRA, 2021), pathogenic Enterococci (Haas et al., 2014) and Salmonella (WHO, 2001), all of which are commonly linked to gastrointestinal illness following environmental exposure. This assumption aligns with previous QMRA studies that rely on generalized FIB and culture-based detection as proxies for pathogenic organisms when specific strain identification is not feasible (USEPA, 2010; Holcomb and Stewart, 2020). While this method allows for illness probability estimation using established dose-response models, it likely results in an overestimation of the actual health risk.
2.6.2 Exposure assessment
In our study, we investigated two primary pathways of exposure for children who had direct contact with pond water. These pathways included hand-to-mouth contact (QHM) and the unintentional ingestion of water droplets caused by splashing (QD). For more detailed information on the parameters and calculations used to determine the exposure volumes, please refer to Carpio Vallejo et al. (2023). To establish the exposure duration (t), we utilized the relevant data gathered during the field observations. The collected data was then fitted to a Beta probability distribution in RStudio Team (2020), as this distribution is well-suited to describe values within a specific range, which, in this context, corresponds to the duration of the field observations.
2.6.3 Dose estimation
The dose of exposure (d) was calculated for each microbial parameter based on the estimated concentration of the microorganism in the water, the exposure rate, and the duration of contact during recreational activities. The equation used is as follows:
Where C represents the concentration of the bacteria in water, Q is the rate of water ingested or in contact with the skin during the recreational event, and t is the duration of exposure of one recreational event (Haas et al., 2014).
For each studied exposure pathway, parameter values for Q and t were informed by behavioral data collected during field observations and adjusted based on existing literature (De Man et al., 2014; Carpio Vallejo et al., 2023).
2.6.4 Dose-response models
To estimate the probability of GI illness (Pill) or skin infection (Pinf), established dose-response models were applied for each target bacteria. The models were selected based on available literature and are summarized in Table 1. Each model relates the microbial dose (d), estimated from exposure scenarios to the probability of illness or infection (Pill or Pinf), using organism-specific parameters.
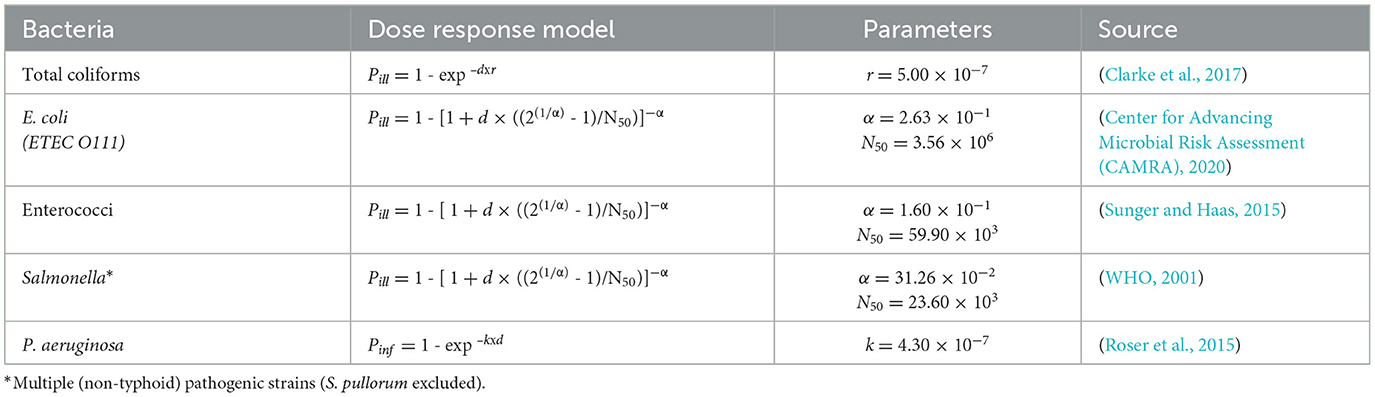
Table 1. Dose-response models and parameters used for the selected bacteria.
For Total coliforms and P. aeruginosa, exponential models were applied. For E. coli, Enterococci, and Salmonella spp., beta-Poisson models were used, which account for host variability and a dose-dependent infection probability. The input parameters (α, N50, r, and k) were obtained from the literature and reflect estimates that are suitable for recreational water risk assessments.
2.6.5 Risk characterisation
As the final step of the QMRA, the probability of infection or illness was estimated based on the exposure dose and the selected dose-response models. Monte Carlo simulations were performed using MATLAB® (version R2020a), generating 10,000 iterations of the dose-response model parameters. The simulations accounted for variability in microbial concentrations, exposure volumes, and exposure durations, using the distributions fitted to experimental data and field observations. For the purposes of this study, all input parameters were assumed to be independent (De Man et al., 2014; Eregno, 2017).
The output of each simulation run corresponded to a probability estimate of infection/illness for a single exposure event, which were then compared to the USEPA benchmark established in their Recreational Water Quality Guidelines of 3.6 × 10 −2 risk per exposure (USEPA, 2012). This approach provided the estimation of health risks associated with eventual recreational contact with pond water fed with RHRW in an urban setting.
2.6.6 Sensitivity analysis
Sensitivity analysis is a critical component of the QMRA. As described by Eregno et al. (2016), it aims to identify how variations in input parameters influence the final risk of illness or infection. In this study, the sensitivity analysis was conducted to identify the parameters causing the most significant impact on the variability of the health risk outcomes. The assessed parameters included the surface area of the hand that is mouthed (A), bacterial concentration (C), frequency of ingesting water droplets (fD), frequency of hand-to-mouth contact (fHM), film thickness of water on hands (h), volume of a water droplet (VD), and time of exposure (t). The dose-response parameters α, β, N50 and k from each model were obtained as point estimates from the literature. These parameters were not included in the sensitivity analysis, as they can vary between individuals (Pérez-Rodríguez, 2021).
2.6.7 Risk comparison against USEPA recreational water quality criteria
The 2012 USEPA Recreational Water Quality Criteria (RWQC) guidelines (USEPA, 2012) set an estimated illness rate of 36 NGI/1000 (NEEAR - Gastrointestinal Illnesses). Even though the RWQC did not provide an estimated illness or infection rate for dermal infections, the findings from the NEEAR study indicated that other waterborne illnesses occur at lower rates than gastrointestinal (GI) illnesses (USEPA, 2012). Consequently, safeguarding public health against GI illnesses serves as a preventive measure against various other waterborne illnesses associated with recreational water activities. Our study used this benchmark to assess whether the current water quality of the pond aligns with the USEPA RWQC (USEPA, 2012), thereby determining its compliance with the established standards.
2.7 Statistical analysis
To identify the most suitable probability distributions to describe our dataset for bacterial concentrations and exposure times, we employed descriptive statistical methods. The identified distributions were then integrated into the dose-response models used for the QMRA. First, the data obtained for microbial concentrations and exposure durations were fitted to theoretical distributions using the Maximum Likelihood Estimation (MLE) method. Then the goodness-of-fit was assessed through criteria such as the Akaike Information Criterion (AIC), Bayesian Information Criterion (BIC), and graphical methods including Q-Q plots. Distributions that best described the data were subsequently incorporated into the Monte Carlo simulations for risk characterisation.
All statistical analyses were conducted using RStudio version 4.1.1 (R Foundation for Statistical Computing, Vienna, Austria). Additionally, to represent the distribution and visualize the spread and central tendency of the microbiological parameters, we generated box-and-whisker plots.
Furthermore, to assess whether there were statistically significant variations in bacterial concentrations between 2020 and 2021, we used the non-parametric Mann-Whitney U test, as the data did not conform to normality assumptions. A significance threshold of p < 0.05 was applied for all statistical tests.
3 Results and discussion
3.1 Physicochemical conditions and hydrological balance
3.1.1 Physicochemical conditions
Dissolved oxygen (DO) concentrations ranged from 7.07 to 9.78 mg/L, indicating well-oxygenated conditions. The pH values fluctuated between 8.05 and 8.76, suggesting slightly alkaline conditions. Electrical conductivity values ranged from 241 to 296 μS/cm, reflecting moderate mineral content. Water temperatures varied seasonally, from 15°C during the cooler months to a peak of 24°C in the warmest periods.
These values are consistent with reported ranges for urban ponds in temperate European climates. For instance, Rodrigues et al. (2022) assessed six urban ponds in Lisbon, Portugal, and reported dissolved oxygen levels between 6.8 and 10.7 mg/L, average pH values ranging from 7.9 to 9.0, and electrical conductivity values averaging from 332 to 1,255 μS/cm (Rodrigues et al., 2022). Similarly, Ziółek et al. (2024) investigated small urban ponds in Lublin, Poland, finding dissolved oxygen levels from 6.8 to 9.5 mg/L, pH values between 7.8 and 8.4, and electrical conductivity ranging from 250 to 320 μS/cm. These studies confirm that the physicochemical conditions of the Welfengarten pond fall within expected ranges for urban water bodies in similar climatic zones (Ziółek et al., 2024).
3.1.2 Pond hydrological water balance
In 2021, increased rainfall compared to 2020 led to higher volumes of rainwater collected from the roof and direct precipitation into the pond, resulting in a greater infiltration rate. Water balance calculations estimated a potential infiltration of 534 m3/year in 2020 and 784 m3/year in 2021. Considering the pond's maximum capacity of 493 m3, these results suggest that the pond water could be renewed approximately 1.4 to 1.9 times, accounting for both roof-derived water and direct rainfall inputs.
It is noteworthy that the water table in the area is typically found at an average depth of approximately three meters, which is considered shallow (NLWKN, 2023). This indicates a potential risk for microbiologically contaminated pond water to impact the underlying groundwater quality. However, a comprehensive investigation is necessary to thoroughly assess the extent of this potential impact on the microbiological quality of the groundwater body.
3.2 Microbial water quality
We assessed the microbiological water quality of the pond based on the bacterial concentrations obtained from sampling. A summary of the results for the mean, median, geometric mean and 95-percentile of each bacterium is presented in Table 2.
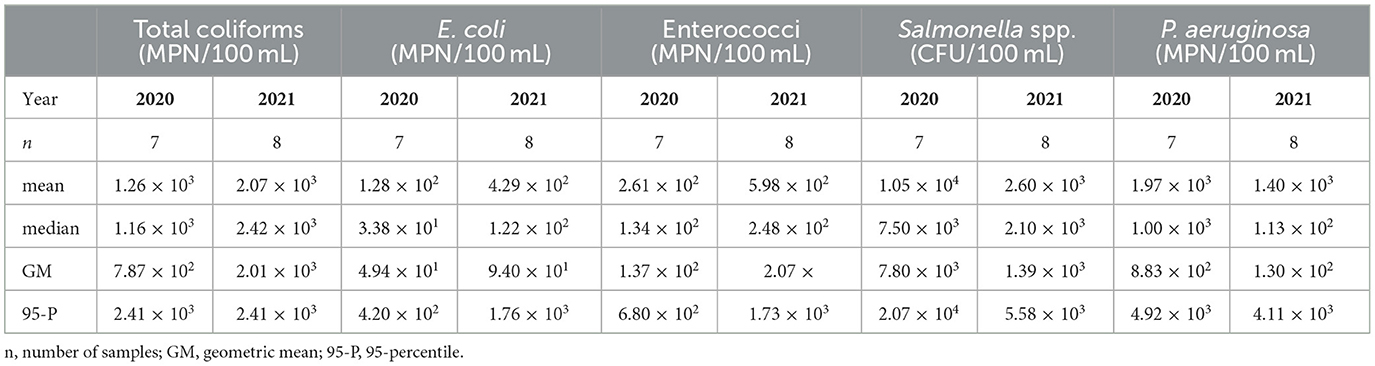
Table 2. Summary of mean, median, geometric mean and 95-percentile of bacterial concentrations.
In the case of Vibrio spp., Campylobacter spp., and Listeria monocytogenes, no colonies were detected in any of the plates, indicating that concentrations were consistently below the method's detection limit of 10 CFU/mL.
The concentration of Total coliforms in our study exhibited a range from 4.41 × 101 to 2.42 × 10³ MPN/100 mL throughout the sampling period. Higher concentrations were observed in 2021 compared to 2020, as evidenced by the mean, median and geometric mean presented in Table 2. Our findings align with the range reported by Zeki (2022), who detected similar levels in samples taken from the bottom of an irrigation pond in Turkey (ranging from 4.70 × 101 to 3.50 × 10³), with surface water samples reaching Total coliforms concentrations of up to 8.66 × 10³ MPN/100 mL. It is worth noting that the pond in our study was significantly smaller than the one studied by Zeki (2022), which may influence microbial load and distribution.
In our study, E. coli concentrations ranged from 5.20 × 100 to 4.61 × 10², except for one outlier which reached 2.42 × 10³ MPN/100 mL in 2021. Similar to Total coliforms, higher values were recorded in 2021. This concentration range is broader than that reported by Nalwanga et al. (2018), who found E. coli concentrations ranging from 1.40 × 10² to 2.20 × 10² CFU/100 mL across various rainwater harvesting systems, identifying catchment ponds as the most contaminated. Recent studies further contextualize our findings, Livhuwani et al. (2025) reported E. coli concentrations in RHRW ranging from 4.32 × 100 to 2.79 × 101 CFU/100 mL across different roof types in South Africa, with steel roofs exhibiting the highest levels.
Enterococci concentrations ranged from 1.60 × 101 to 1.73 × 10³ MPN/100 mL, with higher levels also observed in 2021. These results are consistent with those reported by Clark et al. (2019), who measured E. coli, Enterococci and Salmonella enterica in roof runoff from different roofing materials during multiple rain events in Utah. Their study, along with findings by Nalwanga et al. (2018), consistently highlighted Enterococci as being more prevalent than E. coli.
The consistently higher concentrations of Enterococci compared to E. coli suggest that the source of the fecal pollution likely originates from animal sources (Nalwanga et al., 2018). This aligns with the broader literature, which identifies birds, rodents and lizards as common contributors of pathogens in RHRW (Mendez et al., 2011; Simmons et al., 2001).
It is important to highlight that E. coli concentrations in our study fell within the recreational water compliance recommended by the USEPA in the 2012 RWQC, which recommends a geometric mean not exceeding 1.26 × 10² CFU/100 mL. In contrast, the geometric mean of Enterococci in both years exceeded the threshold of 3.50 × 101 CFU/100 mL from the same guidelines.
The EU 2006 guidelines for excellent bathing water quality set a 95th percentile threshold of 5.00 × 10² CFU/100 mL for E. coli and 2.00 × 10² CFU/100 mL for Enterococci. E. coli concentrations in our samples met this standard in 2020 but exceed it in 2021. On the other hand, Enterococci concentrations exceeded the recommended limit in both years.
Presumptive Salmonella spp. concentrations ranged from 2.00 × 10² to 2.10 × 10⁴ CFU/100 mL. These values align with the findings of Nusraningrum et al. (2024), who also reported Salmonella spp. in RHRW systems with both catchment ponds and storage tanks, suggesting contamination sources such as dust and animal excreta washed off from roofs. Also, Chevez et al. (2024) detected Salmonella (invA) gene marker presence in six of the eight studied ponds and 6% detection rate across 88 samples with higher prevalence during the summer months, confirming the seasonal nature of Salmonella in surface waters. In contrast, Morgado et al. (2022) did not detect Salmonella spp. in samples from vegetable rain gardens equipped with a first flush diverter. The absence of such a diverter may partially explain the higher bacterial load in our study.
In our study, P. aeruginosa was detected at concentrations ranging from 4.00 × 100 to 6.00 × 10³ MPN/100 mL, with higher levels observed in 2020. These concentrations are higher than those reported by Grabowski et al. (2024), who investigated the pollutant removal efficiency of a rainwater treatment system in a National Park in Poland. They reported P. aeruginosa concentrations ranging from 0 to 3.80 × 101 CFU/100 mL, suggesting that system design and maintenance can influence bacterial proliferation.
The elevated concentrations observed in our study may be attributed to the absence of a first flush diverter, which would remove initial runoff carrying accumulated contaminants from the roof and surrounding surfaces. Additionally, reduced maintenance during COVID-19 pandemic in 2020 may have contributed to increased water stagnation and biofilm formation, both favoring growth of P. aeruginosa. Similar findings were reported by Collins and Nabaasa (Nusraningrum et al., 2024) who isolated P. aeruginosa during their assessment of the contamination of RHRW in Uganda, although specific concentrations were not indicated. Furthermore, Hamilton et al. (2017a), during their study of premise plumbing pathogens in RHRW tanks, detected significantly higher concentrations, highlighting the role of stagnation time in bacterial occurrence.
Interestingly, and in contrast to the trends observed for fecal indicator bacteria, both Salmonella spp. and P. aeruginosa showed higher concentrations in 2020 (Figure 2). This observation is consistent with the negative correlations found by Zhang et al. (2020), who reported negative correlations between temperature and the occurrence of certain microorganisms in RHRW.
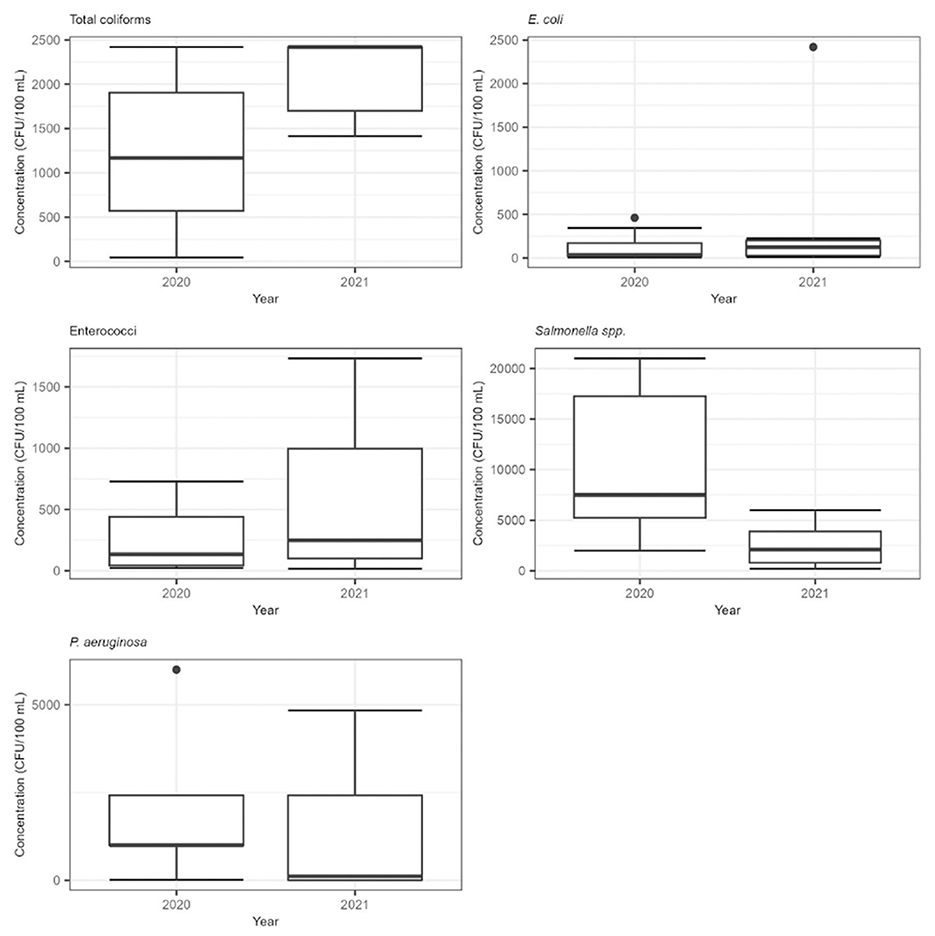
Figure 2. Box and whisker plots for bacterial concentrations for the years 2020 and 2021 at the pond. The line inside the box represents the median value, box represents the interquartile range (25–75 percentiles), black dots outside box represent the outliers, and whiskers show the maximum and minimum values.
Although the concentrations of Total coliforms, E. coli, and Enterococci were higher in 2021 compared to 2020, the results of the Mann-Whitney U test indicated that these differences were not statistically significant (p-value > 0.05). Similarly, no statistically significant difference was found for the different concentrations of Salmonella spp. and P. aeruginosa between the 2 years.
3.2.1 Dry and wet weather conditions and seasonal variations
In 2020, a total of eight samples were collected, with three of them taken following a dry weather period, and the remaining collected under wet conditions. Dry weather was defined as the absence rainfall within the 72 h prior sampling. Total coliforms and E. coli concentrations were lower during dry periods. A Mann-Whitney U test indicated that E. coli concentrations were significantly lower during dry weather (p < 0.05), while Total coliforms did not show a statistically significant difference between dry and wet conditions.
These observations align with previous studies documenting elevated fecal indicator bacteria following rainfall events. For instance, a study by Sarker et al. (2025) reported that E. coli concentrations in karst springs increased from 1.04 × 10² MPN/100 mL during dry conditions to 2.16 × 10² MPN/100 mL during wet conditions. Similarly, Hernandez et al. (2020) found significantly higher Total coliforms counts after rainfall at certain beach sites. However, it should be noted that the study by Hernandez et al. was conducted in a coastal setting, where hydrodynamic and microbial transport processes differ significantly from those in urban ponds. Collectively, these findings highlight the impact of rainfall as driver of fecal contamination in surface waters.
On the other hand, no clear difference was observed in the concentrations of Enterococci between dry and wet weather conditions, suggesting greater environmental persistence compared to E. coli (Ahmed et al., 2010a; Chidamba and Korsten, 2015). In 2021, only one of the seven samples was collected after a dry period, limiting comparative analysis for that year (Figure 3).
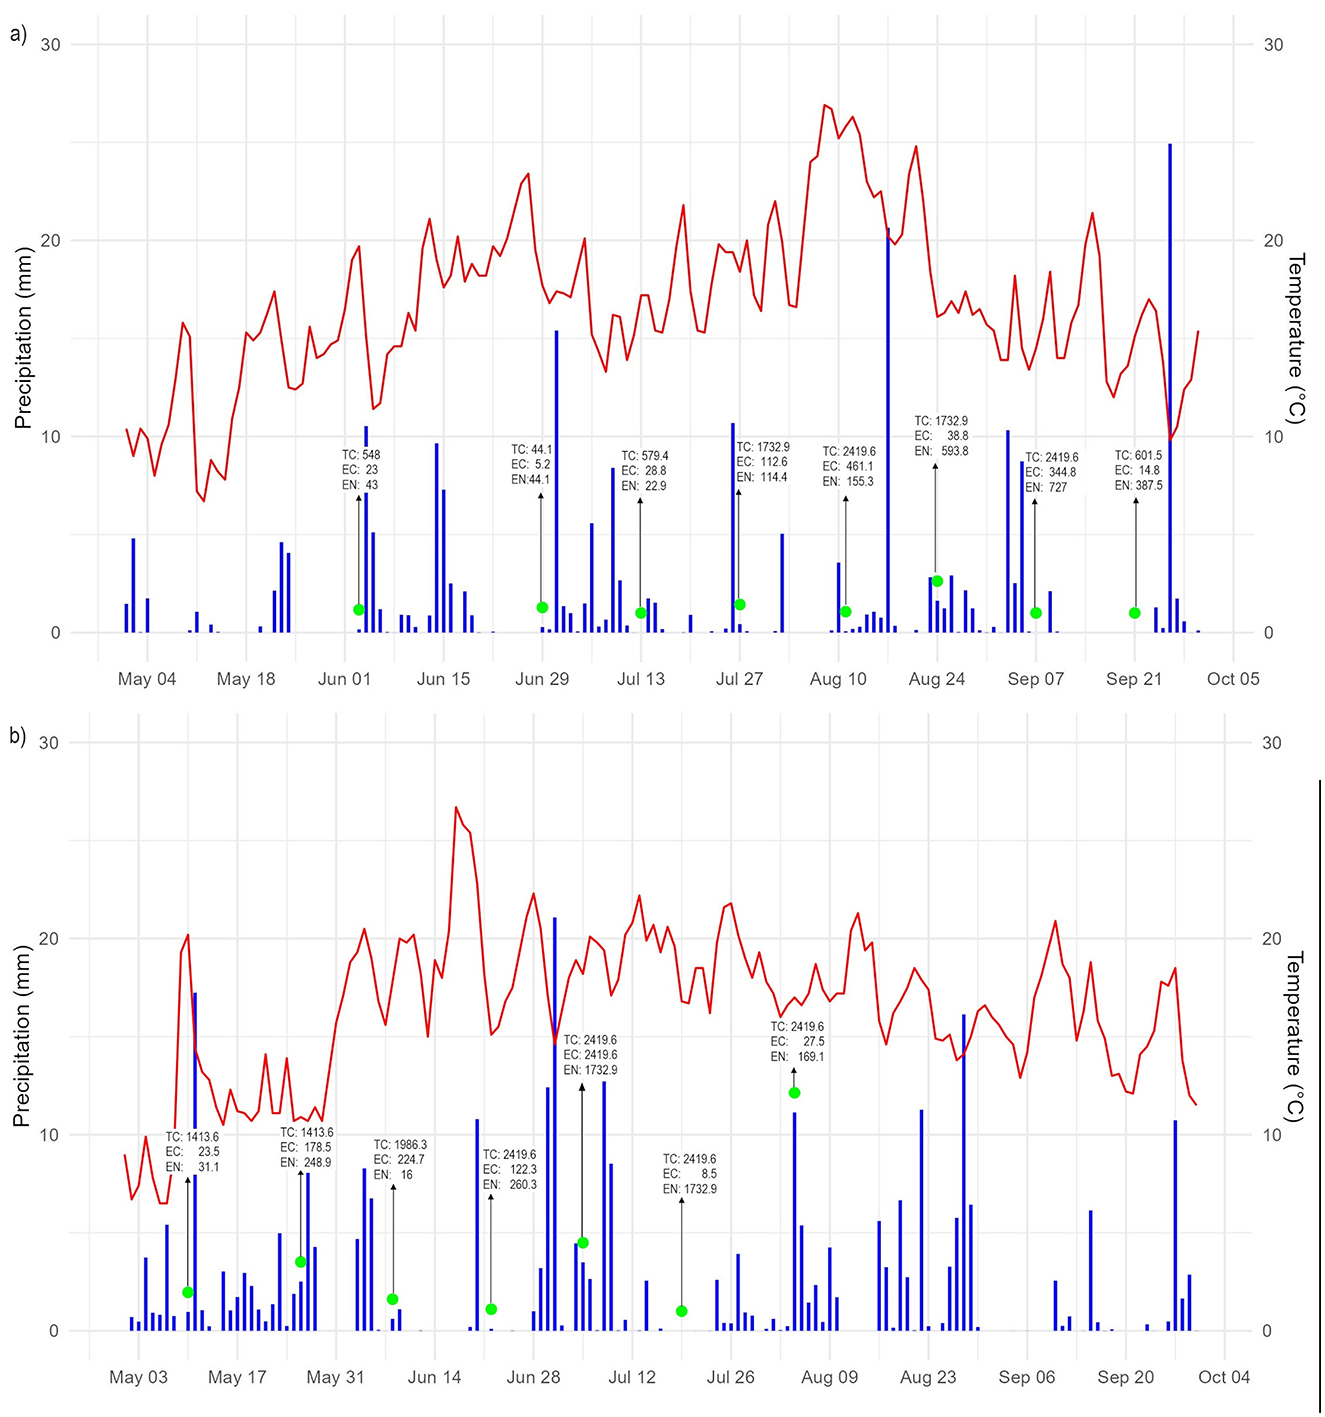
Figure 3. Rain events, temperature and sampling values of the pond water during (a) 2020 and (b) 2021. TC, total coliforms; EC, E. coli; EN, Enterococci.
Seasonal variations also influenced the microbiological quality of the pond water. A study conducted by students from the Leibniz University at the same site in November 2020 (late autumn) reported concentrations of 4.25 × 10² MPN/100 mL for Total coliforms, 1.60 × 101 MPN/100 mL for E. coli and 8.30 × 101 MPN/100 mL for Enterococci. In contrast, samples collected during summer 2020 showed higher mean concentrations of 1.26 × 10³ MPN/100 mL for Total coliforms, 1.29 × 10² MPN/100 mL for E. coli and 2.61 × 10² MPN/100 mL for Enterococci. These results indicate that Total coliforms and Enterococci levels were approximately three times higher in summer, while E. coli concentrations increased by a factor of eight.
These trends are consistent with findings by Zdeb et al. (2020), who observed significant seasonal variability in RHRW microbial quality. Their study reported E. coli values ranging from 0 to 2.40 × 10² CFU/100 mL, and Total coliforms reaching up to 7.50 × 10² CFU/100 mL in summer months. The highest contamination levels occurred during warmer periods (May to September), they attributed to increased microbial activity at higher temperatures and the accumulation of organic material on rooftops. However, since a comparison between dry and wet weather conditions or a detailed exploration of seasonal bacterial variations was beyond the scope of our study, an in-depth investigation is necessary to fully understand this.
3.3 Human exposure
3.3.1 Field observations
Field observations were conducted on days with favorable weather conditions, characterized by temperatures between 23°C and 30°C, as such conditions increased the likelihood of human interaction with the pond water. During the observations, a total of 148 individuals were observed at the pond, of which 29% were children estimated to be under 16 years of age (Figure 4a). Approximately 50% of these children were observed to have direct contact with the pond water; therefore the risk of illness/infection was estimated specifically for children.
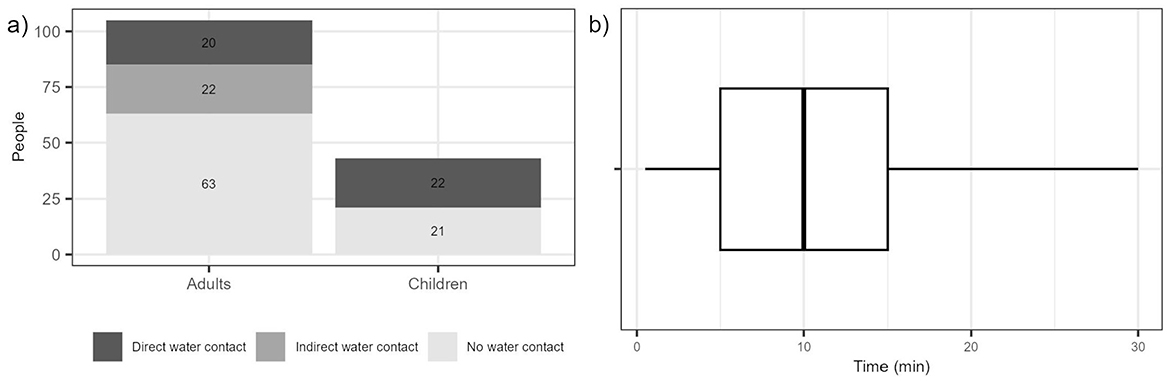
Figure 4. (a) People observed during the field observations and the type of water contact they had. Direct water contact is defined as hand immersion in water, hand-to-mouth after water contact and water droplets falling in face or mouth. Indirect water contact is defined as contact through another person, animal, or object and no water contact is defined as people in the surroundings with no observed interaction with water. (b) Boxplot for the time of exposure of people who had direct water contact at the pond. The line inside the box represents the median, the box represents the interquartile range (25–75 percentiles), the black dots outside the box represent the outliers, and the whiskers show the maximum and minimum values.
Throughout our field observations, we recognized various exposure pathways, including activities like washing hands and faces, having wet feet, and in some cases, full-body immersion. This highlights that the predominant exposure pathways for children at this location involve water ingestion and skin contact with the water. Exposure (t) was recorded for individuals with direct water contact. The collected data were then fitted to a Beta distribution and then used as input to the dose-response model for the Monte Carlo simulations to account for variability in exposure time. A median exposure time of 10 min was found (Figure 4b).
3.3.2 Dose estimation
Bacterial concentrations event to event variability, which was captured through fitted probability distributions and integrated into the QMRA. This approach allowed for a more realistic estimation of exposure doses and associated health risks (Haas et al., 2014). Table 3 presents the best-fit probability distributions identified for each of the five targeted bacteria and their corresponding parameters used in the Monte Carlo simulations.
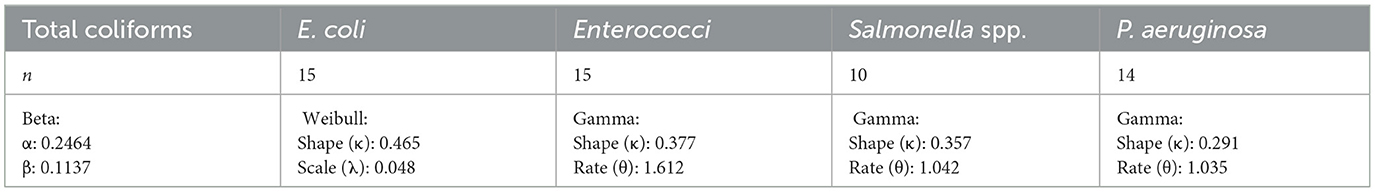
Table 3. Probability distributions of selected bacteria used in the Monte Carlo simulations.
The use of these distributions in the Monte Carlo simulations allowed the estimation of risk probabilities per event across the full range of observed concentrations. Results showed that Enterococci and Salmonella spp. were associated with the highest variability and concentration peaks, which strongly influenced the risk outcomes presented in Section 3.4.2.
The estimated exposure doses per recreational event varied significantly across the five assessed bacteria, reflecting the differences in their environmental concentrations and exposure dynamics. Table 4 presents a summary of the mean, median, 95-percentile and maximum values obtained for the doses.
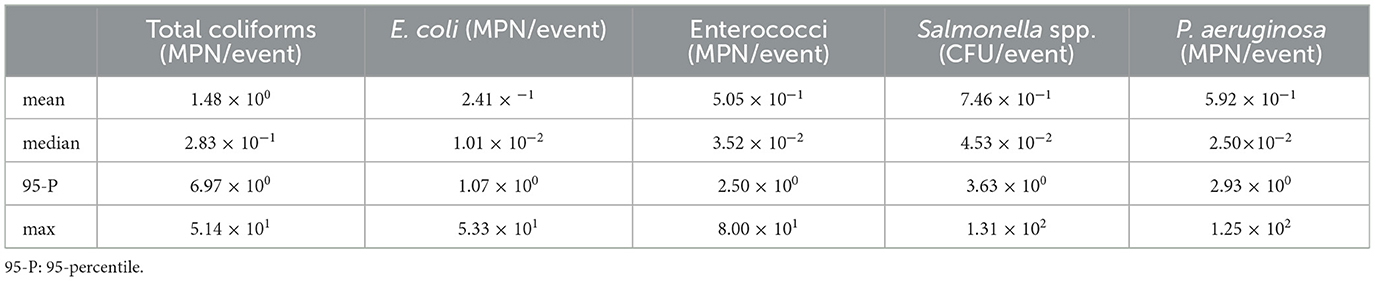
Table 4. Summary of mean, median, 95-percentile and max dose values of each bacterium.
The results obtained from the Monte Carlo simulations for dose estimation showed that Total coliforms had the highest mean (1.48 × 100 MPN/event), median (2.83 × 10⁻¹ MPN/event) and 95-percentile (6.97 × 100 MPN/event) among all the assessed microorganisms. These elevated values indicate that Total coliforms represent a relatively consistent exposure risk across events, driven by occasional peaks in concentrations. However, its maximum exposure dose (5.14 × 101 MPN/event) was not the highest among the microorganisms assessed, suggesting fewer extreme exposure events.
E. coli showed relatively lower exposure levels, with a median dose of 1.01 × 10⁻² MPN/event and a 95-percentile of 1.07 × 100 MPN/event. The maximum dose reached 5.33 × 101 MPN/event, similar to Total coliforms, although such high values occurred less frequently in the simulation.
Enterococci and P. aeruginosa presented similar dose profiles, with median doses of 3.52 × 10⁻² and 2.50 × 10⁻² MPN/event, respectively, and 95-percentiles of 2.50 × 100 and 2.93 × 100 MPN/event. These values suggest that while typical exposures are moderate, upper-bound exposures are not uncommon. These results align with prior research indicating the environmental persistence of Enterococci in recreational waters (Stec et al., 2022) and the ability of P. aeruginosa to proliferate under biofilm-favoring conditions (Zhang et al., 2021).
Presumptive Salmonella spp. had the highest maximum dose overall at 1.31 × 10² CFU/event and a broad dose range (1.64 × 10⁻¹⁸ to 1.31 × 10² MPN/event), followed by P. aeruginosa with a maximum of 1.25 × 10², indicating the potential for infrequent but high-risk exposure scenarios. There is a limited number of studies reporting dose exposure values in comparable urban pond settings, thus limiting our capacity to discuss our results with other published studies.
3.3.3 Risk characterisation
After calculating the dose to which individuals would be exposed at each recreational event, the risk of illness/infection is calculated by applying the dose-response relationship corresponding to each bacterium. In our study, we used a probabilistic approach to account for variability in bacterial concentrations, exposure volumes and exposure duration as input parameters. We performed Monte Carlo simulations to assess the risk of gastrointestinal illness due to Total coliforms, E. coli, Enterococci and Salmonella spp. and the risk of skin infection due to P. aeruginosa. The results of the associated health risks are shown in Figure 5.
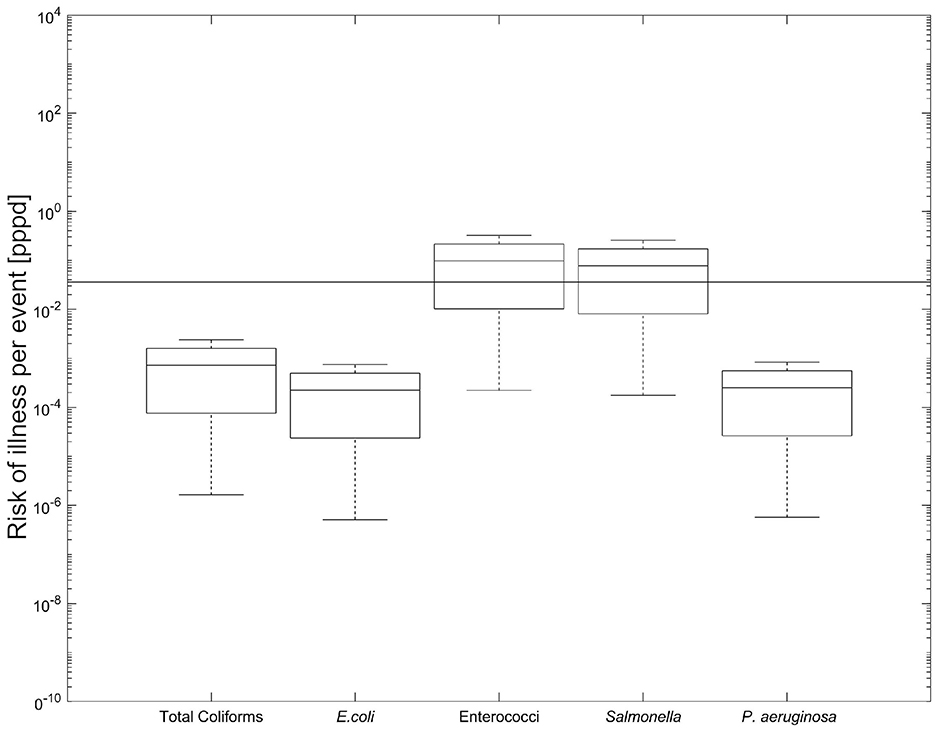
Figure 5. Box and whisker plot of risk of illness/infection per 1,000 users per day at the pond. The horizontal line across the plot represents the USEPA mean illness rate of 36/1,000 users. The line inside the boxes represents the median, each box represents the interquartile range (25-75 percentiles), the crosses outside the box represent the outliers, and the whiskers represent the minimum and maximum values.
Given the limited number of studies assessing potential health risks associated with recreational exposure to RHRW stored in urban ponds, we have drawn upon literature evaluating risks from rainwater tanks and other relevant sources to contextualize our findings.
As shown in Figure 5, Enterococci and Salmonella spp. exhibited risk levels that may exceed the benchmark established by the USEPA (2012) (USEPA, 2012), while Total coliforms, E. coli and P. aeruginosa remained below this threshold. This pattern is likely influenced by the low infectious dose assumed for Enterococci in the applied dose-response model, as well as the elevated presumptive concentrations of Salmonella spp. observed in our samples.
Our findings for Enterococci are consistent with recent research indicating that Enterococci concentrations above 1.00 × 10² CFU/100 mL are associated with increased gastrointestinal illness risk in recreational waters. For instance, the Canadian Recreational Water Quality Guidelines designate Enterococci as a primary indicator of fecal contamination, with concentrations exceeding 7.00 × 101 CFU/100 mL considered a potential health risk for swimmers (Health Canada, 2023). Another study carried out in Sydney's Parramatta River estuary (Lloyd et al., 2024) applied Bayesian network models to predict Enterococci levels and found that concentrations frequently exceeded urban bathing water safety thresholds.
Furthermore, Chidamba and Korsten (2018) assessed fecal indicator bacteria in RHRW storage tanks and categorized Enterococci concentrations of 1.00 × 10² to 1.00 × 10³ CFU/100 mL as high risk, and concentrations exceeding 1.00 × 10³ CFU/100 mL as extreme risk. This underscores the potential health implications associated with Enterococci levels observed in urban recreational waters.
The detection of presumptive Salmonella spp. in our study aligns with the findings of a recent systematic review, which highlighted the prevalence of Salmonella in water bodies across South America, reinforcing the importance of monitoring these pathogens in recreational waters (Reyes et al., 2025). In contrast, our findings differ from those of Ahmed et al. (2010b), who assessed health risks from RHRW ingestion and concluded that Salmonella spp. posed no significant risk relative to WHO (2001) benchmarks. This discrepancy may be attributed to lower reported Salmonella concentrations in their study and differences in ingestion volumes between exposure scenarios.
Our results for P. aeruginosa are consistent with those of Kusumawardhana et al. (2021), who found that the annual infection risk from showering remained below the WHO annual benchmark of 10−4 pppy (WHO, 2001). It is worth noting that opportunistic pathogens, such as P. aeruginosa, along with other bacteria that have been identified in RHRW samples, can present public health risks when used for activities such as garden hosing or toilet flushing, which can be comparable to the activities and volumes assessed during our study (Hamilton et al., 2017b).
One limitation of our study is the inability to access and sample the rooftop catchment area, which restricted our ability to determine the relative contribution of rooftop vs. other parts of the system to microbial contamination. Further investigation is needed to trace the sources of contamination.
Given the intermittent nature of recreational exposure, risk estimates were expressed in units per day, assuming a single exposure event per day (Haas et al., 2014). Additionally, potential reductions in bacterial concentrations due to degradation during water transport or environmental exposure were not accounted for, which may influence actual risk levels.
Finally, it is important to note that the health risk estimates are based on a “worst-case scenario” and presumptive concentrations of indicator and pathogenic organisms. The associated risk values should be interpreted as conservative estimates that may overstate actual illness/infection probabilities.
3.4 Sensitivity analysis
The results of the sensitivity analysis (Figure 6) show that, across all bacteria assessed, the time of exposure was the parameter with the greatest influence on the infection risk, closely followed by the bacterial concentration (C). This highlights the critical role of both behavior (duration of contact) and environmental conditions (microbial load) in determining health outcomes. However, this trend was reversed for P. aeruginosa, with bacterial concentration (C) having a greater influence on infection risk than exposure time, suggesting pathogen-specific differences in sensitivity patterns. Conversely, the parameters with the least effect were the surface area of the hand for hand-to-mouth contact (A) and the film thickness of water on the hands (h). Similar results have been reported in other studies (Chen et al., 2021; Federigi et al., 2020; Gitter et al., 2023). These findings contribute to a better understanding of the critical factors that determine the overall risk of illness or infection associated with the bacteria studied, allowing to refine risk assessment models and prioritize intervention strategies that focus on reducing exposure time and bacterial concentrations in recreational water settings.
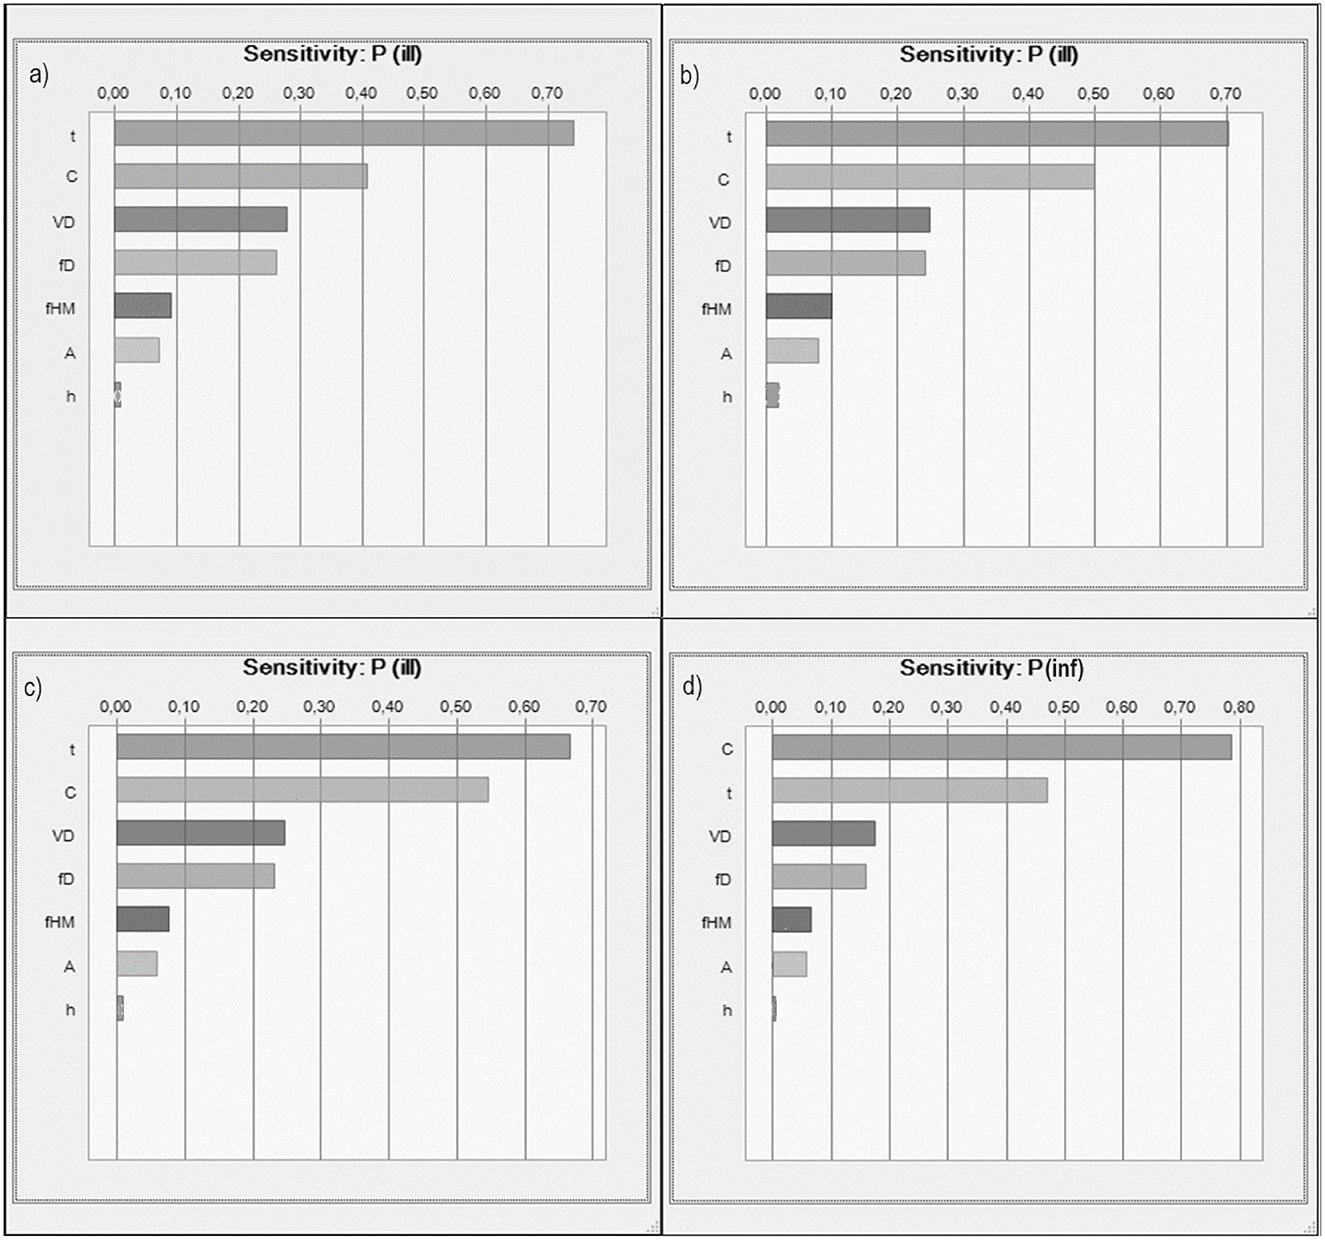
Figure 6. Sensitivity analysis expressed as rank correlation due to (a) E. coli (b) Enterococci (c) Salmonella spp. (d) P. aeruginosa.
Microbial contamination in urban ponds, especially those used as alternative water sources for multiple purposes, including recreation, can pose a significant health risk for the local community, especially for children who frequently engage in recreational activities in direct contact with pond water. Exposure through ingestion, skin contact or inhalation can lead to different infections and illnesses, such as gastrointestinal infections, skin rashes, and respiratory issues. The results of our study highlight the presence of potentially pathogenic bacteria in urban ponds, including Salmonella spp. and P. aeruginosa, both known to cause severe infections, which reinforces the concern of recreational exposure to this type of water.
The implications of such contact can go beyond individual negative health concerns. Outbreaks of waterborne illnesses can put additional stress on the local healthcare systems and impact community wellbeing. Additionally, negative perception of water safety can deteriorate the recreational use of such urban ponds, affecting the social, psychological and environmental value of these spaces.
To mitigate these risks, it is essential to implement regular water quality monitoring, raise awareness on safe recreational practices, and improve system maintenance to minimize the entry of biological contamination.
4 Conclusions
This study identified microbial health risks associated with recreational exposure to water from an urban pond, where Enterococci and Salmonella spp. levels exceeded the USEPA benchmark threshold used for comparison. Enterococci concentrations frequently surpassed the regulatory benchmarks, suggesting persistent fecal contamination likely originating from animal sources.
Microbial concentrations of E. coli varied with weather conditions, showing notable increases following rainfall events. Moreover, E. coli, Enterococci and Salmonella spp., demonstrated clear seasonal patterns, with higher concentrations observed during the summer months, which coincide with periods of increased recreational activity. In addition, water balance analysis suggested that infiltrated pond water may affect the microbiological quality of local groundwater.
Our findings provide new evidence to support the development of targeted public health guidelines and the safe design of nature-based urban water systems. The observed weather-related and seasonal fluctuations in microbial concentrations highlight the importance of continuous water quality monitoring, especially during summer when human exposure to water is most frequent. Continuous efforts in monitoring, regulation, and system management are essential to address these emerging challenges and to support the long-term success of urban water-sensitive initiatives, contributing to the achievement of the Sustainable Development Goals.
Data availability statement
The datasets presented in this study can be found in online repositories. The names of the repository/repositories and accession number(s) can be found at: Carpio, Estefania; Dueker, Urda; Nogueira, Regina (2024), “Rainwater management and associated health risks: Case study on the Welfengarten campus of the Leibniz University”, Mendeley Data, V1, doi: 10.17632/c6d7f3v5dv.1.
Author contributions
EC-V: Formal analysis, Investigation, Software, Writing – original draft, Writing – review & editing. UD: Formal analysis, Investigation, Methodology, Writing – review & editing. RN: Conceptualization, Supervision, Writing – review & editing.
Funding
The author(s) declare that financial support was received for the research and/or publication of this article. This research was supported by the Federal Ministry of Education and Research (BMBF) (grant number 033W105A UP5) within the RES:Z call: Resource-optimized city of the future; research project TransMiT-Resource-optimized transformation of combined and separate drainage systems in existing quarters with high population pressure, Subproject Effect of BGI on local climate / backyards.
Acknowledgments
We are grateful to Ms. Claudia Helle for her assistance during lab work, Ms. Franziska Meyer and Ms. Zora Treiber for their contribution during sampling and field observations.
Conflict of interest
The authors declare that the research was conducted in the absence of any commercial or financial relationships that could be construed as a potential conflict of interest.
Generative AI statement
The author(s) declare that no Gen AI was used in the creation of this manuscript.
Publisher's note
All claims expressed in this article are solely those of the authors and do not necessarily represent those of their affiliated organizations, or those of the publisher, the editors and the reviewers. Any product that may be evaluated in this article, or claim that may be made by its manufacturer, is not guaranteed or endorsed by the publisher.
Supplementary material
The Supplementary Material for this article can be found online at: https://www.frontiersin.org/articles/10.3389/frwa.2025.1590548/full#supplementary-material
References
Abdillah, L. A., Rofiq, A. A., and Indriani, D. E. (2018). Information technology utilization in environmentally friendly higher education. arXiv. 350–355. doi: 10.5220/0008908303500355
Ahmed, W., Goonetilleke, A., and Gardner, T. (2010a). Implications of faecal indicator bacteria for the microbiological assessment of roof-harvested rainwater quality in southeast Queensland, Australia. Can. J. Microbiol. 56, 471–479. doi: 10.1139/W10-037
Ahmed, W., Vieritz, A., Goonetilleke, A., and Gardner, T. (2010b). Health risk from the use of roof-harvested rainwater in Southeast Queensland, Australia, as potable or nonpotable water, determined using quantitative microbial risk assessment. Appl. Environ. Microbiol. 76, 7382–7391. doi: 10.1128/AEM.00944-10
Arikan, A., and Cakir, N. (2023). Climate change and future infectious diseases: a growing threat. New Microbes New Infect. 52:101088. doi: 10.1016/j.nmni.2023.101088
Baral D. Speicher A. Dvorak B. Admiraal D. and Li, X (2018). Quantifying the relative contributions of environmental sources to the microbial community in an urban stream under dry and wet weather conditions. Appl. Environ. Microbiol. 84:e00896–18. doi: 10.1128/AEM.00896-18
Barreiros, A. M., Durão, A., Galvão, A., Matos, C., Mateus, D., Araújo, I., et al. (2024). Higher education institutions' students' literacy in sustainable use of potable water. Sustainability 16:5217. doi: 10.3390/su16125217
CAMRA (2021). Center for advancing microbial risk assessment. Available online at: http://qmrawiki.canr.msu.edu/index.php/Escherichia_coli:_Dose_Response_Models (accessed April 23, 2023).
Carpio Vallejo, E., Düker, U., Meyer, F., Berding, U., and Nogueira, R. (2023). Microbiological water quality and derived health risks from exposure to ornamental water fountains in the city of Hannover. Risk Anal. 44, 24–39. doi: 10.1111/risa.14145
Carpio-Vallejo, E., Düker, U., Waldowski, J., and Nogueira, R. (2024). Contribution of rooftop rainwater harvesting to climate adaptation in the city of Hannover: water quality and health issues of rainwater storage in cisterns and ponds. Int. J. Hygiene Environ. Health 256:114320. doi: 10.1016/j.ijheh.2024.114320
Center for Advancing Microbial Risk Assessment (CAMRA) (2020). Escherichia coli: Dose Response Experiments. QMRA Wiki. Available online at: https://qmrawiki.org/experiments/escherichia-coli (Retrieved December 8, 2020).
Chen, Y-. H., Yan, C., Yang, Y-. F., and Ma, J-. X. (2021). Quantitative microbial risk assessment and sensitivity analysis for workers exposed to pathogenic bacterial bioaerosols under various aeration modes in two wastewater treatment plants. Sci. Total Environ. 755:142615. doi: 10.1016/j.scitotenv.2020.142615
Chevez, Z. R., Dunn, L. L., da Silva, A. L. B. R., and Rodrigues, C. (2024). Prevalence of STEC virulence markers and Salmonella as a function of abiotic factors in agricultural water in the southeastern United States. Front. Microbiol. 15:1320168. doi: 10.3389/fmicb.2024.1320168
Chidamba, L., and Korsten, L. (2018). Relative proportions of E. coli and Enterococcus spp. may be a good indicator of potential health risks associated with the use of roof harvested rainwater stored in tanks. Environ. Monit. Assess 190:177. doi: 10.1007/s10661-018-6554-1
Chidamba, L., and Korsten, L. A. (2015). Scoping study on the prevalence of Escherichia coli and Enterococcus species in harvested rainwater stored in tanks. WSA 41:501. doi: 10.4314/wsa.v41i4.09
Clark, G. G., Jamal, R., and Weidhaas, J. (2019). Roofing material and irrigation frequency influence microbial risk from consuming homegrown lettuce irrigated with harvested rainwater. Sci. Total Environ. 651, 1011–109. doi: 10.1016/j.scitotenv.2018.09.277
Clarke, R. M., Peyton, D. P., Healy, M. G., Fenton, O., and Cummins, E. (2017). A quantitative microbial risk assessment model for total coliforms and E. coli in surface runoff following application of biosolids to grassland. Environ. Pollut. 224, 739–750. doi: 10.1016/j.envpol.2016.12.025
De Man, H., Bouwknegt, M., van Heijnsbergen, E., Leenen, E. J. T. M., van Knapen, F., de Roda Husman, A. M., et al. (2014). Health risk assessment for splash parks that use rainwater as source water. Water Res. 54, 254–261. doi: 10.1016/j.watres.2014.02.010
EPA (2020). Assessment of Treatment Plant Performance and Water Quality Data: A Guide for Students, Researchers and Practitioners. London: IWA Publishing
Eregno, F. E. (2017). Quantitative microbial risk assessment and water quality modelling - on drinking water sources, recreational and recycled waters [thesis]. Norwegian University of Life Sciences, Oslo, Norway.
Eregno, F. E., Tryland, I., Tjomsland, T., Myrmel, M., Robertson, L., Heistad, A., et al. (2016). Quantitative microbial risk assessment combined with hydrodynamic modelling to estimate the public health risk associated with bathing after rainfall events. Sci. Total Environ. 548–549, 270–279. doi: 10.1016/j.scitotenv.2016.01.034
Federigi, I., Bonadonna, L., Bonanno Ferraro, G., Briancesco, R., Cioni, L., Coccia, A. M., et al. (2020). Quantitative microbial risk assessment as support for bathing waters profiling. Mar. Pollut. Bull. 157:111318. doi: 10.1016/j.marpolbul.2020.111318
Fissi, S., Romolini, A., Gori, E., and Contri, M. (2021). The path toward a sustainable green university: the case of the University of Florence. J. Clean. Prod. 279:123655. doi: 10.1016/j.jclepro.2020.123655
Gitter, A., Gidley, M., Mena, K. D., Ferguson, A., Sinigalliano, C., Bonacolta, A., et al. (2023). Integrating microbial source tracking with quantitative microbial risk assessment to evaluate site specific risk based thresholds at two South Florida beaches. Front. Microbiol. 14:1210192. doi: 10.3389/fmicb.2023.1210192
Grabowski, T., Bochniak, A., Siwiec, T., and Józwiakowski, K. (2024). Pollutant removal efficiency in a rainwater treatment system in roztocze national Park (Poland). Sustainability 16:4709. doi: 10.3390/su16114709
Haas, C. N., Rose, J. B., and Gerba, C. P. (2014). Quantitative Microbial Risk Assessment. Hoboken, New Jersey: John Wiley & Sons, Inc. doi: 10.1002/9781118910030
Hamilton, K. A., Ahmed, W., Palmer, A., Smith, K., Toze, S., Haas, C. N., et al. (2017a). Seasonal assessment of opportunistic premise plumbing pathogens in roof-harvested rainwater tanks. Environ. Sci. Technol. 51, 1742–1753. doi: 10.1021/acs.est.6b04814
Hamilton, K. A., Ahmed, W., Toze, S., and Haas, C. N. (2017b). Human health risks for Legionella and Mycobacterium avium complex (MAC) from potable and non-potable uses of roof-harvested rainwater. Water Res. 119, 288–303. doi: 10.1016/j.watres.2017.04.004
Hernandez, R., Acedo, I., and Dillon, J. G. (2020). Impact of wave action and rainfall on incidence and antibiotic resistance of total coliforms in Southern California beaches. J. Water Health 18, 766–775. doi: 10.2166/wh.2020.100
HLPW (2018). Making Every Drop, Count: an Agenda for Water Action, United Nation High-level Panel on Water Outcome Document: An Agenda for Water Action. New York, NY: UN Department of Economic and Social Affairs.
Holcomb, D. A., and Stewart, J. R. (2020). Microbial indicators of fecal pollution: recent progress and challenges in assessing water quality. Curr. Environ. Health Rep. 7, 311–324. doi: 10.1007/s40572-020-00278-1
IDEXX Laboratories, Inc. (2019). Water Testing Solutions: Product Catalog. Westbrook, ME. Available online at: https://www.idexx.com/files/water-product-catalog.pdf
Imteaz, M. A., Boulomytis, V. T. G., Yilmaz, A. G., and Shanableh, A. (2022). Water quality improvement through rainwater tanks: a review and simulation study. Water 14:1411. doi: 10.3390/w14091411
IRP (2018). The Weight, of Cities: Resource Requirements of Future Urbanization. Nairobi, Kenya: UN Environment Programme.
Islam, M. M., Iqbal, M. S., D'Souza, N., and Islam, M. A. (2021). A review on present and future microbial surface water quality worldwide. Environ. Nanotechnol. Monit. Manage. 16:100523. doi: 10.1016/j.enmm.2021.100523
Jiang, Y., Zevenbergen, C., and Ma, Y. (2018). Urban pluvial flooding and stormwater management: a contemporary review of China's challenges and “sponge cities” strategy. Environ. Sci. Policy 80, 132–143. doi: 10.1016/j.envsci.2017.11.016
Kusumawardhana, A., Zlatanovic, L., Bosch, A., and van der Hoek, J. P. (2021). Microbiological health risk assessment of water conservation strategies: a case study in Amsterdam. Int. J. Environ. Res. Public Health 18:2595. doi: 10.3390/ijerph18052595
Leonard, A. F. C., Zhang, L., Balfour, A. J., Garside, R., Hawkey, P. M., Murray, A. K., et al. (2018). Exposure to and colonisation by antibiotic-resistant E. coli in UK coastal water users: environmental surveillance, exposure assessment, and epidemiological study (Beach Bum Survey). Environ Int. 114, 326–333. doi: 10.1016/j.envint.2017.11.003
Livhuwani, V., Eunice, U-. J., and Edokpayi, J. N. (2025). Water quality assessment of rooftop harvested rainwater across different roof types in a semi-arid region of South Africa. Water Environ. Res. 97:e70007. doi: 10.1002/wer.70007
Lloyd, S. D., Carvajal, G., Campey, M., Taylor, N., Osmond, P., Roser, D. J., et al. (2024). Predicting recreational water quality and public health safety in urban estuaries using Bayesian Networks. Water Res. 254:121319. doi: 10.1016/j.watres.2024.121319
Mendez, C. B., Klenzendorf, J. B., Afshar, B. R., Simmons, M. T., Barrett, M. E., Kinney, K. A., et al. (2011). The effect of roofing material on the quality of harvested rainwater. Water Res. 45, 2049–2059. doi: 10.1016/j.watres.2010.12.015
Morgado, M. E., Hudson, C. L., Chattopadhyay, S., Ta, K., East, C., Purser, N., et al. (2022). The effect of a first flush rainwater harvesting and subsurface irrigation system on E. coli and pathogen concentrations in irrigation water, soil, and produce. Sci. Total Environ. 843:156976. doi: 10.1016/j.scitotenv.2022.156976
Nachson, U., Silva, C. M., Sousa, V., Ben-Hur, M., Kurtzman, D., Netzer, L., et al. (2022). New modelling approach to optimize rainwater harvesting system for non-potable uses and groundwater recharge: a case study from Israel. Sustain. Cities Soc. 85:104097. doi: 10.1016/j.scs.2022.104097
Nalwanga, R., Muyanja, C. K., McGuigan, K. G., and Quilty, B. A. (2018). Study of the bacteriological quality of roof-harvested rainwater and an evaluation of SODIS as a suitable treatment technology in rural Sub-Saharan Africa. J. Environ. Chem. Eng. 6, 3648–3655. doi: 10.1016/j.jece.2016.12.008
NLWKN (2016). Hydrologische Landschaften im Raum Niedersachsen Verteilung der Verdunstung. Available online at: https://www.nlwkn.niedersachsen.de/startseite/wasserwirtschaft/flusse_bache_seen/hydrologische_landschaften/verdunstung/hydrologische-landschaften-im-raum-niedersachsen-38707.html (accessed January 16, 2023).
NLWKN (2023). Grundwasserstandonline. Available online at: https://www.grundwasserstandonline.nlwkn.niedersachsen.de/Karte (accessed September 2, 2023).
Nusraningrum, D., Widyanty, W., Indrajaya, S., Soonsan, N., Sangthong, S., and Pattanapokinsakul, K. (2024). Improving E-learning mediating green innovation and green technology for green management practice. Discov. Sustain. 5:263. doi: 10.1007/s43621-024-00463-4
Peng, S., Cui, H., and Ji, M. (2018). Sustainable rainwater utilization, and water circulation model for green campus design at Tianjin University. J. Sustain. Water Built. Environ. 4:04017015. doi: 10.1061/JSWBAY.0000841
Pérez-Rodríguez, F. (2021). Risk Assessment Methods for Biological and Chemical Hazards in Food. Boca Raton: CRC Press (2020). doi: 10.1201/9780429083525
Rahoui, H. (2021). “Greenest City 2020, Vancouver,” in Urban Planning for Transitions, eds. N. Douay and M. Minja (London; Hoboken, NJ: ISTE Ltd and John Wiley & Sons, Inc.), 47–67. doi: 10.1002/9781119821670.ch4
Reyes, M. S. G., Palharini, R. S. A., Monteiro, F. F., Ayala, S., and Undurraga, E. A. (2025). Prevalence and distribution of salmonella in water bodies in south america: a systematic review. Microorganisms 13:489. doi: 10.3390/microorganisms13030489
Riege, M., and Schubert, H. (2002). Sozialraumanalyse. Wiesbaden: VS Verlag für Sozialwissenschaften. doi: 10.1007/978-3-322-94995-0
Rodrigues, A., Calheiros, C. S. C., Teixeira, P., and Galvão, A. (2022). Water quality assessment of urban ponds and remediation proposals. Hydrology 9:114. doi: 10.3390/hydrology9070114
Roser, D. J., van den Akker, B., Boase, S., Haas, C. N., Ashbolt, N. J., and Rice, S. A. (2015). Dose-response algorithms for water-borne Pseudomonas aeruginosa folliculitis. Epidemiol. Infect. 143, 1524–1537. doi: 10.1017/S0950268814002532
RStudio Team (2020). RStudio: Integrated Development Environment for R (Version 1.3). RStudio, PBC. Available online at: https://www.rstudio.com
Sarker, S. K., Dapkus, R. T., Byrne, D. M., Fryar, A. E., and Hutchison, J. M. (2025). Quantifying temporal dynamics of E. coli concentration and quantitative microbial risk assessment of pathogen in a Karst Basin. Water 17:745. doi: 10.3390/w17050745
Sarma, R., and Singh, S. K. (2021). Simulating contaminant transport in unsaturated and saturated groundwater zones. Water Environ. Res. 93, 1496–1509. doi: 10.1002/wer.1555
Schmiedner, P. (2019). Umweltbericht 2017–2019, Leibniz Universität Hannover. Hanover, Germany: Das Präsidium der Gottfried Wilhelm Leibniz Universität Hannover, Dezernat 3 - Gebäudemanagement, Horst Bauer.
Simmons, G., Hope, V., Lewis, G., Whitmore, J., and Gao, W. (2001). Contamination of potable roof-collected rainwater in Auckland, New Zealand. Water Res. 35, 1518–1524. doi: 10.1016/S0043-1354(00)00420-6
Sinclair, R. G., Jones, E. L., and Gerba, C. P. (2009). Viruses in recreational water-borne disease outbreaks: a review. J. Appl. Microbiol. 107, 1769–1780. doi: 10.1111/j.1365-2672.2009.04367.x
Stec, J., Kosikowska, U., Mendrycka, M., Stepień-Pyśniak, D., Niedzwiedzka-Rystwej, P., Bebnowska, D., et al. (2022). Opportunistic pathogens of recreational waters with emphasis on antimicrobial resistance—a possible subject of human health concern. Int. J. Environ. Res. Public Health 19:7308. doi: 10.3390/ijerph19127308
Sugiarto, A., Lee, C-. W., and Huruta, A. D. (2022). A systematic review of the sustainable campus concept. Behav. Sci. 12:130. doi: 10.3390/bs12050130
Sunger, N., and Haas, C. N. (2015). Quantitative microbial risk assessment for recreational exposure to water bodies in Philadelphia. Water Environ. Res. 87, 211–222. doi: 10.2175/106143015X14212658613073
UNEP (2015). Cities, and climate change. Available online at: https://www.unep.org/explore-topics/resource-efficiency/what-we-do/cities/cities-and-climate-change (accessed April 11, 2023).
US Environmental Protection Agency Science and Ecosystem Support Division Athens Georgia.. (2016). Surface Water Sampling. Athens, Georgia: US Environmental Protection Agency Science and Ecosystem Support Division.
USEPA (2010). Quantitative Microbial Risk Assessment to Estimate Illness in Freshwater Impacted by Agricultural Animal Sources of Fecal Contamination. Washington, DC: U.S. Environmental Protection Agency, Office of Water.
USEPA (2012). Recreational water quality criteria. Available online at: https://www.epa.gov/wqc/2012-recreational-water-quality-criteria-documents (accessed October 15, 2020).
vOon, Y-. L., Oon, Y-. S., Ayaz, M., Deng, M., Li, L., Song, K., et al. (2023). Waterborne pathogens detection technologies: advances, challenges, and future perspectives. Front. Microbiol. 14:1286923. doi: 10.3389/fmicb.2023.1286923
Wade, T. J., Arnold, B. F., Schiff, K., Colford, J. M., Weisberg, S. B., Griffith, J. F., et al. (2022). Health risks to children from exposure to fecally-contaminated recreational water. PLoS One 17:e0266749. doi: 10.1371/journal.pone.0266749
WHO (2001). Water Quality: Guidelines, Standards, and Health; Assessment of Risk and Risk Management for Water-Related Infectious Disease. London: IWA Pub. 431 p.
WHO (2016). Quantitative microbial risk assessment: application for water safety management. Available online at: https://www.who.int/water_sanitation_health/publications/qmra/en/ (accessed August 24, 2020).
WHO (2022). Water, and sanitation. Available online at: https://www.who.int/europe/news-room/fact-sheets/item/water-and-sanitation (accessed April 15, 2025).
Withworth, J. (2024). Mixed findings from 2022 German infections data. Available online at: https://www.foodsafetynews.com/2024/08/mixed-findings-from-2022-german-infections-data/ (accessed April 15, 2025).
Wong, T. H., Rogers, B. C., and Brown, R. R. (2020). Transforming cities through water-sensitive principles and practices. One Earth 3, 436–447. doi: 10.1016/j.oneear.2020.09.012
Zabidi, H. A., Goh, H. W., Chang, C. K., Chan, N. W., and Zakaria, N. A. (2020). A review of roof and pond rainwater harvesting system: the design, performance and way forward. Water 12:3163. doi: 10.3390/w12113163
Zdeb, M., Zamorska, J., Papciak, D., and Słyś, D. (2020). The quality of rainwater collected from roofs and the possibility of its economic use. Resources 9:12. doi: 10.3390/resources9020012
Zeki, S. A. (2022). Preliminary evaluation of microbial water quality in the irrigation pond. Water Environ. Res. 94:e10757. doi: 10.1002/wer.10757
Zhang, X., Xia, S., Ye, Y., and Wang, H. (2021). Opportunistic pathogens exhibit distinct growth dynamics in rainwater and tap water storage systems. Water Res. 204:117581. doi: 10.1016/j.watres.2021.117581
Zhang, X., Xia, S., Zhao, R., and Wang, H. (2020). Effect of temperature on opportunistic pathogen gene markers and microbial communities in long-term stored roof-harvested rainwater. Environ. Res. 181:108917. doi: 10.1016/j.envres.2019.108917
Keywords: roof-harvested rainwater, recreational interaction, microbiological water quality, waterborne diseases, gastrointestinal illnesses, microbial risk assessment
Citation: Carpio-Vallejo E, Düker U and Nogueira R (2025) Rainwater management and associated health risks: case study on the Welfengarten campus of the Leibniz University of Hannover, Germany. Front. Water 7:1590548. doi: 10.3389/frwa.2025.1590548
Received: 09 March 2025; Accepted: 28 May 2025;
Published: 20 June 2025.
Edited by:
Nitish Sharma, The State University of New Jersey, United StatesReviewed by:
Zamfira Stupar, Research Institute for Analytical Instrumentation, RomaniaDeepak Sharma, Chandigarh College of Technology, India
Copyright © 2025 Carpio-Vallejo, Düker and Nogueira. This is an open-access article distributed under the terms of the Creative Commons Attribution License (CC BY). The use, distribution or reproduction in other forums is permitted, provided the original author(s) and the copyright owner(s) are credited and that the original publication in this journal is cited, in accordance with accepted academic practice. No use, distribution or reproduction is permitted which does not comply with these terms.
*Correspondence: Regina Nogueira, bm9ndWVpcmFAaXNhaC51bmktaGFubm92ZXIuZGU=