 Bruno Pereira
 Pedro Medeiros
 Antônio Alves Meira Neto3
 Murugesu Sivapalan
- 1Department of Agricultural Engineering, Federal University of Ceará, Fortaleza, Brazil
- 2Federal Institute of Education, Science, and Technology of Ceará, Fortaleza, Brazil
- 3Department of Civil and Environmental Engineering, Colorado State University, Fort Collins, CO, United States
- 4Department of Geography and Geographic Information Science, University of Illinois at Urbana-Champaign, Champaign, IL, United States
- 5Department of Civil and Environmental Engineering, University of Illinois at Urbana-Champaign, Champaign, IL, United States
The study focuses on the history of expansion of water infrastructure and drought mitigation measures, through construction of a large network of reservoirs over a 100-year period in the Jaguaribe River Basin, in the state of Ceará, Brazil. The goal is to assess why and how a dense network of reservoirs came to be constructed, and the influence of natural and socio-economic factors, using the findings to develop a conceptual understanding of how the search for water security might have unfolded in this Brazilian semi-arid region. We analyze historical data on the change in the region’s hydrologic variability and the socio-economic drivers of agricultural development, supported by quantitative measures of water security generated through the application of a hydrologic model that accounts for the effect of reservoirs on hydrologic variability. Based on the historical analysis and model outputs, the history of the search for water security is organized into four distinct eras, recognizing changes in human aspiration that contributed to the transition between the eras. Water security during Era 1 is limited by water Availability; during Era 2 the limiting factor turned to Accessibility; during Era 3 it turned to Acceptability; and finally, during Era 4, the current period, the limiting factor for water security is water Quality. The temporal dynamics associated with the pursuit of water security can thus be seen as the emergent outcome resulting from two-way feedback embedded in a coupled human-water system. The organization into the four distinct eras happens to align neatly into the United Nations AAAQ (Availability, Accessibility, Acceptability and Quality) framework, which identifies potential barriers to services in humanitarian contexts. The conceptual understanding gained from the analysis of the expansion of water storage infrastructure experienced in the Brazilian semi-arid places the pursuit of water security more broadly within the ambit of coupled human-water systems research, and also provides empirical evidence for the applicability of the AAAQ framework in synthesizing knowledge drawn from multiple places. In this way the study contributes to the understanding of the drivers and feedbacks in human-water system dynamics over long temporal timescales, which is the ultimate ambition of socio-hydrology as a scientific discipline.
1 Introduction
Water security can be defined as the universal human aspiration that “every person has access to sufficient drinking water at an affordable cost to lead a clean, healthy and productive life, while ensuring that the natural environment is protected and enhanced” (GWP, 2000; Engle et al., 2011). Throughout human history, especially in dry regions where water scarcity is acute, humans have developed a range of strategies to achieve water security. The search for water security has given rise to a range of water infrastructure policies and other solutions to improve access to water. These are mostly a combination of ancient practices and modern innovations, which are often adapted to the intrinsic environmental, social, and economic conditions of each region (Jiang, 2009; Hjelmstad et al., 2019; Medeiros and Sivapalan, 2020; Leal Filho et al., 2022). However, water security has remained an elusive goal in many parts of the world, even those that are endowed with plentiful water resources. For example, even in countries or regions that have natural and financial resources, water managers continue to face major difficulties meeting the water needs of all social groups. There is considerable social and economic inequality that manifests in the access to water arising from inadequacies in water policies, resulting in the phenomenon of water injustice (McLean, 2007).
The vast, densely populated semi-arid region in north-eastern Brazil (1 million km2 with 28 million inhabitants), is one of the most striking examples of how infrastructure solutions have been used to mitigate water scarcity, striving to enhance water security of local populations (Malveira et al., 2012; de Araújo and Medeiros, 2013; Ribeiro Neto et al., 2024; Meira Neto et al., 2024). The history of human-led interventions in this so-called Droughts Polygon traces back to the late 1800’s, when a severe multi-annual drought (1877–1879) caused the deaths of approximately half a million people (Smith, 1879), leading the Federal government in Brazil to embark on the development of the first strategic dam. The objective was to store water during wet seasons and use it during the dry periods, thus hoping to reduce the socioeconomic impacts of droughts (Araújo, 1990; Campos and de Studart, 2008). After a decade of debate and design, the first dam (Cedro, 5°S, 39°W) was constructed (1890–1906) with a storage capacity of 126 million m3.
Dam construction subsequently turned into the commonly accepted driving paradigm to deal with water scarcity, changing the dynamics of both the natural (hydrologic) (de Araújo and Medeiros, 2013) and social systems (Medeiros and Sivapalan, 2020). Over the course of approximately 100 years, the region has experienced a 1000-fold increase in storage capacity (Malveira et al., 2012). Ceará’s dense reservoir network (currently 1 reservoir per 7 km2) has recently been subjected to rigorous scrutiny by the hydrologic community through research that focused on understanding the impacts of such a strongly altered landscape on present-day drought propagation and mitigation (Ribeiro Neto et al., 2022), spurring a discussion of the positive and negative impacts of the development of such a dense reservoir network (de Araújo and Medeiros, 2013).
Detailed assessment of both the intended and unintended consequences of reservoir expansion within the Brazilian semi-arid, including both mitigation of water scarcity and possible aggravation of drought events, is of utmost importance for understanding the long-term outcomes of such hard infrastructure solutions and the implications for longer-term policy development (Ribeiro Neto et al., 2022). Of equal importance is the assessment of the hydrologic and socio-economic-political drivers that may have synergistically contributed to this phenomenon. Such drivers are still poorly understood and are also not explicitly accounted for in quantitative analysis of evolving reservoir networks over multiple decades (Di Baldassarre et al., 2018). Meira Neto et al. (2024) analyzed the hydrological impacts of the 100-year expansion in storage capacity within the 24,500 km2 Upper Jaguaribe Basin that lies within the Brazilian semi-arid region, and attempted to capture how water security may have evolved over time as a consequence, as a first attempt to shed light on the tight coevolution of humans and water that may have taken place over a century.
In this context, framing of the human-water dynamics is key to understanding and transferring the knowledge to set realistic scenarios on how humans interact with the hydrologic systems, enabling water managers to avoid unintended socio-hydrological consequences. The AAAQ (Availability, Accessibility, Acceptability, Quality) was proposed by the United Nations Committee on Economic, Social and Cultural Rights (CESCR) to express general principles into key indicators that track achievement of different facets of human rights. It has been used for health assessment (Jesus et al., 2017; Homer et al., 2018; Kendall et al., 2023), and in 2014 the Danish Institute For Human Rights developed an equivalent AAAQ framework as a tool for the assessment of the right to water (Jensen et al., 2014).
This paper aims to develop a conceptual understanding of how the search for water security may have unfolded in the form of the expansion of a dense reservoir network, which has evolved over time in the state of Ceará, in the Brazilian semi-arid. We use a combination of materials and methods including the analysis of newspaper articles, books and historical documents, 100 years of hydrological data, the outcomes of hydrological modeling, and satellite remote sensing. Our goal is to answer why and how such a dense network of reservoirs came to be constructed in the 75,000 km2 Jaguaribe River Basin, identifying patterns in its temporal dynamics over a century timescale, and analysing what natural and socio-economic factors may have contributed to the reservoir expansion. We approach this goal through a socio-hydrologic lens, aiming to generate transferable understanding of the coevolution of humans and water that underpinned the pursuit of water security within the Jaguaribe River Basin.
2 Materials and methods
Hereafter, we explore the means and motivations for the expansion of the water storage infrastructure in the Jaguaribe River Basin over 100 years by a combination of methods. These include (i) a quantitative summary of the evolution of the reservoir networks over time, (ii) quantitative measures of various facets of water security, including estimates produced through satellite remote sensing and application of a hydrological model, and (iii) historical records and narratives to enrich our understanding of the hydrological and socio-economic drivers and feedbacks behind the system evolution.
2.1 Study area
The semi-arid Jaguaribe River Basin (JRB) extends over an area of 75,000 km2, comprising approximately 50% of the Federal State of Ceará, in Brazil. It forms part of the Drought Polygon (DP), a densely inhabited dry area located in the Northeast portion of the country (Figure 1). The Drought Polygon is characterized by extremely variable precipitation in space and time, which normally varies between 450 and 900 mm annually, and high potential evaporation ranging from 2,000 to 2,600 mm per year, while the runoff coefficient is usually between 5 and 10% (Gaiser et al., 2003; Pinheiro et al., 2016), falling below 1% in some areas (de Figueiredo et al., 2016).
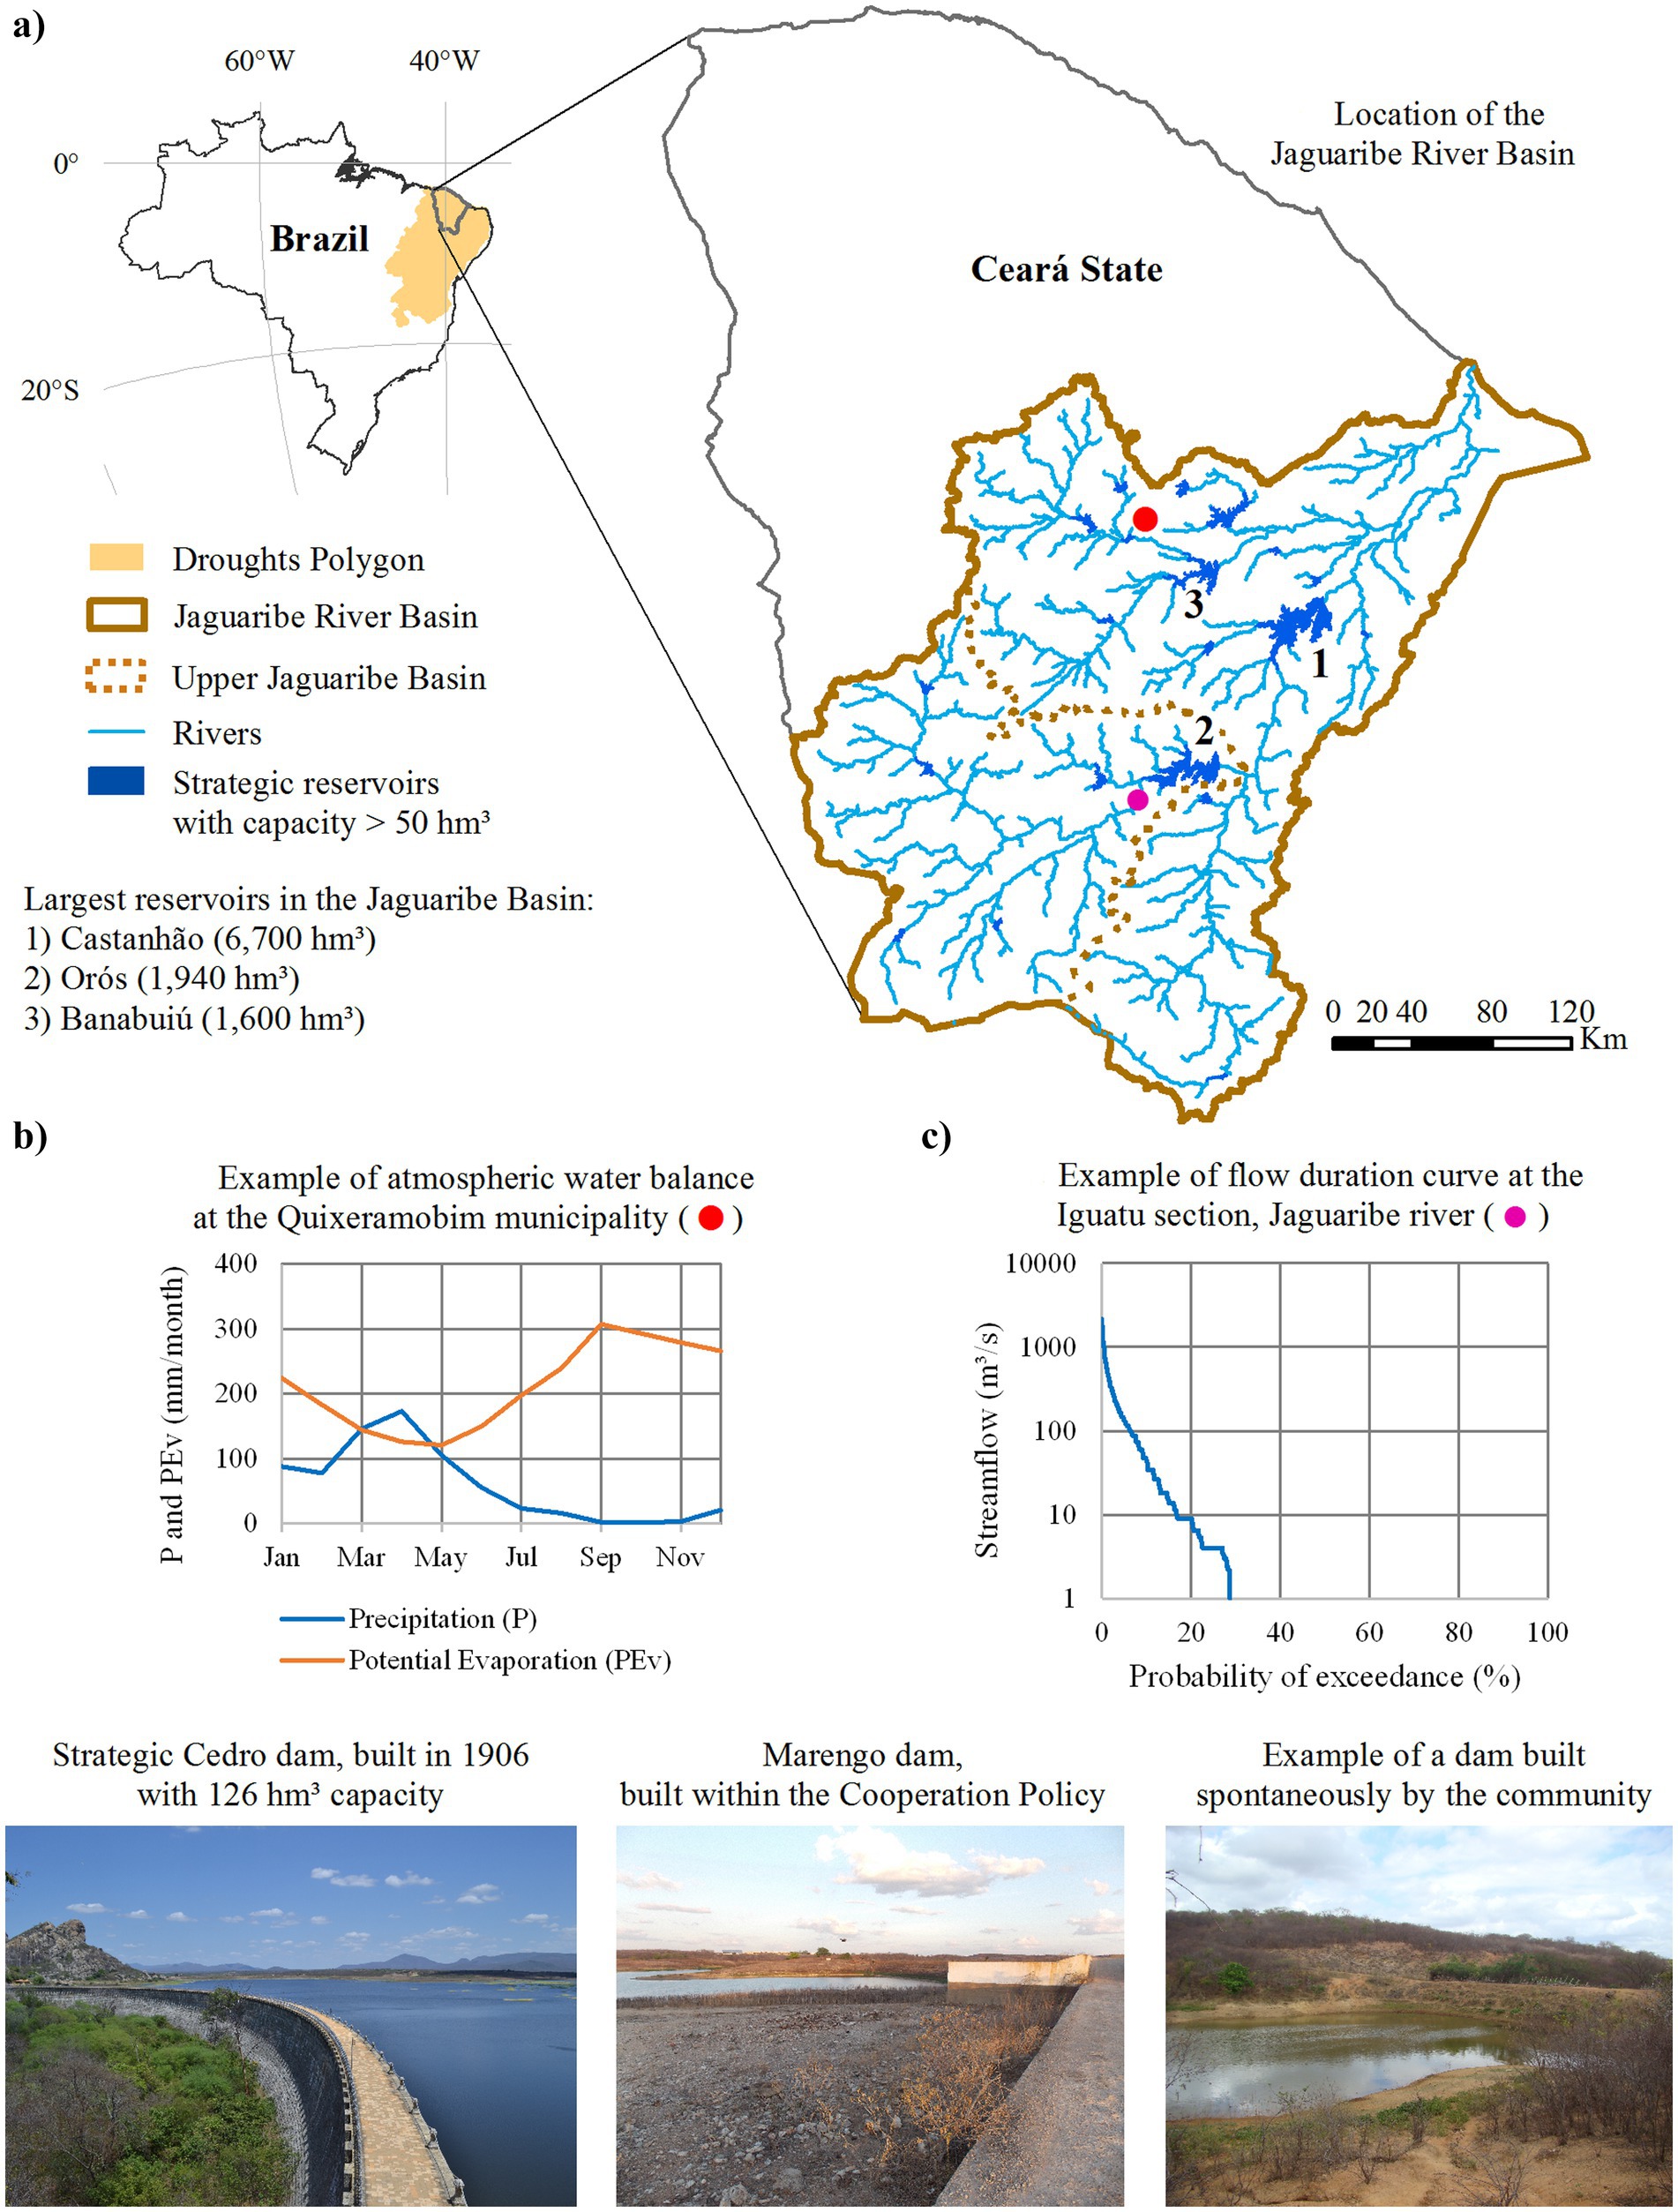
Figure 1. Jaguaribe River Basin, located in the Droughts Polygon, Brazil: (a) Location map; (b) mean-monthly values of precipitation (P) and potential evaporation (PEv) at the Quixeramobim municipality; (c) flow duration curve of the Jaguaribe River at the Iguatu site (20,700 km2 catchment area).
Specifically, in the JRB, average annual rainfall ranges from 500 mm to 900 mm, of which almost 95% occurs from January to June and roughly 50% of the total rainfall, for the period 2004–2009, occurred on 10% of the rainiest days (Alves et al., 2012; Medeiros and De Araújo, 2014). The basin is set predominantly on a crystalline complex (85% of the area) with some sedimentary areas (15%), in which lithosols, luvisols and ferralsols are mainly found, with shallow soils of up to 1 m. Another important feature of the region is the high intermittency of all rivers, including the Jaguaribe, where annual runoff varies from 5 to 120 mm, depending on the geology of the site (Peter et al., 2014; De Araújo and Bronstert, 2016).
The current population living within the JRB is approximately 2.6 million with an average annual income that is 1.7 times the minimum wage (i.e., R$ 2,400), with an average per capita GDP of US$ 2,536 (exchange rate US$ 1.00 is R$5.57) (IBGE, 2021). The average Human Development Index of the municipalities that make up the JRB is 0.62, ranging from 0.56 to 0.84 (IBGE, 2010). Johnson and Kemper (2005) state that JRB follows the same economic structure as the state of Ceará, in which the service sector represents a major share of the composition of the GDP, whereas agriculture is of great social importance for the livelihood of the rural and most vulnerable population. Family farming in the region consists predominantly of short cycle crops such as corn and beans, as well as goats, sheep and cattle livestock (Mesquita et al., 2016).
Water scarcity, especially during the recurrent droughts, has frequently been pointed out as a key hindrance to regional development (Medeiros and Sivapalan, 2020). However, some disagree with the idea that water unavailability is the sole factor to explain why the region remains underdeveloped: for example, Salinas et al. (2019) showed that a water-infrastructure megaproject, built in a critically dry area, had very limited impact in terms of income and development for the local population. Still, a hydraulic solution focused on the implementation of surface reservoirs by damming the network of intermittent rivers that drain the region has been used as the major measure to cope with droughts since the late 19th Century (Medeiros and Sivapalan, 2020). After the great drought of 1878–1879, the Federal government ordered the construction of the Cedro dam, the first major water project in Brazil, located within the JRB. Further on, the Inspectorate of Works Against Droughts (IOCS) was founded in 1909 and the Ceará State Drought Secretariat was created in 1932. Following those early initiatives, a very dense network of reservoirs (approximately 13,000 dams with areas larger than 1 ha) was established over the course of the 20th Century, which we explore in the next sections.
2.2 Storage capacity of reservoirs and dam construction types
Three main types of dams have been built in the JRB over time: (i) strategic dams, (ii) cooperation dams, and (iii) spontaneously built, small dams. Here we present their definition, in order to introduce how reservoir storage capacity was computed. Those definitions will later on be used to discuss relevant socio-hydrological feedbacks occurring at the JRB (Section 4).
The strategic dams are those serving relevant water demand centers such as cities, large irrigation areas and industrial zones, which were designed, built, and monitored by the public sector, therefore technical documentation is available. Cooperation dams, resulted from the collaboration between the public sector and landowners, and are also well documented. For those structures, storage capacity is known (Pinheiro, 2004). Small, non-strategic dams have also been built spontaneously by the rural population without proper documentation. Due to their large count (non-strategic reservoirs represent most of the existing structures), it was not feasible to characterize the entire reservoir network by field surveys. The storage capacity of these reservoirs was estimated using a remote sensing approach (Pereira et al., 2019), which consists of calculating the volumes of the reservoirs (Equation 1) based on geometric coefficients. The latter are estimated using lake geometry obtained by orbital remote sensing, namely the maximum flooded area and the maximum perimeter of the reservoir (Equations 2, 3).
In Equation 1, V is the estimated volume (m3), A is the area to which the volume is to be estimated (m2), and represent, respectively, the initial reference area (m2) and the volume (m3) stored at this level; is the morphological coefficient (nondimensional); and is the shape coefficient (nondimensional). The initial reference area was arbitrarily set at 5000 m2 based on the spatial resolution of the satellite images (90-m resolution, with 5,000 m2 representing 5 pixels) and was estimated at 2000 m3 according to average morphological conditions.
In the empirical Equations 2, 3, is the maximum flooded area (m2); is the perimeter of the maximum flooded area (m); D is the diameter of the reservoir (m), calculated as the ratio /π; and λ is / . The numerical values in these equations were calibrated by the authors using field data from 312 reservoirs, which resulted in a Mean Absolute Percentage Error—MAPE of 25% in their estimations.
We used the data available at the Global Surface Water Explorer (GSWE) database,1 whose image-processing methods are described by Pekel et al. (2016). The GSWE product used in this methodology is the Maximum Water Extent, i.e., the maximum surface area of a given reservoir that was observed between 1984 and 2021. The equations were applied to the almost 13,000 reservoirs detected in the Jaguaribe River Basin, with flooded areas larger than 1 ha.
2.3 Water availability and accessibility
Water availability within the JRB was calculated as the water yield from the reservoirs with 90% annual reliability (Q90): this is the criterion used by the State Water Resources Management Company (COGERH) to simulate water management scenarios and to make decisions on water withdrawal from the strategic reservoirs. With the data provided by COGERH for 37 strategic reservoirs, excluding the three largest (Castanhão, Orós and Banabuiu) whose hydrological efficiency differs from the average, we established a regression between Q90 and reservoir capacity (Figure 2), and then used it to estimate water yield for the non-strategic reservoirs.
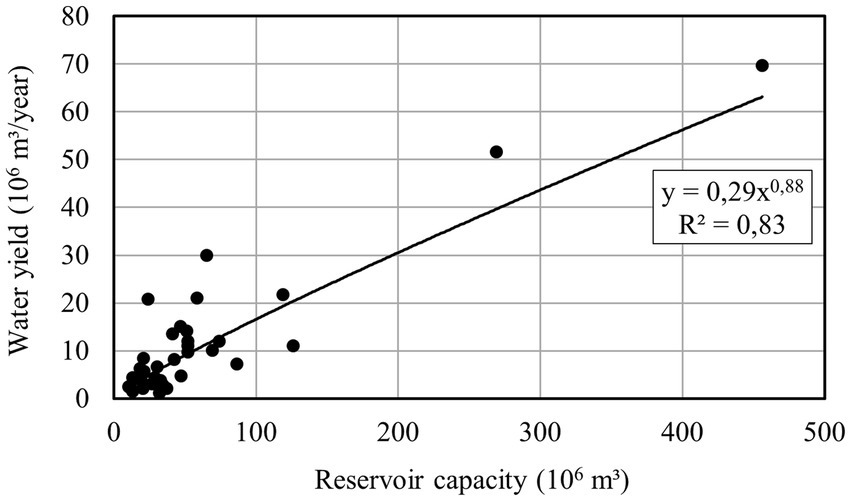
Figure 2. Water yield with 90% reliability versus storage capacity of strategic reservoirs in the Jaguaribe River Basin.
Based on the estimations of water availability obtained in the previous step, the per capita water availability was calculated based on the population size between 1900 and 2020. To assess the evolution of water availability at the JRB, we used the water stress indicator (Table 1) proposed by Falkenmark (1989), expressed as the ratio between the accumulated Q90 and the population of a given year.
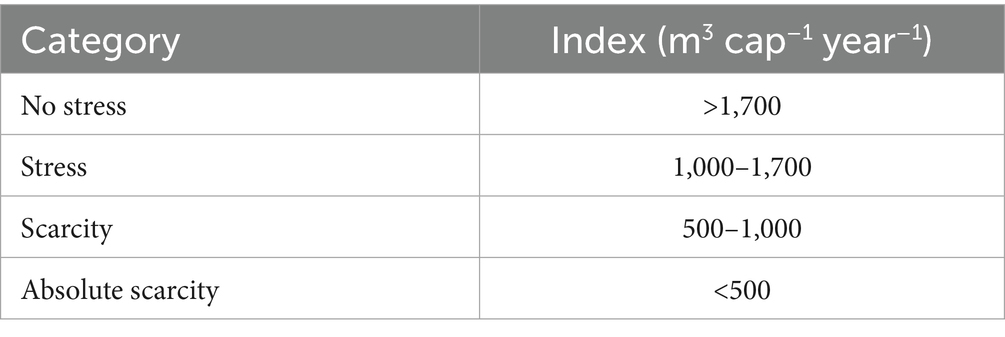
Table 1. Water stress index (Falkenmark, 1989), calculated as the ratio between water availability with 90% annual reliability (Q90) and population.
Accessibility to water sources was assessed by calculating the distance from all points in the basin, displayed in a 1-km resolution raster, to the nearest reservoir, taking into account the strategic structures and those built in a public-private cooperation regime. Location and date of implementation of the strategic reservoirs were provided by COGERH, whereas the information of the cooperation reservoirs was derived from Pinheiro (2004). The distance from any point in the basin to the nearest water resource was calculated on a decadal basis between 1900 and 2020.
2.4 Met water demand
Met water demand is hereafter defined as the fraction of water demand that can be met by the system of reservoirs. Flow generation was estimated using the modified HYMOD model (Moore, 1985), a spatially concentrated, conceptual rainfall-runoff model that uses daily input data of precipitation and potential evapotranspiration, generating estimates of streamflow and actual evapotranspiration.
The streamflow is partitioned in the reservoir network using the Reservoir System Model (RSM), which divides the reservoirs into groups based on their volumes. Meira Neto et al. (2024) suggested the following classification of the reservoirs: Class 1 (0.0–0.1 million m3); Class 2 (0.1–0.5 million m3); Class 3 (0.5–1.0 million m3); Class 4 (1.0–20.0 million m3); Class 5 (20.0 million m3 - largest reservoir in the basin) and Class 6 (the largest reservoir within the basin). The model calculates the water balance for each reservoir class, considering a single representative, in which the local flows (evaporation and withdrawals) are estimated together with the state variables (local volume and water levels). The adoption of a representative reservoir per class is due to the large number of reservoirs in the network, over 10,000 structures, and lack of data for the small ones not monitored by the state water agency. This approach, proposed by Güntner et al. (2004), has been successfully tested in the study region for other catchments and at different scales (Krol et al., 2011; Mamede et al., 2018; Lima et al., 2023; Meira Neto et al., 2024). Figure 3 presents a schematic representation of the combined HYMOD-RSM model.
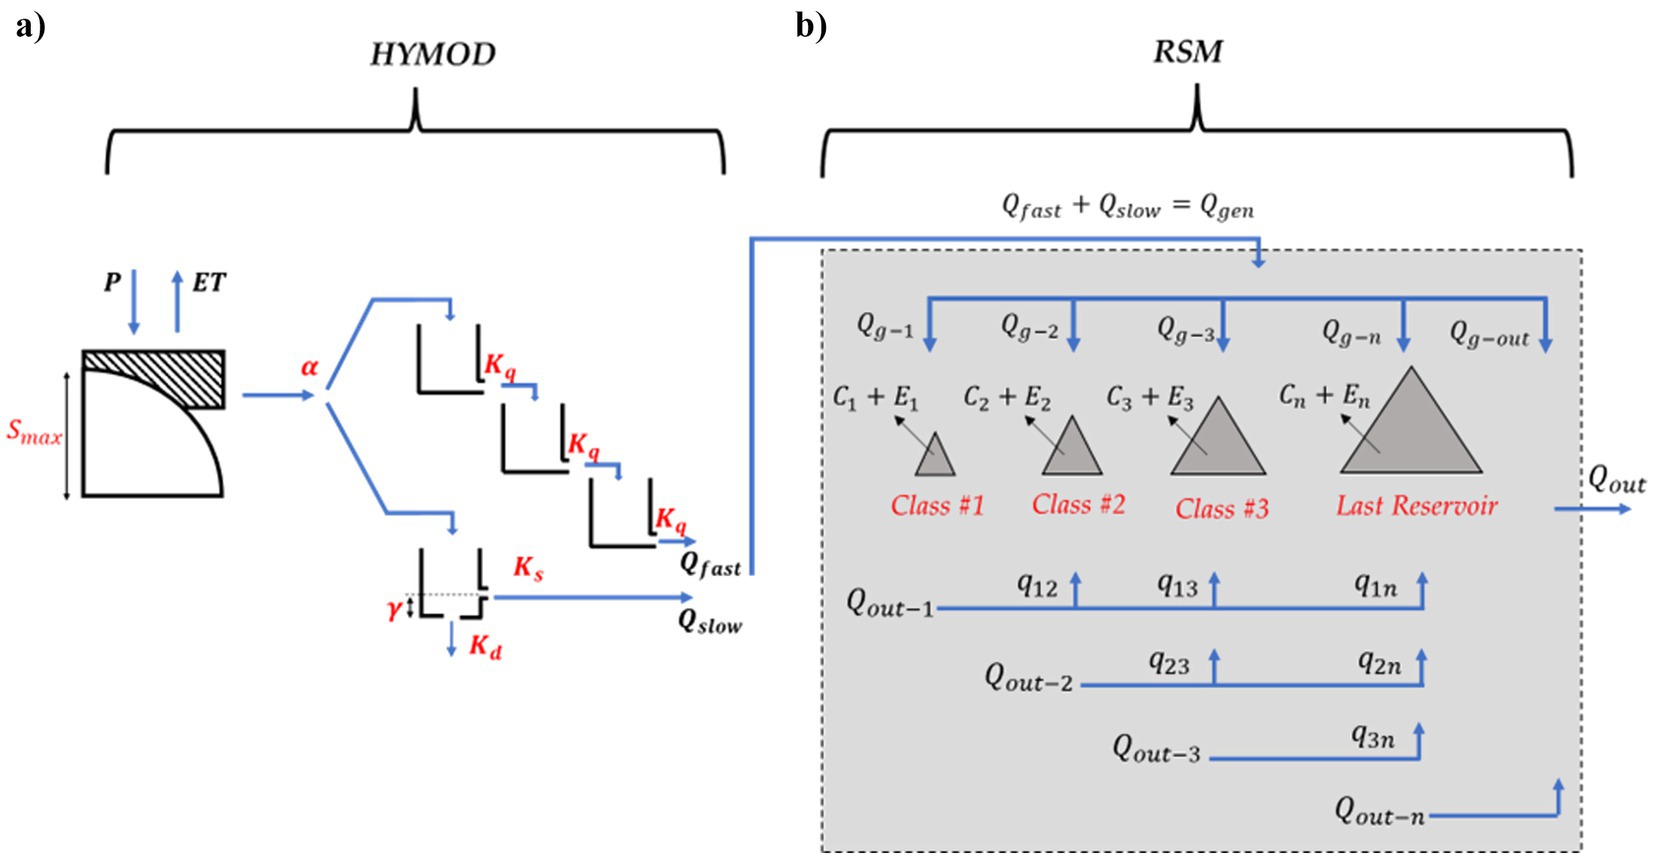
Figure 3. Modeling approach developed by Meira Neto et al. (2024): (a) streamflow generation using HYMOD; (b) schematic representation of the reservoir system model (RSM).
To estimate the water demand, the model takes into account rural ( , urban ( , irrigation ( , and industrial required discharges ( ). The monthly unmet demand for each class of reservoir is used to assess the frequency of failures. This approach was applied to the Upper Jaguaribe River Basin as representative of the entire system (Figure 1).
2.5 Water pollution index
As for water security, a water pollution index (Iwp) was estimated for the Upper Jaguaribe Basin, defined as the ratio of the annual volume of water potentially polluted to the volume of runoff. The index is a combination of two fractions of pollution - sewage and agricultural runoff - and was estimated for the period 1920–2020. Sewage production was calculated as the product of the population by the average per capita water consumption (assumed as 100 L.cap−1.day−1) and by a fraction (0.8) for sewage generation from clean water supply. Population data was obtained from official census reports and interpolated for the years when a census had not been carried out. The yearly volume of sewage was then divided into three fractions: (i) collected and treated; (ii) collected and untreated; (iii) uncollected. The fractions of collected and treated sewage were obtained from the Brazilian National Sanitation Information System (SNIS) for the municipalities located in the UJB.
Only the shares of the collected and untreated (Vcol-unt) and the uncollected (Vunc) sewage were admitted as harmful, with the potential for polluting the runoff and the water accumulated in the reservoir system. The volume of sewage that is collected but not treated was fully considered as potentially polluted. The portion of sewage that is not collected was admitted as being released directly into the environment without any treatment. However, some assimilation by the environment is possible, e.g., the sewage disposed of in septic tanks, therefore a fraction of 0.5 of the sewage pollution not assimilated by the environment and potentially polluting (fsew,pot-pol), was admitted. The volume of sewage with the potential to pollute the water resources (Wps, m3) was calculated as the sum of the collected and untreated sewage and the uncollected share (Equation 4).
Water potentially polluted by agriculture was computed as the sum of the runoff volumes in irrigation projects and in rainfed agricultural fields. Information on the extension of public irrigated perimeters (Aip, m2) was retrieved from official records, whereas the diffuse rainfed agricultural areas (Arf, m2) were estimated as the product of population by a per capita cultivated area of 0.32 ha per capita. Runoff (Qgen, m3.year−1) was simulated for the UJB using the HYMOD+RSM model (Meira Neto et al., 2024), and the volume of water potentially polluted by agriculture (Wpa, m3) was then calculated using Equation 5, where AUJB is the area of the Upper Jaguaribe Basin (m2).
The pollution index is calculated yearly by Equation 6.
2.6 Historical data and narratives
The focus of historical data used in this research was on the occurrence of droughts, the creation of concentration camps to assemble together the droughts’ migrants, and the establishment of the dam policy. The term “concentration camps” was firstly used in 1916 by the state governor in a message to the Legislative Assembly:
“In this capital, the plagued were housed, at first in the Public Promenade, while there were no more than 3,000, but it soon rose so quickly that it was necessary to remove them and locate them in a vast land in Alagadiço, fenced off, well wooded, which took the name of Concentration Camp” (Liberato Barroso, 1916)” *Free translation.
However, in order to avoid any theoretical confusion with the term used decades later for concentration camps used in Europe, we will hereafter adopt the term “drought camps” when referring to the event in the state of Ceará.
Historical data presented in newspapers and official documents were surveyed in the Brazilian Digital Library.2 In the search we used keywords related to the occurrence of droughts and their impact on society, as well as information obtained from technical reports on the drought camps and the construction of dams, including the number of dams built per year, their respective storage capacities, the value of the awards provided for those that built dams in their own lands and other technical data.
Books were also an important source of information in this stage of the research, regarding: drought occurrence (Alves, 2003; SUDENE, 1981; Guerra, 1981); drought camps (Liberato Barroso, 1916; Rios, 2014; Alves, 2023); and construction of dams in cooperation (Pinheiro, 2004).
3 Results
The results section is divided into 2 parts. In section 3.1 we provide an overview of key quantitative variables and their changes over the 100-year study period, following the methods outlined in sections 2.2–2.5. Here, we provide a highlight of the temporal patterns to generate a data-driven summary of the system’s evolution. This initial synthesis was then confronted with historical reports (see section 2.6) outlining important social and institutional changes, which allowed us to categorize the study period into distinct time-periods, which are presented in section 3.2.
3.1 Temporal dynamics of system variables
The panel shown in Figure 4 summarizes some key variables over the course of the last century for the JRB. Population size in the JRB in the early 1900’s was in the order of 300,000 and grew at increasing rates throughout the 20th Century (Figure 4a). By 1970 the population of the JRB had reached approximately 1,500,000, including an intensification of rural–urban migration. The 1991 demographic census indicated a population of 1,850,000, and currently (circa 2024) over 2.5 million people live in the area. Figure 4b shows how the Falkenmark water stress indicator varied over the study period, changing from a period of absolute scarcity that was present before the 1900’s and lasted until the 1960’s, followed by a scarcity period from the 1960’s to the 2000’s, which then gave rise to a period that was mostly in the water stress range. The transition between water stress levels is associated with the expansion of surface water storage capacity, where the large changes can be attributed to the construction of large dams such as the Orós (1,940 million m3 storage capacity) in 1960, Banabuiú (1,600 million m3) in 1966 and Castanhão (6,700 million m3) in 2002.
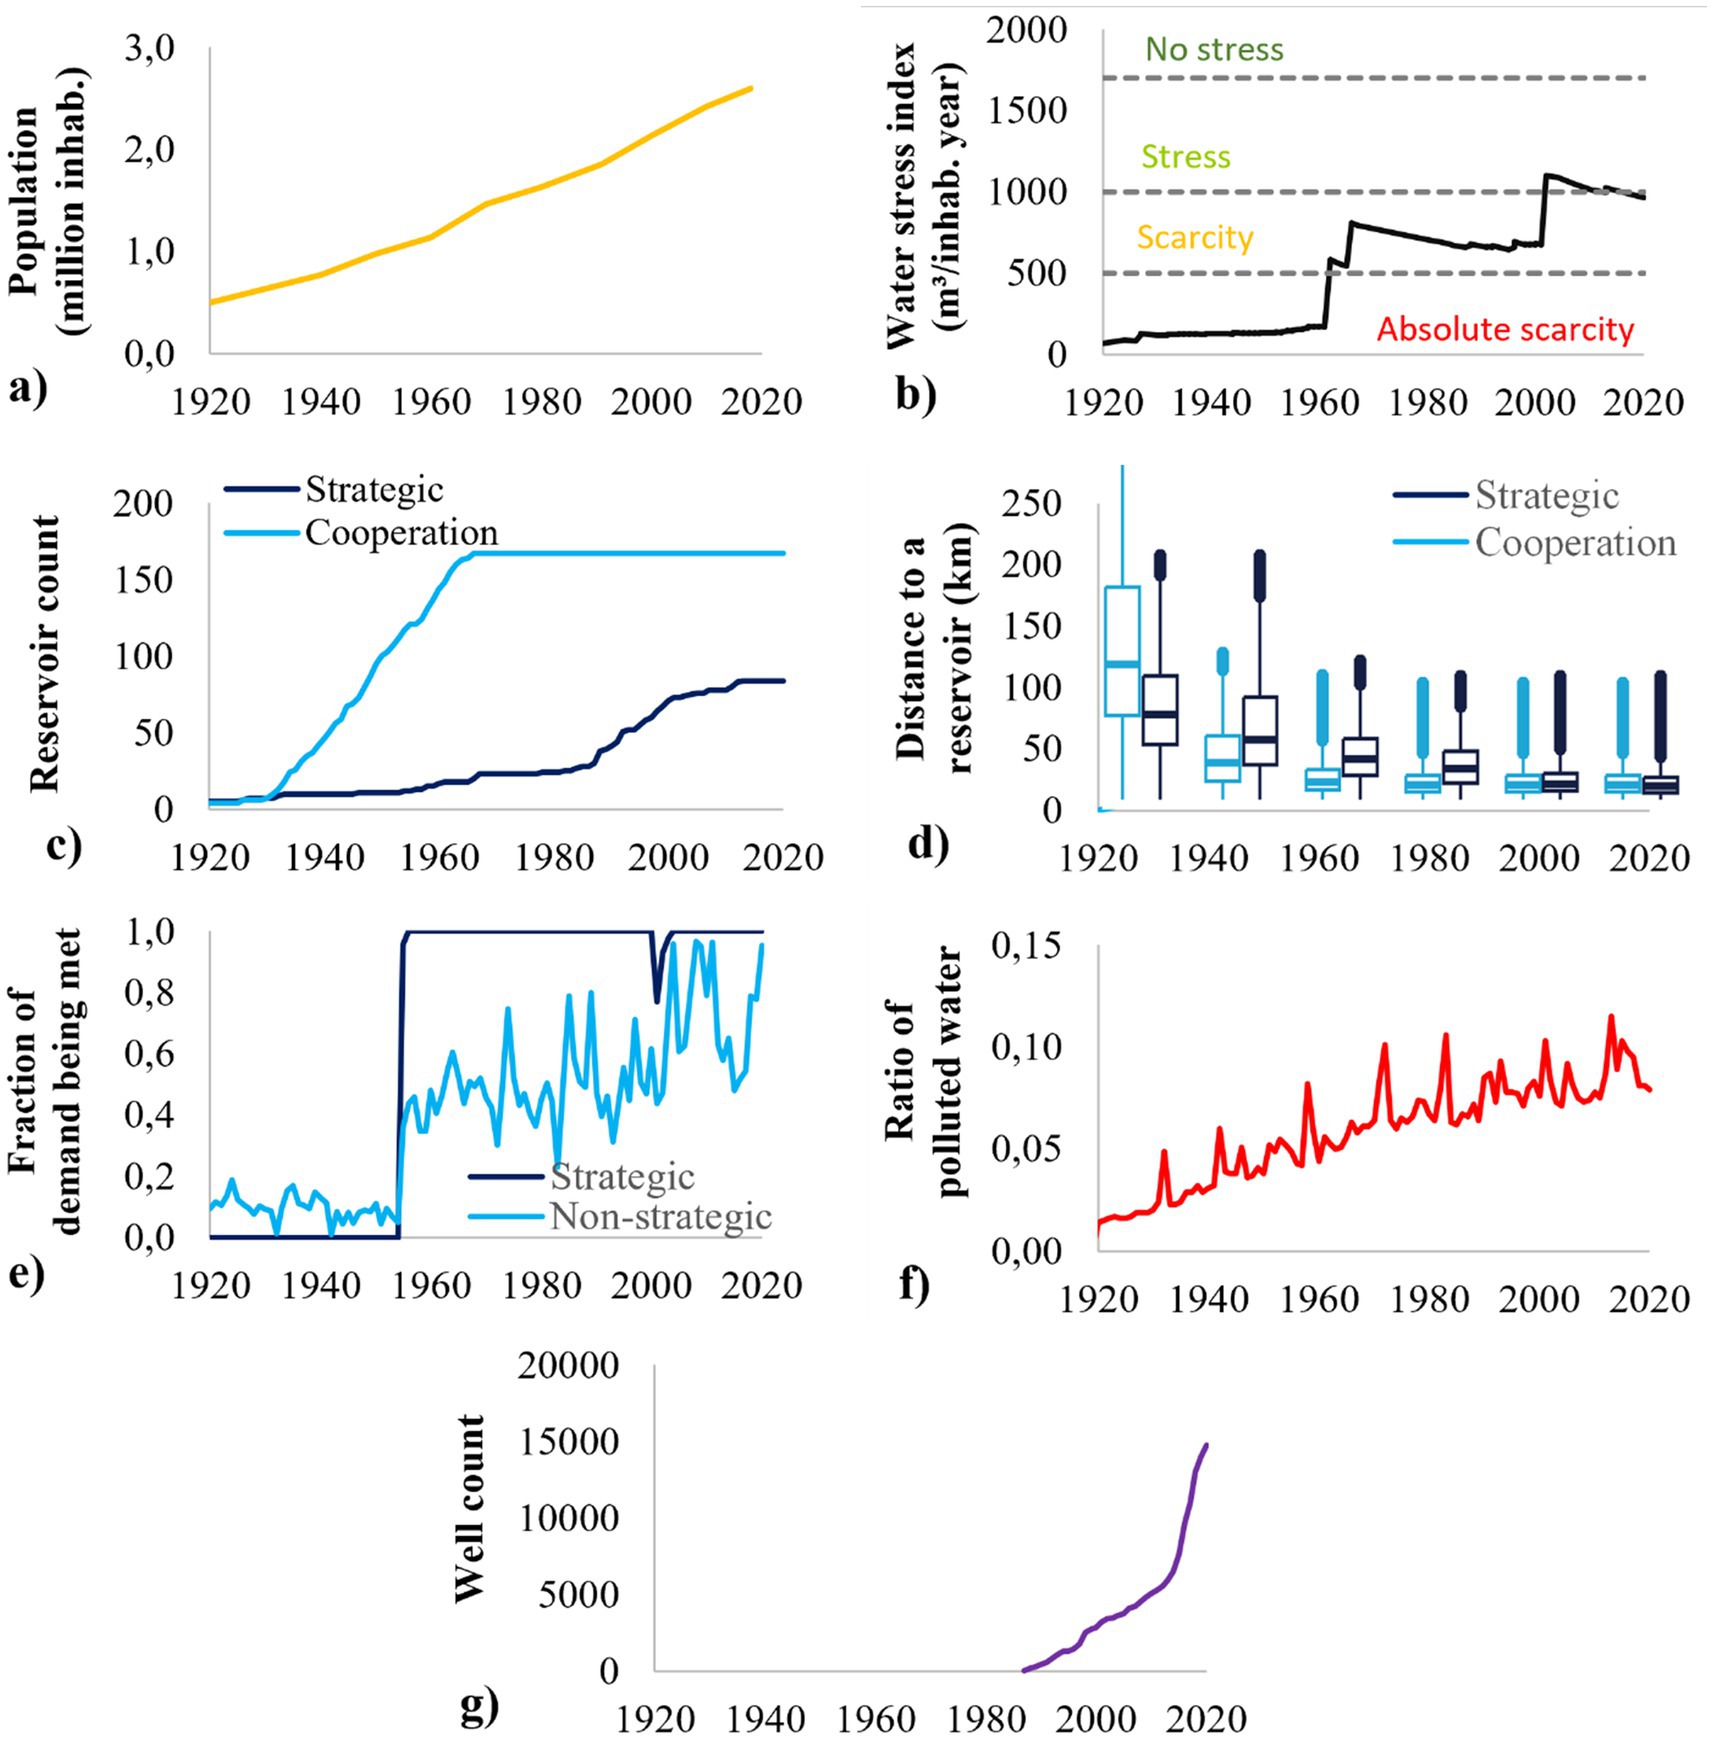
Figure 4. Dynamics of the human-water system in the Jaguaribe River Basin: (a) population; (b) water stress index; (c) reservoir count; (d) distance to the nearest reservoir; (e) fraction of the water demand being met by the reservoirs; (f) ratio of polluted water; (g) well count.
Although the construction of large dams explains much of the basin scale changes in water stress, many more dams were built throughout the study period, and the mode in which those dams were built and managed are an important aspect of the evolution of the JRB. A first look into this matter is presented in Figure 4c, showing the rate of construction of strategic and cooperation dams (See 3.1 for their definition). It is possible to see how cooperation dams were built mainly between 1930 and 1960, while strategic dams were built throughout the whole study period, with a somewhat constant rate between 1920 and 1990, a sharp increase between 1990 and 2000 and decreasing rates since then. A natural consequence of the construction of reservoirs can be captured by the change in distance from any point within the JRB to the nearest reservoir, shown in Figure 4d, where the distances to both strategic and cooperative dams are depicted.
The system’s evolution differed within its various types of reservoirs with respect to their capacity to provide water with high reliability. Figure 4e shows the evolution of the fraction of water demand being met by the strategic reservoirs (usually the larger ones) as compared to the non-strategic reservoirs (including the cooperation ones). It is possible to see how the average met water demand at small dams are lower over time, with the strategic dams achieving higher levels of met water demand earlier in time (predominantly after the 1960’s).
Our estimate of how water quality has evolved over time at the JRB is shown in Figure 4f. It is possible to see a steady increase in the polluted water ratio, with marked variability as sudden increases, associated with very dry years, as the index is inversely proportional to average streamflow. In 1930, it is estimated that the sewage generation was of the order of 3.9 million m3.year−1, reaching 13.0 million m3.year−1 in 1970 and 16.7 million m3.year−1 in 2020. In this same period, the volume of treated sewage increased from 5% to almost 85% of the collected fraction. On the other hand, agriculture (both irrigated and rainfed family farming) has continuously increased during the study period, following the growth of population and water availability. Consequently, the polluted water index (i.e., the ratio of potentially polluted water produced annually to the annual runoff volume) has risen from roughly 0.01 in 1920 to values fluctuating around 0.1 in the 2010’s.
Lastly, the time series of the number of wells drilled by the state government over time shows how well construction started in the 1980’s, at a rate that is somehow kept constant until around 2010’s, where a sharp increase is noted: more than 50% of the wells by the Ceará Water Resources Secretariat were drilled between 2015 and 2020, in conformity with the Drought Coexistence Plan, presented by the State government in February 2015 (SOHIDRA, 2021). This change in the rate of well construction is likely a response to the long-lasting drought from 2012 to 2017, which reduced the storage in surface reservoirs to nearly 6% of its capacity in the JRB.
3.2 Identifying distinct periods of the system’s coevolution
In this section we present a classification of different periods within the 100 years of dam expansion within the JRB by analyzing the changes in the coupled human-water system. The result of the classification of human-water coevolution at the JRB is presented in Table 2, where four distinct periods are summarized.
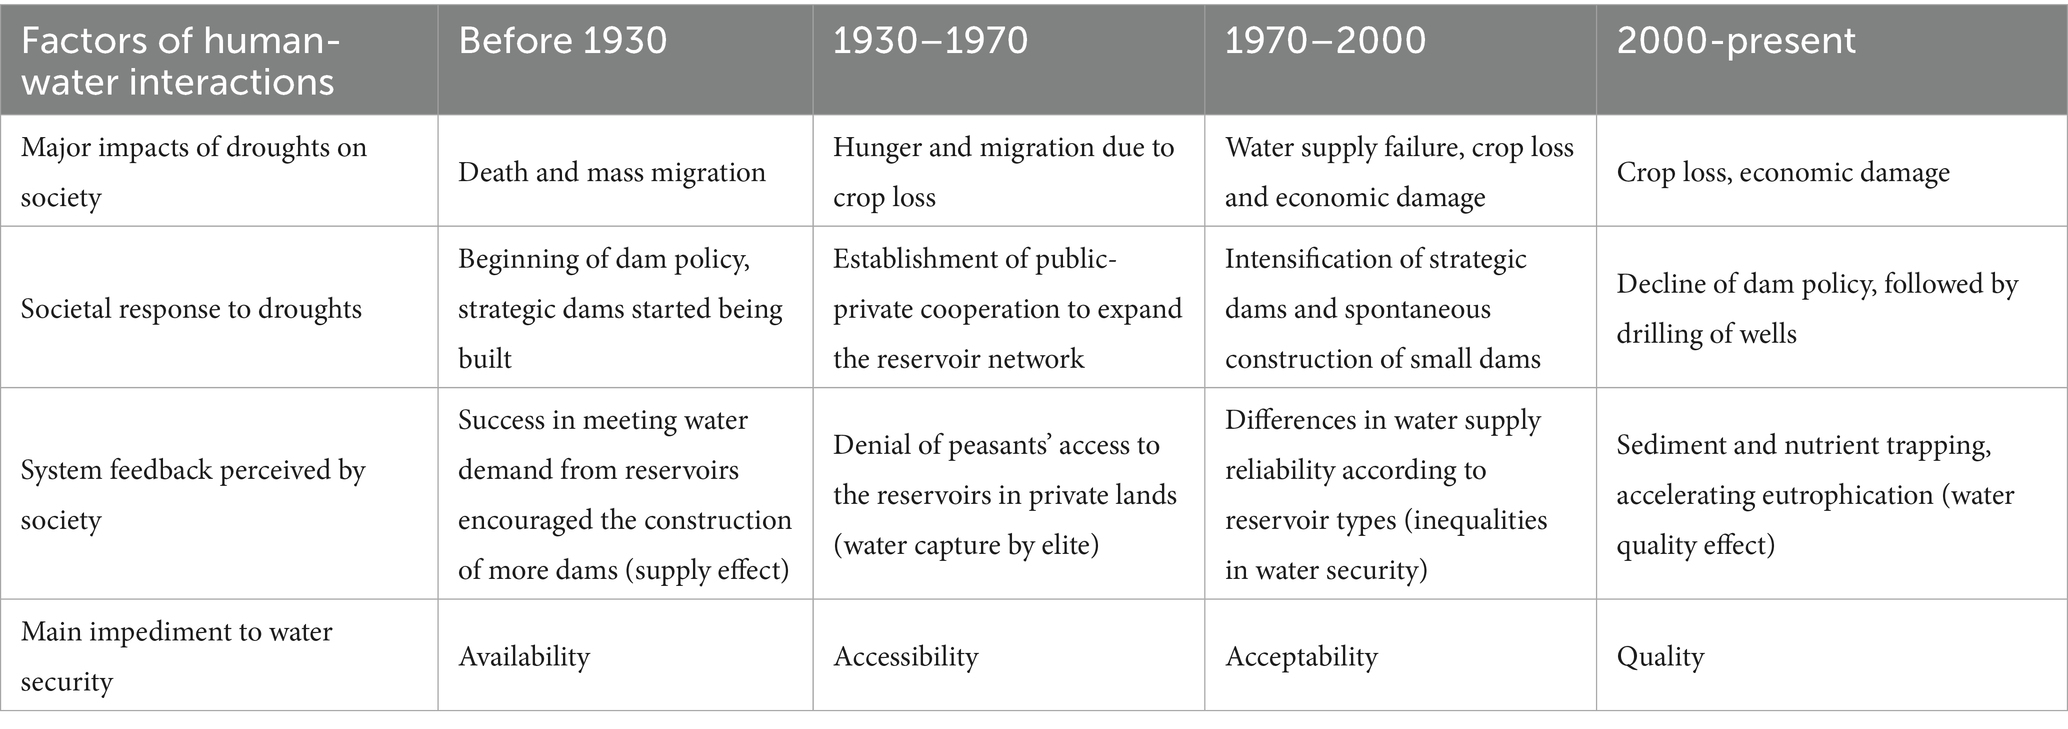
Table 2. Summary of the 4 distinct periods of human-water coevolution in the Jaguaribe River basin.
The choice for defining each period was based on how four different factors behaved distinctly within the time-period studied, namely (i) the impacts of droughts on society, i.e., the different ways droughts’ negative outcomes have been observed; (ii) the main ways humans responded to droughts by constructing different types of dams collectively or individually; (iii) the feedbacks of the system and their respective unintended consequences; and (iv) the main limitations for water security to be met over time.
To define the periods and identify the main factors of human-water interactions, we explored the hydrology-related variables shown in Section 3.1 through a socioeconomic and political lens, resulting from the assessment of: (i) official documents, news articles and literature describing the impacts of droughts; (ii) technical reports and implementation of policy regarding dam construction; (iii) scientific documentation and interpretation about system feedback; (iv) data on water quantity and quality that could be provided by the reservoir network over time. Table 2 guides the reading of the next sub-sections, where we explore in more detail each of the four periods and their characteristics.
3.2.1 Period before 1930’s: calamity, mass migration and initiation of the dam policy
The period before 1930 was characterized by total vulnerability to droughts, with no substantial measures by individuals or the government to deal with water scarcity. Investments in water infrastructure were still incipient, and public policies were proposed by the Federal Inspectorate of Works Against Droughts (IFOCS), created in 1906.
Since colonial times, between the 16th and the 19th centuries, droughts in the northeast portion of Brazil were associated with severe impacts on local population, with extensive documentation on famine and deaths (Pereira et al., 2025). Two notable examples are the “The Great Drought,” that hit the region between the years 1877 and 1879, causing the death of almost half a million people in the Brazilian semi-arid region (the Droughts Polygon in Figure 1). Likewise, the 1915 Drought was responsible for the death of almost 30,000 people (Pompeu Sobrinho, 2019) and the loss of 1.5 million cattle (SUDENE, 1981) in the State of Ceará. In both cases, droughts were followed by massive migratory waves. During the Great Drought, approximately 35,000 people migrated from Ceará to Amazonas via the ports of Fortaleza and Aracati (in the outlet of the JRB) (Villa, 2000). In March 1879 alone, more than 6,000 migrants tried the same path. In 1915, 70,000 people left the State of Ceará (SUDENE, 1981; de Lima and Magalhães, 2018). Many of those affected by drought moved to the state capital Fortaleza, living on its streets, and later being gathered in what was then named “drought concentration camps,” as described by the state governor in a message to the Legislative Assembly in 1916. In the same message, he stated that the financial difficulties in meeting the needs of the hungry people forced him, against his will, to expatriate them to the ports of the north and south of the republic. The photos in Figure 5 illustrate the dramatic consequences of the droughts during Era 1: people starving to death on the banks of the railway line during the 1915 drought in Ceará and a typical family suffering the effects of the drought.
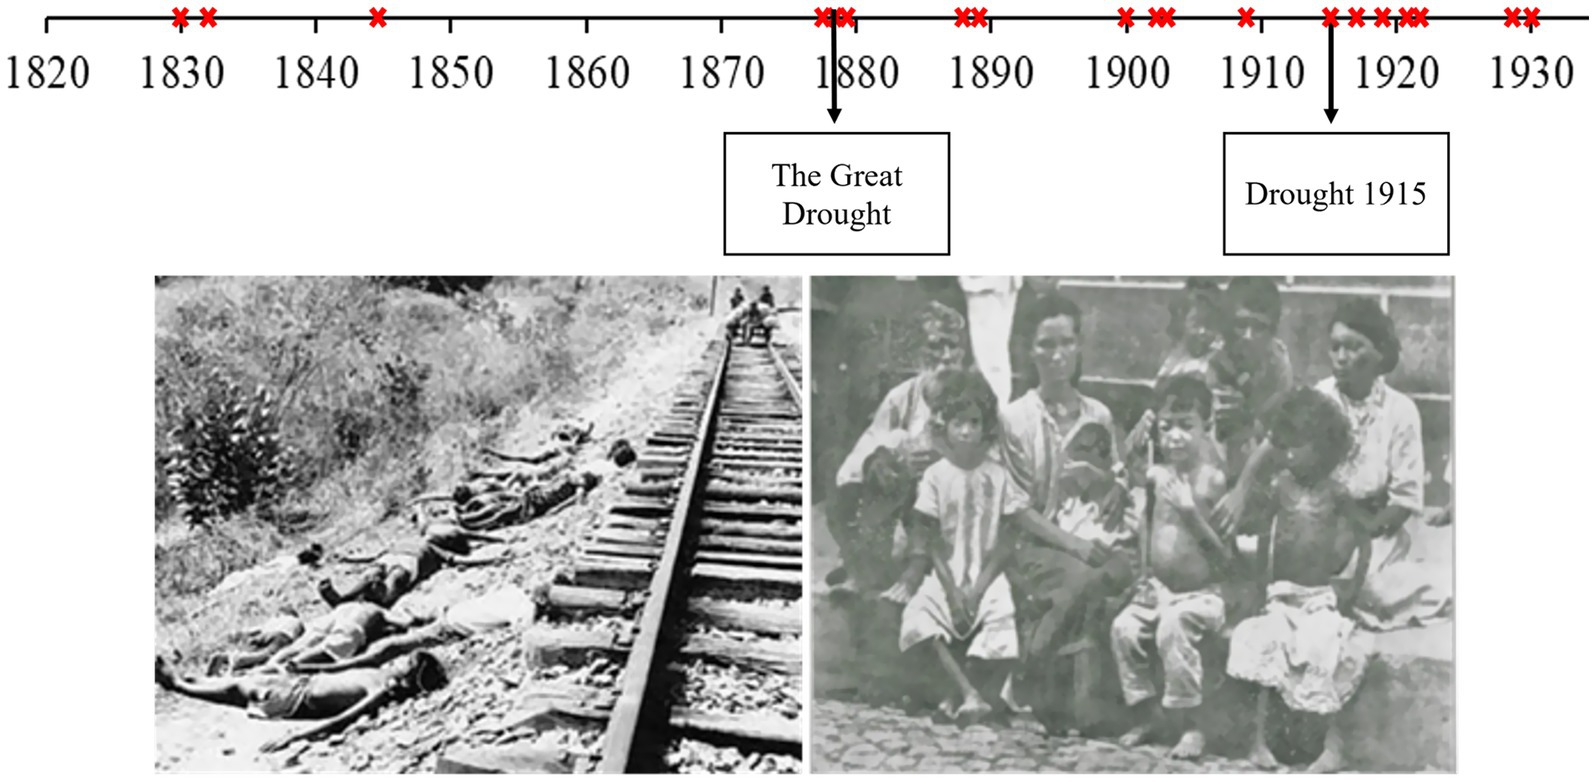
Figure 5. Drought occurrence (timeline with indication of droughts by red markers) and consequences (photos of death and famine in the 1915 Drought) during the period before 1930. Sources of the photos: Joaquim Nabuco Foundation (left) and Brazilian National Archives (right).
In the 19th Century, given the chaotic context faced by local population, several decisions were taken by government officials to enhance water availability. In 1832, the Ceará Provincial Council started awarding prizes to anyone who built a dam (Molle and Cardier, 1992). In an article signed in 1835 but published in memoriam, De Alencar (1889) stated that the prizes awarded for dam construction were not attractive enough, and proposed a more radical stance that should include doubling the award prize and enforcing dam construction in farmers’ lands.
3.2.2 Period 1930–1970: reservoir system’s expansion and the drought industry
The second period represents a phase in which dam construction began to be widely adopted in the JRB, a process that followed two main modalities: dams built by (i) government-led initiatives, mostly concentrated in large reservoirs, known as strategic dams, and (ii) by public-private partnerships known as cooperation dams (Pinheiro, 2004). The cooperation was established between the Federal Inspectorate for Works Against Droughts (IFOCS, transforming into the National Department of Works Against Droughts—DNOCS in 1945) and landowners, with the former providing the funds to build the dams and the latter committing to build access roads and allow the general public to have access to the water.
Absolute water scarcity still prevailed during most of this period (Figure 4b), and population evolved from approximately 771,000 inhabitants in 1940 to over 1,460,000 at the end of the period. A major drought occurred in 1932 and the use of drought camps was once again employed (Rios, 2014). That year, a total of seven camps were set up across the state, along the railways that connected the drier areas in the hinterlands with the state capital located on the coast (Rios, 2014; Alves, 2023). The 1932 drought led the government to intensify the policy of damming, and a total of 16 strategic reservoirs were built in this period, along with 160 cooperation dams adding a storage capacity of 391 million m3 and 3,765 million m3 to the system, respectively. As a consequence, a substantial reduction of the distances to the nearest water source occurred (Figure 6), which could have enhanced the access to water. In the early 1930’s, most areas were more than 50 km away from a water source, whereas in 1970, this distance was reduced to <25 km in almost the entire basin.
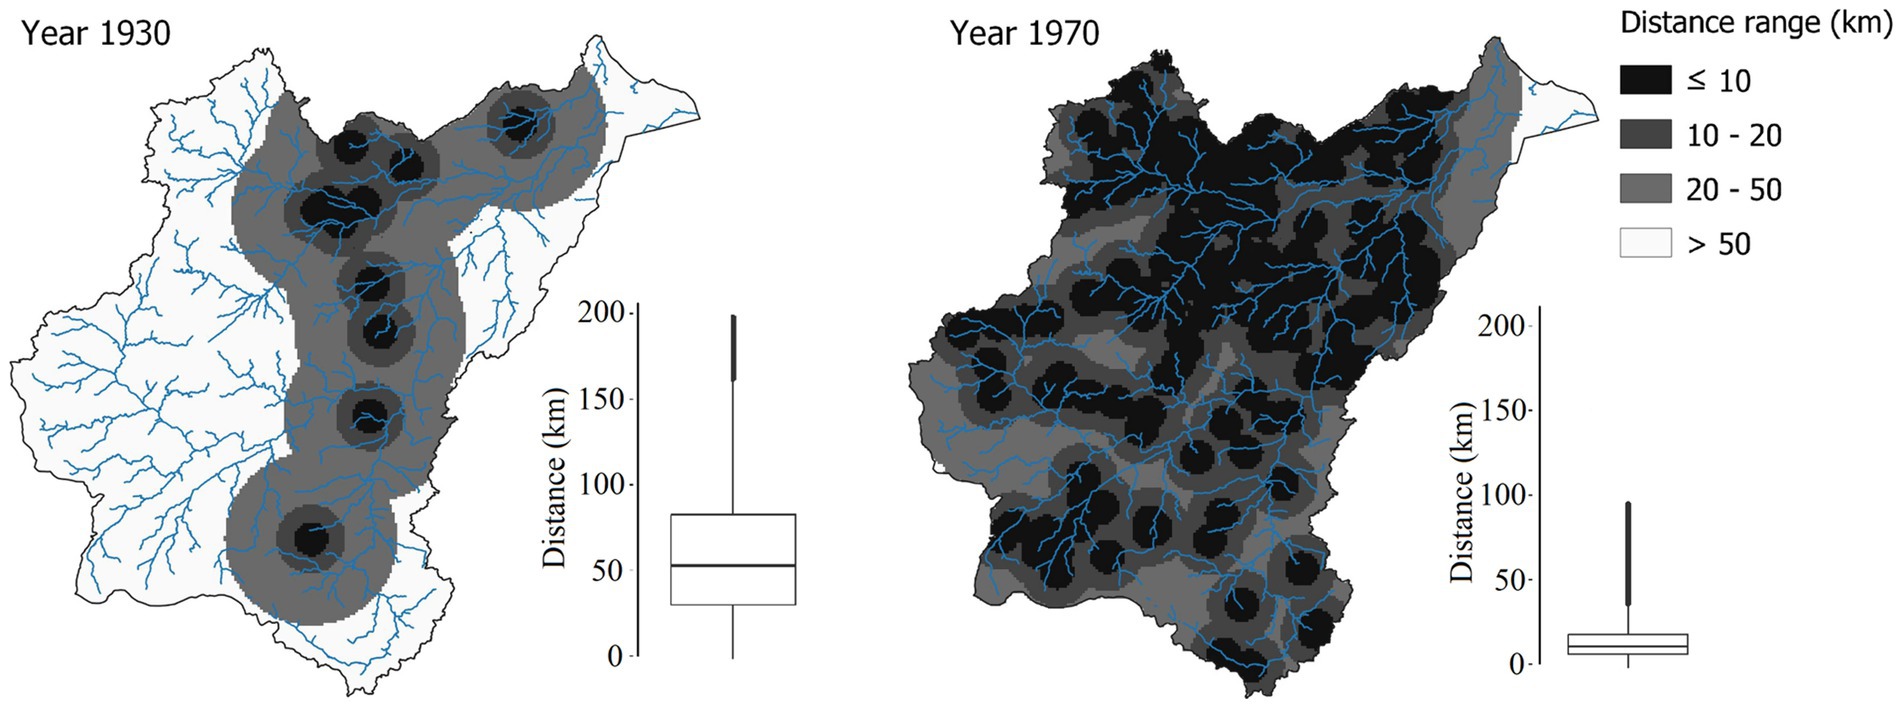
Figure 6. Distances to the nearest reservoir at the onset (1930) and end (1970) of period 2.
In spite of the dam expansion, water access issues emerged during this period, giving rise to the phenomenon known as the “Drought Industry” (Campos, 2015): while the cooperation dam model would ideally allow more public dams to be built and expand water access throughout the JRB, landowners would rarely build access roads, or opened their gates to the population (Pinheiro, 2004). In this way, access to water was subject to private interests and used as tools to, for example, guarantee political support during election periods to favor candidates representing dam owners. Another important practice integral to the functioning of the Drought Industry was the use of the “Emergency Policy” (Fischer and Albuquerque, 2002): during extreme droughts, municipalities would receive federal funds for dam construction. Dam owners, who happened to be part of oligarchies running city councils and occupying relevant political positions, would then withhold payment to dam workers in exchange of political loyalty (Smith, 1879; Campos, 2015).
Access restriction to water resources and other Drought Industry practices led local populations to start building their own dams. This measure was carried out spontaneously and without proper technical assistance, which demonstrates the empirical hydrologic knowledge of the population. For example, the small Boqueirão Reservoir (60.103 m3) was built in 1934 in a basin with very peculiar hydrologic behavior: its runoff coefficient is five times lower than that of the average small basins of the region (de Figueiredo et al., 2016). Seventy-five years after its construction, its sizing was validated by updated scientific criteria (De Araújo and Piedra, 2009). Although it is difficult to determine a precise year in which this practice started, this process is known to have happened for a long period of time within the JRB as Boqueirão example.
The period 1930–1970 in the JRB is a clear example of the hydro-social cycle described by Swyngedouw (2009), who stated that access to water is shaped by three factors: geographical conditions, technical choices and political-legal arrangements. According to the author, inequalities arise from the interaction between these factors, which in the case of JRB resulted from water scarcity (geography), combined with the sole measure of river damming (technology) and the application of public funds in private properties (politics). Boelens (2014) argued that hydrological systems are natural and social constructions, as connections of human and non-human elements that shape water control, define water rights and produce such hydro-social cycles.
3.2.3 Period 1970–2000: enhancement of water security and its inequalities
The period between the 1970’s and the 2000’s was marked by the continuation of public investments in reservoir construction, alongside with the proliferation of small dams built by local communities. During this period, an additional 40 strategic reservoirs were built in the JRB, adding a storage capacity of 1,604 million m3 to the system. Throughout this period, the Falkenmark index was consolidated at “Scarcity” and the population of the JRB grew from 1,460,000 in 1970 to 2,130,000 in the year 2000.
By the end of the 1960’s, the policy of cooperation dams was discontinued, as criticism emerged on its political use (Bezerra, 1996; Pinheiro, 2004). Later, in 1997, new water legislation was promulgated (Federal Water Resources Law 9,433, 1997), defining water as a public resource, i.e., a person might own the dam but not the stored water. Since the passing of the Federal Water Resources Law, landowners were prohibited from preventing people from accessing the reservoirs, thus improving the accessibility to water, although this malpractice still occurs to some extent.
Although playing an important role in providing access to water in many locations, we argue that non-strategic and spontaneously built dams have acted primarily as a water distribution infrastructure (Nascimento et al., 2019) for most of the population at remote locations: the low storage capacities of most small non-strategic reservoirs, associated with the high potential evaporation rates would make the former structures unreliable, given the frequency in which they would dry out. Figure 7 shows the ratio of the water demand being met over time by reservoir capacity in the Upper Jaguaribe Basin, applying the HYMOD+RSM model used in Meira Neto et al. (2024). During this period, strategic reservoirs with storage capacity higher than 20 million m3 are able to fully meet the associated demands, whereas small reservoirs with storage capacities below 1 million m3 can attend 30–60% of the demands.
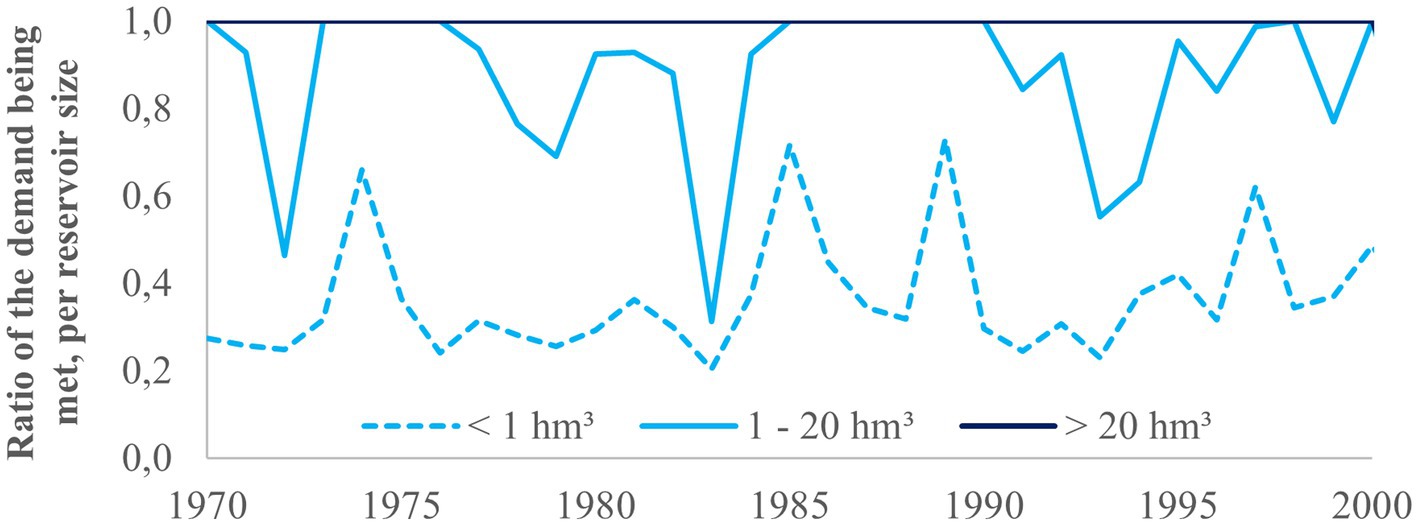
Figure 7. Ratio of the water demand being met over time, according to reservoir sizes, during Period 3.
Thus, for this period, we suggest a transition in the JRB from a state where access issues prevailed (where access was either restricted or no dams existed to be used) to a state where access to water improved, although through a low reliable supply network. Naturally, this suggested transition does not represent a common trait across the whole JRB, as the inequality in terms of water reliability is primarily a matter of economic power, as the large demand centers (cities, industries, and irrigation projects) use water from the large strategic reservoirs, whereas peasants are the ones relying on the small structures (Salinas et al., 2019).
In addition to the economic status, other forms of inequalities not explored in this study may also have manifested in the region. More vulnerable social groups, such as indigenous populations, had historically been denied access to general infrastructure. Furthermore, women had taken on most of the domestic work, which demanded high-quality water. Therefore, it can be safely assumed that the power relationship over water may have impacted distinct layers of society, affecting the dimensions of gender, indigeneity and vulnerable social groups regarding their access to water.
3.2.4 Period 2000-present: consolidation of the reservoir network and water quality degradation
The last period is characterized by decline in reservoir construction (Figure 4c) together with increased emphasis on the exploration of groundwater resources (Figure 4g). Moreover, this may be a result of surface water quality issues starting to become apparent during this period. Lastly, an institutional move toward decentralized drought mitigation strategies emerged together with the diversification of legal and institutional initiatives to cope with droughts.
Toward the end of the 1990’s, a substantial reduction in the rate of construction of strategic dams was observed, with the exception being the Castanhão dam, the largest one of the systems with 6,700 million m3 storage capacity. Despite the existing network, droughts still negatively impacted society during the post 2000’s period, although in much less drastic ways than during the beginning of the 20th Century. Between 2012 and 2017 the state of Ceará experienced its worst multi-year drought in the last 100 years (Zhang et al., 2021; Pereira et al., 2023), which caused crop loss and economic damage. However, no expressive migration occurred, and human supply could be continued in most of the basin and the city of Fortaleza with its 2.4 million inhabitants.
To support water supply for consumption by the rural families, the “One Million Cisterns Program,” developed in the early 2000’s by the Brazilian Semi-Arid Articulation (ASA) to promote rainwater harvesting, which was latter incorporated by the Federal Government. The program started in 2003 and reached its peak during the drought of 2012–2017, when 400,000 cisterns were delivered to rural communities.
Water management in the region experienced a shift from hard-path (infrastructure construction) toward soft-path (demand management) solutions (Medeiros and Sivapalan, 2020), in which a more diverse set of measures to enhance water security were adopted. In the JRB, sub-basin committees, composed of public authorities, civil society and water users, were created in this period to manage water resources in a participatory and decentralized manner. By analyzing the documentation of 25 years (1997–2021) of stakeholder meetings on water allocation in the Ceará state, Carvalho et al. (2024) noticed that the management process has progressed and become more participative. However, some shortcomings still exist, for example it has not yet effectively incorporated actors from sectors other than water resources, and unequal power distribution influences decision-making.
Until the early 2000’s, water quality was not considered to be a major issue in the JRB. This scenario changed as frequent reports of inadequate water quality standards at the main reservoirs started being issued (COGERH, 2024). A combination of factors can be hypothesized to have led to reductions in water quality at the JRB reservoirs mainly during drought periods, such as the reduction in reservoir volumes and overflow frequency leading to increasing nutrient concentrations (Wiegand et al., 2021), high external nutrient loading (Araújo et al., 2019; Rocha and Lima Neto, 2021), internal enrichment due to aquaculture (Santos et al., 2017), sediment and phosphorus resuspension (Mesquita et al., 2016) and internal phosphorus loads (Moura et al., 2019; Lima Neto et al., 2022). Consequently, in 2008, COGERH started monitoring water quality from strategic reservoirs.
An example of the aforementioned drought related water quality issues is shown in Wiegand et al. (2021), who studied 65 reservoirs between 2008 and 2017, 44 of which were in the JRB. The authors observed that the trophic state of 91% of the reservoirs increased during the 2012–2017 drought period. Figure 8 presents the evolution of water quality, expressed in terms of the trophic state, in the three largest reservoirs in the JRB from 2008 to 2024. Since its construction in 2004, the Castanhão reservoir remains 56% of the time in eutrophic state and 5% in hypereutrophic level, varying only between these two states since 2014. A similar scenario occurs at the Orós and Banabuiú reservoirs, which both remained as eutrophic or hypereutrophic for 70% of the time. Similar patterns of water quality during droughts have been observed in reservoirs of various capacities and spatially distributed in the JRB region: for example, the Pau Preto (3.3 million m3 storage capacity), was eutrophic or hypereutrophic during 56% of the time, whereas the Santo Antônio de Russas reservoir near the basin outlet (25.1 million m3) and the Cedro reservoir (126 million m3), further west, were 78 and 81% of the time in the same classes (COGERH, 2024). Degradation of water quality in the monitored strategic reservoirs reveals the consequences of pollution as expressed by the ratio of potentially polluted water depicted in Figure 4f, which has been evolving since 1920 following the volumes of the collected and untreated and the uncollected sewage, as well as runoff in agricultural fields.
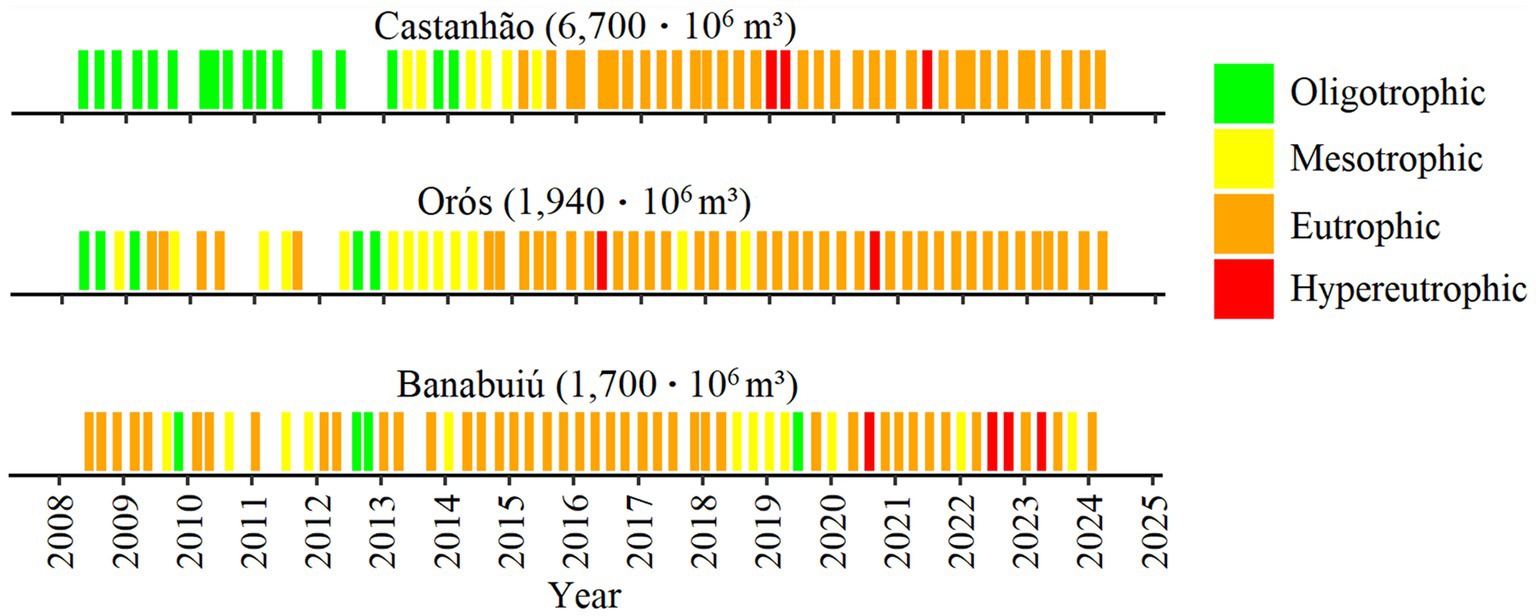
Figure 8. Evolution of water quality of the three largest reservoirs during Period 4, expressed as the trophic state (adapted from COGERH, 2024).
Lastly, with the reduction of dams being built at the JRB, the government of Ceará started investing on the construction of groundwater wells. Although the Superintendent of Water Works (SOHIDRA) began drilling wells in 1987, it was only after the 2012 drought that this policy was strengthened: in 2012, 261 wells were drilled, while at the peak, in 2016 and 2018, 1,994 and 1,977 were drilled, respectively (Figure 4g). During the 2012–2017 drought, building dams was no longer a priority. In fact, wells became a viable alternative to meet the demand of rural communities, while the existing strategic reservoirs continued to promote water availability with high reliability.
3.3 Status of the reservoir network in the Jaguaribe River Basin
As a consequence of the adaptation of society to water scarcity and the construction of numerous dams, by demanding strategic ones from the governments and constructing own small structures, a very dense network of surface reservoirs emerged. Using the Global Surface Water Explorer (Pekel et al., 2016), Pereira et al. (2019) identified more than 13 thousand dams with flooded areas of at least one hectare in the Jaguaribe Basin, totaling 15,000 million m3 of storage capacity, of which 74 are strategic reservoirs monitored by the Water Resources Management Company of Ceará and 190 are cooperation reservoirs (Pinheiro, 2004). Figure 9 (left) illustrates dam construction over time, from which it is possible to note that reservoirs in cooperation were built mostly between 1930 and 1970, whereas construction of strategic dams was intensified after the 1970’s. Figure 9 (right) shows the distance from any point in the basin to the nearest water source, taking into account the strategic dams, those in cooperation and those built spontaneously by society (with an area of over 1 ha). The map illustrates the high density of the network, with most areas of the basin presenting a distance of <3 km to a water source.
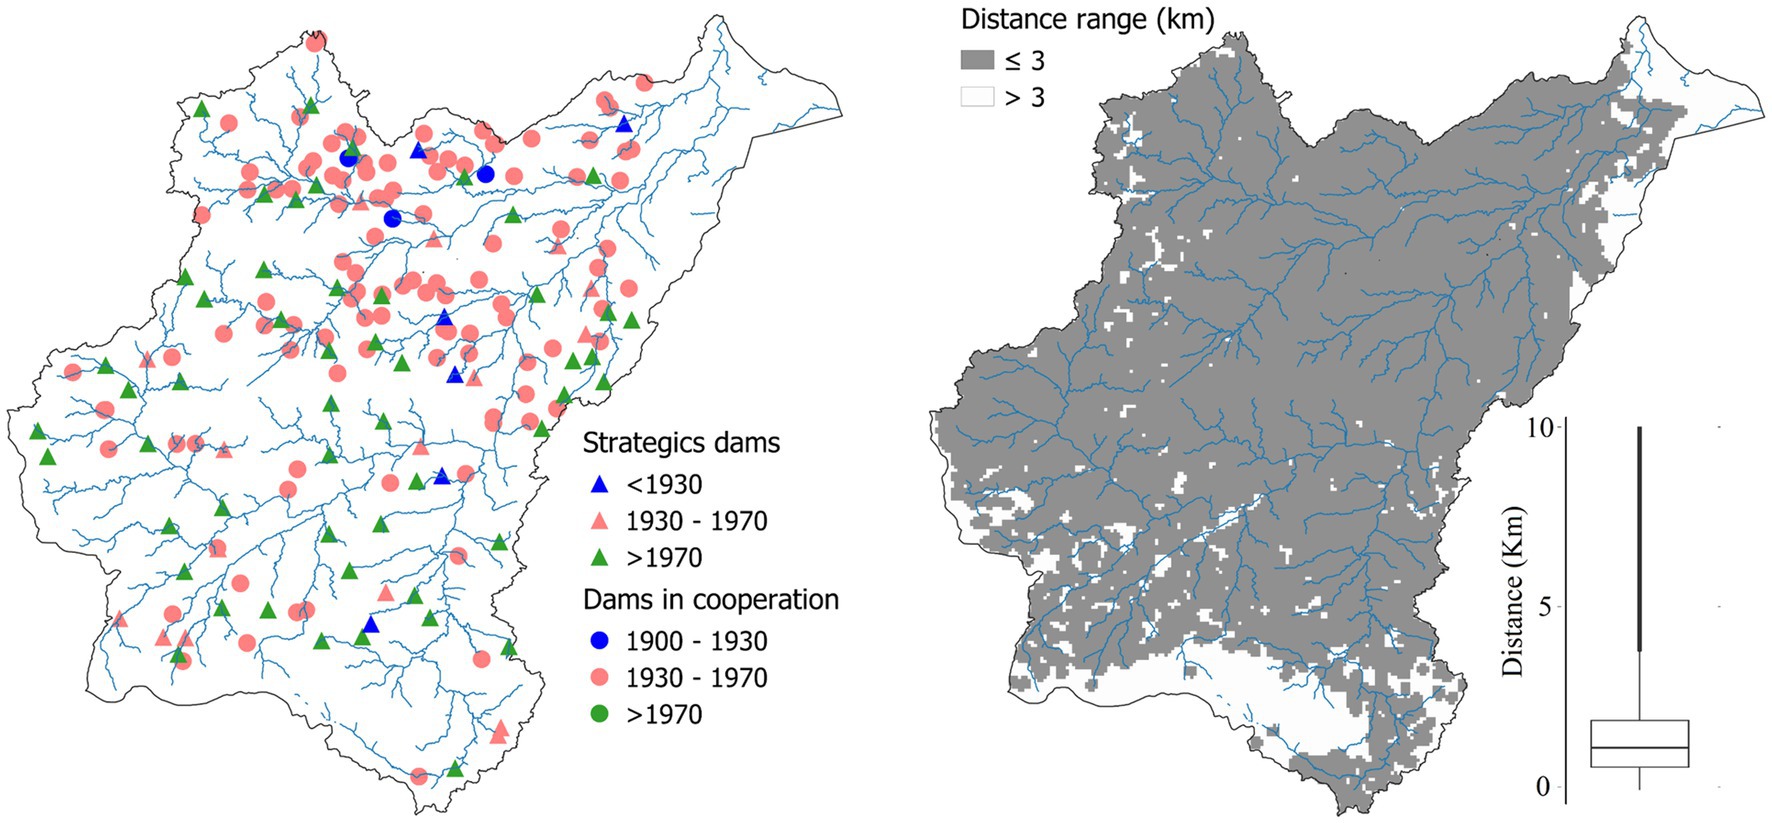
Figure 9. Construction of strategic and cooperation dams over time (left) and current distance of any point in the Jaguaribe River basin to the nearest reservoir (right).
Figure 10 illustrates the network configuration in terms of accumulated frequency of reservoir count, storage capacity and water yield with 90% reliability, sorted by size: 97% of the reservoirs have individual capacities of <1 million m3, which altogether can store and yield only roughly 5% of the total of the system. On the other hand, the three largest strategic reservoirs (Castanhão, Orós and Banabuiú, with capacities of 6,700, 1,900, and 1,600 million m3, respectively), can store and yield over 65% of the water of the system. Such configuration of the network depicts the representativeness and role of the small reservoirs in distributing water in the Droughts Polygon, as discussed by Nascimento et al. (2019) and Meira Neto et al. (2024), whereas the large ones promote water yield with high reliability.
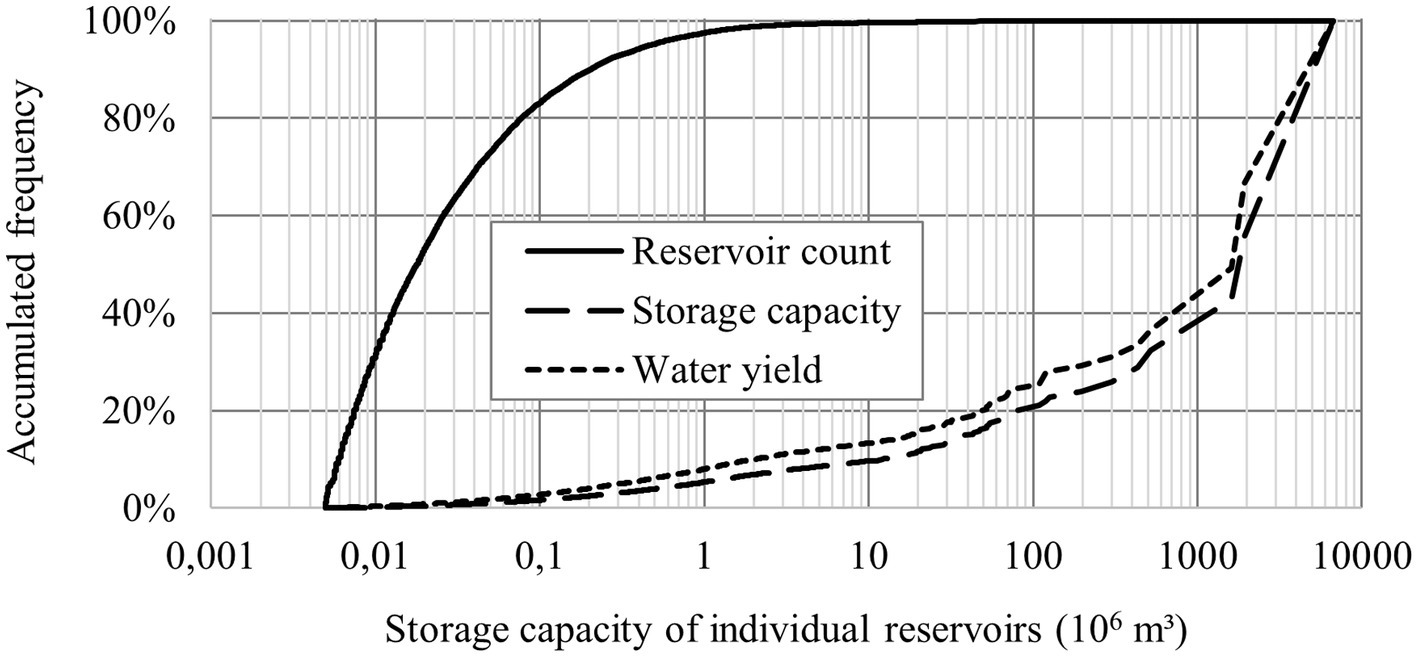
Figure 10. Current configuration (accumulated frequency of reservoir count, storage capacity and water yield with 90% reliability) of the reservoir network in the Jaguaribe River Basin, sorted by reservoir size.
4 Discussion
4.1 Evolution of water security and the AAAQ framework
The main features preventing society from fully achieving water security in the Jaguaribe River Basin changed over time, as the system evolved. We argue that the four distinct periods, or eras, as identified in Table 2, can be conveniently structured into the Availability, Accessibility, Acceptability and Quality—or AAAQ—framework. The following paragraphs expand on the definition of each component of the AAAQ framework and its relationship to the water security evolution at the JRB.
In the AAAQ framework, Availability is quantified for a given geographical location and assessed from a supply perspective measured by quantitative data (Jensen et al., 2014). Era 1 (before 1930) in the JRB was characterized by an imbalance between water supply and demand, when population suffered due to severe drought events. During that period, the main constraint to water security was the very low water availability with high reliability, since the region lacked structures to store the runoff that was concentrated in a few months per year. This was when the policy of damming rivers was initiated, whose inception was the construction of the Cedro dam in 1906. In this stage of the adaptation, society pursued continuous water supply in sufficient quantities.
Accessibility, as defined by Jensen et al. (2014), refers to the level and who has access to water, i.e., it may be available in abundance, but there are factors that influence the right of access to this resource. The authors list three aspects to be considered in the access to water: physical access; economic access (affordability); accessibility to information (participation in decision-making). In Era 2 (1930–1970), the feature restricting water security was accessibility, with some areas in the JRB distant over 200 km from the nearest water source at the onset of this period. During this era, the Dam Policy focused on expanding the reservoir network through the public-private cooperative regime. However, these dams were initially unable to meet their objective of facilitating access to water, since the owners of the land on which these infrastructures were built denied access to the population. Srinivasan et al. (2012) studied more than 20 areas in four continents and concluded that water scarcity in JRB has been primarily caused by political reasons, in a process that the authors called “water capture by elite,” which agrees with the findings of other authors. For example, Boelens et al. (2019) argue that political and economic elites are able to capitalize on dam projects and marginalize other social groups. Bakker (2010) shows that the culture of political exclusion of indigenous farmers is among the reasons for the lack of water supply in Cochabamba, Bolivia.
Era 3 initiated in the 1970’s, after the expansion of the network of cooperation dams and the implementation of some important strategic reservoirs such as Orós and Banabuiú in previous decades, and lasted until the early 2000’s. During this era, water security was constrained by the acceptability of marginalized social groups that relied on water sources with low reliability, mostly small reservoirs. In the JRB, cultural issues of these groups such as family farming and dietary habits, as well as other cultural perceptions such as the memories of drought events and their negative effects, have a strong influence on the acceptability of a water system that had been put in practice in the previous eras. Without access to the reservoirs built in cooperation and not being supplied by the strategic ones, these groups intensified the construction of their own dams spontaneously.
With the expansion of the network of reservoirs, by the end of Era 3 in the early 2000’s, the water security aspects of availability, accessibility and acceptability had been partially met in the JRB, and a decrease in the rate of dam construction was observed. The system reached a hydrological limitation to increase water availability, and the high storage capacity (almost two-fold the average annual runoff volume) promoted high sediment and nutrient trapping, giving rise to the water quality effect (Medeiros and Sivapalan, 2020).
In Era 4 (2000-present), the major restriction on water security has been water bad quality, whose adequacy should be defined according to international standards and considering parameters that might pose risks to human health, as proposed by Jensen et al. (2014) in the AAAQ framework. The pursuit of water security by society in the Jaguaribe River Basin through the Dam Policy, followed by the decline of this policy in Era 4 is illustrated in Figure 11.
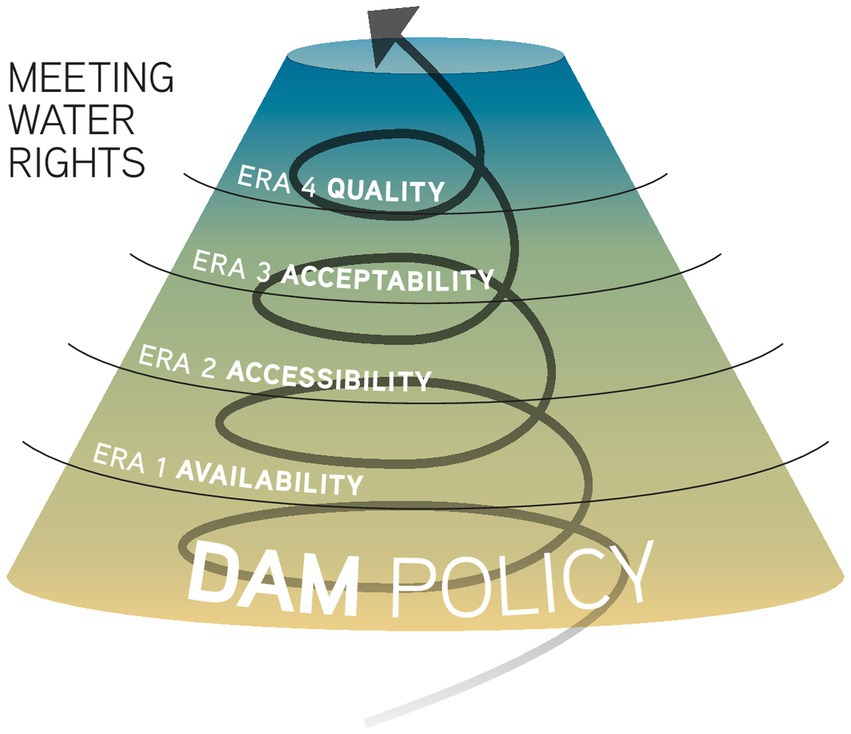
Figure 11. Representation of the Dam Policy as a major measure in the pursuance for different facets of water security throughout eras in the semi-arid Jaguaribe River basin.
4.2 Sociohydrologic feedbacks throughout reservoir expansion in the Jaguaribe River Basin
Socio-hydrological studies have demonstrated that construction of dams might be followed by unintended consequences due to the bi-directional interactions between society and hydrology. In the Jaguaribe River Basin, a major negative feedback of storage capacity expansion was the water quality effect, i.e., water quality degradation due to nutrient retention in the reservoir network. The monitoring program conducted by COGERH since 2008 indicates a general trend to high eutrophication in Era 4 of the Dam Policy, with the three largest reservoirs remaining in eutrophic or hypereutrophic state over more than 50% of the time. The study by Silva et al. (2025) suggests eutrophication to be accelerated by the practice of damming rivers in the region even under preserved conditions: the authors analyzed the Boqueirão reservoir, inserted in a preservation area, and observed high phosphorus loads from the catchment and concentration in the reservoir.
The water quality effect might also trigger other undesired consequences, such as inequalities on water security already observed during the system co-evolution: the Drought Industry in Era 2 and low reliability of water supply from small reservoirs in Era 3. Treatment of the poor-quality water from the reservoirs implies high technological and financial costs, impacting its tariff and threatening the supply of the most vulnerable social groups with low payment capacity. Furthermore, throughout the evolution of the Jaguaribe system, signs of other socio-hydrological phenomena have been identified (Medeiros and Sivapalan, 2020): the supply effect (Di Baldassarre et al., 2018)—increase in water demand due to higher water availability promoted by reservoirs, offsetting the initial benefits to the supply–demand balance—and the reservoir effect (Di Baldassarre et al., 2018)—vulnerability of society due to overreliance on reservoirs as secure water sources.
Arguably, enhancement of water availability with high reliability enabled the continuous growth of population and the economic development in the JRB and the Metropolitan Region of Fortaleza, connected to this system. With the flow regularization by the reservoirs, the high water-consuming agricultural sector could establish and, at a later stage, also the service and industrial sectors. The loop of increasing water availability by reservoir implementation, followed by demand increase, which required building new dams, is illustrated in Figure 4b: a thorough raise in the water scarcity index is observed after a dam being built, with a continuous reduction in the following years due to demand growth until the construction of the next dam.
High dependence of society on the reservoirs for water supply is another consequence of the focus put into the Dam Policy throughout the 20th Century. Currently, over 90% of the water demand of the Ceará State is met by dams (Peter et al., 2014). Most surprisingly, the two largest reservoirs alone (Castanhão and Orós) account for 57% of the total storage capacity of the system, meeting not only the local demands of the JRB but also being responsible for the water security of the Metropolitan Region of Fortaleza, outside of the basin. By the end of the dry period of 2012–2017 (Zhang et al., 2021), those reservoirs reached nearly 2 and 4% of their capacities, respectively, affecting the water availability (Pereira et al., 2023). On that occasion, only the irrigation sector suffered rationing, which started in September 2013 and lasted until the end of the drought. This example demonstrates that relying on a few surface reservoirs in times of extreme drought can lead to the collapse of the system if management actions are not taken in advance and encompassing all users.
The evolution of the reservoir network in the JRB compares with other examples, such as the case of the ancient Maya society. In the Mayan region, the rainy season extended for 7 months, so there was a need to harvest rain to provide drinking water during the dry season. Manmade reservoirs provided drinking water for millions of Mayans in the Classic Period (c. 250–900 AD), but just like in the JRB, streams and the smaller reservoirs dried up as the dry season progressed (Lucero, 2023). Lucero (2006) states that the annual wet and dry seasons affected the socio-political systems of the Maya, so that urban forces dominated during the annual drought, i.e., there was appropriation of water by the elite, and rural forces dominated during the rainy season, when many Mayans lived dispersed across the landscape to cultivate the land.
Kuil et al. (2016) applied a socio-hydrological model to the case of the ancient Maya, whose population peaked during the Classic Period (600–830 C. E.) and then declined during the 9th Century. The authors’ hypothesis is that periods of drought played an important role in the collapse of society: from simulating the possible feedback between water and the people, it was demonstrated that a modest reduction in rainfall could lead to an 80% population decrease due to food scarcity. The simulations performed by Kuil et al. (2016) indicate that the construction of reservoirs resulted in less frequent drought impacts, but if the reservoirs dried up, the impact of the drought could be more severe due to the reservoir effect described by Di Baldassarre et al. (2018). At least eight droughts lasting between 3 and 18 years hit the region between 800 and 930 C. E (Medina-Elizalde et al., 2010) and triggered problems such as overuse of resources, crop failures, decreased water supply and quality (Lucero, 2023).
Beyond the system feedback already noticed in the Jaguaribe Basin, climate change may play a major role on water resources in the future. Rodrigues et al. (2024) conducted climate simulations with regional climate models and showed different trends in future evaporation from the network of reservoirs in Ceará. The authors concluded that the simulated future scenarios of evaporation can impact water availability in the range of −7 to +9%. In a region where there is considerable reliance on reservoirs, changes in evaporation and/or precipitation patterns can lead the system to collapse (Kuil et al., 2016; Di Baldassarre et al., 2018).
5 Conclusion
In this paper we investigated the phenomenon of the long history of reservoir construction driven by an officially declared Dam Policy and its eventual decline after 100 years of coupled human-water coevolution in the Jaguaribe River Basin in north-eastern Brazil. Our analysis consisted of data collection and analysis about the number, capacity, and timing of reservoir construction over the last 100 years, supplemented by historical narratives of the societal forces that underpinned reservoir construction and increase of human population, paired with a hydrologic model that tracked the evolution of water security over the period of study.
We found that the pursuit of water security through implementation of the Dam Policy evolved organically to meet different facets of water security over four different time periods or eras. This pattern is deemed an emergent outcome of the coevolution of a coupled human-water system involving two-way feedbacks between hydrological variability and socio-economic development. The characteristics of the four eras happen to align well with the AAAQ (Availability, Accessibility, Acceptability and Quality) framework that has been proposed to guide achievements of human rights standards worldwide.
During Era 1, supply was limited by the availability of water, and construction of the first dams marked the beginning of the Dam Policy and associated benefits. During Era 2, water availability improved substantially with the small number of large strategic reservoirs. Further improvements to water availability were achieved by the construction of medium-sized reservoirs in private lands. Even as availability improved, the denial of access of peasants to these reservoirs posed major restrictions to water accessibility, as the new water sources were controlled by the social elite in a process referred to as Drought Industry. In response, during Era 3, society was emboldened enough to expand the reservoir network by spontaneously building local small farm dams. However, acceptability became an emergent new challenge since these new reservoirs were so small that they could not provide water with high reliability, creating inequalities in water supply. During the current Era 4, water quality stands out as the main constraint due to the eutrophication of these reservoirs from nutrient loading. Together with a hydrological limitation to enhancement of water availability through the construction of new reservoirs, this has led to the gradual abandonment of the Dam Policy and a shift toward groundwater exploitation and soft path approaches.
Although there have been undeniable advances in the availability of, and accessibility to water, the interactions between humans and nature (hydrology) kept posing continued challenges to fully achieving water security. These include: (i) inequality of access to water promoted by the existing system, especially for minority groups relying on small reservoirs, and (ii) degradation of the water quality arising from continued population growth and agricultural development. Furthermore, over-dependence on dams as the sole solution exposed society to shortages during times of severe droughts, such as that of 2012–2017 in the JRB, increasing the system’s vulnerability to water insecurity. The continuation of the Dam Policy for over a century while water security had been progressively advanced within the JRB in a multi-faceted way, illustrates the dynamic nature of societal expectations in meeting their rights to water. As basic societal needs, such as water availability, are met in the early stages of policy implementation, new aspects of water rights emerge and are demanded, forcing the adaptation (or continuation, as in the JRB) of the original strategy. The gradual evolution of water security with an initial focus on water availability (hydrology), and through physical infrastructure to improve accessibility, then to social equity and finally to water quality, highlights that the search for water security is a coevolutionary socio-hydrological process.
Throughout human history, especially in dry regions of the world where water scarcity is acute, humans have developed a range of strategies to achieve water security. These strategies are mostly combinations of ancient practices and modern innovations, adapted to the intrinsic environmental, social and economic conditions that prevail in each region. In this sense, what has been experienced in north-eastern Brazil is an object lesson for similar regions in other countries around the world, which are also trying to achieve water security, as a natural progression in human technological and social development. The experience within the JRB also provides an illustrative example of a possible pathway for the operationalization of the rights to water within the AAAQ framework, especially in dry regions.
Data availability statement
The raw data supporting the conclusions of this article will be made available by the authors, without undue reservation.
Author contributions
BP: Investigation, Writing – review & editing, Conceptualization, Formal analysis, Methodology, Writing – original draft, Data curation. PM: Investigation, Methodology, Writing – review & editing, Conceptualization, Resources, Supervision, Formal analysis. AM: Conceptualization, Investigation, Writing – review & editing, Methodology. JA: Writing – review & editing, Methodology, Conceptualization, Supervision, Investigation. MS: Writing – review & editing, Conceptualization, Methodology, Investigation.
Funding
The author(s) declare that financial support was received for the research and/or publication of this article. This study was supported by the CAPES: for the doctorate scholarship to BP and for funding the research stay of PM at the University of Illinois at Urbana-Champaign, which originated this cooperation (Finance code 001: grant 88881.173213/2018-01) CNPq: for funding the research project “Long-term human-water systems dynamics in the semiarid Jaguaribe Basin” (grant 404152/2024-4) and for the research productivity fellowship granted to PM and JA.
Conflict of interest
The authors declare that the research was conducted in the absence of any commercial or financial relationships that could be construed as a potential conflict of interest.
The handling editor GC declared a past co-authorship with the author MS.
The author(s) declared that they were an editorial board member of Frontiers, at the time of submission. This had no impact on the peer review process and the final decision.
Generative AI statement
The authors declare that no Gen AI was used in the creation of this manuscript.
Publisher’s note
All claims expressed in this article are solely those of the authors and do not necessarily represent those of their affiliated organizations, or those of the publisher, the editors and the reviewers. Any product that may be evaluated in this article, or claim that may be made by its manufacturer, is not guaranteed or endorsed by the publisher.
Footnotes
References
Alves, J. (2003). História das secas (séculos XVII a XIX). Edição fac-símile. Fortaleza: Fundação Waldemar Alcântara.
Alves, V. (2023). Campos de Concentração da Seca de 1932 no Ceará: Múltiplas visões e reverberações contemporâneas. Fortaleza: Fundação Waldemar Alcântara.
Alves, J. M. B., Campos, J. N. B., and Servain, J. (2012). Reservoir management using coupled atmospheric and hydrological models: the Brazilian semi-arid case. Water Resour. Manag. 26, 1365–1385. doi: 10.1007/s11269-011-9963-2
Araújo, J. A. d. A. (1990). Barragens no Nordeste do Brasil. Experiência do DNOCS em barragens na região semiárida. 2nd Edn. Fortaleza: DNOCS.
Araújo, G. M., Lima Neto, I. E., and Becker, H. (2019). Phosphorus dynamics in a highly polluted urban drainage channel-shallow reservoir system in the Brazilian semiarid. An. Acad. Bras. Ciênc. 91:e20180441. doi: 10.1590/0001-3765201920180441
Bakker, K. (2010). Privatizing water: Governance failure and the world's urban water crisis. Ithaca, NY: Cornell University Press.
Bezerra, E. (1996). A terra e a irrigação no Nordeste. Fortaleza: Imprensa Universitária da Universidade Federal do Ceará.
Boelens, R. (2014). Cultural politics and the hydrosocial cycle: water, power and identity in the Andean highlands. Geoforum 57, 234–247. doi: 10.1016/j.geoforum.2013.02.008
Boelens, R., Shah, E., and Bruins, B. (2019). Contested knowledges: large dams and mega-hydraulic development. Water 11:416. doi: 10.3390/w11030416
Campos, J. N. B. (2015). Paradigms and public policies on drought in Northeast Brazil: a historical perspective. Environ. Manag. 55, 1052–1063. doi: 10.1007/s00267-015-0444-x
Campos, J. N. B., and de Studart, T. M. C. (2008). Drought and water policies in Northeast Brazil: backgrounds and rationale. Water Policy 10, 425–438. doi: 10.2166/wp.2008.058
Carvalho, T. M. N., Souza Filho, F. d. A. d., and Brito, M. M. d. (2024). Unveiling water allocation dynamics: a text analysis of 25 years of stakeholder meetings. Environ. Res. Lett. 19:044066. doi: 10.1088/1748-9326/ad37cd
COGERH (2024) Portal Hidrológico do Ceará. Companhia de Gestão de Recursos Hídricos do Ceará. Available online at: http://www.hidro.ce.gov.br (accessed May 25, 2024).
De Alencar, J. M. P. (1889). Seccas. Revista Trimensal do Instituto do Ceará - 1887 a 1900. Available online at: http://memoria.bn.br/DocReader/DocReader.aspx?bib=144843&pesq=pr%C3%AAmio%20a%C3%A7ude&hf=memoria.bn.br&pagfis=3635 (accessed April 4, 2023).
De Araújo, J. C., and Bronstert, A. (2016). A method to assess hydrological drought in semi-arid environments and its application to the Jaguaribe River basin, Brazil. Water Int. 41, 213–230. doi: 10.1080/02508060.2015.1113077
De Araújo, J. C., and Medeiros, P. H. (2013). Impact of dense reservoir networks on water resources in semiarid environments. Australas. J. Water Res. 17, 87–100. doi: 10.7158/13241583.2013.11465422
De Araújo, J. C., and Piedra, J. I. G. (2009). Comparative hydrology: analysis of a semiarid and a humid tropical watershed. Hydrol. Process. 23, 1169–1178. doi: 10.1002/hyp.7232
De Figueiredo, J. V., Araújo, J. C., Medeiros, P. H. A., and Costa, A. C. (2016). Runoff initiation in a preserved semiarid Caatinga small watershed, northeastern Brazil. Hydrol. Process. 30, 2390–2400. doi: 10.1002/hyp.10801
de Lima, J. R., and Magalhães, A. R. (2018). Secas no Nordeste: registros históricos das catástrofes econômicas e humanas do século 16 ao século 21. Parc. Estrat. 23, 191–212.
Di Baldassarre, G., Wanders, N., AghaKouchak, A., Kuil, L., Rangecroft, S., Veldkamp, T. I., et al. (2018). Water shortages worsened by reservoir effects. Nat. Sust. 1, 617–622. doi: 10.1038/s41893-018-0159-0
Engle, N. L., Johns, O. R., and Lemos, M. C. (2011). Nelson DR: integrated and adaptive management of water resources: tensions, legacies, and the next best thing. Ecol. Soc. 16:160119. doi: 10.5751/ES-03934-160119
Falkenmark, M. (1989). The massive water scarcity now threatening Africa: why isn’t it being addressed? Ambio 18, 112–118.
Fischer, I., and Albuquerque, L. (2002). 139-A mulher e a emergência da seca do Nordeste do Brasil. Textos para Discussão. Available at: https://periodicos.fundaj.gov.br/TPD/article/view/941 (Accessed April 12, 2022).
Gaiser, T., Krol, M., Frischkorn, H., and de Araújo, J. C. (2003). Global change and regional impacts. Berlin: Springer.
GWP (2000). Towards water security: A framework for action. Stockholm: Global water partnership - GWP.
Guerra, P. B. (1981). A Civilização da Seca: o Nordeste é uma história mal contada. Brasil: Ministério do Interior, Departamento Nacional de Obras Contra as Secas.
Güntner, A., Krol, M. S., Araújo, J. C. D., and Bronstert, A. (2004). Simple water balance modelling of surface reservoir systems in a large data-scarce semiarid region. Hydrol. Sci. J. 49:918. doi: 10.1623/hysj.49.5.901.55139
Hjelmstad, A., Garcia, M., and Larson, K. (2019). Effect of drought policies on Los Angeles water demand. Anchorage, AK: World Environmental and Water Resources Congress.
Homer, C. S. E., Castro Lopes, S., Nove, A., Michel-Schuldt, M., McConville, F., Moyo, N. T., et al. (2018). Barriers to and strategies for addressing the availability, accessibility, acceptability and quality of the sexual, reproductive, maternal, newborn and adolescent health workforce: addressing the post-2015 agenda. BMC Pregnancy Childbirth 18:55. doi: 10.1186/s12884-018-1686-4
IBGE (2010). Índice de Desenvolvimento Humano. Available at: https://cidades.ibge.gov.br/brasil/ce/fortaleza/pesquisa/37/30255?ano=2010 (Accessed July 10, 2023).
IBGE. (2021). Panorama municipal. Available at: https://cidades.ibge.gov.br/brasil/ce/panorama (Accessed July 10, 2023).
Jensen, M. H., Villumsen, M., and Petersen, T. D. (2014). The AAAQ framework and the right to water: International indicators for availability, accessibility, acceptability and quality. Copenhagen: The Danish Institute for Human Rights.
Jesus, T. S., Landry, M. D., Dussault, G., and Fronteira, I. (2017). Human resources for health (and rehabilitation): six rehab-workforce challenges for the century. Hum. Resour. Health 15:8. doi: 10.1186/s12960-017-0182-7
Jiang, Y. (2009). China's water scarcity. J. Environ. Manag. 90, 3185–3196. doi: 10.1016/j.jenvman.2009.04.016
Johnson, R. M. F., and Kemper, K. R. (2005). Institucional and policy analisys of river basin management. Ceará: World Bank Policy Research Paper.
Kendall, T., Sriram, P., Parmar, A., and Norman, V. W. (2023). Canadian newspapers support mifepristone medication abortion to improve fulfillment of the AAAQ right to health framework (2015–2019). Women Health Issues. 33, 592–599. doi: 10.1016/j.whi.2023.05.008
Krol, M., De ries, M. J., van Oel, P. R., and Araújo, J. C. (2011). Sustainability of small reservoirs and large scale water availability under current conditions and climate change. Water Resour. Manag. 25, 3017–3026. doi: 10.1007/s11269-011-9787-0
Kuil, L., Carr, G., Viglione, A., Prskawetz, A., and Blöschl, G. (2016). Conceptualizing socio-hydrological drought processes: the case of the Maya collapse. Water Resour. Res. 52, 6222–6242. doi: 10.1002/2015WR018298
Leal Filho, W. L., Totin, E., Franke, J. A., Andrew, S. M., Abubakar, I. R., Azadi, H., et al. (2022). Understanding responses to climate-related water scarcity in Africa. Sci. Total Environ. 806:150420. doi: 10.1016/j.scitotenv.2021.150420
Liberato Barroso, J. (1916). Mensagens do Governador do Ceará para Assembléia (CE) – 1891 a 1930. Available online at; http://memoria.bn.br/DocReader/DocReader.aspx?bib=872830&pesq=%22campo%20de%20concentra%C3%A7%C3%A3o%22&hf=memoria.bn.br&pagfis=1628 (accessed April 4, 2023).
Lima, T. B. R., Medeiros, P. H. A., Mamede, G. L., and Araújo, J. C. (2023). Impact of intensive water use from farm dams on the storage dynamics in strategic reservoirs. Hydrol. Sci. J. 68, 2422–2434. doi: 10.1080/02626667.2023.2272669
Lima Neto, I. E., Medeiros, P. H. A., Costa, A. C., Wiegand, M. C., Barros, A. R., and Barros, M. U. G. (2022). Assessment of phosphorus loading dynamics in a tropical reservoir with high seasonal water level changes. Sci. Total Environ. 815:152875. doi: 10.1016/j.scitotenv.2021.152875
Lucero, L. J. (2006). Water and ritual: The rise and fall of classic Maya rulers. Austin, TX: University of Texas Press.
Lucero, L. J. (2023). Ancient Maya reservoirs, constructed wetlands, and future water needs. PNAS 120:42. doi: 10.1073/pnas.230687012
Malveira, V., de Araújo, J., and Güntner, A. (2012). Hydrological impact of a high-density reservoir network in semiarid northeastern Brazil. J. Hydrol. Eng. 17, 109–116. doi: 10.1061/(ASCE)HE.1943-5584.0000404
Mamede, G. L., Güntner, A., Medeiros, P. H. A., Araújo, J. C., and Bronstert, A. (2018). Modeling the effect of multiple reservoirs on water and sediment dynamics in a semiarid catchment in Brazil. J. Hydrol. Eng. 23:17. doi: 10.1061/(ASCE)HE.1943-5584.00017
McLean, J. (2007). Water injustices and potential remedies in indigenous rural contexts: a water justice analysis. Environmentalist 27, 25–38. doi: 10.1007/s10669-007-9012-0
Medeiros, P. H. A., and de Araújo, J. C. (2014). Temporal variability of rainfall in a semiarid environment in Brazil and its effect on sediment transport processes. J. Soils Sediments 14, 1216–1223. doi: 10.1007/s11368-013-0809-9
Medeiros, P., and Sivapalan, M. (2020). From hard-path to soft-path solutions: slow–fast dynamics of human adaptation to droughts in a water scarce environment. Hydrol. Sci. J. 65, 1803–1814. doi: 10.1080/02626667.2020.1770258
Medina-Elizalde, M., Burns, S. J., Lea, D. W., Asmerom, Y., von Gunten, L., Polyak, V., et al. (2010). High resolution stalagmite climate record from the Yucatán peninsula spanning the Maya terminal classic period. Earth Planet. Sci. Lett. 298, 255–262. doi: 10.1016/j.epsl.2010.08.016
Meira Neto, A., Medeiros, P., De Araújo, J. C., Pereira, B., and Sivapalan, M. (2024). Evolution of drought mitigation and water security through 100 years of reservoir expansion in semi-arid Brazil. Water Resour. Res. 60:e2023WR036411. doi: 10.1029/2023WR036411
Mesquita, P. S., Wittman, H., and Aroudo Mota, J. (2016). Climate variability, agricultural livelihoods and food security in semiarid Brazil. Sust. Debate 7, 38–51. doi: 10.18472/SustDeb.v7n0.2016.18749
Molle, F., and Cardier, E. (1992). Manual do pequeno açude: Construir, conservar e aproveitar pequenos açudes no Nordeste brasileiro. Recife: SUDENE.
Moore, R. J. (1985). The probability-distributed principle and runoff production at point and basin scales. Hydrol. Sci. J. 30, 273–297. doi: 10.1080/02626668509490989
Moura, D. S., Lima Neto, I. E., Clemente, A., Oliveira, S., Pestana, C., Melo, M. A., et al. (2019). Modeling phosphorus exchange between bottom sediment and water in tropical semiarid reservoirs. Chemosphere 246:125686. doi: 10.1016/j.chemosphere.2019.125686
Nascimento, A. T. P. d., Cavalcanti, N. H. M., Castro, B. P. L. d., and Medeiros, P. H. A. (2019). Decentralized water supply by reservoir network reduces power demand for water distribution in a semi-arid basin. Hydrol. Sci. J. 64, 80–91. doi: 10.1080/02626667.2019.1566728
Pekel, J. F., Cottam, A., Gorelick, N., and Belward, A. S. (2016). High-resolution mapping of global surface water and its long-term changes. Nature 540, 418–422. doi: 10.1038/nature20584
Pereira, B. S., Medeiros, P. H. A., Francke, T., Ramalho, G., Foerster, S., and De Araújo, J. C. (2019). Assessment of the geometry and volumes of small surface water reservoirs by remote sensing in a semi-arid region with high reservoir density. Hydrol. Sci. J. 64, 66–79. doi: 10.1080/02626667.2019.1566727
Pereira, B. S., Nunes, L. F. C. V., Alexandre, D. M. B., De Araújo, J. C., and Medeiros, P. H. A. (2023). Seca no Ceará 2012-2017. In: F. Zanandrea, M. Kobiyama, G. P. Michel, A. Fleischmann, and W. Collischonn (eds.). Desastres e água: eventos históricos no Brasil. 1 Ed. ABRHidro. Porto Alegre 315–334.
Pereira, B. S., Uchôa, J. G. S. M., Freitas, G. S., Meira Neto, A. A., Anache, J. A. A., Wendland, E. C., et al. (2025). Hydrological heritage: a historical exploration of human-water dynamics in Northeast Brazil. Hydrol. Sci. J. 70, 546–558. doi: 10.1080/02626667.2024.2446272
Peter, S., de Araújo, J. C., Araújo, N., and Herrmann, H. (2014). Flood avalanches in a semiarid basin with a dense reservoir network. J. Hydrol. 512, 408–420. doi: 10.1016/j.jhydrol.2014.03.001
Pinheiro, E. A. R., Metselaar, K., de Jong Lier, Q., and De Araújo, J. C. (2016). Importance of soil-water to the Caatinga biome, Brazil. Ecohydrology 9, 1313–1327. doi: 10.1002/eco.1728
Pompeu Sobrinho, T. (2019). O programa das secas. 3rd Edn. Fortaleza: Organização Moysés Rodrigues Pereira.
Ribeiro Neto, G. G., Melsen, L. A., Costa, A. C., Walker, D. W., Cavalcante, L., Kchouk, S., et al. (2024). Clash of drought narratives: a study on the role of small reservoirs in the emergence of drought impacts. Earths Future 12:e2023EF004311. doi: 10.1029/2023EF004311
Ribeiro Neto, G. G., Melsen, L. A., Martins, E. S. P. R., Walker, D. W., and van Oel, P. R. (2022). Drought cycle analysis to evaluate the influence of a dense network of small reservoirs on drought evolution. Water Resour. Res. 58:e2021WR030799. doi: 10.1029/2021WR030799
Rios, K. S. (2014). Isolamento e Poder: Fortaleza e os campos de concentração da Seca de 1932. Fortaleza: Imprensa Universitária, 144.
Rocha, M. d. J. D., and Lima Neto, I. E. (2021). Modeling flow-related phosphorus inputs to tropical semiarid reservoirs. J. Environ. Manag. 295:113123. doi: 10.1016/j.jenvman.2021.113123
Rodrigues, G. P., Brosinsky, A., Rodrigues, I. S., Mamede, G. L., and De Araújo, J. C. (2024). Impact of reservoir evaporation on future water availability in North-Eastern Brazil: a multi-scenario assessment. Hydrol. Earth Syst. Sci. 28, 3243–3260. doi: 10.5194/hess-28-3243-2024
Salinas, C. E. T., Oliveira, V. P. V. D., Brito, L., Ferreira, A. V., and De Araújo, J. C. (2019). Social impacts of a large-dam construction: the case of Castanhão, Brazil. Water Int. 44, 871–885. doi: 10.1080/02508060.2019.1677303
Santos, J. A., Marins, R. V., Aguiar, J. E., Chalar, G., Silva, F. A. T. F., and Lacerda, L. D. (2017). Hydrochemistry and trophic state change in a large reservoir in the Brazilian northeast region under intense drought conditions. J. Limnol. 76, 41–51. doi: 10.4081/jlimnol.2016.1433
Silva, E. M. R., Almeida, L. G., Medeiros, P. H. A., Lima, G. D., Andrade, E. M., and de Araújo, J. C. (2025). Reservoir eutrophication in the Brazilian semiarid: modeling of sediment removal and control of external loads as remediation measures. Environ. Sci. Pollut. Res. 32, 7663–7679. doi: 10.1007/s11356-025-36183-z
SOHIDRA. (2021). Programa de perfuração de poços no Estado do Ceará. Available online at: https://www.sohidra.ce.gov.br/2021/01/07/programa-de-perfuracao-de-pocos-no-estado-do-ceara-3/ (accessed January 7, 2021).
Srinivasan, V., Lambin, E. F., Gorelick, S. M., Thompson, B. H., and Rozelle, S. (2012). The nature and causes of the global water crisis: syndromes from a meta-analysis of coupled human-water studies. Water Resour. Res. 48:W10516. doi: 10.1029/2011WR011087
SUDENE (1981). As secas do Nordeste (Uma abordagem histórica de causas e efeitos). Recife: Ministério do Interior – Superintendência do Desenvolvimento do Nordeste.
Swyngedouw, E. (2009). The political economy and political ecology of the hydro-social cycle. J. Contemp. Water Res. Educ. 142, 56–60. doi: 10.1111/j.1936-704X.2009.00054.x
Villa, M. A. (2000). Vida e morte no sertão: história das secas no Nordeste nos séculos XIX e XX. 1st Edn. Fortaleza: Editora Ática, 269.
Wiegand, M. C., Nascimento, A. T. P. d., Costa, A. C., and Lima Neto, I. E. (2021). Trophic state changes of semi-arid reservoirs as a function of the hydro-climatic variability. J. Arid Environ. 184:104321. doi: 10.1016/j.jaridenv.2020.104321
Zhang, S., Foerster, S., Medeiros, P. H. A., de Araújo, J. C., Duan, Z., Bronstert, A., et al. (2021). Mapping regional surface water volume variation in reservoirs in northeastern Brazil during 2009-2017 using high-resolution satellite images. Sci. Total Environ. 789:147711. doi: 10.1016/j.scitotenv.2021.147711
Keywords: water security, socio-hydrology, droughts, reservoir management, hard path solutions, soft path solutions, water rights
Citation: Pereira B, Medeiros P, Meira Neto AA, de Araújo JC and Sivapalan M (2025) Advancing water security in semi-arid Brazil: expansion of water storage infrastructure and human-water system co-evolution. Front. Water. 7:1602146. doi: 10.3389/frwa.2025.1602146
Edited by:
Giulio Castelli, University of Florence, ItalyReviewed by:
Subham Mukherjee, Free University of Berlin, GermanyBrian McIntosh, Griffith University, Australia
Christian Klassert, Helmholtz Centre for Environmental Research (UFZ), Germany
Copyright © 2025 Pereira, Medeiros, Meira Neto, de Araújo and Sivapalan. This is an open-access article distributed under the terms of the Creative Commons Attribution License (CC BY). The use, distribution or reproduction in other forums is permitted, provided the original author(s) and the copyright owner(s) are credited and that the original publication in this journal is cited, in accordance with accepted academic practice. No use, distribution or reproduction is permitted which does not comply with these terms.
*Correspondence: Pedro Medeiros, cGhhbWVkZWlyb3NAaWZjZS5lZHUuYnI=