 Livia Serrao1,2
 Simone Caridi1
 Ali Farrokhi1
 Diego Avesani1
 Muyaka Kamamba3
 Mireille Galli1
 Chalwe Chibwe3
 Federica Medici1
 Sara Treccani1
 Joel Kabika3
 Kawawa Banda3
 Marco Bezzi1
 Massimo Zortea1
 Maybin Ng’ambi4
 Guido Zolezzi1,5*
- 1Department of Civil, Environmental, and Mechanical Engineering (DICAM), University of Trento, Trento, Italy
- 2European Commission Joint Research Centre, Ispra, Italy
- 3School of Mines, Department of Geology, Integrated Water Resources Management Centre, University of Zambia, Lusaka, Zambia
- 4World Vision-Zambia, Lusaka, Zambia
- 5Center Agriculture Food Environment (C3A), San Michele all’Adige, Italy
Small earth dams are common water harvesting techniques in drylands, but assessing their sustainability and long-term socio-environmental impacts is hindered by limited data availability that characterize many community-scale rural contexts. This study aims to investigate the sustainability of a small earth dam in rural drylands of Sub-Saharan Africa and to discuss the possible impacts of such new infrastructure on the local socio-hydrological system. A multidimensional approach that integrates resident interviews, topographical surveys, climate time series, stream sediment transport and Digital Elevation Model analysis is proposed and illustrated with reference to a recently constructed small dam in the Chitongo community, Namwala District, Zambia. We constructed a water consumption curve under various allocation scenarios, quantifying the reservoir’s capacity to meet current demands and to support future ones for agricultural and livestock in the dry season. The households with potential access to the new water source are quantified through spatial analysis. The potential catchment sediment yield to the reservoir is estimating by integrating the RUSLE soil erosion method with a measure of sediment connectivity, suggesting the reservoir may fill up in 25 years or more, highlighting its vulnerability to siltation. The proposed approach allows assessing the multi-dimensional sustainability of small dams. Possible emerging impacts on the local socio-hydrological system are discussed from the developed baseline, also considering benefits distribution within the local community. Such a scalable approach can be adopted to support the development of regional programs for rural water security in drylands, which should engage local actors in water allocation and reservoir maintenance plans for ensuring its functioning and fair benefits distribution for a reasonable time span.
1 Introduction
Sub-Saharan Africa is facing water scarcity challenges, with many countries being within water-scarce catchments (Barron and Salas, 2009; Gwenzi et al., 2015; Leal Filho and De Trincheria Gomez, 2018; Mensah et al., 2018). The limited availability of water resources, further hindered by climate change and climate variability, can be exacerbated by increasing water demand and by inadequate water management and allocation, leading to water shortages for agricultural, livestock, and domestic purposes (Ingrao et al., 2023; Mancosu et al., 2015; Ofori et al., 2021). In arid and semi-arid regions of sub-Saharan Africa, the rainy and dry seasons are becoming shorter and longer, respectively (e.g., Biasutti and Sobel, 2009). Consequently, rainfed agricultural and livestock production, which are entirely dependent on local rainfall (Baguma et al., 2010; Ringler and Zhu, 2015), are becoming increasingly vulnerable.
To address this challenge, various water harvesting techniques have been adopted for the collection and storage of water (Barron and Salas, 2009; Leal Filho and De Trincheria Gomez, 2018; Ngigi et al., 2005). Among them, small earth and sand dams are particularly effective in capturing and storing surface and river water, especially in cases of ephemeral rivers. Earth dams hold particular appeal for communities due to their potential to facilitate small-scale community-based irrigation and livestock rearing (Venot et al., 2012). However, these earth dams are susceptible to siltation (Alahiane et al., 2014; Berhane et al., 2016; Coviello et al., 2015; Haregeweyn et al., 2006), eutrophication (Dejenie et al., 2008), and groundwater seepage (Andreini et al., 2009; Berhane et al., 2016), although this latter can be deliberately maintained to recharge aquifers and preserve natural ecosystems (Basel et al., 2022). Furthermore, the social, economic, and environmental benefits may not be distributed equitably among potential users, or last enough in time (Nkhoma, 2011). Sustainability of socio-ecological systems like this one is influenced by second-level factors, as the number of users, their socio-economic status, the level of mutual trust within the community (Ostrom, 2009), highlighting the need for carefully considering these factors in the design and implementation of water harvesting systems.
The present paper aims at evaluating the sustainability of a small dam for community irrigation and livestock watering in dryland areas by proposing a replicable trans-disciplinary approach, and to discuss the potential impacts of the new infrastructure on the affected socio-hydrological system. The focus is on the community scale, at which data availability is generally scarce. Quantitative sustainability assessment includes three key aspects: (1) improved accessibility to water resources, (2) projected improvements in addressing community irrigation and livestock water demands, and (3) expected reservoir lifespan by modeling catchment siltation rates. The key findings allow to discuss the potential impacts of the new infrastructure on the local socio-hydrological system, and how these can further affect the infrastructure sustainability, suggesting possible management strategies.
A community case study is used to illustrate the approach, with reference to Chitongo, Namwala District, Southern Province, Zambia. In that context the construction of a new dam started in 2023, thanks to the support by the international NGO World Vision-Zambia (WVZ). The dam was built on the Mpinda stream, nearby the Chitongo community, to face increasing local water demands, therefore to better address increasingly perceived water scarcity. The outputs are particularly interesting at a national level in the light of the numerous small earth dams envisaged by the current National Development Plan of the country (Republic of Zambia, 2022), which will require to address such complex dynamics in contexts with limited environmental data. The adopted transdisciplinary approach (Lang et al., 2012) integrates socio-environmental data collection in the field, analysis of available global datasets, hydrological and hydraulic modeling, soil erosion and sediment transport estimation methods. This enables a multi-sectoral view that better represents the complexity of the water-food-ecosystem nexus and its importance for rural communities.
2 Materials and methods
2.1 Study area
Zambia is characterized by erratic rainfall patterns, distributed unevenly across the country. This can cause severe water-stressed conditions, including flooding and droughts, like in the 2023–2024 rainy season, when a severe drought occurred, affecting the country’s food security and national productivity (World Drought Atlas, 2024). In response to these challenges, the Zambian government has prioritized for years the construction of water collection and storage facilities, including small earth dams, to increase water availability for agricultural and domestic purposes (8NDP, 2022). The government has presently planned to construct additional small dams, complementing more than 3000 ones previously constructed for domestic, farming, and livestock purposes (2022-2026 Strategic plan, 2022).
The study area, shown in Figure 1, is located nearby Chitongo, Namwala district, and covers approximately 195 km2, with an average elevation of 1100 m a.s.l. According to the Koppen climate classification (Beck et al., 2018), the area is categorized as temperate with dry winter and hot summer (Cwa). A mean annual Aridity Index of 0.39 and an annual Potential Evapotranspiration of 2096 mm characterize the Mpinda catchment (Zomer et al., 2022). The catchment receives an average annual rainfall of 760 mm, with higher values in summer (Nov-Apr). Mean temperatures range from 19.5 to 24.5°C, while minimum temperatures can drop to 6–12°C during winter (May-Aug).
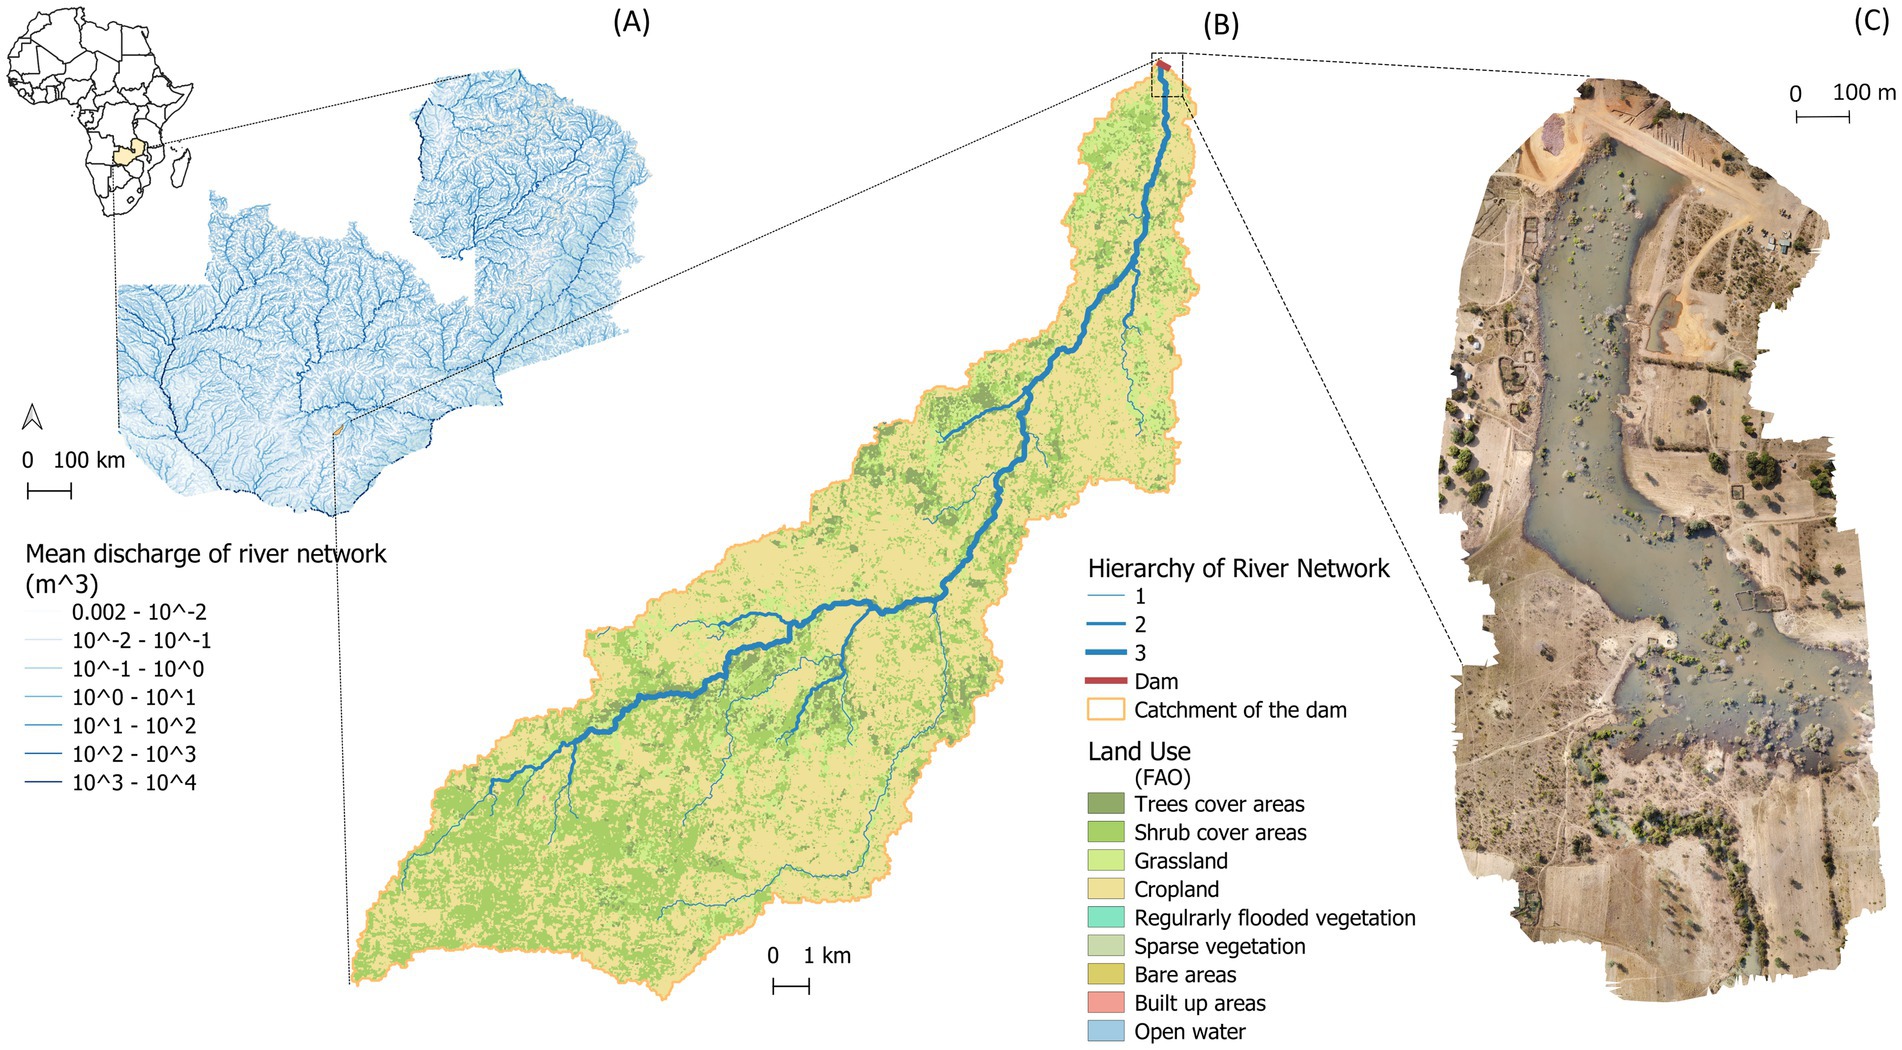
Figure 1. Multiple-scale maps with location of the study area and of the Mpinda stream catchment. (A) Location of the Mpinda catchment, Mean Discharge of river network retrieved from HydroRIVERS dataset (Lehner, et al., 2013). (B) Mpinda catchment upstream the dam, Hierarchy of river network retrieved from HydroRIVERS dataset (Lehner, et al., 2013) and Land Use mapretrieved from © ESA Climate Change Initiative - Land Cover project 2017. (C) Mosaic of drone flights over the area closest to the dam, August 2023, gently provided by WVZ.
WVZ, which has been working on WASH projects in Namwala District since 2010 (Befus and Ng’ambi, 2023), proposed to build the small dam analyzed within this paper on the Mpinda stream, a small tributary of the Kafue River. The Ministry of Agriculture of Zambia then sponsored the implementation of the infrastructure. The 17 villages surrounding the dam were consulted through interviews during the planning phase, showing positive feedbacks on the project and expressing their willingness to use the water for livestock and irrigation. The dam is 6 m high, approximately 210 m long, and has a storage capacity of about 113∙103 m3, as estimated by the construction company using the average area method (Stephens, 2010). The storage capacity was designed to fit into the morphology of the area while local water demands or future water allocation scenarios were not used for its design. As with many other streams in the region (Messager et al., 2021), the Mpinda stream is ephemeral, with higher peaks occurring in the rainy season and approximately zero flow during most of the dry season. The area is mainly composed of two hydrologic soil groups (Ross et al., 2018): those with a moderately high runoff potential (class C) and those with a high runoff potential (class D), suggesting an intrinsic susceptibility of the catchment to erosion.
The Mpinda catchment is sparsely populated, with few major settlements and many small groups of houses (villages) occupied by one or more households. The main activity is dairy farming (Kalapula and Mweemba, 2018). Traditionally, during the dry winter season, cattle are driven to the large floodplain named “Kafue Flats” (e.g., Ellenbroek, 1987) 30 km north of the study area, to overcome the lack of water, taking away the herdsmen, mainly children and young individuals, from schools. In addition to dairy farming, the inhabitants cultivate very small crop fields for their own subsistence and possess a limited number of larger fields for cereal production.
2.2 The transdisciplinary approach
An integrated approach was proposed to assess the multi-dimensional sustainability of a small dam accounting for the socio-hydrological system that is established when a new construction water reservoir is built in proximity to a rural community (Vogel et al., 2015). The approach has been tailored to the constraints posed by data-scarce areas, and to the relatively small spatial scales involved, by the interaction of a rural community with a small dam. The approach combines field investigations (social survey with interviews to the local stakeholders; topographic surveys; streamflow hydraulic measurements; river sediment sampling) with GIS analysis of field-collected and freely available environmental data from satellite sources and other global databases, and with hydrological modeling, soil erosion and sediment connectivity modeling. Technical information from the Environmental Project Brief Report (Greenstretch Ltd., 2022), that was prepared together with the technical design of the dam, was also scrutinized.
2.3 In-situ data collection
2.3.1 Social survey
The social survey was conducted before the dam was completed through in-presence structured interviews with the community (Corbetta, 2003). A careful analysis of the main stakeholders in the area was performed in collaboration with WVZ to correctly identify the sample of interviewees and to retrieve general information about the regional context (Supplementary Figure S3). Following the identification of the sample, translators nominated by WVZ led teams of interviewers to the villages in the area, with the aim of facilitating meetings and preventing miscommunication between researchers and the primary stakeholders, i.e., local inhabitants. The survey consisted of four sections, each with a distinct focus. The first section focused on the respondent’s generalities, including gender, age range, and the size of the household. The second section focused on water uses and the type and accessibility of water sources. The third section delved deeper into agricultural and irrigation practices. Finally, the fourth section explored the perceived risks associated with the dam.
A total of 60 families were surveyed in the 17 villages surrounding the study area, covering both the upstream and the downstream reaches (see Supplementary Figure S4 for general characteristics of the interviewed sample). The gathered information provided a baseline for subsequent elaborations to (1) estimate the accessibility of water resources after the completion of the dam, to (2) assess water uses and evaluate future water demands, and to (3) explore possible future effects of the new infrastructure on the local socio-hydrological system.
2.3.2 Topographic survey and hydraulic measurements
To develop a water balance of the reservoir, its bathymetry has been obtained by integration of the globally available 30-meter resolution DEM with a topographic survey conducted during the dry season (August 2023) in the area surrounding the reservoir. A Global Navigation Satellite System (GNSS) was used to survey an area of approximately 0.57 km2 including a total of 830 points. This allowed a more accurate quantification of the storage capacity of the reservoir and of its variability with the water level. The geometry of three cross-sections of the Mpinda stream that feeds the reservoir was measured, to estimate its hydraulic properties under bankfull and low flow conditions. Measurements of flow depth and velocity at these surveyed cross sections were collected at the time of the topographic survey to estimate the streamflow entering the reservoir at the beginning of the 2023 dry season.
2.4 Post-processing data analyses
2.4.1 Accessibility analysis
The construction of the dam is expected to increase the accessibility to the water resource for the local population in terms of quantity and household coverage. To quantify the number of potential beneficiaries, a Geographic Information System (GIS) analysis was conducted in the area surrounding the dam site. Automated delineation of the river network and of reservoir extension have been complemented with a manual mapping process in QGIS that identified and geolocalized rural settlements in the area using Google Satellite ® 2023 images as a reference base map. Assuming walking as the predominant mode of water and goods transportation in the area, a maximum walking time of 3 hours to and from the water source was considered, following Mostafa et al. (2024) for a rural context. According to Tobler’s hiking function (Tobler, 1993), considering the terrain slope range detected for the catchment (from −10° to 10°), the possible walking speeds are around 3–5 km/h (Mostafa et al., 2024; Pu et al., 2020). In the context of the present study, in which young people are also obliged to fetch water, the area of interest was delineated using an average walking speed of 3 km/h. This resulted in a buffer zone around the reservoir with a radius of 4.5 km, corresponding to a maximum of 9 km round trip. Within this area, a total number of 811 residential facilities were identified, not including the two villages of Chitongo (north) and Niko (south). The analysis explores four distinct scenarios, considering the combination of wet (dry) season and the presence (absence) of the river network and of the reservoir as sources of water. Moreover, the frequency distribution of livestock per inhabitant, as emerging by the interviews (Supplementary Figure S6 in SI), was applied to the number of inhabitants living within the 4.5 km radius (study area of the accessibility analysis), obtaining the number of livestock that could potentially utilize the reservoir.
2.4.2 Hydrological analysis
To estimate the flow rate time series entering the reservoir, the HEC-HMS hydrological model (Mutua and Klik, 2007) was employed. The chosen models of parametrizations are: “Simple Canopy” to estimate the canopy share, “Soil Conservation Service (SCS) Curve Number” for soil infiltration, “SCS Unit Hydrograph” to describe the shape of the peak flow rate and the lag time, and “Muskingum” for flow routing.
In the absence of on-site data, global datasets were used to feed the model. Rainfall was estimated using CHIRPS daily series, having a spatial resolution of 5.3 km. Average daily data over the catchment area were considered as representative of the entire basin. The soil characteristics and the mean conductivity of the catchment were estimated according to Ross et al. (2018) using the Global Hydrological Soil Groups (HYSOGs250m) for Curve Number map,1 with a spatial resolution of 250 m, and the Land Use/Land Cover Global dataset elaborated from Sentinel-2 for the 2023, which has a spatial resolution of 10 m. The HYSOGs250m and Land Use map were coupled to assess the CN values characterizing the 11 sub-basins of the catchment area. Monthly evaporation was estimated using the Visentini formula (Visentini, 1937), as it solely needs temperature, and considering the absence of ground data of other relevant environmental parameters:
2.4.3 Water balance and computation of water uses
The water balance of the reservoir, as defined in Eq. 2, requires that the net sum of inflow and outflow volumes over a specific time period is balanced by the variation of the stored water volume ΔV in the reservoir in the same period (Fowe et al., 2015).
The maximum reservoir volume is defined by its geometry and is 113 238 m3. QIN represents the inflow discharge from the Mpinda stream, resulting from the HEC-HMS elaboration (2.4.2) for the wet season, and assumed to be null in the dry season to represent the worst water availability conditions. P stands for precipitation, its monthly values were retrieved from the daily CHIRPS dataset in the 1990–2022 period and were assumed to be null as well in the dry season. QOUT is the discharge released by the dam into the river and was considered negligible during the dry season. E denotes evaporation from the reservoir water surface, and was estimated using the Visentini formula (Equation 1), as for the hydrological modeling. T accounts for transpiration and was considered negligible. I represents the infiltration and was considered negligible due to the clay-rich composition of the soil and the compacting work carried out during the construction of the reservoir, which further reduced the soil infiltration capacity.
WDU, WIR, and WLS are water withdrawals for domestic, irrigation, and livestock uses, respectively. WDU was estimated through the interviews, while different allocation scenarios were explored for WIR and WL. In particular, we have computer WIR as the water demand for maize and tomatoes, two crops that emerged as widely common by the interviewees, using the CropWat 8.0 software (Allen et al., 1998; Steduto et al., 2012). On the other hand, WLS was estimated as 50 L/day per cow, according to the daily water consumption guidelines of livestock provided by FAO (2019). These terms represent the water volumes that can be allocated to the main economic activities of the area. A Pareto front, which is a multi-objective analysis tool commonly used in water management analyses (Peña-Torres et al., 2024), was employed to analyze the proposed water allocation scenarios combining agricultural and livestock demands.
2.4.4 Catchment-scale sediment production and connectivity
The Revised Universal Soil Loss Equation (RUSLE) raster-based model is employed to assess the annual potential soil loss of the watershed upstream the reservoir (Renard et al., 1997; Kumar et al., 2022). This model combines five factors that account for the main influencing components, and defines the annual soil loss as follows:
The R factor represents the rainfall erosivity and was computed as the average resulting from the monthly rainfall erosivity global dataset (Panagos et al., 2017). The K factor represents the soil erodibility and was assumed equal to the Ksat in the global soil erodibility dataset (Gupta et al., 2024). The LS factor represents the slope length and steepness and accounts for the topography and morphology of the watershed. Its value was assessed by using the definition proposed by Moore and Burch (1986), applying the r.watershed function for evaluating the flow accumulation at each pixel in a GIS analysis. The C factor represents the cover management factor and was assessed by translating the land use and land cover raster maps into coefficients of management according to Olika et al. (2023). Finally, the P factor accounts for soil conservation practices undertaken in the watershed and was assessed by translating the land use and land cover map into coefficients representing the ability of the areas to reduce the soil loss (Olika et al., 2023).
To develop upper estimates of the maximum siltation rates, the local potential soil loss is weighted through a measure of catchment sediment connectivity, thus limiting the fraction of potentially erodible soil that can actually reach the reservoir. Sediment connectivity was assessed through the SedInConnect tool (Crema and Cavalli, 2018). It computes the dimensionless, topography-based Index of Connectivity (IC), which accounts for potential sediment connectivity between the different parts of the catchment (Trevisani and Cavalli, 2016). IC is defined in Eq. 4 as the logarithm of the ratio between an upslope and a downslope length:
where expresses the potential for downward routing of the sediment that is produced upslope while takes into account the flow path length that a particle needs to travel to arrive at the closest target or sink. A weighting factor appears in both components of the IC to model the impedance to runoff and sediment fluxes (Trevisani and Cavalli, 2016).
The enhanced DEM was used as an input for IC computation, preserving the catchment’s original morphology (Crema and Cavalli, 2018). Surface roughness was computed following the approach proposed by Cavalli et al. (2008), considering a 5×5-pixel window for its investigation and using the refined DEM without filling local depressions. The obtained IC was then manually normalized through the QGIS raster calculator following the procedure of Trevisani and Cavalli (2016). Thereafter, the amount of sediments arriving at river network E (t/ha per year) was computed by multiplying the potential annual soil loss A obtained with RUSLE and the probability of connectivity (normalized IC), as shown in Eq. 5:
The sediment mass is converted into accumulated sediment volume in the reservoir by estimating the dry density of collected sediment samples and assuming a standard sediment porosity value of 0.6.
The maximum potential erodible volume of sediments Vpot,er in the whole catchment area connected to the reservoir was then estimated by summing the contributions from each element constituting the raster E. The lowest limit of the time needed for sediments to completely fill the reservoir volume was computed using Eq. 6:
where is the design volume of the dam and is the potential yearly erodible sediment volume hydrologically connected to the reservoir.
3 Results
3.1 Accessibility of the water source
Considering an average household size of nine persons, as emerged from the interviews, a total of 7300 people was estimated to live within 4.5 km distance from the dam. The interviews did not explicitly request quantification of the distance between the dwelling and the nearest freshwater source. Therefore, the distance of each household to the closest water source was computed for each scenario (with exception of the dry season without the dam, due to the absence of water sources), and converted into walking time distribution into different classes at 5-min intervals (Supplementary Table S1). Given the absence of significant topographical variations and obstacles within the area of interest, the 5-min walking time can be converted into a 250-meters distance.
The scenario referring to the rainy season in the absence of the reservoir demonstrates that the river network is accessible within 30 min by 88% of the population. This suggests that the expansion of rural settlements has occurred in a way that ensures a reasonable distance is maintained from freshwater sources (Figure 2A). The second scenario (Figure 2B), compared with the first, includes the presence of the reservoir. Here, the accessibility of water resources is not significantly enhanced, as the river network is already extensive in the area during the rainy season. The third scenario (dry season without the reservoir) is instead characterized by the absence of freshwater within a radius of 4.5 km. Consequently, the population is compelled to source water from alternative sources, which is confirmed by the outcomes of the interviews. In the fourth scenario (dry season with the reservoir), 50% of the population can reach the reservoir within a minimum of 1 hour’s walk (Figure 2C). This quantifies how much the reservoir enhance accessibility to a water source in the dry-season.
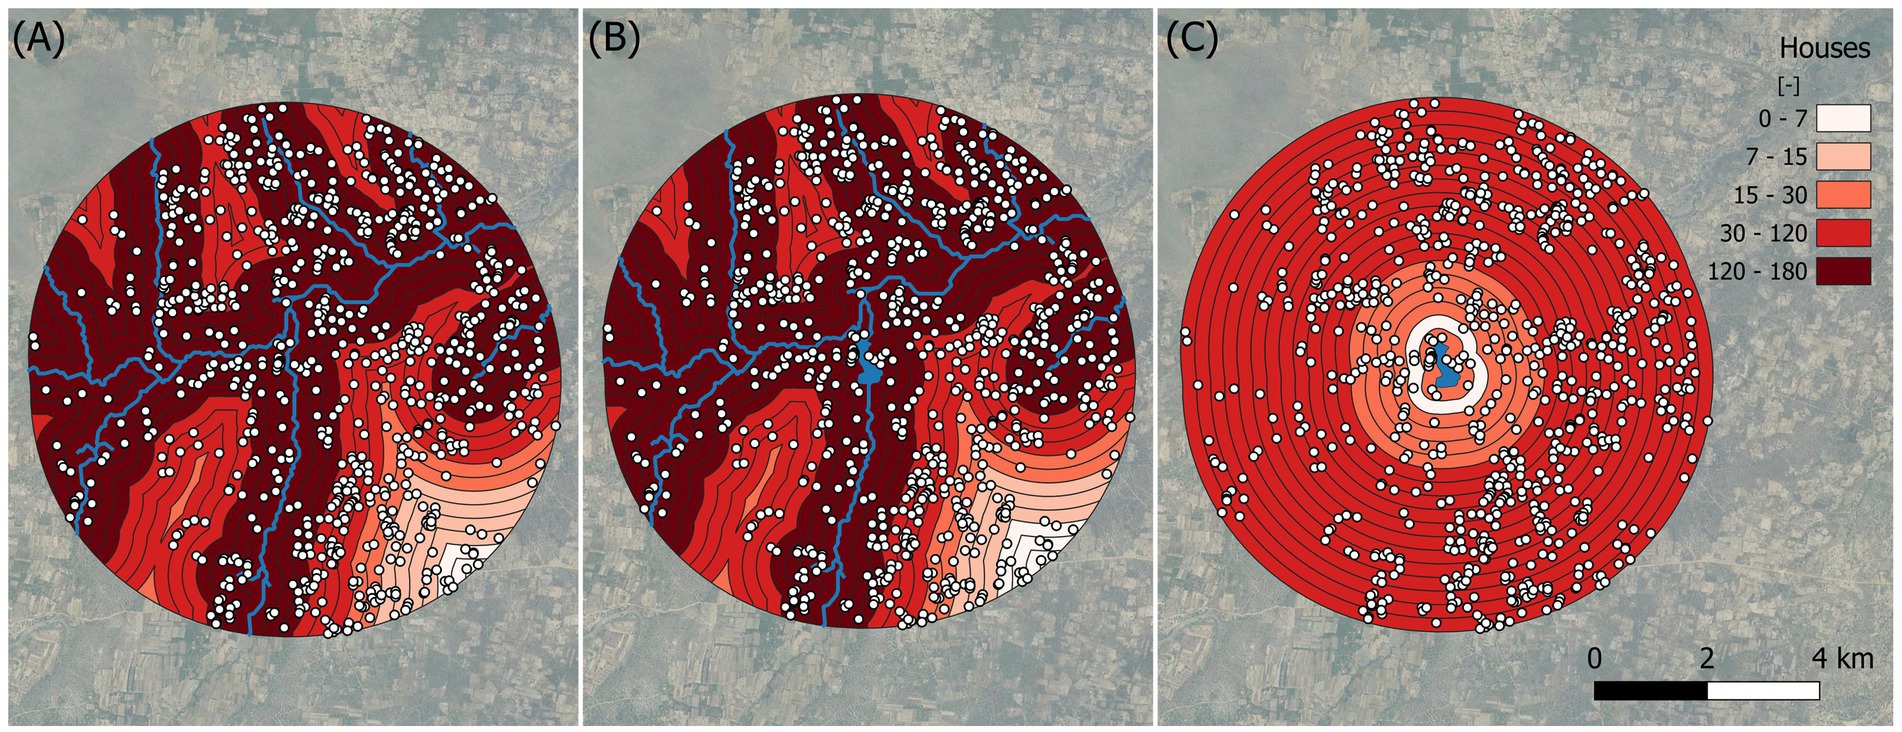
Figure 2. Accessibility maps of the three simulated scenarios. Contour lines refer to 250 m distance intervals from the water source (or 5 min walking time). Color shades that fill accessibility contour lines refer to the number of households in the shaded area. Scenarios: (A) rainy season, no reservoir; (B) rainy season, with reservoir; (C) dry season, with reservoir.
By applying the distribution of number of cattles per household, as determined in the interviewed sample, in the same proportion to the estimated population within the area affected by the reservoir, we estimated nearly 20 thousands (19 875) cows that may have access to the reservoir. Within this projection, only 67 households have herds with more than 100 cattles, while the majority (607 households) have herds with less than 20 cattles.
3.2 Water balance and water demand
The interviews highlighted that, before the dam was finalized, the population’s choice of different water sources depends on the purpose for which water is used. Figure 3A, for instance, illustrates how the watering of livestock is typically accomplished by withdrawing from the Mpinda River, while the majority of the population relies on boreholes for domestic purposes. A notable outcome of the interviews is the multifaceted approach to irrigation, mainly realized through bucket systems, which encompasses rainfall, deep and shallow wells, to ensure adequate water supply.
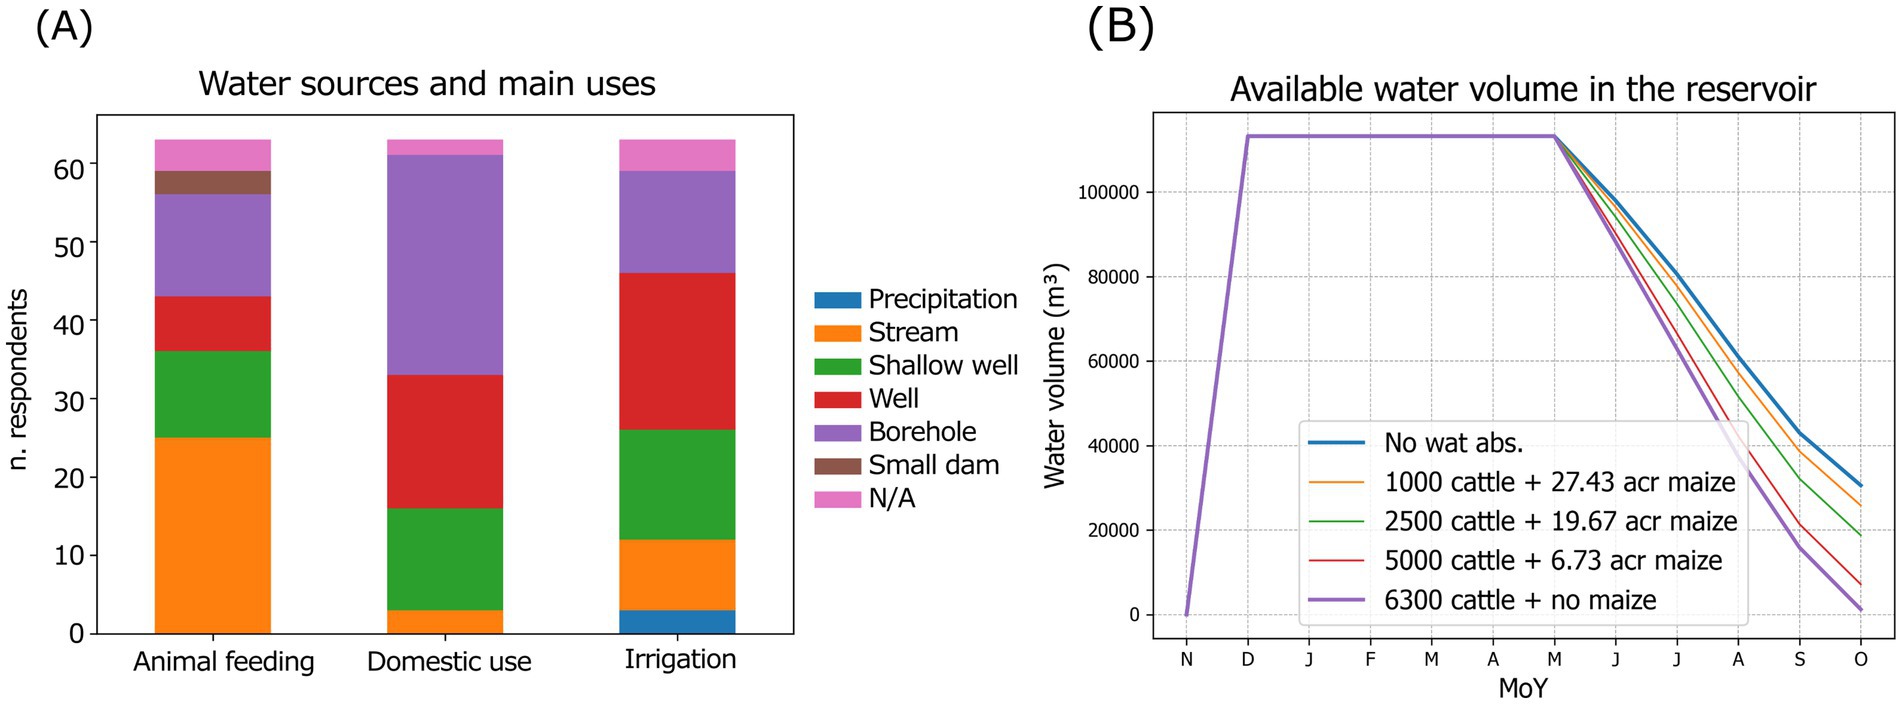
Figure 3. Used water sources before the dam’s completion and projected reservoir water allocation scenarios. (A) Main water sources and their uses as reported by the interviews. (B) Time evolution of the available water volume in the reservoir under different, single-use, water allocation scenarios.
The interviews further revealed that farmers maintain herds of approximately 25 animals on average, with a median value of 6. A rather unbalanced cattle distribution within the community appears, with the majority of shepherds possessing a modest number of cattle, with a few large herds having up to 300 animals. Most of the interviewees have relatively small crop fields of 3.6 acres on average (median value 3.2 acres), where they mainly grow maize, potatoes, beans, and groundnut, suggesting the prevalence of subsistence agriculture in the region. In terms of daily water consumption, the interviews indicate that the total sample (60 families comprising 532 people) uses about 24 m3 for irrigating around 87 ha and 41 m3 for livestock (around 1,500 cattles). It is important to highlight that these quantities have been declared by interviewees and could not be quantitatively verified.
The water balance was calculated for the dry months to simulate the conditions of peak water demand. The extreme values of the Pareto front were calculated for different scenarios, each under the assumption that the entire volume, available at the beginning of the dry season, would be entirely used by the end of the dry season for one single purpose, either for livestock or for a cultivated species. The inflow rate QIN, which was computed with HEC-HMS for an entire average year, is zero during the dry season. This allows us to assume that the water level of the reservoir does not reach the overflow level, preventing water from flowing in the spillway during the same period (QOUT = 0). In the scenario with the reservoir being used for the sole purpose of watering cattle, a maximum of 6,300 animals could be watered for the entire dry season. Conversely, if the reservoir were used solely for irrigation, either 21.9 acres of tomatoes or 38.0 acres of maize could be cultivated. Figure 3B shows outcomes of the dry season water balance under different scenarios of water allocations, considering only livestock and maize cultivation. It highlights that the less consumptive model (yellow line) would allow at least one more month of water availability in the reservoir at the end of the average dry season, compared to the most consumptive one (purple line).
Should the entire reservoir volume be allocated only to animal consumption during the dry season, the water balance indicates that the demand of 6 300 out of 19 785 cattle (32%) can be satisfied, potentially leading to an imbalanced water availability within the community.
3.3 Reservoir siltation
The Environmental Project Brief Report of the Chitongo dam (Greenstretch Ltd., 2022) reports a reservoir lifespan of 117 years, based on an empirical estimate (Mahmood, 1987) of the annual siltation rates obtained as a fixed percentage (0.65%) of the mean annual runoff in the country (60 mm) over the catchment area of interest. The expected minimum lifespan is reduced to 77 years if the durability, stability and strength of the materials to be used are considered.
The procedure implemented in the present work, coupling the RUSLE raster-based model and SedInConnect tool (section 2.4.4) proposes a more physically based approach. After delineating the maps of the five factors (Equation 3) necessary for the implementation of the raster-based RUSLE model, the map of potential annual soil loss for the entire basin was obtained taking into account an annual rainfall value equal to the average annual value calculated over the period 1990–2022 (Figure 4A). Figure 4B shows the connectivity map resulting from SedInConnect implementation, before the IC normalization procedure is performed, with larger IC values corresponding to higher connectivity. A dry sediment density of 2,513 kg/m3 was measured in the laboratory from the collected sediment samples. Assuming a sediment porosity of 0.6, the maximum potential annual volume of sediments that are transportable by the river network is estimated in 4738 m3 per year. The corresponding lowest time interval needed for sediments to completely fill the reservoir volume is therefore 24 years. In reality, the long-term operability of the infrastructure might be severely compromised when only a fraction (e.g., 50%) of its available capacity is lost due to siltation. In this sense, the lower limit of time needed to fill the reservoir volume would further reduce. It is important to note that the computed values represent a lower limit because the actual transport processes of potentially erodible sediments in the channel network, which may yield smaller transport rates, are not accounted for in our proposed method. This leads to suggest that the actual time of reservoir filling could be some tens of years.
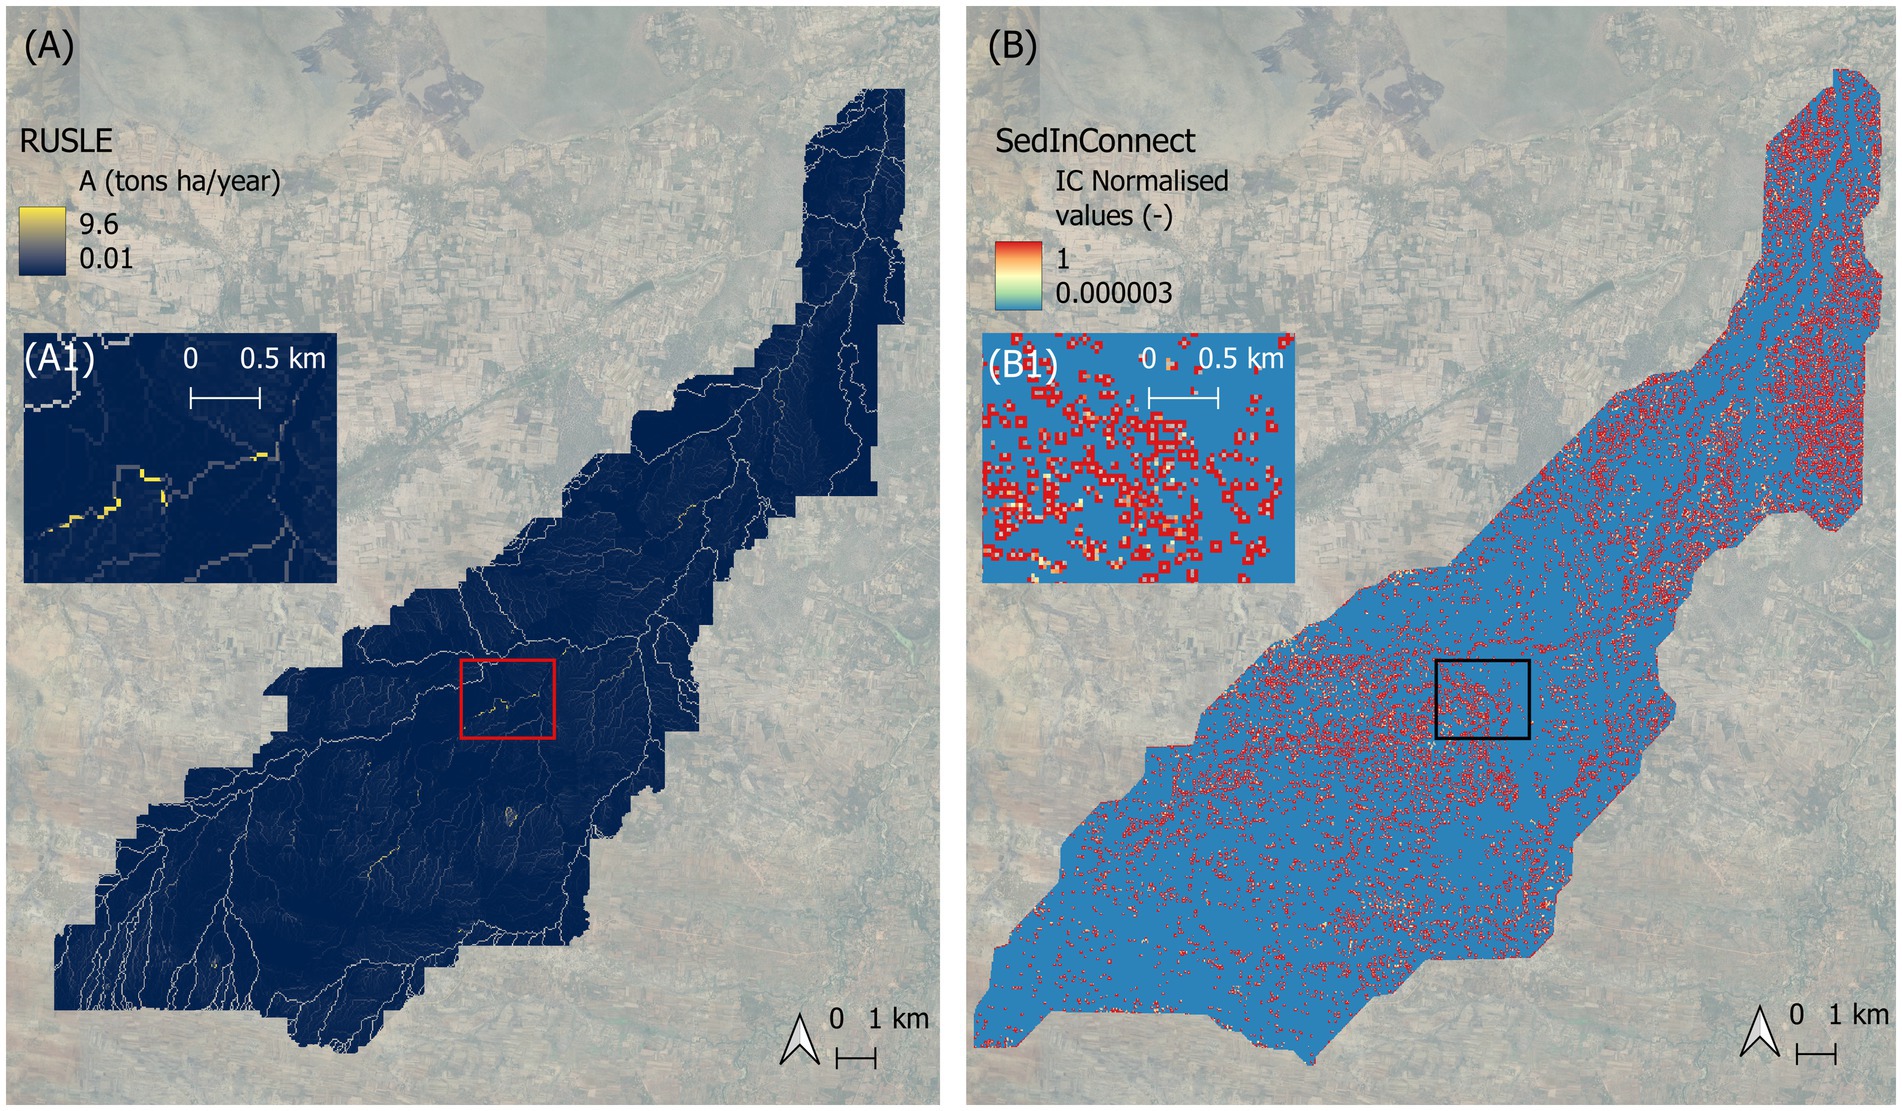
Figure 4. Erosion yield of the catchment and its connectivity. (A) Results from RUSLE, (A1) zoom-in of (A) panel, (B) results from SedinConnect, (B1) zoom in of (B) panel.
4 Discussion and final remarks
The dam on the Mpinda River was built with the aim of increasing water availability in the area to ultimately improve the livelihood conditions of the rural community. Three key sustainability elements have been covered by our transdisciplinary analysis: accessibility to water sources, increased water availability and time scales of reservoir siltation. Quantitative results obtained for each of these elements are now used to qualitatively discuss possible emerging dynamics and feedbacks between the new intervention and the local communities. Such discussion finally suggests future dam management strategies to maximize its positive impacts on such socio-hydrological systems.
The first analyzed sustainability element concerned water accessibility. This study demonstrates that the construction of the dam would enable 50% of the population living within a radius of 4.5 km of the dam to access the reservoir in 1-h walk during the dry season (Figure 2C). This is particularly noteworthy when considering the absence of freshwater sources in the dry season prior to dam construction. The second element of the analysis regarded the coverage of the present and future water demands. The water balance indicates that the reservoir, with a maximum storable water of 113 238 m3, could allow for some increase in livestock size or expansion of cultivated fields, or for extending the availability of a modest water storage for about one-month after the end of the dry season (Figure 3B). This implies that the cattle seasonal migration to the Kafue flats can be partially reduced. Finally, reservoir durability related to siltation associated with erosion occurring in the upstream catchment was analyzed. Controlling siltation is a necessary step to understand either the erosion rate or the sediment yield in the basin (De Vente and Poesen, 2005). Satellite sources do not provide sufficient information to assess siltation rate in other nearby reservoirs in the area (Supplementary Figure S5). However, previous studies in the Southern Province (Mwiinde, 2017) reported that siltation commonly reduces reservoir capacity in that area, and that local dams have comparable annual siltation rates to the Chitongo dam. The Choma Dam, with an erosion rate of 145.9 tons per year per km2, exhibited a 45.1% diminution of its initial capacity over 60 years, while the Munzuma Dam, with an erosion rate of 51.3 tons per year per km2, registered a 25% reduction over 44 years. Our estimated annual siltation rate of 61.1 tons per year per km2 (some tens of years for filling a significant portion of the reservoir volume) is comparable with the few reported observations in the local area.
Possible effects of the new infrastructure on the local socio-hydrological system can be discussed qualitatively starting from the developed quantitative baseline. The causal loop diagram in Figure 5 was developed to this purpose, bearing in mind the high uncertainties related to the prediction of social impacts of small dam construction (Castelli et al., 2022).
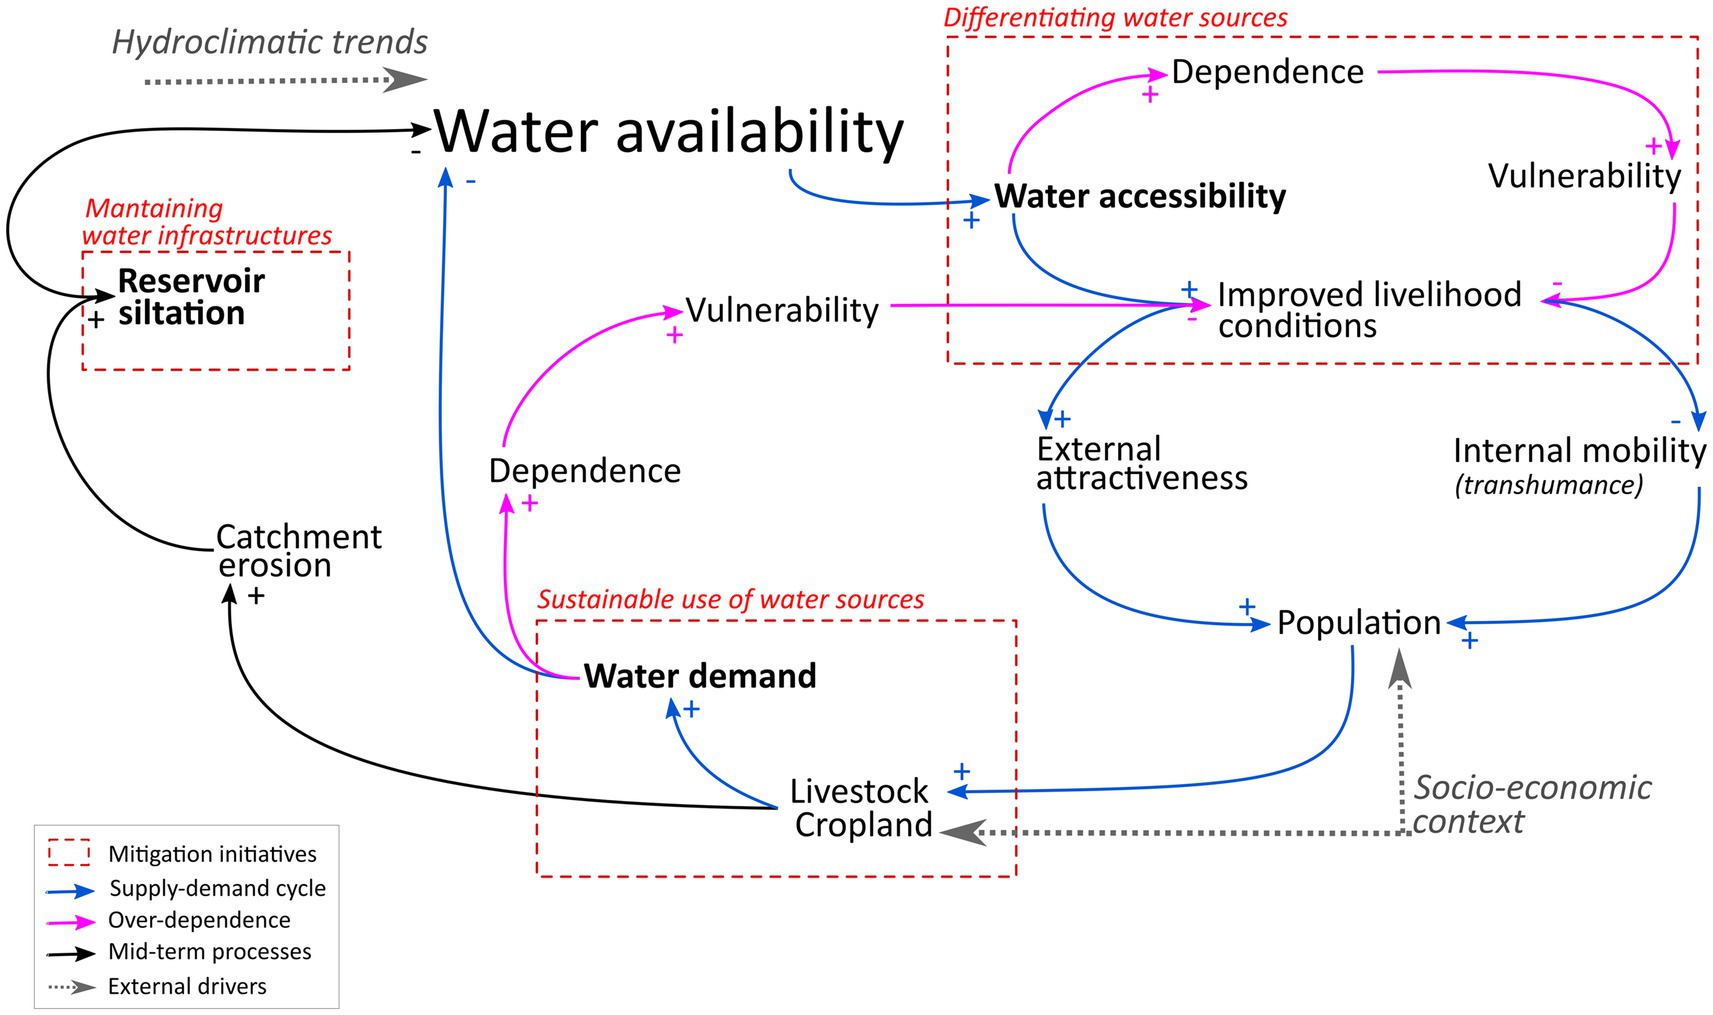
Figure 5. Causal loop diagram of the socio-hydrological system showing the positive (+) and negative (−) links between variables. The socio-hydrological system in Chitongo may lead to: (1) an increased risk of overdependence (purple), a reinforcing loop of supply–demand (blue), and (3) an increased reservoir siltation at mid-term (black). External drivers (gray and italics) may further alter certain variables, while mitigation actions (red frames) can reduce the negative externalities on water availability or livelihood conditions.
A first mechanism that may occur in the new socio-ecological system is the supply–demand cycle (Di Baldassarre et al., 2019; Kallis, 2010), shown by the blue path in Figure 5. In our case study, few families (67) of the area have herds counting more than 100 cattles, while the majority of households (607) have less than 20 cattles each, based on the interviewed sample. The increased water availability and accessibility could lead to an increase in the investment capacity of the larger herds, potentially enlarging their livestock, or attract herdsmen from neighboring areas, leading in both cases to an increased water demand. Another effect produced by the year-round water availability consists in a permanent presence of livestock on the land, thereby increasing the risk of soil degradation and, therefore, of siltation rates due to the permanent grazing (Piemontese et al., 2024; black path in Figure 5). Another tangible risk is over-dependence on the new water infrastructure, displayed by pink path in Figure 5. Indeed, increased accessibility and water demand may lead to over-rely on the new water sources, becoming more vulnerable in case of external shocks, such as hydro-climatic trends and or larger-scale changes in the socio-economic context (Acheampong et al., 2014; Di Baldassarre et al., 2018; Mweemba et al., 2011; Piemontese et al., 2024), thereby hampering the desired improvements in local livelihood conditions.
The red frames in Figure 5 identify where mitigation measures can be effective in contrasting these possible adverse dynamics. For instance, considering and ensuring alternative water sources, a practice that is already prevalent in the region (Figure 3A), can mitigate the risk of overdependence generated by water accessibility. Similarly, a sustainable (not unlimited) use of water sources could avoid an excessive increase in water demand. An example of this is related to the outcomes of the simplified Pareto front analysis for designing water allocation scenarios, which combines water uses for livestock and farming. In this respect, policy making at a higher (regional or state) level should prioritize sustainable and integrated water management practices, such as water allocation plans that facilitate strategic use of the resource that encourage water saving practices (Anghileri et al., 2024). The last mitigation action that can ensure a longer durability of water accessibility consists in monitoring and controlling/delaying siltation (Valentin and Rajot, 2018). Inadequate maintenance is the primary cause of reduced storage capacity of dams in Southern Province of Zambia (Sichingabula, 1997). Policy makers and local authorities should invest in their sustainable management (Owusu et al., 2022; Owusu et al., 2020), and establish community-based management structures to ensure that local community have a stake in the long-term operability of dams (Simweene and Muchanga, 2021, Kelly et al., 2017). A post-construction interview with WVZ revealed that a local steering committee was established to manage the dam, comprising community leaders and beneficiaries, who can draw on the technical expertise provided by the Ministry of Agriculture.
Finally, three main needs for further monitoring and investigation must be highlighted. A follow-up survey after some years of functioning would allow a better understanding of actual impacts of the water infrastructure, to be compared against the baseline developed in this study about the pre-construction socio-hydrological system. Secondly, further investigations should address other relevant points concerning the compliance with water quality standards and eutrophication risk, as these could negatively affect the water use despite the improved availability. Moreover, the analysis of possible risks arising downstream of the dam should be in general included. In the presented case study, downstream villages location and valley morphology suggested such risk to be negligible.
In conclusion, the present research shows the relevance of a transdisciplinary approach to develop a quantitative assessment of the sustainability of water harvesting techniques, which allows to envisage possibly emerging socio-hydrological dynamics and feedback loops after their construction and operation. By involving local communities and technical advisors in decision-making for water resource management, and by investing in infrastructure maintenance, it is possible to suggest how the operability of these critical water harvesting practices can be extended to provide balanced benefits to local communities. Such a transdisciplinary approach is a viable option to address inadequate coverage of historical socio-environmental data, a very common feature in rural areas. While the use of global datasets facilitated the retrieval of general valuable information for the environmental characterization of the area, field campaigns were critical at this scale to more precisely quantify and assess the characteristics of the socio-hydrological system. In the present study, this was possible thanks to a tight collaboration between academia, a developmental non-profit organization and the local community, suggesting the high potential of such multi-actor partnership for local-scale research.
Data availability statement
The datasets presented in this study can be found in online repositories. The data collected through interviews for this study can be found in the Zenodo repository at this link: https://zenodo.org/records/15090514.
Ethics statement
The studies involving humans were approved by Ethics Committee of World Vision Zambia. The studies were conducted in accordance with the local legislation and institutional requirements. The participants provided their written informed consent to participate in this study.
Author contributions
LS: Conceptualization, Data curation, Investigation, Methodology, Supervision, Writing – original draft, Writing – review & editing, Formal analysis. SC: Data curation, Formal analysis, Investigation, Visualization, Writing – original draft. AF: Data curation, Investigation, Visualization, Writing – review & editing. DA: Formal analysis, Investigation, Methodology, Supervision, Writing – review & editing. MK: Data curation, Investigation, Methodology, Writing – review & editing. MG: Data curation, Formal analysis, Investigation, Methodology, Writing – review & editing. CC: Data curation, Investigation, Methodology, Writing – review & editing. FM: Investigation, Writing – review & editing. ST: Investigation, Writing – review & editing. JK: Conceptualization, Investigation, Supervision, Writing – review & editing. KB: Resources, Supervision, Writing – review & editing. MB: Conceptualization, Funding acquisition, Investigation, Methodology, Project administration, Supervision, Writing – review & editing. MZ: Supervision, Writing – review & editing. MN: Funding acquisition, Project administration, Resources, Supervision, Writing – review & editing. GZ: Conceptualization, Funding acquisition, Investigation, Resources, Supervision, Writing – review & editing, Methodology, Writing – original draft.
Funding
The author(s) declare that financial support was received for the research and/or publication of this article. Financial support was provided by internal funds of the University of Trento Strategic Plan 2022–2025 and by the private donation of Vigliani’s Family in memory of the pioneering environmental engineering work of Eng. Piergiorgio Vigliani since the 1970s.
Acknowledgments
The present work was developed within the SEED program coordinated by the UNESCO Chair in Engineering for Human and Sustainable Development of the University of Trento. The authors express their gratitude to World Vision-Zambia, who provided fundamental support to the logistics and interaction with local stakeholders during the fieldwork activities. The contribution of all local translators/intermediators, of the interviewees, and of the other students from the University of Trento and from the University of Zambia involved in the fieldwork (excluding the authors) is also acknowledged: Bica A., Berisha Q., Cardelli D., Kabika B., Leonardelli A., Lyoba C., Mulugeta T., Nunziati C.
Conflict of interest
The authors declare that the research was conducted in the absence of any commercial or financial relationships that could be construed as a potential conflict of interest.
Generative AI statement
The authors declare that no Gen AI was used in the creation of this manuscript.
Publisher’s note
All claims expressed in this article are solely those of the authors and do not necessarily represent those of their affiliated organizations, or those of the publisher, the editors and the reviewers. Any product that may be evaluated in this article, or claim that may be made by its manufacturer, is not guaranteed or endorsed by the publisher.
Supplementary material
The Supplementary material for this article can be found online at: https://www.frontiersin.org/articles/10.3389/frwa.2025.1603004/full#supplementary-material
Footnotes
References
2022-2026 Strategic plan (2022). Ministry of water development and sanitation, Republic of Zambia. Lusaka, Zambia: Lusaka water supply and Sanitation Company.
Acheampong, E. N., Ozor, N., and Sekyi-Annan, E. (2014). Development of small dams and their impact on livelihoods: cases from northern Ghana. Afr. J. Agric. Res. 9, 1867–1877. doi: 10.5897/AJAR2014.8610
Alahiane, N., Mouden, A. E., Lhaj, A. A., and Boutaleb, S. (2014). Practical method proposed to estimate silting’s rate in small and hillside dams. J. Water Resour. Prot. 6, 930–943. doi: 10.4236/jwarp.2014.610088
Allen, R. G., Pereira, L. S., Raes, D., and Smith, M. (1998). Crop evapotranspiration - guidelines for computing crop water requirements (no. 56). Rome: FAO.
Andreini, M., Schuetz, T., and Harrington, L. (2009). Small reservoirs toolkit. Colombo: International Water Management Institute.
Anghileri, D., Pastori, M., Marcos-Garcia, P., Umlauf, G., Crestaz, E., Seliger, R., et al. (2024). Global water challenges in sub-Saharan Africa and how to strengthen science-policy dialogues on transboundary river basins. J. Environ. Manag. 365:121417. doi: 10.1016/j.jenvman.2024.121417
Baguma, D., Loiskandl, W., and Jung, H. (2010). Water management, rainwater harvesting and predictive variables in rural households. Water Resour. Manag. 24, 3333–3348. doi: 10.1007/s11269-010-9609-9
Barron, J., and Salas, J. C. (2009). Rainwater harvesting: a lifeline for human well-being. Nairobi: UNEP.
Basel, B., Hoogesteger, J., and Hellegers, P. (2022). Promise and paradox: a critical sociohydrological perspective on small-scale managed aquifer recharge. Front. Water 4:1002721. doi: 10.3389/frwa.2022.1002721
Beck, H. E., Zimmermann, N. E., McVicar, T. R., Vergopolan, N., Berg, A., and Wood, E. F. (2018). Present and future Köppen-Geiger climate classification maps at 1-km resolution. Sci. Data 5:180214. doi: 10.1038/sdata.2018.214
Befus, J., and Ng’ambi, M. (2023). Integrated water, sanitation and hygiene - iWASH (capacity statement). Zambia: World Vision-Zambia.
Berhane, G., Gebreyohannes, T., Martens, K., and Walraevens, K. (2016). Overview of micro-dam reservoirs (MDR) in Tigray (northern Ethiopia): challenges and benefits. J. Afr. Earth Sci. 123, 210–222. doi: 10.1016/j.jafrearsci.2016.07.022
Biasutti, M., and Sobel, A. H. (2009). Delayed Sahel rainfall and global seasonal cycle in a warmer climate. Geophys. Res. Lett. 36:2009GL041303. doi: 10.1029/2009GL041303
Castelli, G., Piemontese, L., Quinn, R., Aerts, J., Elsner, P., Ertsen, M., et al. (2022). Sand dams for sustainable water management: challenges and future opportunities. Sci. Total Environ. 838:156126. doi: 10.1016/j.scitotenv.2022.156126
Cavalli, M., Tarolli, P., Marchi, L., and Dalla Fontana, G. (2008). The effectiveness of airborne LiDAR data in the recognition of channel-bed morphology. Catena 73, 249–260. doi: 10.1016/j.catena.2007.11.001
Corbetta, P. (2003). Social research: theory, methods and techniques. Washington, DC: SAGE Publications, Ltd.
Coviello, V., Vezza, P., Angeluccetti, I., and Grimaldi, S. (2015). Reducing the impact of soil erosion and reservoir siltation on agricultural production and water availability: the case study of the Laaba catchment (Burkina Faso). Barcelona: Global Dimension in Engineering Education.
Crema, S., and Cavalli, M. (2018). Sedinconnect: a stand-alone, free and open source tool for the assessment of sediment connectivity. Comput. Geosci. 111, 39–45. doi: 10.1016/j.cageo.2017.10.009
De Vente, J., and Poesen, J. (2005). Predicting soil erosion and sediment yield at the basin scale: scale issues and semi-quantitative models. Earth-Sci. Rev. 71, 95–125. doi: 10.1016/j.earscirev.2005.02.002
Dejenie, T., Asmelash, T., De Meester, L., Mulugeta, A., Gebrekidan, A., Risch, S., et al. (2008). Limnological and ecological characteristics of tropical highland reservoirs in Tigray, northern Ethiopia. Hydrobiologia 610, 193–209. doi: 10.1007/s10750-008-9435-8
Di Baldassarre, G., Sivapalan, M., Rusca, M., Cudennec, C., Garcia, M., Kreibich, H., et al. (2019). Sociohydrology: scientific challenges in addressing the sustainable development goals. Water Resour. Res. 55, 6327–6355. doi: 10.1029/2018WR023901
Di Baldassarre, G., Wanders, N., AghaKouchak, A., Kuil, L., Rangecroft, S., Veldkamp, T. I. E., et al. (2018). Water shortages worsened by reservoir effects. Nat. Sustain. 1, 617–622. doi: 10.1038/s41893-018-0159-0
Ellenbroek, G. A. (1987). Ecology and productivity of an African wetland system. Boston: Dr. W. Junk Publishers.
Fowe, T., Karambiri, H., Paturel, J.-E., Poussin, J.-C., and Cecchi, P. (2015). Water balance of small reservoirs in the Volta basin: a case study of Boura reservoir in Burkina Faso. Agric. Water Manag. 152, 99–109. doi: 10.1016/j.agwat.2015.01.006
Greenstretch Ltd. (2022). The environmental project brief for the proposed construction of the Chitongo earth dam in Namwala District of Southern Province Zambia. Zambia: Greenstretch Ltd.
Gupta, S., Borrelli, P., Panagos, P., and Alewell, C. (2024). An advanced global soil erodibility (K) assessment including the effects of saturated hydraulic conductivity. Sci. Total Environ. 908:168249. doi: 10.1016/j.scitotenv.2023.168249
Gwenzi, W., Dunjana, N., Pisa, C., Tauro, T., and Nyamadzawo, G. (2015). Water quality and public health risks associated with roof rainwater harvesting systems for potable supply: review and perspectives. Sustain. Water Qual. Ecol. 6, 107–118. doi: 10.1016/j.swaqe.2015.01.006
Haregeweyn, N., Poesen, J., Nyssen, J., De Wit, J., Haile, M., Govers, G., et al. (2006). Reservoirs in Tigray (northern Ethiopia): characteristics and sediment deposition problems. Land Degrad. Dev. 17, 211–230. doi: 10.1002/ldr.698
Ingrao, C., Strippoli, R., Lagioia, G., and Huisingh, D. (2023). Water scarcity in agriculture: an overview of causes, impacts and approaches for reducing the risks. Heliyon 9:e18507. doi: 10.1016/j.heliyon.2023.e18507
Kalapula, S., and Mweemba, L. (2018). Social-ecological typologies to climate variability among pastoralists in Namwala district – Zambia. Int. J. Sociol. Anthropol. 2, 8–24.
Kallis, G. (2010). Coevolution in water resource development. Ecol. Econ. 69, 796–809. doi: 10.1016/j.ecolecon.2008.07.025
Kelly, E., Lee, K., Schields, K. F., Cronk, R., Behnke, N., Klug, T., et al. (2017). The role of social capital and sense of ownership in rural community-managed water systems: Qualitative evidence from Ghana, Kenya, and Zambia. Journal of Rural Studies, 56, 156–166. doi: 10.1016/j.jrurstud.2017.08.021
Kumar, M., Sahu, A. P., Sahoo, N., Dash, S. S., Raul, S. K., and Panigrahi, B. (2022). Global-scale application of the RUSLE model: a comprehensive review. Hydrol. Sci. J. 67, 806–830. doi: 10.1080/02626667.2021.2020277
Lang, D. J., Wiek, A., Bergmann, M., Stauffacher, M., Martens, P., Moll, P., et al. (2012). Transdisciplinary research in sustainability science: practice, principles, and challenges. Sustain. Sci. 7, 25–43. doi: 10.1007/s11625-011-0149-x
Lehner, B., and Grill, G. (2013). Global river hydrography and network routing: baseline data and new approaches to study the world\u0027s large river systems. Hydrological Processes, 27:2171–2186. doi: 10.1002/hyp.9740
Leal Filho, W., and Trincheria Gomez, J.De Rainwater-smart agriculture in arid and semi-arid areas Springer International Publishing Cham (2018)
Mahmood, K. (1987). Reservoir sedimentation. Impact, extent, and mitigation (no. 71). Washington, D.C.: World Bank.
Mancosu, N., Snyder, R., Kyriakakis, G., and Spano, D. (2015). Water scarcity and future challenges for food production. Water 7, 975–992. doi: 10.3390/w7030975
Mensah, P., Katerere, D., Hachigonta, S., and Roodt, A. (2018). Systems analysis approach for complex global challenges. Cham: Springer International Publishing.
Messager, M. L., Lehner, B., Cockburn, C., Lamouroux, N., Pella, H., Snelder, T., et al. (2021). Global prevalence of non-perennial rivers and streams. Nature 594, 391–397. doi: 10.1038/s41586-021-03565-5
Moore, I. D., and Burch, G. J. (1986). Physical basis of the length-slope factor in the universal soil loss equation. Soil Sci. Soc. Am. J. 50, 1294–1298. doi: 10.2136/sssaj1986.03615995005000050042x
Mostafa, M. A., Ogunmuyiwa, O. J., Appleby Tenney, K., Tip, L. S., and Zegarra Zamalloa, C. O. (2024). Health for all: primary care facility localization in Lesotho using qualitative research and GIS. Glob. Transit. 6, 123–135. doi: 10.1016/j.glt.2024.05.002
Mutua, B. M., and Klik, A. (2007). Predicting daily streamflow in ungauged rural catchments: the case of Masinga catchment, Kenya. Hydrol. Sci. J. 52, 292–304. doi: 10.1623/hysj.52.2.292
Mweemba, C. E., Funder, M., Nyambe, I., and Van Koppen, B. (2011). Poverty and access to water in Namwala district, Zambia: Report on the results from a household questionnaire survey (no. 19). Zambia: Danish Institute for International Studies.
Mwiinde, D. (2017). Cost benefit analysis of sediment and sedimentation in selected small dams in Lusaka and southern provinces, Zambia (MSc). Lusaka: University of Zambia.
Ngigi, S. N., Savenije, H. H. G., Rockström, J., and Gachene, C. K. (2005). Hydro-economic evaluation of rainwater harvesting and management technologies: farmers’ investment options and risks in semi-arid Laikipia district of Kenya. Phys. Chem. Earth. Part A/B/C 30, 772–782. doi: 10.1016/j.pce.2005.08.020
Nkhoma, B. (2011). The politics, development and problems of small irrigation dams in Malawi: experiences from Mzuzu ADD 4. Water Alternat. 4, 383–398.
Ofori, S. A., Cobbina, S. J., and Obiri, S. (2021). Climate change, land, water, and food security: perspectives from sub-Saharan Africa. Front. Sustain. Food Syst. 5:680924. doi: 10.3389/fsufs.2021.680924
Olika, G., Fikadu, G., and Gedefa, B. (2023). GIS based soil loss assessment using RUSLE model: a case of Horo district, western Ethiopia. Heliyon 9:e13313. doi: 10.1016/j.heliyon.2023.e13313
Ostrom, E. (2009). A general framework for analyzing sustainability of social-ecological systems. Science 325, 419–422. doi: 10.1126/science.1172133
Owusu, A. G., Mul, M., van der Zaag, P., and Slinge, J. (2020). Re-operating dams for environmental flows: from recommendation to practice. River Res. Appl. 37, 176–186. doi: 10.1002/rra.3624
Owusu, A., Mul, M., Van Der Zaag, P., and Slinger, J. (2022). May the odds be in your favor: why many attempts to reoperate dams for the environment stall. J. Water Resour. Plan. Manag. 148:04022009. doi: 10.1061/(ASCE)WR.1943-5452.0001521
Panagos, P., Borrelli, P., Meusburger, K., Yu, B., Klik, A., Jae Lim, K., et al. (2017). Global rainfall erosivity assessment based on high-temporal resolution rainfall records. Sci. Rep. 7:4175. doi: 10.1038/s41598-017-04282-8
Peña-Torres, D., Boix, M., and Montastruc, L. (2024). Multi-objective optimization and demand variation analysis on a water energy food nexus system. Computers & Chemical Engineering, 180, doi: 10.1016/j.compchemeng.2023.108473
Piemontese, L., Terzi, S., Di Baldassarre, G., Menestrey Schwieger, D. A., Castelli, G., and Bresci, E. (2024). Over-reliance on water infrastructure can hinder climate resilience in pastoral drylands. Nat. Clim. Chang. 14, 267–274. doi: 10.1038/s41558-024-01929-z
Pu, Q., Yoo, E.-H., Rothstein, D. H., Cairo, S., and Malemo, L. (2020). Improving the spatial accessibility of healthcare in north Kivu, Democratic Republic of Congo. Appl. Geogr. 121:102262. doi: 10.1016/j.apgeog.2020.102262
Renard, K. G., Foster, G. R., Weesies, G. A., McCool, D. K., and Yoder, D. C. (1997). Predicting soil erosion by water: A guide to conservation planning with the revised universal soil loss equation (RUSLE) (agriculture handbook no. 703). Washington, DC: United States Department of Agriculture.
Republic of Zambia (2022). Eighth national development plan. Lusaka, Zambia: Ministry of Finance and National Planning.
Ringler, C., and Zhu, T. (2015). Water resources and food security. Agron. J. 107, 1533–1538. doi: 10.2134/agronj14.0256
Ross, C. W., Prihodko, L., Anchang, J., Kumar, S., Ji, W., and Hanan, N. P. (2018). HYSOGs250m, global gridded hydrologic soil groups for curve-number-based runoff modeling. Sci. Data 5:180091. doi: 10.1038/sdata.2018.91
Sichingabula, H. M. (1997) Problems of sedimentation in small dams in Zambia, In: Human impact on erosion and sedimentation, IAHS: Rabat. 251–259
Simweene, E., and Muchanga, M. (2021). Socio-hydrological learning for integrated siltation control and water resources management in a small reservoir of southern Zambia. Am. J. Humanit. Soc. Sci. 29, 24–32.
Steduto, P., Hsiao, T. C., Fereres, E., and Raes, D. (2012). Crop yield response to water (no. 66). Rome: FAO.
Stephens, T. (2010). Manual on small earth dams: a guide to siting, design and construction. Rome: FAO.
Tobler, W. (1993). Three presentations on geographical analysis and modeling (no. 93–1). Santa Barbara, CA: National Center for Geographic Information and Analysis.
Trevisani, S., and Cavalli, M. (2016). Topography-based flow-directional roughness: potential and challenges. Earth Surf. Dynam. 4, 343–358. doi: 10.5194/esurf-4-343-2016
Valentin, C., and Rajot, J. L. (2018). “Erosion and principles of soil conservation” in Soils as a key component of the critical zone 5. ed. C. Valentin (New York: Wiley).
Venot, J.-P., De Fraiture, C., and Acheampong, E. N. (2012). Revisiting dominant notions: a review of costs, performance and institutions of small reservoirs in sub-Saharan Africa. IWMI Res. Rep. 144, 1–31. doi: 10.5337/2012.202
Visentini, M. (1937). L’evaporazione dagli specchi liquidi. Rome: Servizio Idrografico, Ist. Poligrafico dello Stato.
Vogel, R. M., Lall, U., Cai, X., Rajagopalan, B., Weiskel, P. K., Hooper, R. P., et al. (2015). Hydrology: the interdisciplinary science of water. Water Resour. Res. 51, 4409–4430. doi: 10.1002/2015WR017049
World Drought Atlas (2024). European Commission Joint Research Centre and United Nations convention to combat desertification. Luxembourg: Office of the European Union.
Keywords: drylands, pastoralism, small earth dam, small dam sustainability, socio-hydrology, trans-disciplinary approach
Citation: Serrao L, Caridi S, Farrokhi A, Avesani D, Kamamba M, Galli M, Chibwe C, Medici F, Treccani S, Kabika J, Banda K, Bezzi M, Zortea M, Ng’ambi M and Zolezzi G (2025) Sustainability of small dams for livestock and farming, a case study from Chitongo dam, rural Zambia. Front. Water. 7:1603004. doi: 10.3389/frwa.2025.1603004
Edited by:
Giulio Castelli, University of Florence, ItalyReviewed by:
Britt Basel, Wageningen University and Research, NetherlandsPatricio Mgliano, IMASL-CONICET, Argentina
Copyright © 2025 Serrao, Caridi, Farrokhi, Avesani, Kamamba, Galli, Chibwe, Medici, Treccani, Kabika, Banda, Bezzi, Zortea, Ng’ambi and Zolezzi. This is an open-access article distributed under the terms of the Creative Commons Attribution License (CC BY). The use, distribution or reproduction in other forums is permitted, provided the original author(s) and the copyright owner(s) are credited and that the original publication in this journal is cited, in accordance with accepted academic practice. No use, distribution or reproduction is permitted which does not comply with these terms.
*Correspondence: Guido Zolezzi, Z3VpZG8uem9sZXp6aUB1bml0bi5pdA==