 Nawab Ali
 Jack Chappuies
 Guy Sloan
 Abraham Rai
 Younsuk Dong
- Biosystems and Agricultural Engineering, Michigan State University, East Lansing, MI, United States
Accurate estimation of groundwater recharge is crucial for sustainable management of water resources. Various geophysical survey tools are used for groundwater recharge estimation and monitoring of these resources. This paper presents global perspectives of geophysical survey methods such as electrical resistivity tomography (ERT), electromagnetic (EM), and ground penetrating radar (GPR) for groundwater recharge estimation. About 93 papers were screened through PRISMA guidelines and were comprehensively analyzed including statistical metrics, configuration types, geological setting, investigation depth, limitations, and influencing factors. Temperate zones lead in geophysical surveys due to agriculture and interest has risen in mountainous and arid zones. The geological setting also affects the geophysical methods with ERT being the most favorable followed by EM and GPR. Investigation depth and different configurations were also studied. Influencing factors including subsurface heterogeneity and highly conductive soils often reduce resolution and distort signals particularly ERT, EM and GPR in conductive soils. Resistivity and EM measurements are affected by salinity and GPR signals by saturation. Data quality is affected by poor electrode-ground contact, topography, seasonal variability, frequency and cultural noise. Effectiveness and repeatability of geophysical survey methods are influenced by weather conditions and water table depth. Considering these factors, an adaptable and well-planned geophysical survey method selection in diverse geological setting can enhance the precision of groundwater recharge estimation. This paper aims to be the first scoping review on groundwater geophysical survey global perspectives, offering insights for future research.
1 Introduction
Groundwater resources play a critical role in sustaining agricultural productivity, ecosystem services and human livelihoods (Shaikh and Birajdar, 2024). The earth holds 1.4 billion km3 of water, of which 3% is freshwater (Matta, 2010; Oksana and Dmytro, 2021). Out of the 3%, only 1% is accessible as surface fresh water whereas the rest 2% is locked in the form of ice caps and glaciers (Oswald Spring and Oswald Spring, 2019). Globally, groundwater serves as a drinking source for nearly 2 billion people which accounts for over one third of the world’s population (Mukherjee et al., 2021). This water is not only important for human consumption, but for agricultural irrigation as well. Globally, 60–70% of groundwater is used for irrigation in agriculture (Wood and Cherry, 2021). The precise and accurate estimation of groundwater recharge is therefore necessary for sustainable utilization of groundwater and long-term sustainability planning (Ntona et al., 2022). However, groundwater recharge differs greatly in terms of time and space greatly influenced by climatic, geologic and anthropogenic factors which present significant challenges to direct measurements and mapping (Reinecke et al., 2020).
For hydrological balance and sustainability of subsurface regimes, groundwater recharge is the main determining factor (Amanambu et al., 2020). The alteration in global climate has had a significant influence on both the quantity and quality of groundwater recharge, even though it is controlled in parts through atmospheric processes like precipitation and evaporation (Cuthbert et al., 2019; Albuquerque et al., 2022). Thus, groundwater management and sustainability depend upon the spatiotemporal process of groundwater recharge (Amanambu et al., 2020; Judeh et al., 2021). The onsite determination of groundwater recharge is difficult, though some alternative indirect methods like empirical models and process-based models can be used for its estimation like electrical resistivity and electromagnetic surveys (Jourde and Wang, 2023). Nevertheless, traditional methods will lead to new sources of uncertainty when examining the impact of climate change on groundwater recharge (Aquilina et al., 2023). As per the Intergovernmental Panel on Climate Change (IPCC) projection, climate change will affect surface and subsurface groundwater resources (Smerdon, 2017), making it essential to assess its effects on groundwater recharge (Cuthbert et al., 2019). The influence of unpredictable precipitation patterns on recharge remains (Aslam et al., 2018). Factors like geophysical methods, general circulation models, and emission scenarios contributed to this uncertainty (Andaryani et al., 2023). Groundwater is primarily stored in aquifers at different depths based on location and age below the earth’s surface which serve as a key natural resource (Fan et al., 2019; Cuthbert et al., 2019). Its detection and quantification are challenging due to subsurface variability (Lall et al., 2020; Aquilina et al., 2023). Geophysical models help to characterize the recharge pathways through subsurface resistivity translation into insights on water flow and storage potential (Gong et al., 2023). Appropriate protection and management are therefore necessary for sustainable groundwater resources (Aderemi et al., 2022; Luo et al., 2020).
Geophysical models offer non-invasive techniques for groundwater recharge estimation by assessing subsurface properties that affect water movement and recharge. Techniques such as Electrical Resistivity Tomography (ERT), Ground Penetration Radar (GPR), and Electromagnetic (EM) surveys detect soil moisture, lithological boundaries, and aquifer structures. Furthermore, these models infer spatiotemporal permeability, porosity, and saturation levels and offer crucial insights to recharge pathways. Different configurations, array types, investigation depths, and promising factors which influence geophysical methods performance. With the ever-present climate change problem affecting the water resources that humans rely on daily; it is paramount to take inventory of the tools at our disposal to monitor and find this precious resource. While literature on geophysical methods exists, there is still a scoping review to assess the trends within published literature on groundwater and geophysical methods. This review explores the emerging trends and global synthesis of research using ERT, EM and GPR approaches for recharge estimation and delineating recharge zones with the objectives to critically analyze the capabilities, limitations, trends and integration potential of these methods across diverse hydrogeological settings. Highlighting the methodological trends, case studies application, limitations and future research gaps, this scoping review provides the non-invasive and indirect approaches for groundwater monitoring under changing climate and diverse land use.
2 Materials and methods
This review employed systematic and scoping approach identify, evaluate and synthesize global research perspective on Geophysical methods like Electrical Resistivity Tomography (ERT), Electromagnetic (EM) survey and Ground Penetration Radar (GPR) for used groundwater recharge estimation.
2.1 Literature search strategy
A comprehensive literature search was conducted using Web of Science (WoS) database covering all the publications utilizing ERT, EM and GPR for groundwater recharge study. The keywords and combinations used for search were “groundwater recharge,” “electrical resistivity tomography” or “ERT,” “electromagnetic survey” or “EM methods,” “ground penetration radar” or “GPR,” “geophysical methods” and “recharge estimation” to get the relevant literature. PRISMA search strategy (Figure 1) guidelines were adopted for the literature search and selection process which provided a standardized approach for systematic and scoping review analyses.
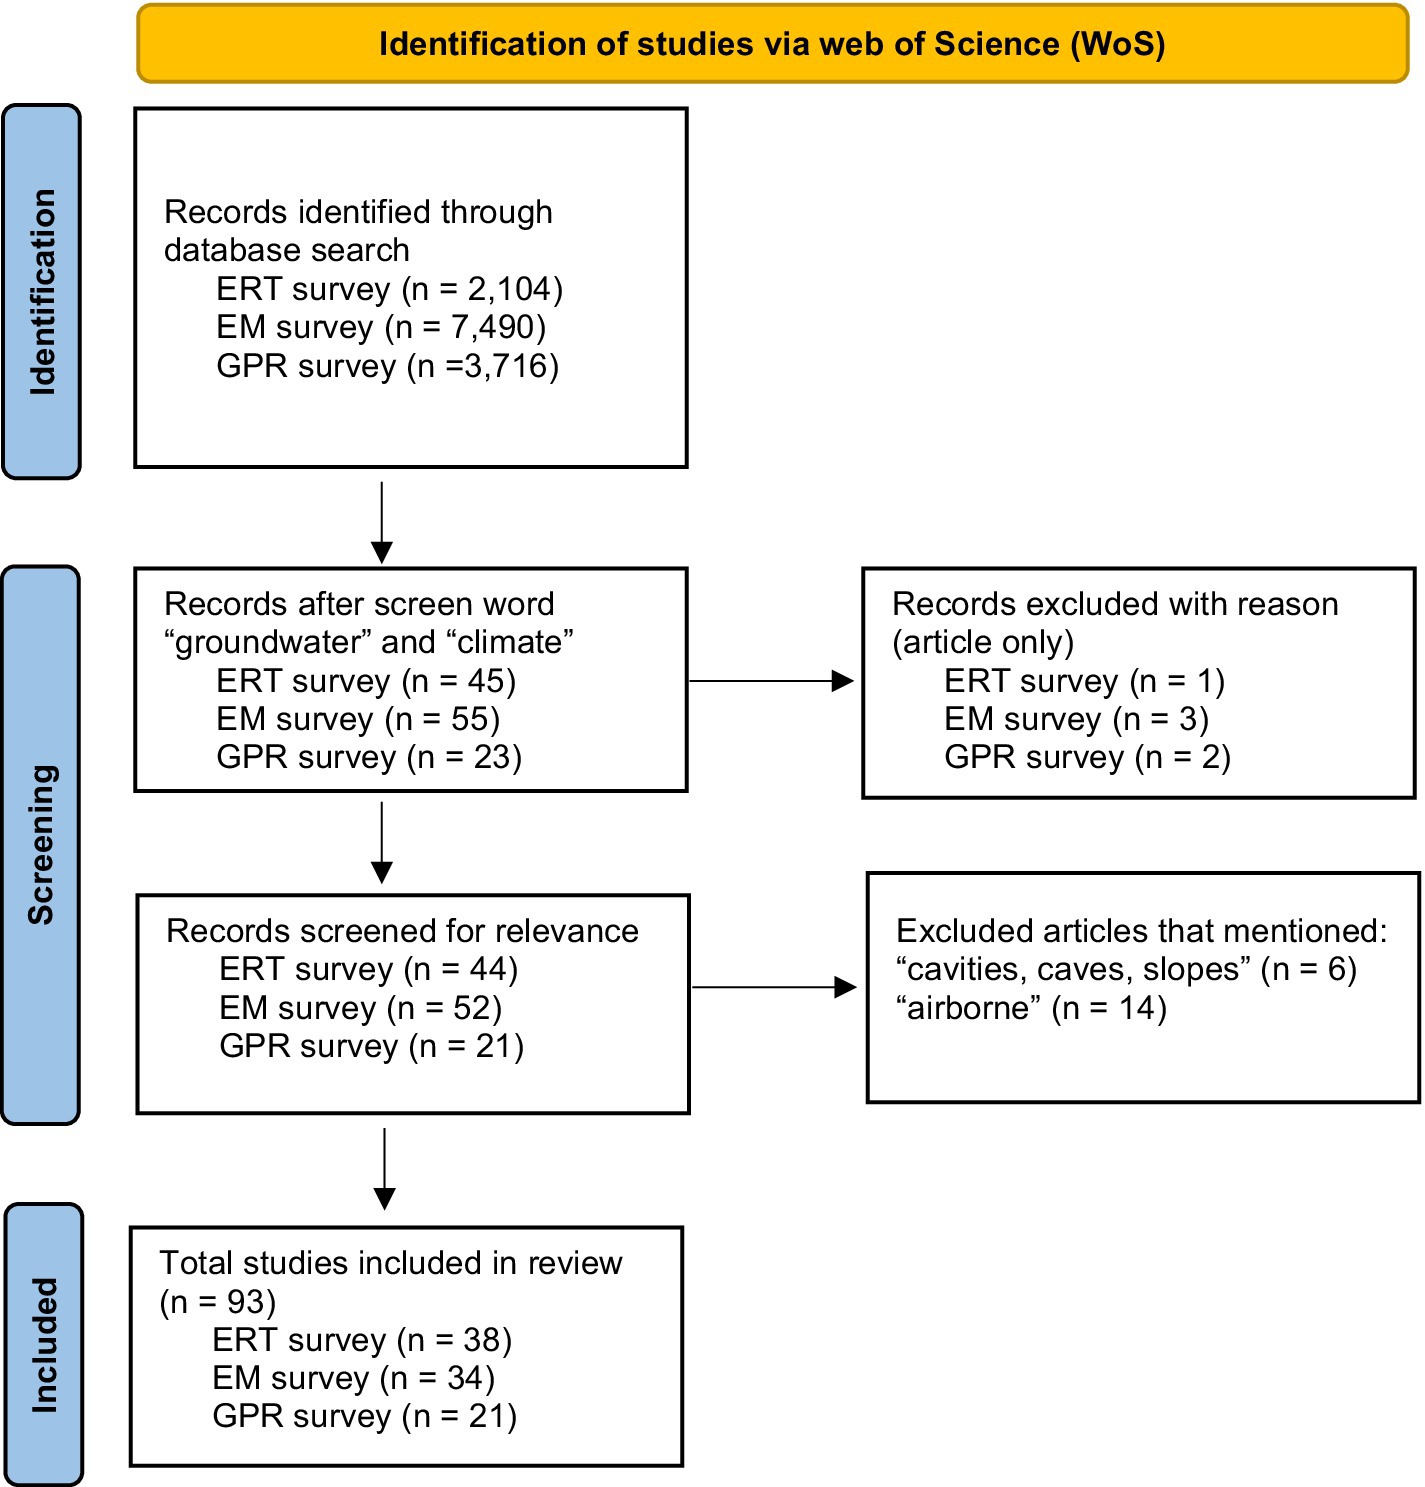
Figure 1. PRISMA search strategy illustrating identification, screening, eligibility and inclusion process of reviewed studies on geophysical methods (ERT, EM, and GPR) for groundwater recharge estimation.
2.2 Inclusion and exclusion criteria
After the literature search, all the papers were screened and included based on criteria. The criteria used was that the papers which focused on geophysical methods in estimating or identifying recharge, published in peer reviewed journals, conference or academic reports which provide the case study data, methodology description and result synthesis related to recharge estimation. The PRISMA diagram lays out the steps utilized in narrowing down the articles selected for review in a non-biased manner. Non-articles were removed from the records due to the lack of review associated with other forms of scientific media. Finally, words such as “airborne, cavities, caves,” and “slopes” were also used to screen the geophysical literature sources. Proceedings. Furthermore, articles were excluded which contained “cavities, caves, and slopes.” Once the screening phase reduced the number of articles down to a sample size of 93 total surveys, manual cataloging and screening of each article was conducted. Each type of survey, following the same step-by-step filtering and screening, yielded a different number of articles. While this is consistent with other PRISMA analysis in other fields, this poses a fundamental problem when examining the frequency of trends within the data. There were no even distributions between the number of studies selected for analysis, and this certainly affected the trend graphics displayed in other sections of this study.
2.3 Data extraction and classification
The selected literature after screening were extracted for detailed analysis using geophysical method, geographical location of the study, publication year, climate of the area, hydrogeological setting, configuration type and statistical metrics. An overview of the three geophysical methods and comparisons was also employed based on equipment, survey type, electric configuration, penetration depth, measurement method, range, resolution, data acquisition with pros and cons were summarized. Furthermore, yearly trends, geographical distribution, climatic analysis and the factors influencing groundwater recharge estimation through geophysical survey methods are summarized in detail.
3 Results and discussion
3.1 Scale of the study
Using the publication database “Web of Science,” the study featured the examination of publications per geophysical method. This includes 38 ERT survey publications, 34 EM publications, and 21 GPR publications. Using the PRISMA method for screening and selection, 93 published journal articles featuring geophysical surveys were recorded. The search words queried included “groundwater” and then the name of the survey. The top relevant articles that appeared were examined for each of the methods. The year of publication, the country where the study site resided, the climate of the study area, and key terms were cataloged for analysis. The analysis involved the creation of word clouds to visualize the frequency of items within the papers for bulk comparison. Graphics and trends were examined and thoroughly investigated to provide possible insight into why the observed trends were seen. A detailed overview and comparison of the geophysical method used in this systematic and scoping review is also discussed.
3.2 Overview of geophysical survey tools
While many geophysical surveying methods exist today, it would not be a comprehensive scoping review of geophysical methods without mentioning the merits of the seismic surveying of the 1900s that allowed for future geophysical work to be conducted. German scientist Ludger Mintrop (1880–1956) is often credited with the invention of seismic testing that involved striking the ground to measure seismic refraction patterns for salt dome and oil exploration (Bednar, 2005). This work involved measuring the relationships of different waves as they attenuate through the subsurface. Mintrop’s work is the predecessor of the seismic refraction surveys that are conducted today with dynamite or by dropping weight on a steel plate to measure P and S waves as they refract through various layers of lithologies in the subsurface. This scoping review is primarily concerned with groundwater investigation. Furthermore, the identification of saturated or semi-saturated layers using seismic surveying is difficult due to the wide range of possible reflection velocities that register when conducting this type of survey (Grelle and Guadagno, 2009). For these reasons, seismic geophysical surveying was omitted from the search query list. Other geophysical methods show much more promise at imaging the subsurface for highly saturated areas. The three geophysical methods that will be examined in this scoping review are the following: ERT, EM, GPR surveys. These three methods will be compared in this review and Table 1 shows a summary of each method.
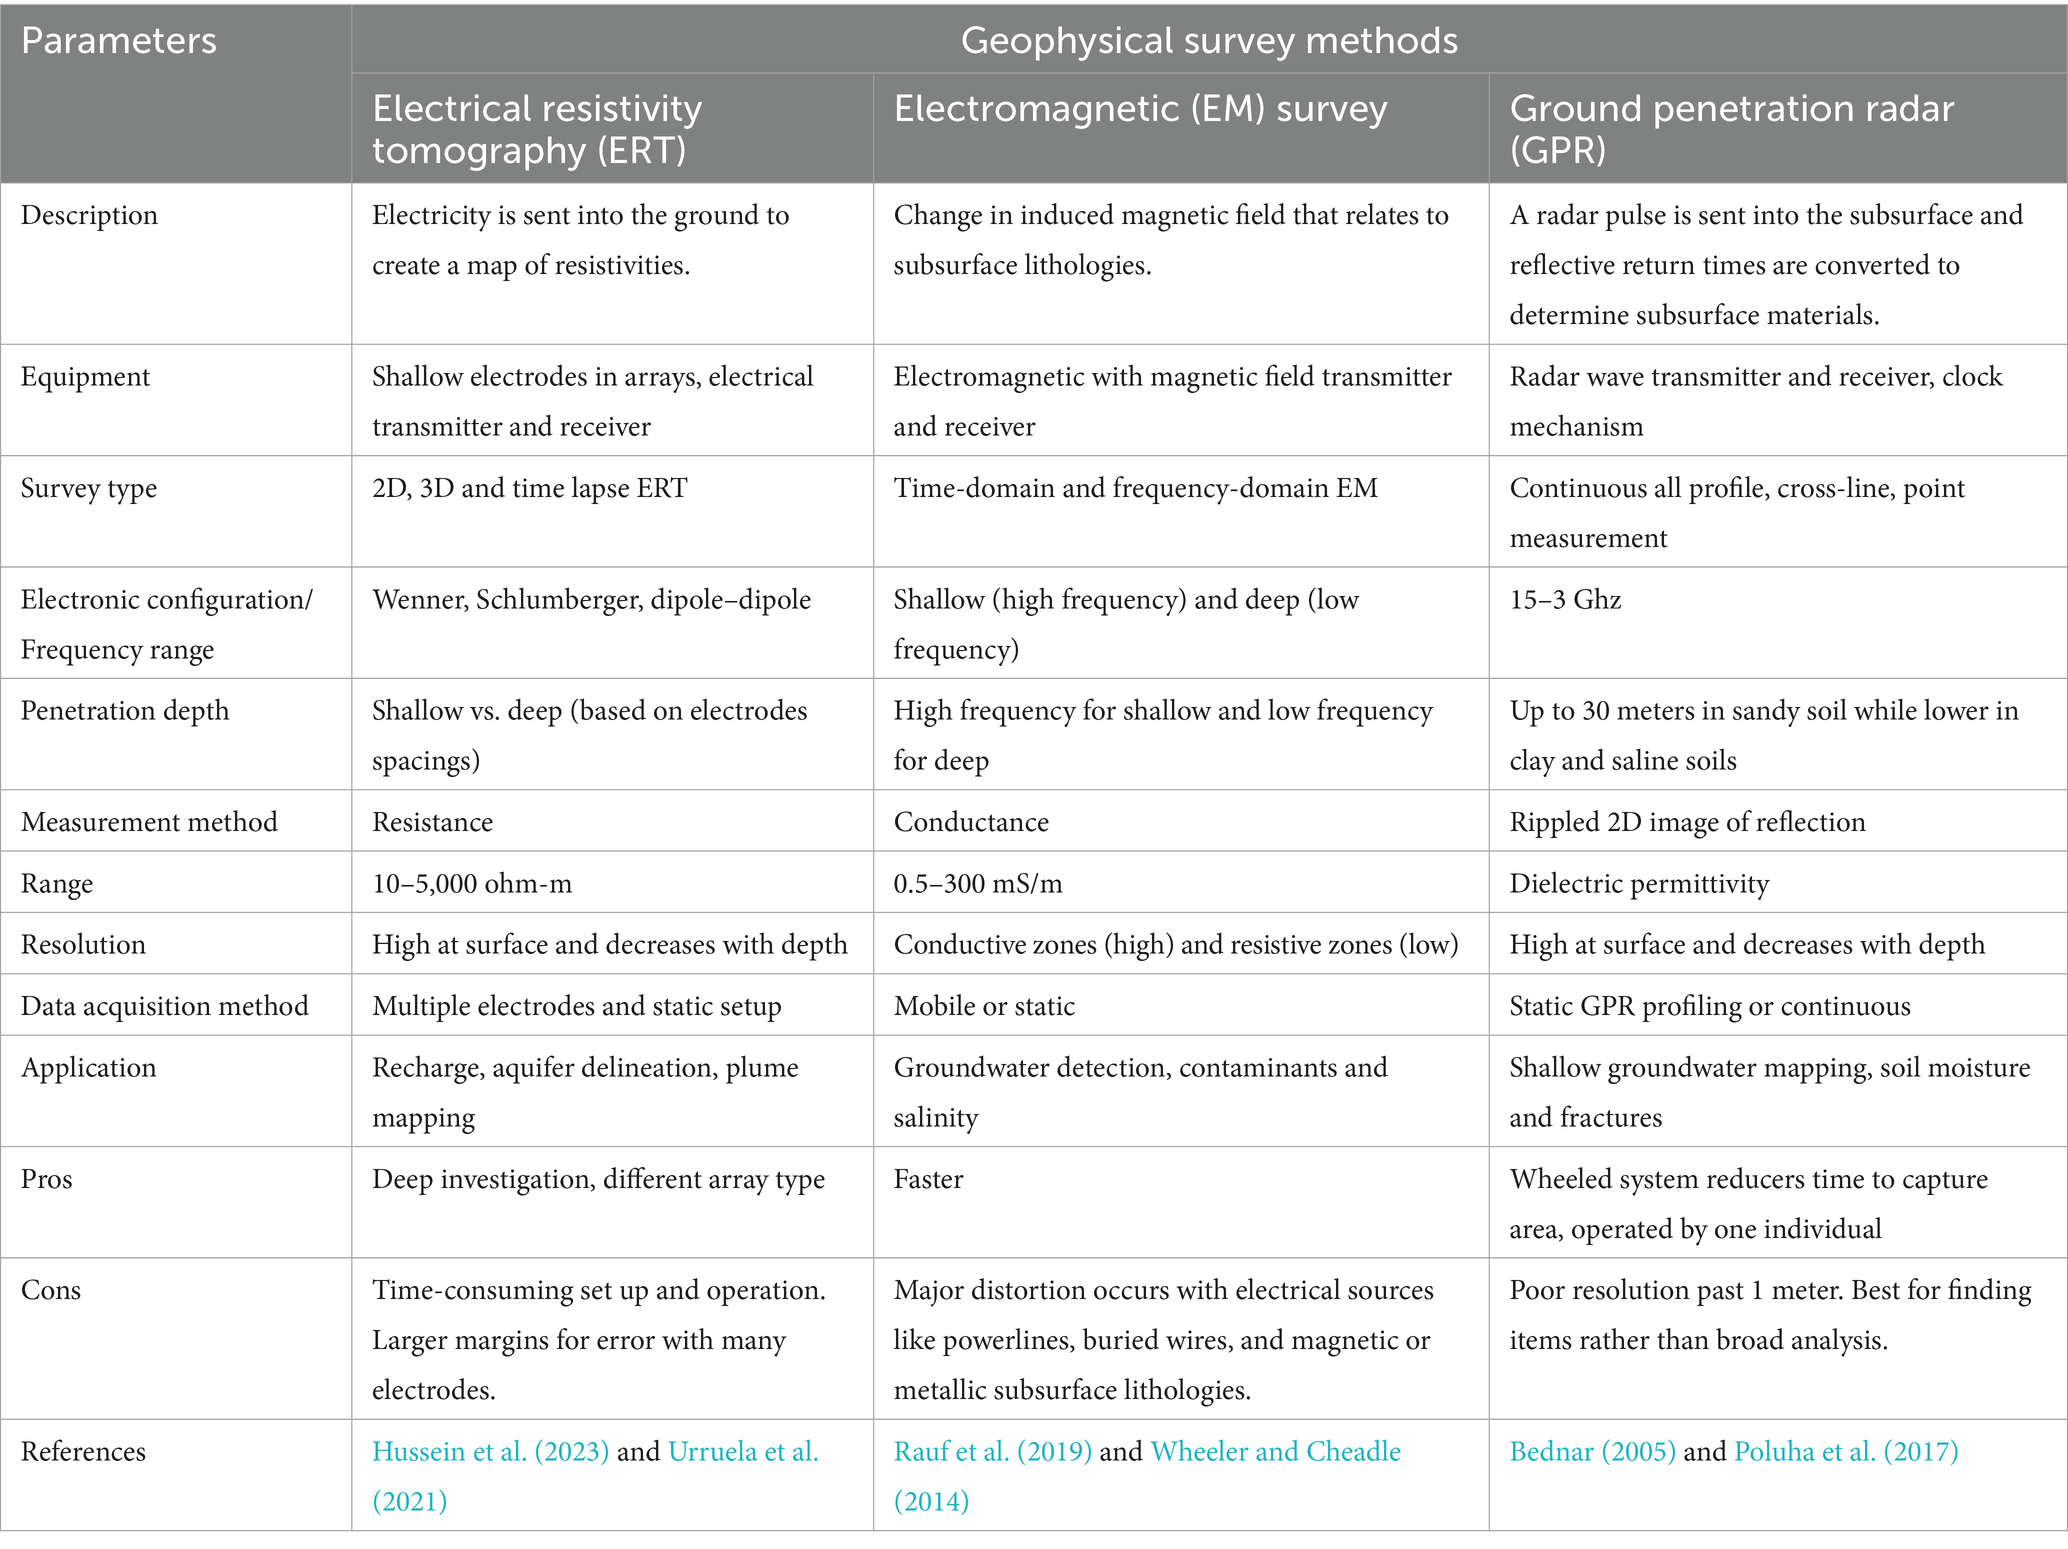
Table 1. Comparisons of geophysical methods [electrical resistivity tomography (ERT), electromagnetic (EM), and electromagnetic (EM)] surveys for groundwater recharge estimation.
3.2.1 Electrical resistivity tomography (ERT)
ERT, in its infancy started in the 1940s by scientist Andrei Tikonov by utilizing electrical resistive properties in looking for highly conductive copper deposits in the Soviet Union (Rezgui, 2018). A relation between a transmitter emitting electrical signals and equally spaced electrodes in the ground to measure the change in voltage across an array of electrodes (often 4) became common place for imaging subsurface resistivity. An ERT survey is a geophysical method of collecting data from sending an electrical current from a transmitter to electrodes in an array. While many methods persist for array set ups, among them the Schlumberger array is considered the best for groundwater aquifer imaging but still the optimal electrode configuration depends on local geological characteristics (Urruela et al., 2021). This array type consists of four electrodes, with a transmitter sending out controlled electrical signals and a receiver collecting the disputed signals that interact with the earth subsurface. The resistance of the material on earth is a derivation of Ohms law. Equation 1 is the resistance of the materials between the electrodes:
Once this is done, apparent resistivity (Equation 2) is calculated:
The geometric factor K can be derived in Equation 3:
where, R is resistivity (ohms), V is voltage (volts), and I is current (amperes) (Hussein et al., 2023). is the apparent resistivity in ohm meters, K is the geometric factor in meters and R is resistivity in ohms, a is the spacing between adjacent electrodes in meters, n is the amount of electrode spacings (number).
Electrical resistivity surveys have been continuously used for decades in areas such as mineral exploration and subterranean pollution sites (Greenwood and Buth, 2017). The ability to track resistive fluids in the ground using an ERT survey has many applications in the civil engineering realm as well as geoscience consulting for construction projects. This paper aims to highlight this technology’s use in groundwater surveying and exploration. Recent studies have shown the ability to image highly conductive seawater intrusions in coastal aquifers using ERT technology. This involves mapping coastal aquifers along the Mediterranean in Italy and Greece to measure the extent of saltwater intrusion into freshwater aquifers that supply vibrant coastal cities with water resources. Other studies including one conducted on the Munijhara watershed in India, are able to estimate groundwater recharge by taking multiple readings over a given time to see how the annual recharge of the aquifer changes with precipitation fluctuations (Sethi et al., 2009). The usages of ERT for aquifers are also noted as being used to identify likely water saturated zones within arid climates. This can be especially useful when the water resources of the area is limited. An example of this occurred in a 2011 study in Sudan to map likely saturated sandstone aquifers in the Nuban Mountains for possible well drilling sites. The ERT survey identified zones 10 meter below the subsurface that contained resistivities anomalies consistent with a saturated sandstone layer (Mohamed et al., 2011). Electrical resistivity tomography allows groundwater exploration and aquifer mapping. Based on the 93 papers reviewed in this scoping review on groundwater and ERT surveying, there can be no doubt that this method is effective at identifying and mapping groundwater resources and lithological structures that lie beneath the earth’s surface.
With respect to agriculture, ERT possesses many ways of improving water use efficiency. ERT soil characterization mapping has been conducted on areas with compacted soil for root formation factors. ERT can be utilized to measure aquifer saturation levels on wells drawing for crop production irrigation (Watlet et al., 2018). Other studies discuss the ability for ERT to be a promising method for understanding soil organic content monitoring (Turki et al., 2019). Using geophysical methods on irrigated crop land provides invaluable information for growers to understand the aquifer beneath. More research is needed to understand the dynamics that control aquifer saturation levels, however using geophysical methods such as ERT is a first step towards more efficient water usage in agriculture.
3.2.2 Electromagnetic surveying (EM)
Electromagnetic (EM) surveying involves generating a magnetic field via an alternating electrical current, which creates a primary magnetic field. This field propagates through the ground from the transmitter. As the primary field interacts with subsurface materials, it induces a secondary magnetic field. The receiver measures strengths and phases of this secondary field (McLachlan et al., 2021). The frequency of the alternating current of the electromagnet is how the depth of investigation is adjusted. At higher frequencies, more of the field is dissipated quicker and, therefore, is good for mapping shallow units. At lower frequencies, the field penetrates deeper into the earth at lower energy provides a deeper scan of the subsurface. The trade-off is that the lower energy weakens the strength of the magnetic field of the secondary field, consequently lowering the resolution of the readings (Wheeler and Cheadle, 2014). The output of the system is a conductivity map that shows the ease at which a magnetic field attenuates throughout the subsurface.
Similarly to the ERT survey, a map of resistance can be generated from the EM survey. This is due to the fact that resistivity and conductivity are inverses of each other. Within Equation 4, δ, the skin depth, in meters, is calculated. The skin depth represents the distance at which the amplitude of the primary electromagnetic field decreases to approximately 37% of its surface value, and it is influenced by the frequency and conductivity of the subsurface materials:
where ω is the angular frequency (radians per second) of the electromagnetic field, μ is the magnetic permeability of the material (which is generally assumed to be the permeability of free space) with units of Henries per meter, and σ is the electrical conductivity of the material in units of Siemens per meter (Rauf et al., 2019). The primary magnetic field penetrates the ground and induces eddy currents into subsurface features. These eddy currents then create their own electromagnetic field, which is recorded with a receiver. Similar to ERT, the accumulation of various secondary electromagnetic fields can be used in an inversion model to calculate the depths of various subsurface features. The main benefit of an electromagnetic survey is the speed at which the data can be collected. There is no direct contact with the ground, therefore, various methods are employed to gather bulk accurate electromagnetic conductance maps of areas. Methods include using an aerial system, a pulled hitched system by an off-roading vehicle, or even two-person teams carrying the transmitter and the receiver at set distances and marking out an array pattern to generate 2D resistivity maps of areas. Drawbacks of the EM survey include its reactivity to external electrical sources. This means powerlines, buried cables, and magnetic minerals are all things that can distort the data to give false readings (Zhdanov, 2010). The EM survey does not contact the ground directly, therefore factors that influence the invisible magnetic field within the area are very important.
3.2.3 Ground penetration radar (GPR)
Ground penetrating radar (GPR) surveys involve emitting a radar pulse into the subsurface. This pulse is emitted by a transmitter and ranges from 900 MHz-1GHz (Benedetto and Benedetto, 2014). This pulse spreads through the ground and then reflects off various structures and subsurface features. The reflected radar signal then travels back to the receiver. This time difference in arrival times of radar signals allows for the calculation of layered lithologies as radar waves attenuate differently in different surfaces depending on factors such as porosity, fluid presence and mineral structure of the layers. Equations 5, 6 depict how the depth is calculated using ground penetrating radar:
where, V is the velocity of the electromagnetic wave (m/s), c is the velocity of electromagnetic velocity in a vacuum (m/s), is the dielectric constant (unitless). Z is the depth of the target reading (m), and t is the two-way travel time (s) to a subsurface reflector (Poluha et al., 2017).
This technology has been around since 1910 when German geophysicists used continuous radar waves to measure changes in reflection time as the ground beneath them changed (Bednar, 2005). Fast forward to today, there is various types of GPR machines and uses for this technology. This survey must have direct contact with the ground to send these radar waves into the subsurface, however nothing is directly drilled into the ground. This allows for the most practical method of GPR surveying using a wheeled system to create an array of fields. Unlike EM or ERT surveys however, there will be no resistivity map generated. The output of this system is a rippled diffusion pattern that can be used to identify structures within the subsurface. The most common application of this technology is used in smaller settings of depths of 1–10 meters. The reason for this is the strength to generate such a radar blast, which often requires a larger system, and the resolution decreases with depth as the waves attenuate through the layers. Therefore, the near-surface structures are much more defined and known when conducting a GPR survey.
GPR is the most versatile tool that has been used for mine detection, civil engineering projects, and soil moisture penetration (Benedetto et al., 2015). The arrival times of the reflecting waves allow for filtered parameters to be in place to screen any excess noise depending on the project and the depth of investigation needed. Often, the largest downside seen with GPR is the interpretation of and “aperture of radar distortion” seen when waves hit a buried object. The description and interpretation of the object only come as a function of time, and these reflected arrival times must be interpreted to understand the layers/objects that are buried. The effects of the propagation of radar waves on different bodies are also different. The angle at which radar waves attenuate must also be considered when measuring subsurface structures, as angle of the incident radar wave compared to the angle of reflection from the target area is different and can lead to problems with interpreting the shape and size of the structure (Benedetto and Benedetto, 2014).
3.3 Trend analysis
Upon review of the three geophysical methods for investigating groundwater and recharge, trends exist within the publication keywords. These are words that the authors deemed key to adequately describe their paper. After examination of all the keywords of all the 93 articles reviewed, several trends emerged (Figure 2). The term “inversion” appeared 11 unique times within key terms across the sample, suggesting that the studies conducted required data manipulation and additional computer model inversions. Many models (2D or 3D) require an inversion of the 1D raw data to create final figures. An example is depth to replace frequency on the 1D models of EM surveys to create a conductance vs. depth graphic that is more understandable to the community (McLachlan et al., 2021). The term “coastal” appeared 12 unique times to suggest that coastal aquifers and groundwater are of particular importance to the public as seawater intrusions pose a threat to coastal aquifers (Klassen and Allen, 2017). It should be noted that the word “intrusion” was observed 9 times within the keywords analysis. In addition, coastal areas typically experience a higher population density compared to their water resources; therefore, one can reasonably infer that groundwater surveying in these areas would be important (Boretti and Rosa, 2019). The term “hydrogeology” appears 8 unique times and demonstrates the importance of understanding the aquifer content and recharge rates and how important a comprehensive understanding of the local geology is to these studies.
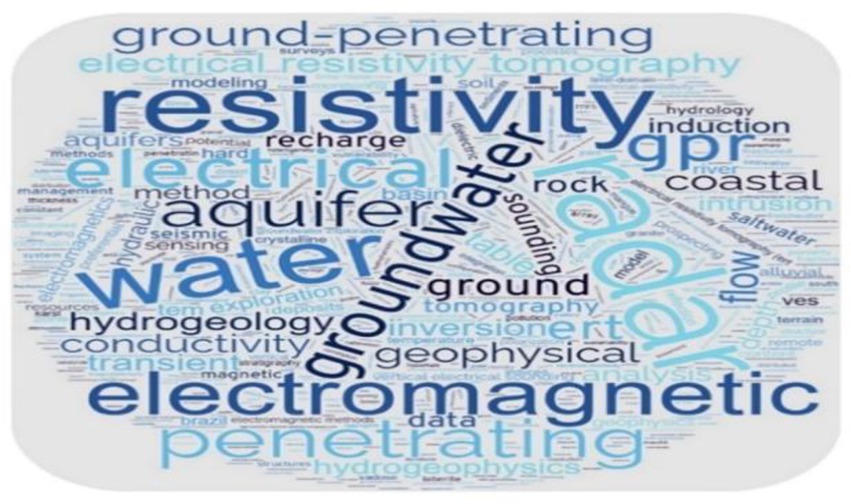
Figure 2. Word cloud of key terms from 93 recorded publications.
Other trends observed involve the years published and the location of said studies. Groundwater exploration surveys suggest an apparent stress on the water supply or a lack of understanding of subsurface aquifers. Thus, it can be inferred that areas that experience heavy groundwater usage or lack of plentiful, easily accessible water resources are more likely to conduct a study. This can be directly observed when examining the climate of the study areas. The climates of each of the study areas of each survey publication were noted and archived to examine trends. Unsurprisingly, a frequent climate survey was “arid” in 16 unique publications. This points to arid regions receiving little rainfall and often having water-stressed resources. The issue of water scarcity in arid regions is exacerbated by the effects of global climate change (Morante-Carballo et al., 2022). The other popular terms were tropical (7) and subtropical (19). Two explanations exist for this trend. The first is that the majority of the tropical and subtropical areas surveyed lie within Africa or the Indian subcontinent. African regions are more susceptible to water resource issues, and thus, more exploration and understanding of where water is located within Africa is of public importance and increases the likelihood of geophysical research. Studies that fall under tropical and subtropical within India can be attributed to the topography of the Himalayas and the remoteness of the study areas. Isolated villages and towns within India often deal with unique geographical and mountainous terrain that makes water infrastructure difficult (Bathla, 1999). This would explain the need for groundwater surveys to sustain the largest populated country in the world.
Over the past few decades geophysical methods are gaining attention due to their potential to non-invasive and indirect characterization of subsurface hydrological processes, especially for groundwater recharge estimation. Understanding the historical development and progression of geophysical methods is essential for groundwater resources research. Highlighting the development of those methods, a literature search from Web of Science revealed that earliest application of EM appeared in 1981, followed by GPR in 1990 and ERT in 1992. Figure 3 illustrates the growing interest in geophysical mapping for groundwater. The trend is increasing yearly, with 2022 being an exception due to the COVID-19 pandemic. There is enough evidence to support the notion that surveys will continue to be useful in mapping and identifying aquifers around the globe. An examination of the publication number trends was also considered. The yearly publication trends can be explained for EM and GPR, which are often cheaper methods of geophysical mapping. While the equipment prices of all three methods are a substantial investment, ERT, until recently, has been extremely expensive. This also deals with the fact that the depth of investigation of ERT is directly proportional to the length of cable spacing. Moreover, the more cables are needed, the larger the cost of the system. This creates an economic barrier to entry in terms of ERT for groundwater investigation. ERT begins to accelerate to become the dominant groundwater survey tool in 2021 for maximum publications across all years. The number of surveys conducted also trends upward in all types, indicating that all three methods provide viable means for groundwater exploration given the study area. The increase in groundwater surveys can be linked to global climate change affecting water resources. The change in temperatures, precipitation, and growing global populations continue to put the water supply of the world under strain (Al Atawneh et al., 2021). Most geohydrological models indicate that groundwater recharge is depleting across many regions. This could provide an explanation for the increase in groundwater recharge mapping and aquifer monitoring using geophysical surveying.
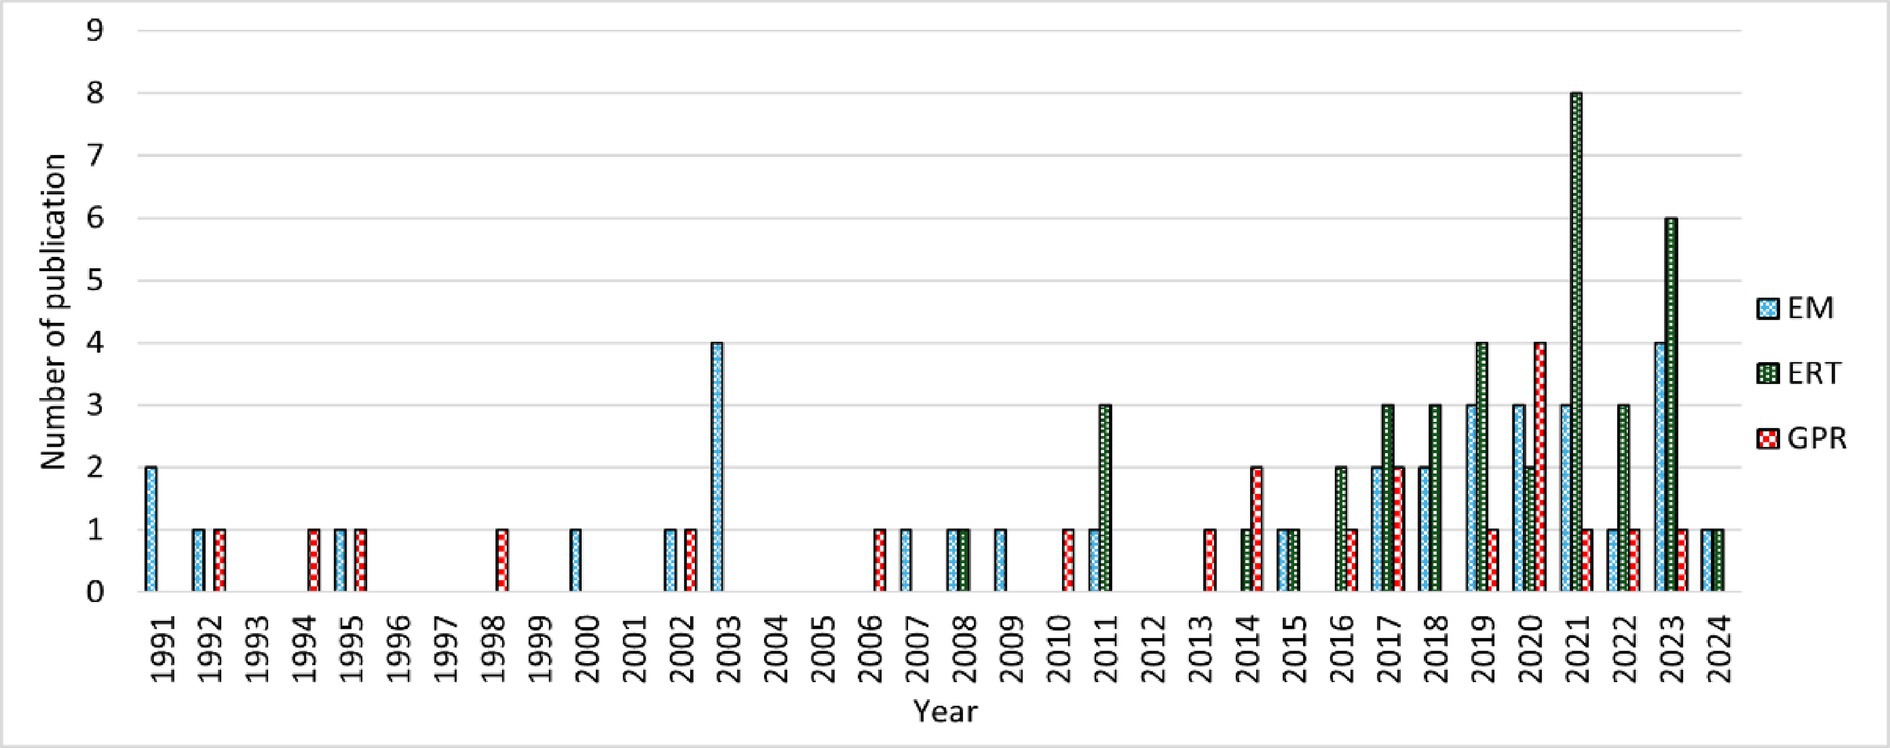
Figure 3. Temporal distribution of published studies using electrical resistivity tomography (ERT), electromagnetic (EM) methods, and ground penetrating radar (GPR) for groundwater recharge estimation. The figure illustrates the growth in scientific attention to each method over time and helps visualize methodological trends and adoption patterns across global case studies.
3.4 Survey geographical distribution
The map compiled in Figure 4 highlights the number of geophysical groundwater papers published by each country. It should be immediately noticeable that the three countries with the three largest populations on earth are the top three leading countries publishing groundwater geophysical surveys. The U.S. (14), India (7), and China (4) are the three largest countries in the world in terms of population. Population and demand for groundwater are directly related, as water is the most important source for living things (Boretti and Rosa, 2019). The cost of the survey equipment should be noted as well. The high cost of these mapping tools reflects on the countries that use them with U.S., China, Germany, England, Canada, India, Italy and Brazil representing 8 of the top ten highest GDP’s in the world. In correlation, each of the countries listed above has published at least 2 or more geophysical surveys on groundwater. The data collected from this scoping review supports the correlation that countries with higher GDP publish more research (National Science Board, 2021).
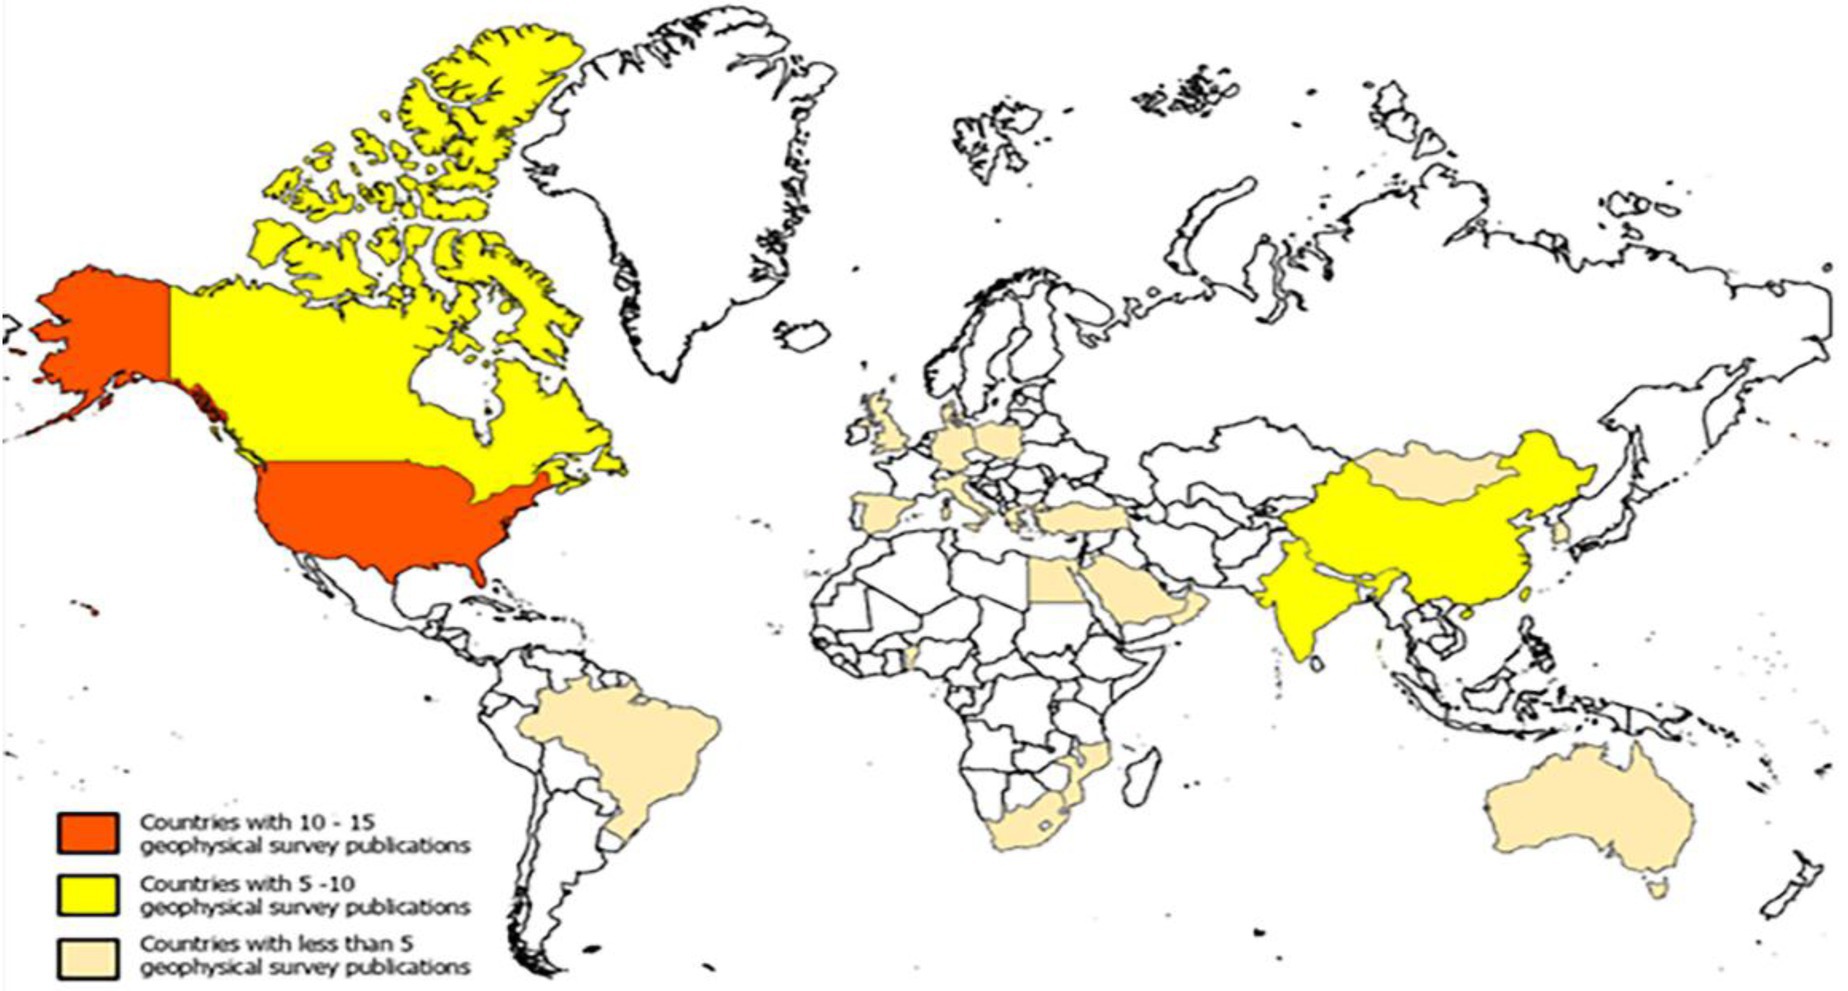
Figure 4. World map of geophysical survey sites from selected publications.
It should be noted that most U.S. surveys were conducted in arid or water-stressed areas. The effect of global climate change is altering traditional weather patterns and affecting groundwater resources. So, while the whole country might be highlighted in the map above, the areas within the countries where the surveys are taking place are likely an area where water resources in a region where water is stressed or will become stressed in the future. The map is a visual representation of the amount of geophysical groundwater surveys being conducted around the globe. The analysis also shows the wide extent of groundwater geophysical surveying. While no analysis was done on the preferential types used in various areas, the map above serves as a testament to the fact that groundwater geophysical surveying for resource mapping can be applicable to practically all corners of the globe.
3.5 Climate distribution analysis
A review of the climates in which geophysical surveys on groundwater were conducted yielded the following bar graph shown in Figure 5. Figure 5 perhaps demonstrates the most poignant point of all; groundwater estimation and mapping are important in all climates. The effects of global climate change are directly impacting the rates of recharge and precipitation on a global scale (Davamani et al., 2023). The presence of groundwater surveys across all the biomes on the planet indicates that no region is more stable than others due to sub-surface processes not being fully understood. Granted, arid and mountainous climates appear in bulk due to their natural disposition to water resources, but temperate and subtropical climates are also equal targets of these groundwater surveys. In fact, temperate climates have seen the most geophysical groundwater surveys while tropical climates see the least.
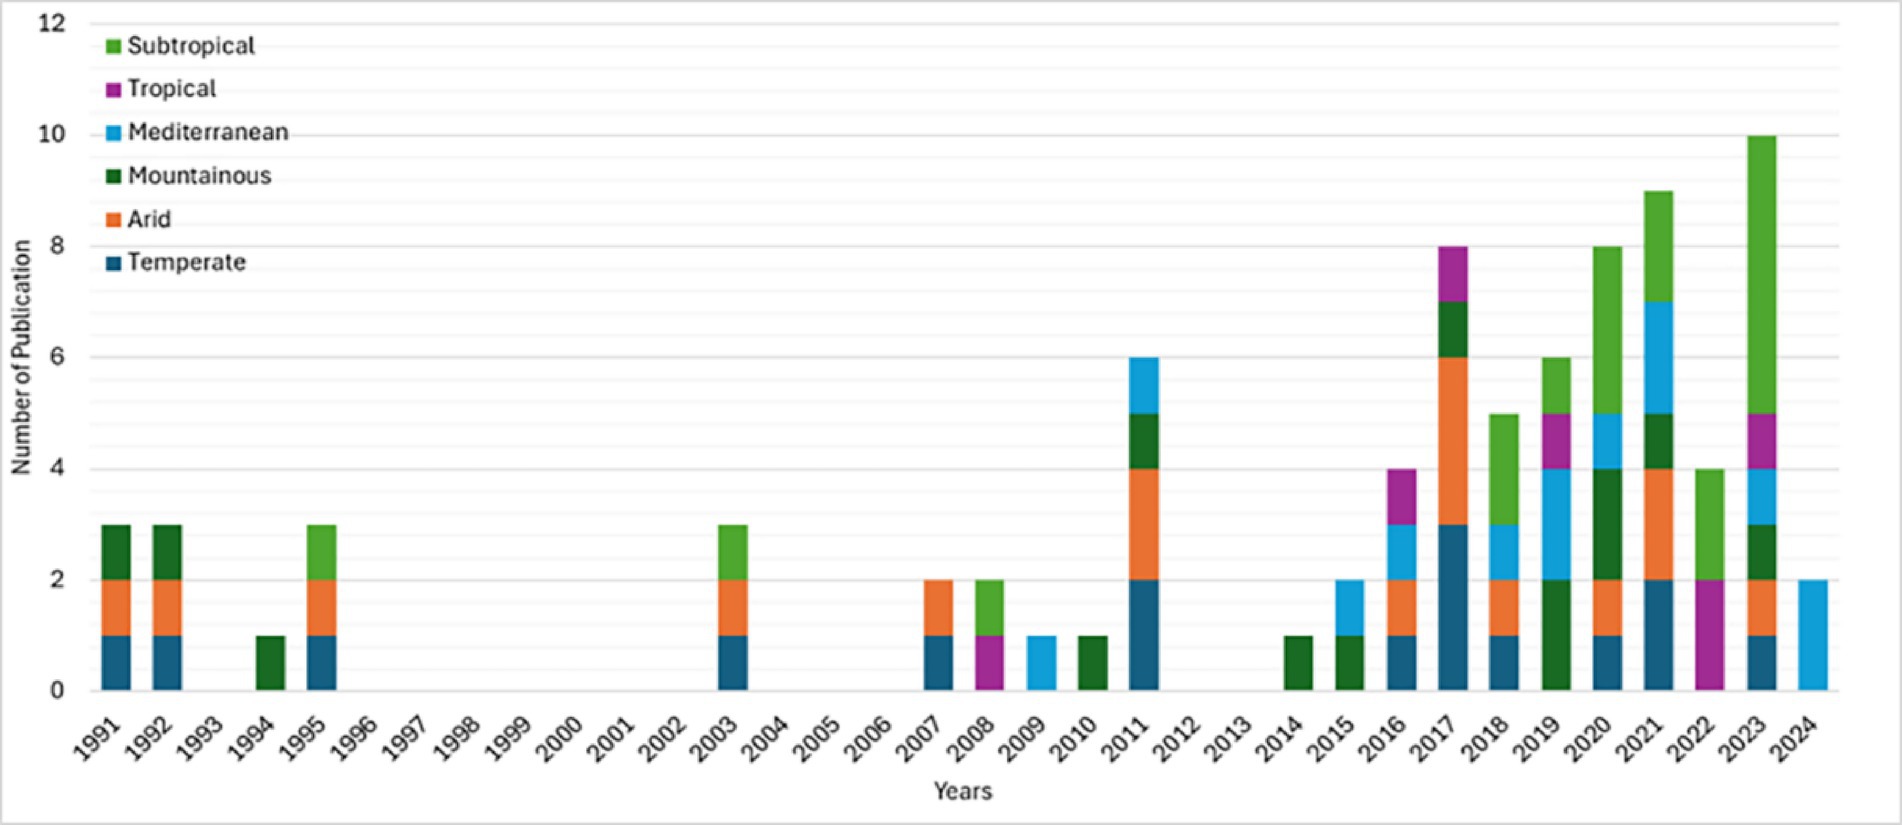
Figure 5. Yearly trends identified by climate of the survey site represented in selected papers.
Upon review, there are differences between the climate areas studied for the survey sites. The tropical biome experiences the lowest amount of geophysical groundwater surveys. The likely explanation for this trend is the fact that tropical climates receive the most rainfall of any of the other biomes. This increase in rainwater leads to more surface water likely used to supply population centers and less water stress on humans living in these areas (Konapala et al., 2020). Moving forward, the impacts of global climate change are likely to cause an increase in groundwater surveys in the subtropical zones. The slow conversion of subtropical lands into arid environments is well documented, with the Sahara Desert increasing in size by 10 percent in the last 100 years and growing with the shifting of rainfall patterns. The lands that once were subtropical surrounding the desert are becoming more arid due to the effects of climate change (Thomas and Nigam, 2018).
The same trends are observed in Mediterranean climate data. Mediterranean climate encompasses a small geographical area, yet there is a high population density due to the desirable climate and economic opportunities. This small, unique climate has seen and will continue significant desertification due to climate change and, therefore, lends itself to explaining the significant increase in groundwater surveying (Lionello et al., 2014). As the Mediterranean climate continues to convert to arid, the large population centers will continue to seek out groundwater resources. The effect of this is also worsened by all Mediterranean climates being located next to saltwater bodies. Coastal aquifers are known to face issues with saltwater intrusions, rendering them ineffective for drinking water once contaminated with salt (Klassen and Allen, 2017). This would be an added incentive for researchers or academics to conduct geophysical groundwater surveys in the Mediterranean climate zone atop the aforementioned.
The temperate climate zone is described by four distinct seasons with varied precipitation. Much of the world lives within a temperate climate zone. The temperate climate zone features the bulk of all agricultural operations in the world. This makes temperate groundwater for human consumption and irrigation for crops important to a sustainable economy (Dornik et al., 2024). This climate zone also saw the most geophysical surveys. This was unexpected in the findings as we assumed that these areas maintained a large amount of water resources from surface water or their precipitation. The reason for large amounts of groundwater geophysical surveying perhaps lies in the motivation trends behind the papers than with climate alone but also population growth and demands are the promising factors.
The 16 arid geophysical surveys concern themselves with the words of “exploration” and “resource identification.” This mainly owes to the notion that semi-arid and arid environments receive less rainfall and maintain lower levels of surface water resources. These features are certainly exacerbated by the onset of global climate change, and therefore, these surveys are more concerned with identifying areas of water saturation in the subsurface. Other studies in the temperate climate category appear more concerned with the “quantification of groundwater resources” or “identifying aquifer size and health.” This difference likely occurs from the shift in priorities with arid regions concerned with finding more water and temperate regions concerned with the management of known water resources (Wiederhold et al., 2021). These surveys are an attempt to visualize the hydrogeological features under the surface and study how they are changing with time in respect to climate change. The reasoning and factors behind groundwater geophysical surveying are numerous, however, observing the trends has led to the above theories as to why the trends presented were observed.
3.6 Integrated analysis of geophysical methods and influencing factors
Detailed analysis of the data extracted from the selected papers illustrates different configurations, array types, investigation depths, and the promising factors which influence geophysical methods performance. The statistical metrics and configurations used for survey methods are shown in Table 2, which indicates the overall low Root Mean Square (RMS; <5%) and low L2 norm (Euclidean norm) for diverse configurations reflect accuracy with best fitness. The geological setting affects the performance and choice of the geophysical method to use. Table 3 shows the distribution of the geophysical survey method based on geological settings and soil types. ERT ranked first based on the geological setting used in a diverse range of soil, followed by EM and then GPR (comparatively less literature for ground water recharge estimation). Depth of investigation (DOI) is also an important factor for considering the geophysical method selection for investigation. Figure 6 presents the investigation depth (m) across geophysical methods with array types. Figure 6 showed that maximum investigation depth was noted for EM followed by ERT and GPR. The configuration or array type used in the selected research is plotted against the number of papers (Figure 7). Overall, the 2D ERT configuration was found to be the maximum followed by pole-dipole and dipole–dipole, VES, TDEM and Wenner array. Various environmental and subsurface factors complicate the data and interpretation of the geophysical methods. Details of the factors and their characteristics affecting the geophysical survey methods are presented in Table 4. Among the factors, subsurface heterogeneity and high material conductivity often reduce resolution and distort signals, influencing all methods in conductive soils. ERT and EM measurements are affected by salinity and saturation. The GPR signals are attenuated in saturated and saline conditions. Data quality is affected by poor electrode-ground contact topography and cultural noise. Seasonal variability and frequency-depth trade-offs affect the resolution and accuracy of the survey. The effectiveness and repeatability of the geophysical survey methods are influenced by weather conditions and water table depth. Considering these factors, an adaptable and well-planned geophysical survey method selection in diverse geological settings can enhance the precision of groundwater recharge estimation.
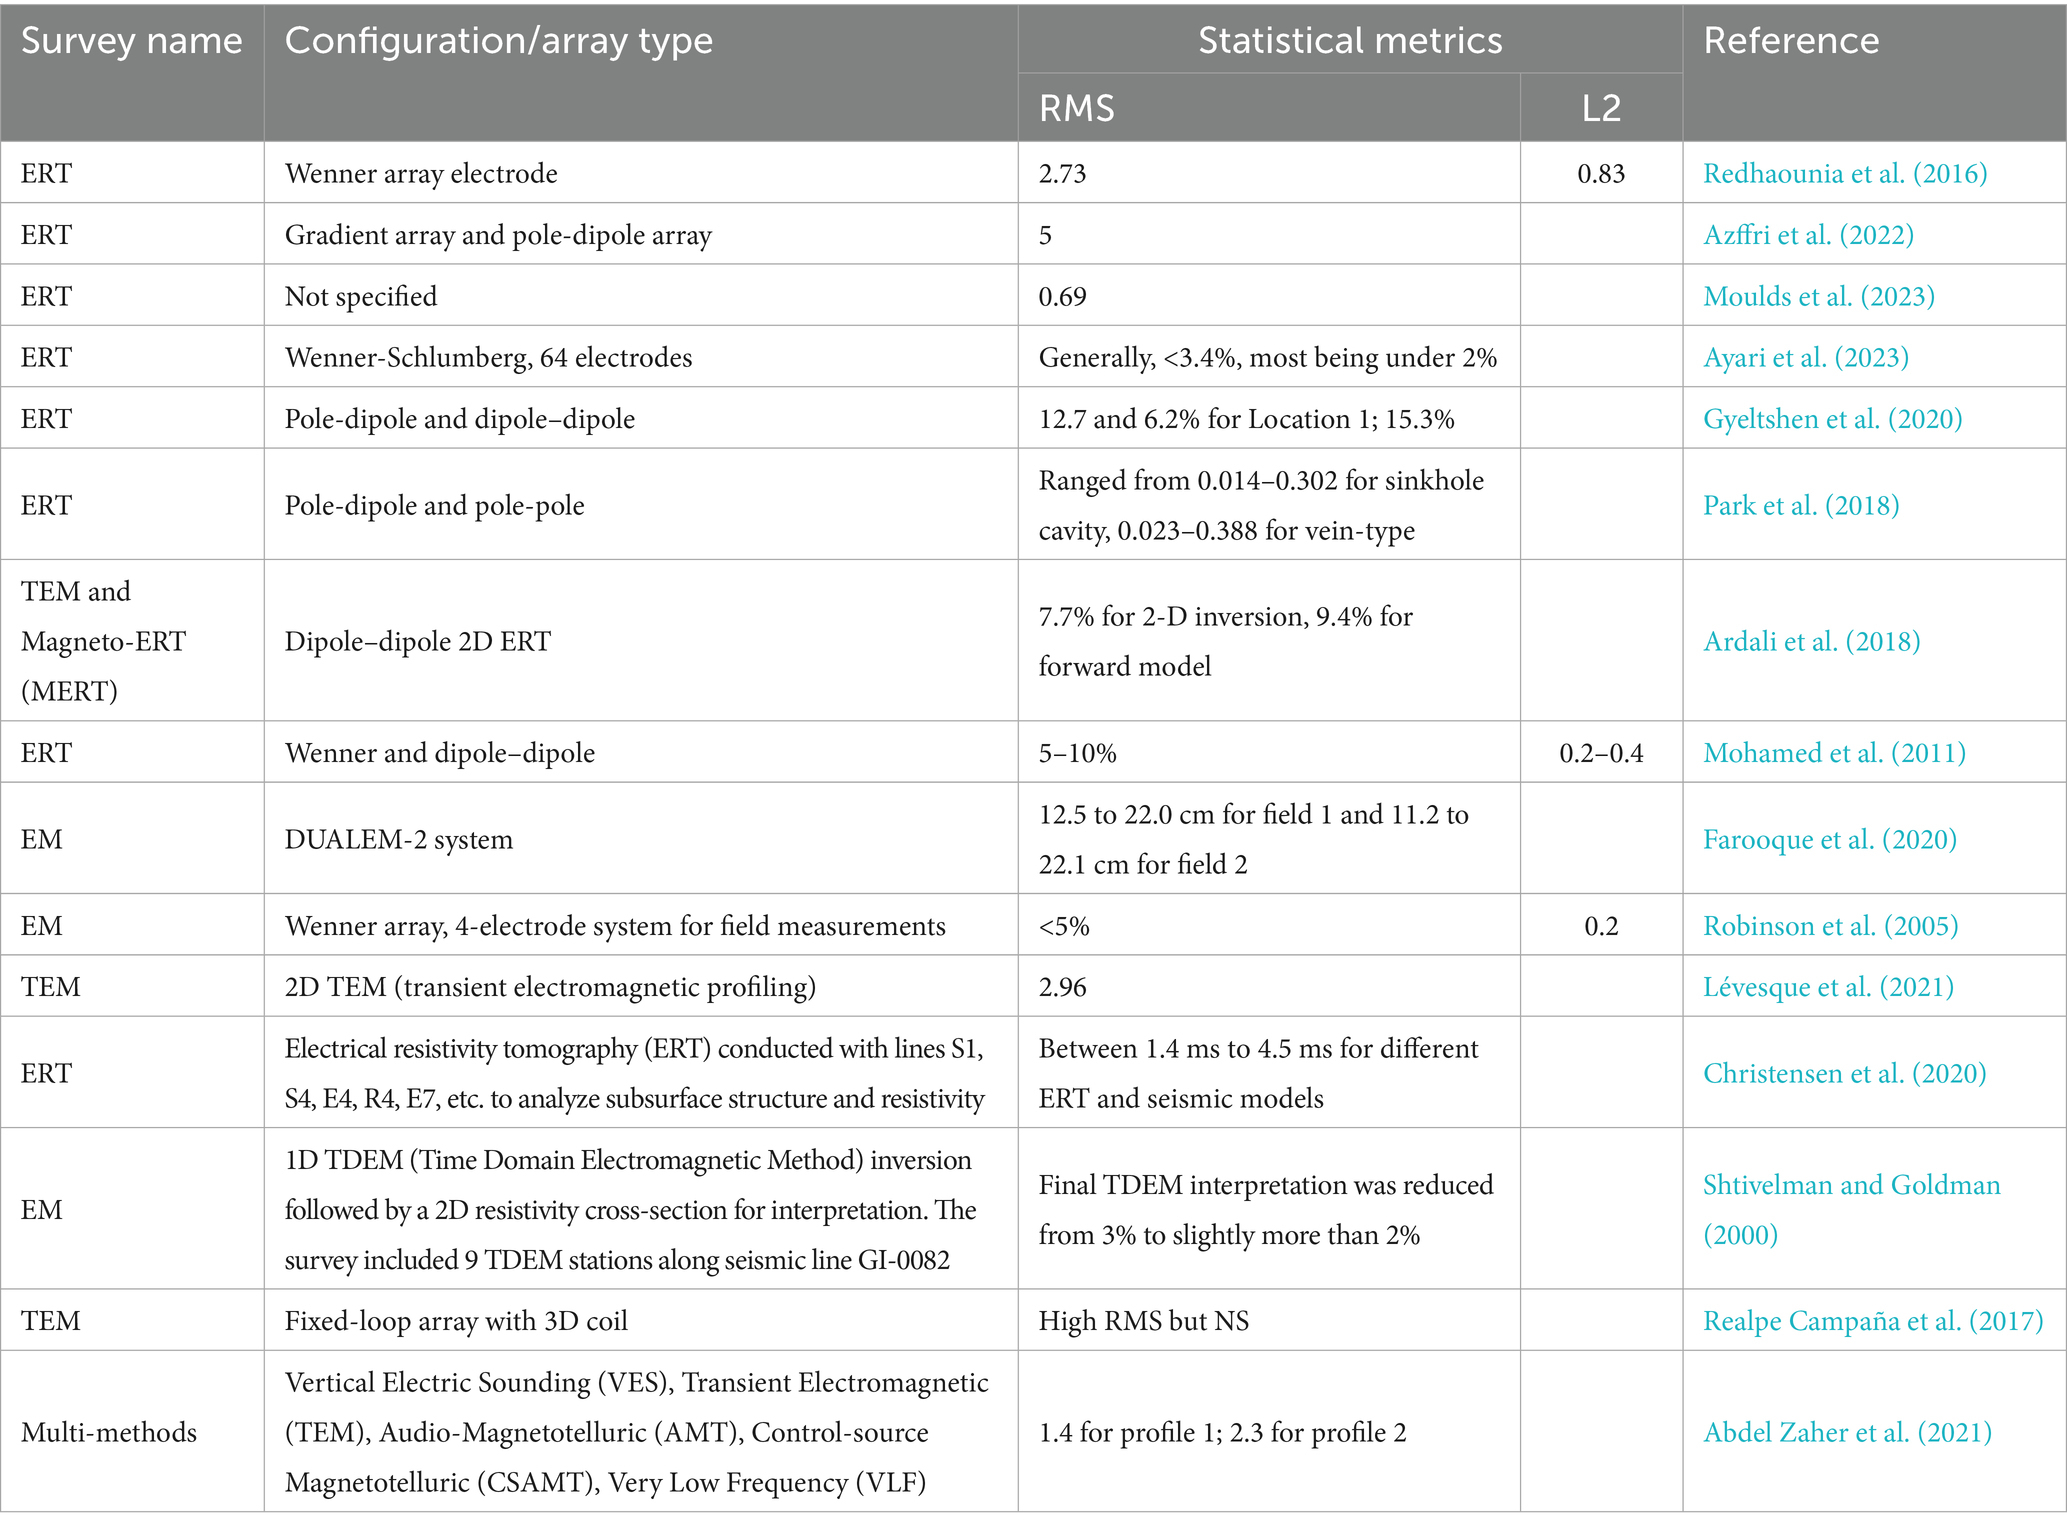
Table 2. Statistical metrics and configuration of the geophysical surveys used in the selected literature for groundwater recharge estimation.
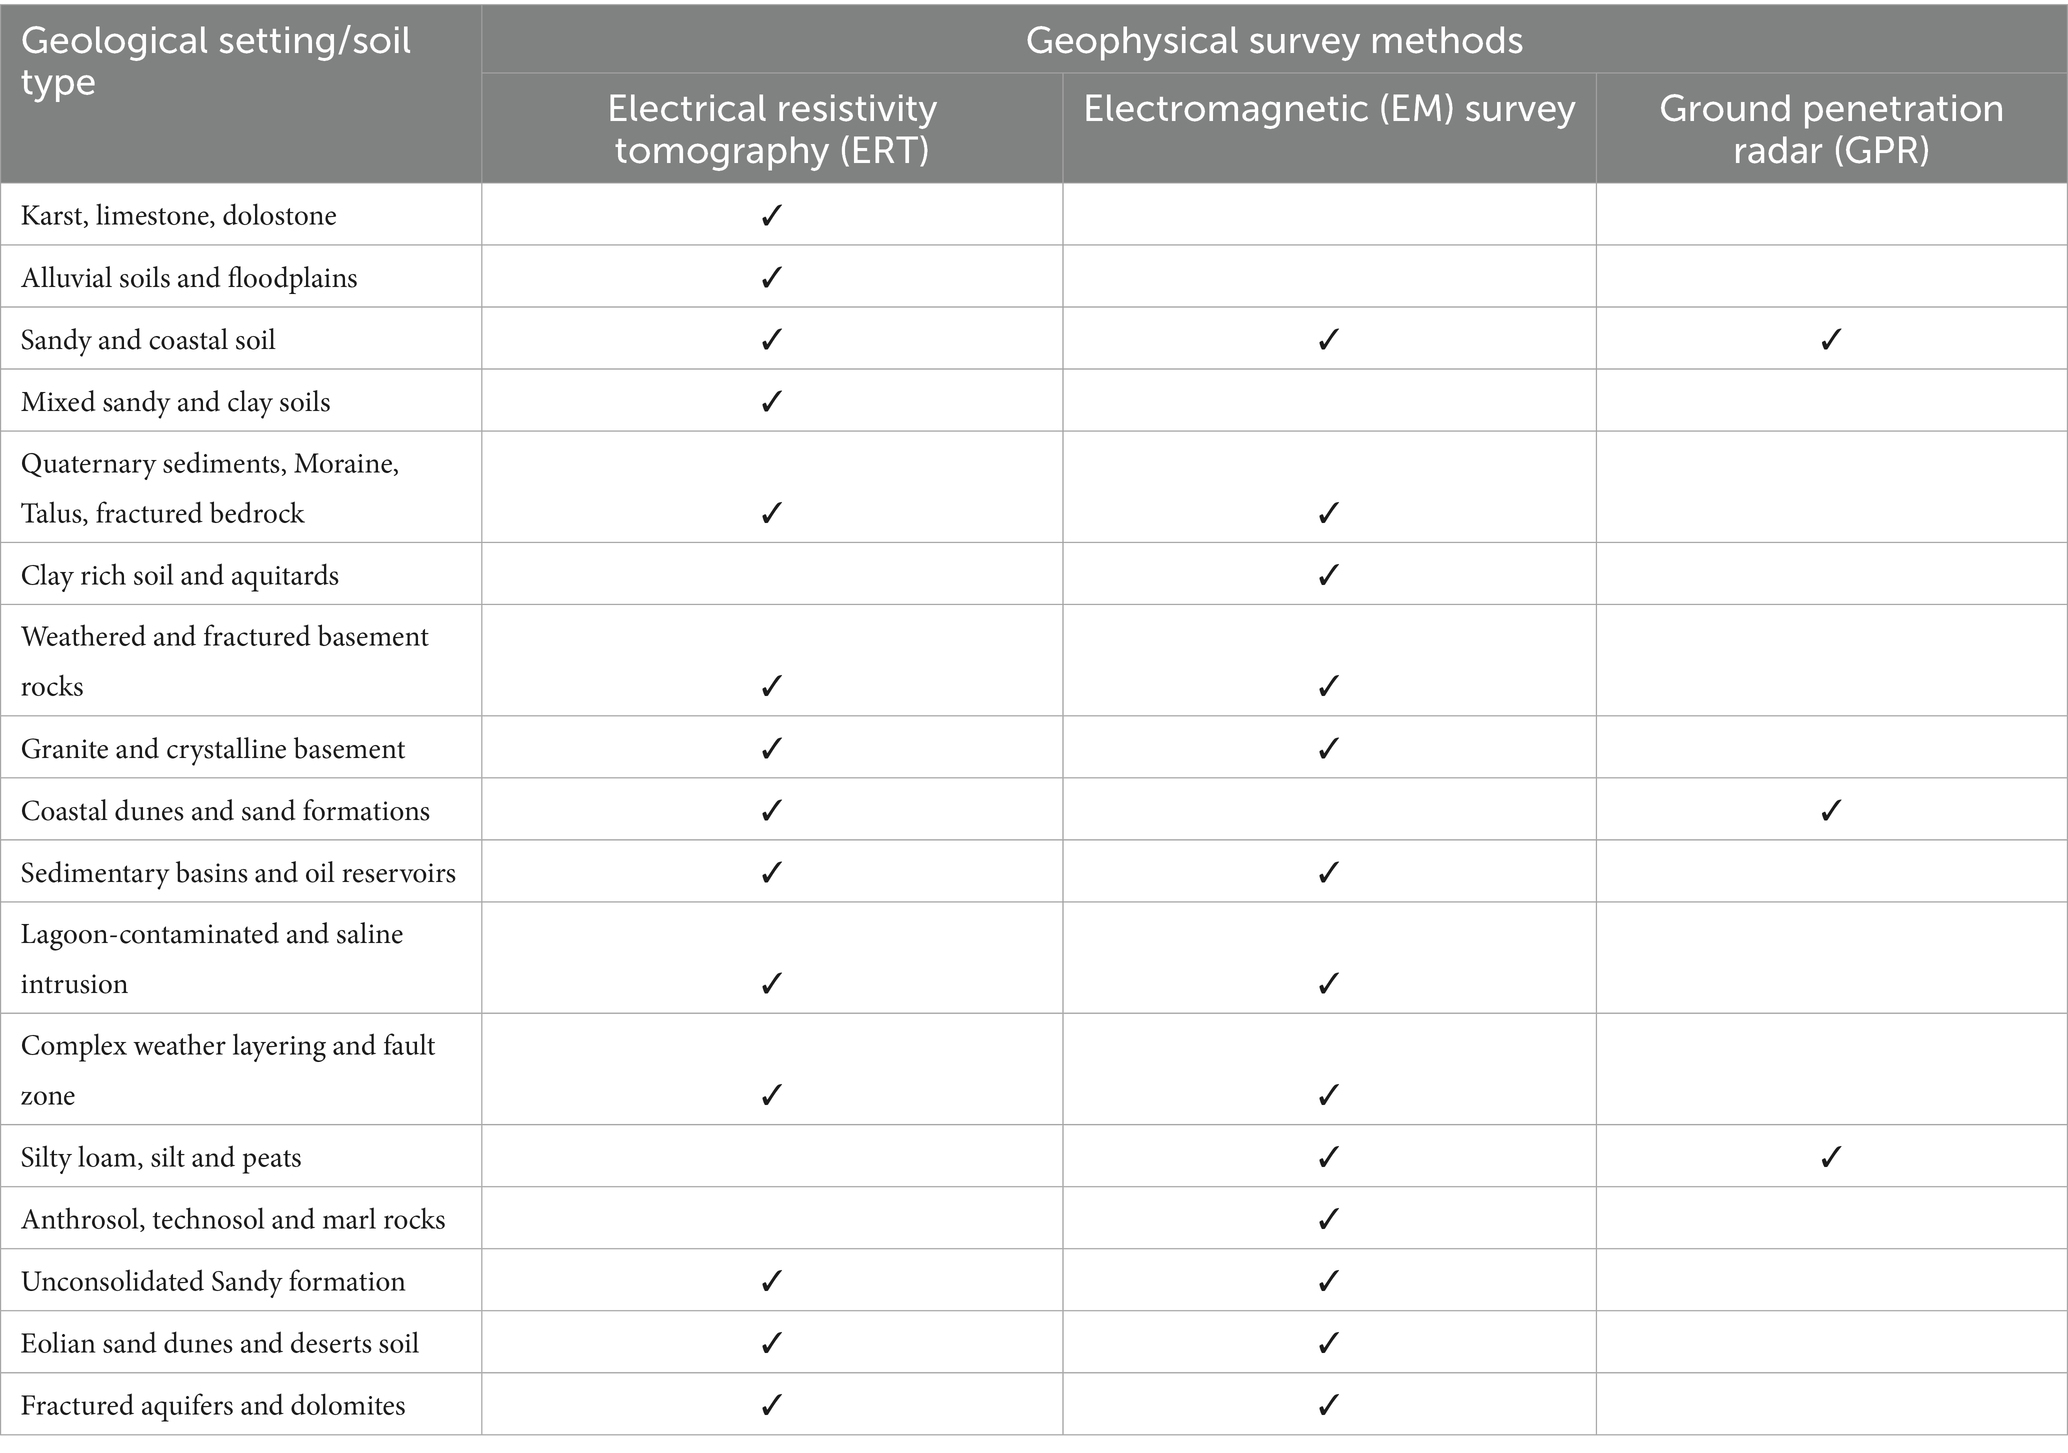
Table 3. Geophysical methods (ERT, EM, and GPR) used in selected papers for different geological settings and soil types.
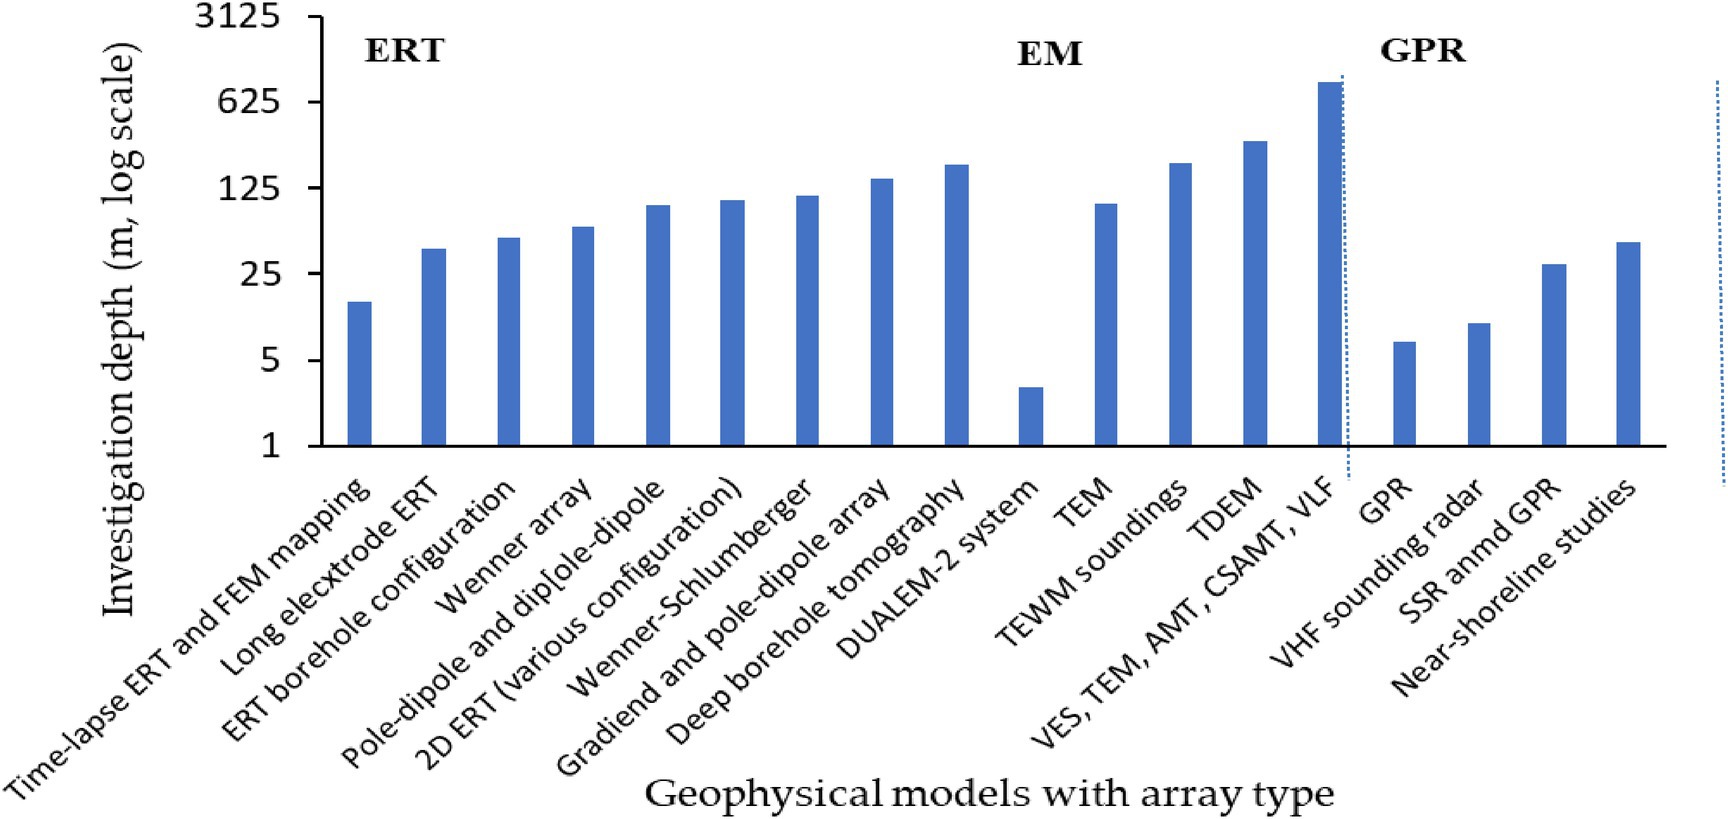
Figure 6. Investigation depth (m) for ERT, EM and GPR with configuration/array type used in the included literature. Where, DUALEM (Dual-Axis Electromagnetic), TEM (Transient Electromagnetic), TEWM (Time-Domain Electromagnetic Waveform Method), VES (Vertical Electrical Sounding), AMT (Audio-Magnetotelluric), CSMAT (Controlled Source Audio-Magnetotelluric), VLF (Very Low Frequency), VHF (Very High Frequency) and SSR (Seismic Surface Refraction).
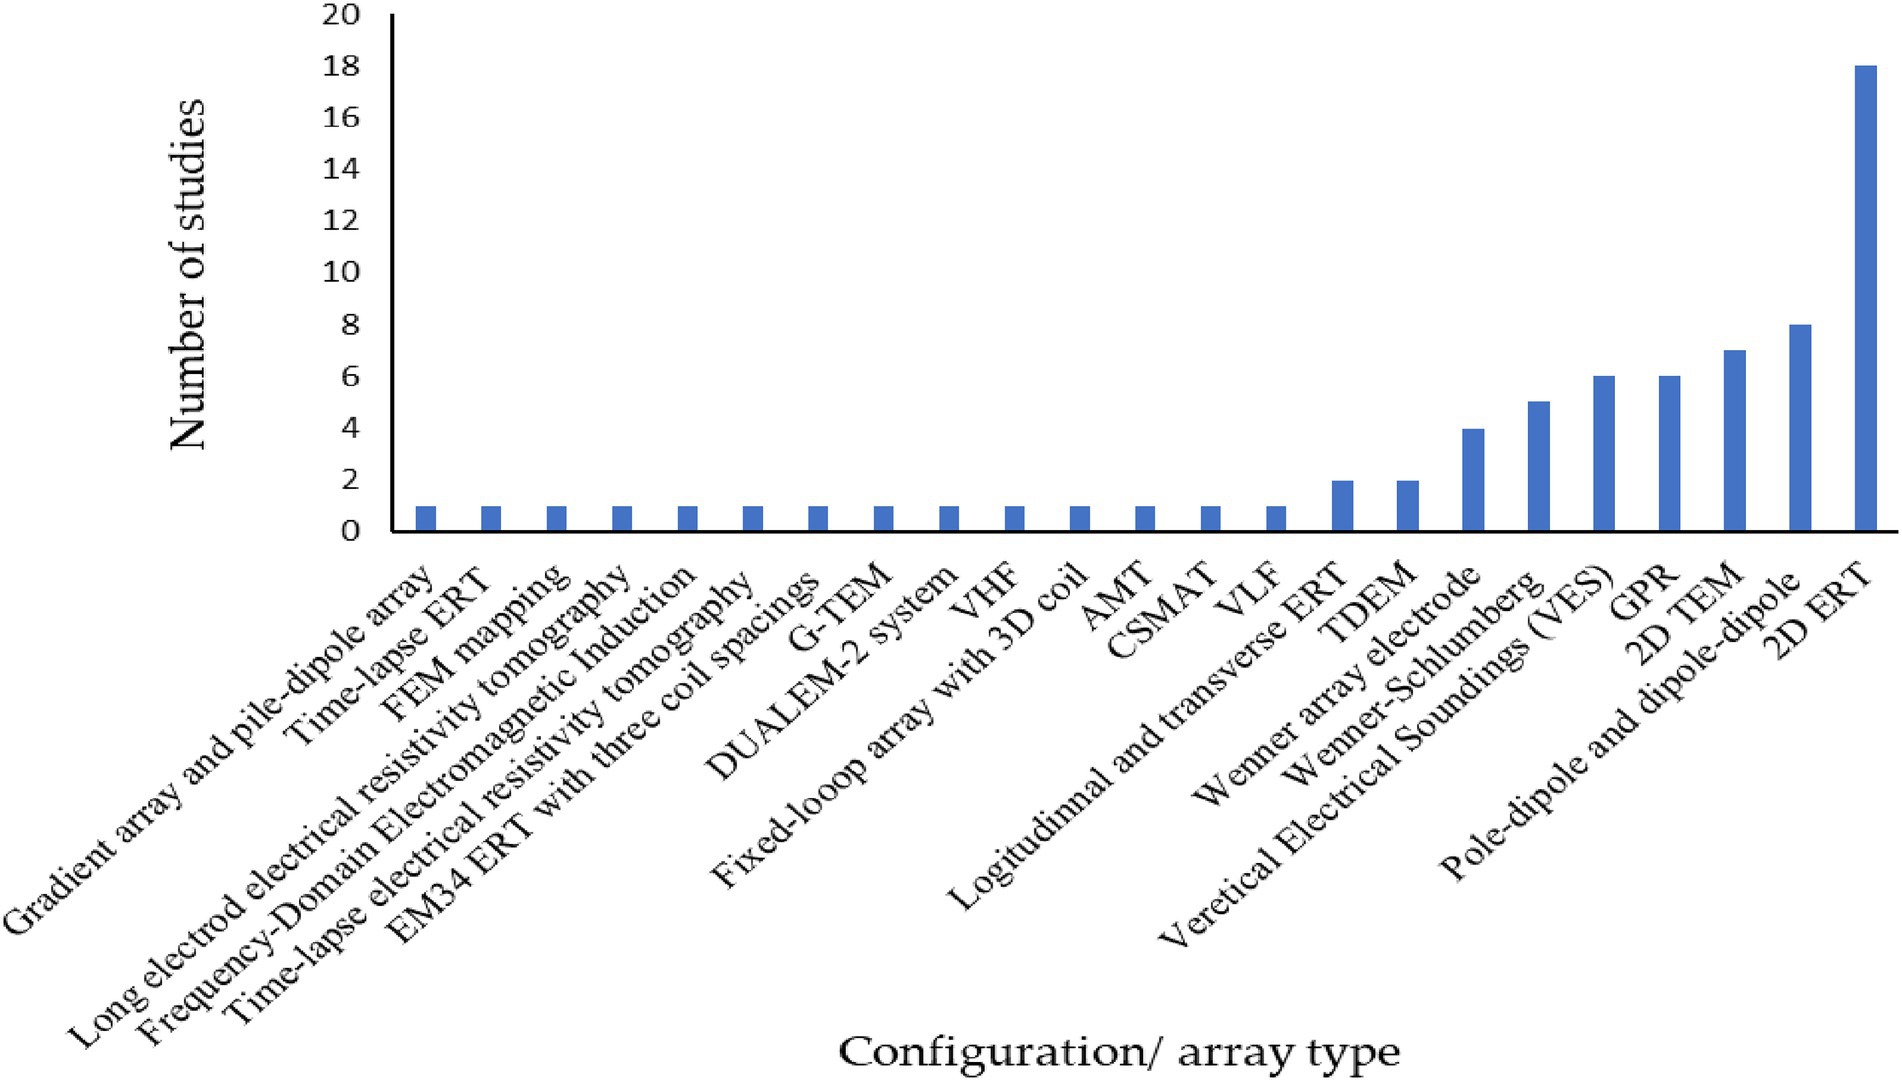
Figure 7. Configuration/array type of geophysical methods used in the included literature. Where, DUALEM (Dual-Axis Electromagnetic), TEM (Transient Electromagnetic), TDEM (Time-Domain Electromagnetic Waveform Method), VES (Vertical Electrical Sounding), AMT (Audio-Magnetotelluric), CSMAT (Controlled Source Audio-Magnetotelluric), VLF (Very Low Frequency) and VHF (Very High Frequency).
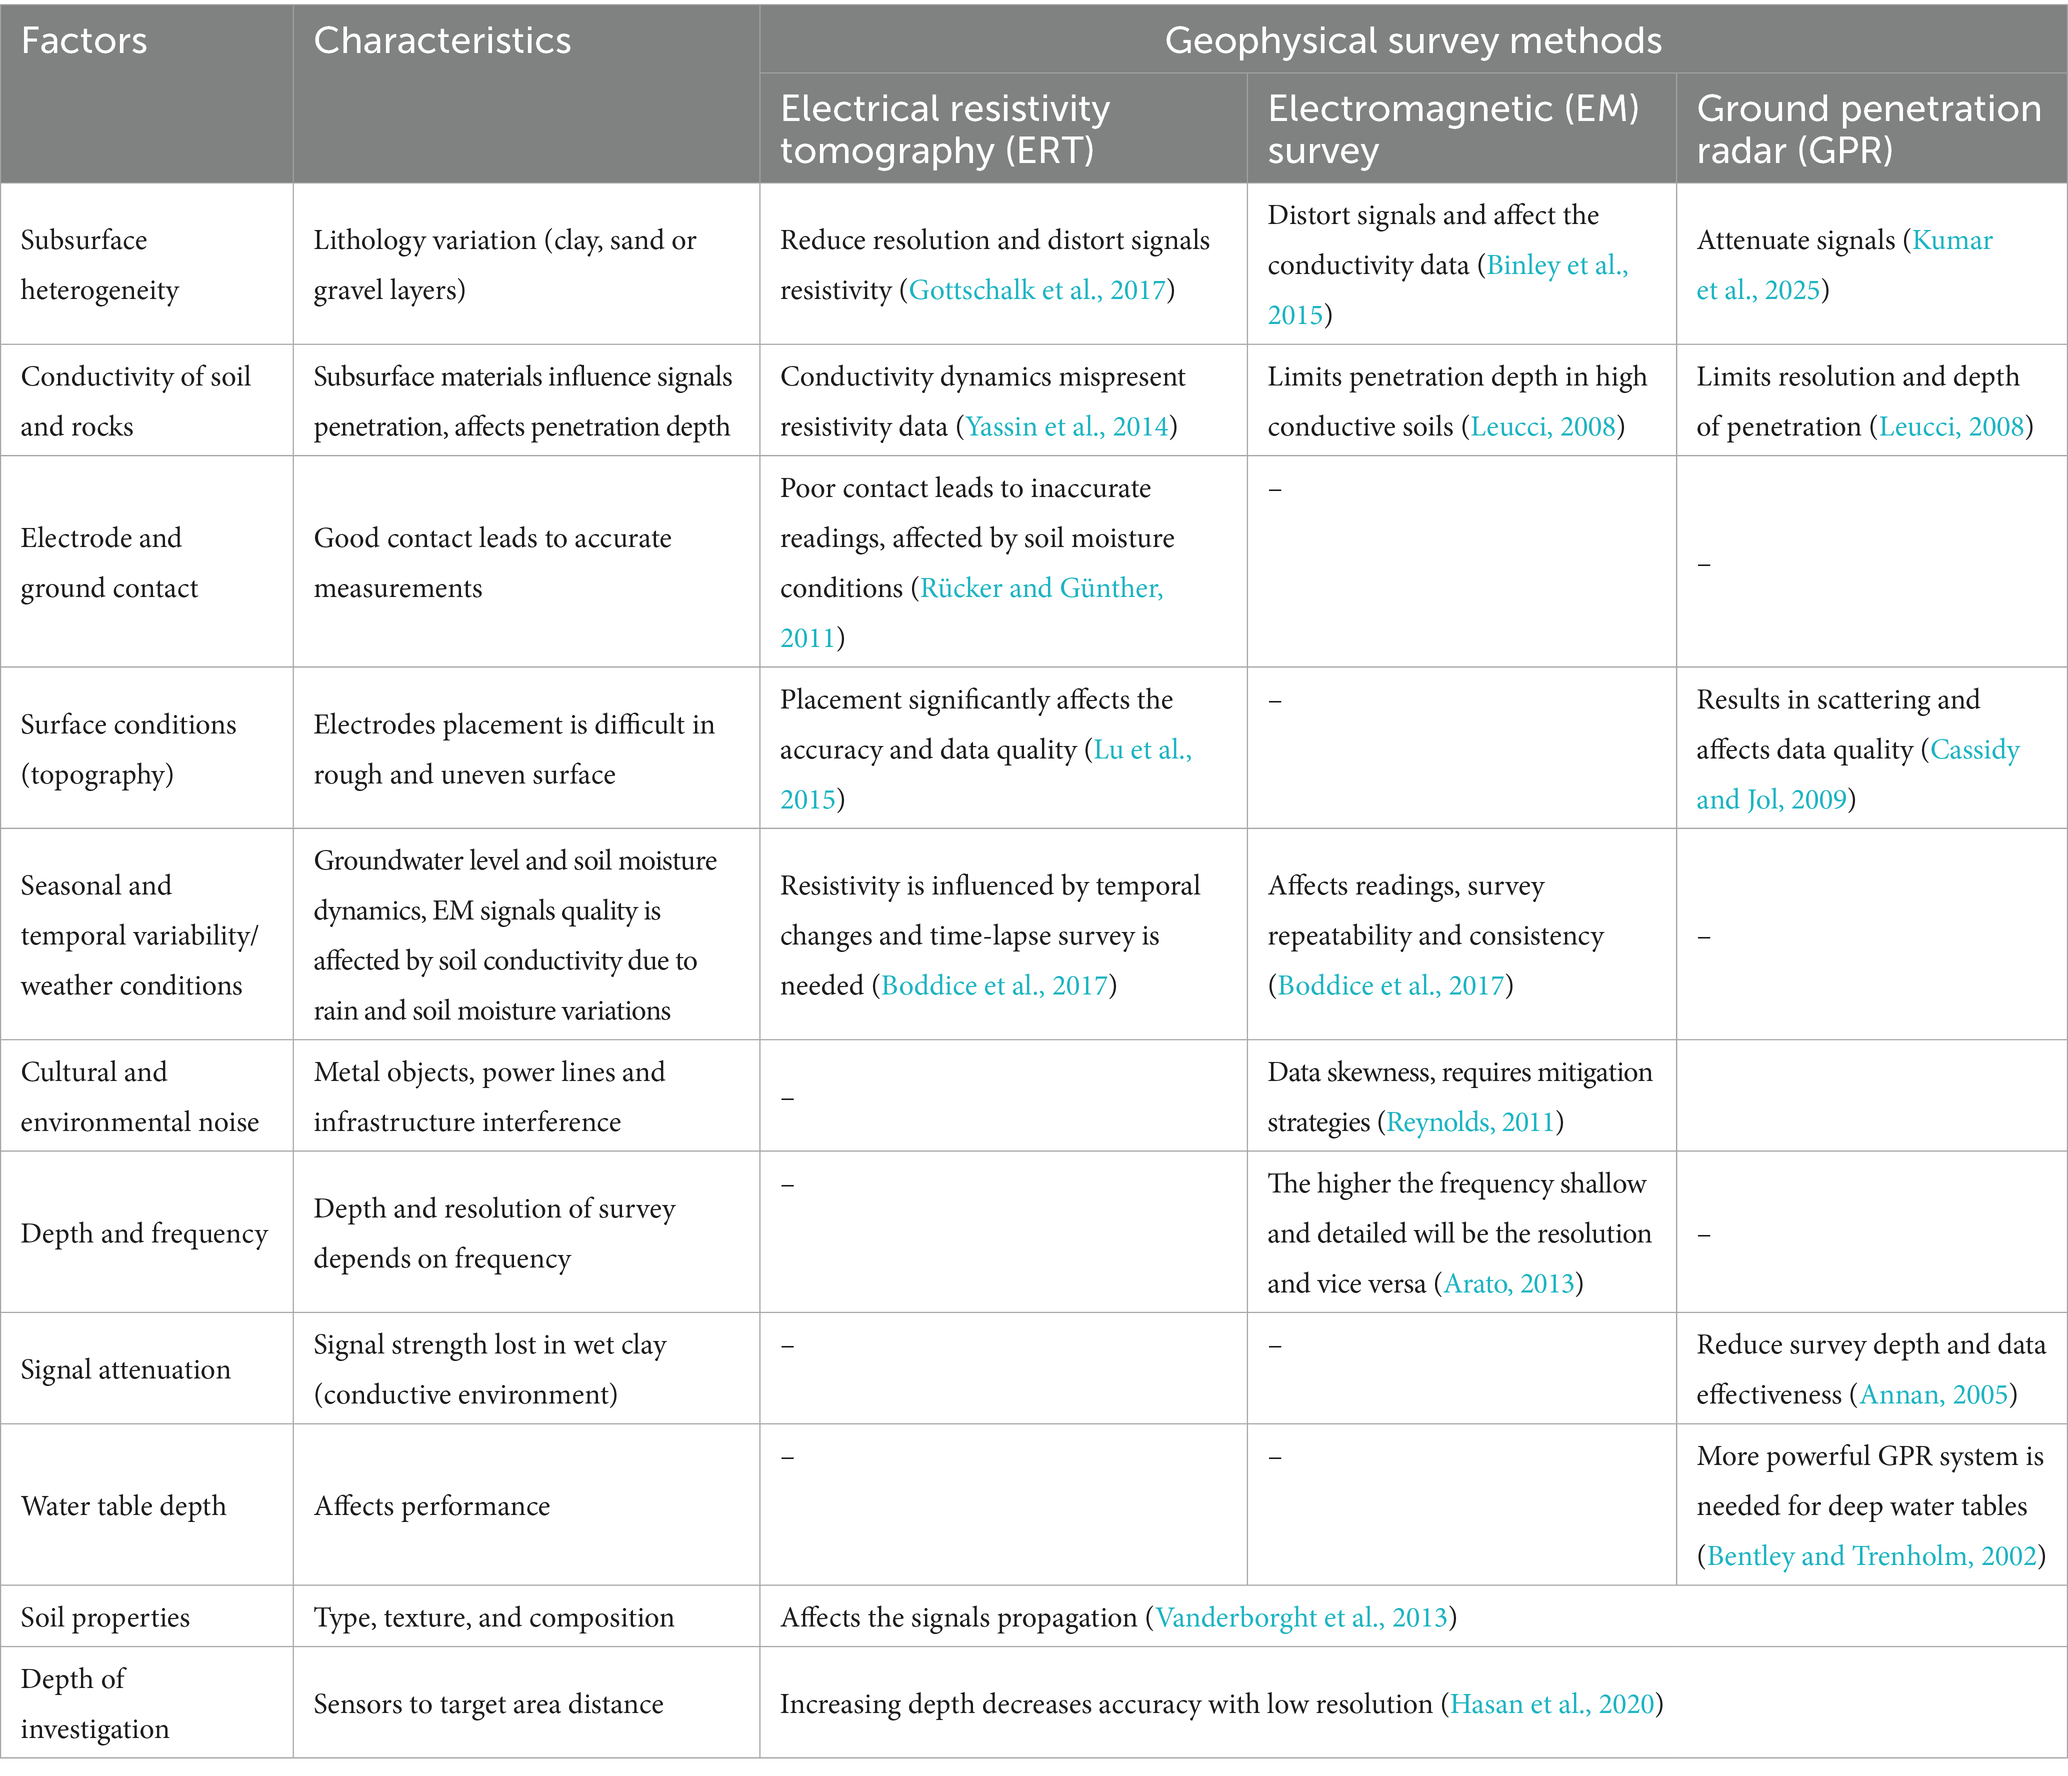
Table 4. Factors influencing groundwater recharge estimation through geophysical survey methods.
3.7 Limitations reported in existing literature
Besides the critical insights into geophysical models for groundwater recharge estimations, the limitations reported in the included literature are summarized. Among the limitations of the geophysical methods, studies reported that depth and resolution affect the survey performance. ERT is limited to shallow depths (up to 50 m), which restricts deep subsurface exploration, and additional techniques like jump in magnetic potential and magnetic data are needed to assess the deeper investigations (Gao et al., 2018). GPR penetration is limited (1–3 m) assuming uniform resistivity thereby affecting precision (Albuquerque et al., 2022; Mesbah et al., 2017). In TEM and ERT, the limited vertical resolution affects the small-scale variations (Christensen et al., 2020; Ronczka et al., 2015). The potential inaccuracies due to variations in vertical resolution and characteristics are reported while merging SSR and GPR datasets (Cardimona et al., 1998; Mohammadi Vizheh et al., 2020). Data quality and environmental influence are also reported to influence recharge estimation through geophysical models. Environmental factors such as salinity, soil heterogeneity, and other instrumental errors (noise and system failure) lead to inaccuracy (Busato et al., 2019; Heggy et al., 2023). Surface conditions and electrode spacing also affect the geological results (Andrade, 2011; Singh and Tripura, 2023). Jiang et al. (2020) reported geometric issues in 2D and MRT assumptions in the vadose zone leading to artifacts. Methods integration and modeling are reported to be used for more accurate results (Ma et al., 2024). Zhang et al. (2021) stated that non-uniqueness and interpolation techniques limitations of models leads to uncertainty in resistivity. Terrian and seasonal variability are also reported by De Carlo et al. (2024), Robinson et al. (2005), and Singh and Tripura (2023). Certain studies also reported application-specific limitations due to shallow penetration and anthropogenic influence (Thapa et al., 2019; Zarroca et al., 2011) and limited clarity in conductive layers need for improved petrophysical models (Gómez et al., 2019). ERT faces certain challenges regarding data reliability due to electrodes mislocution distorting tomographic images, noise sensitivity, and environmental factors interfering in data interpretation. Some spatial constraints for electrode array like vegetation, compaction, pipes, fences and time consumed during large survey due to resolution issue in detecting shallow water without small electrode spacing (Oldenborger et al., 2005). GPR contains some limitations related to conductive soils compared to ERT and depth of penetration in saturated soils due to high attenuation of radar signals (Toushmalani et al., 2010). The TEM resolution decreases in depth, inefficient resistive materials and challenges in laterally or near-vertically confined structures (Binley et al., 2015).
4 Conclusion and way forward
Groundwater research via geophysical methods is a valuable tool for monitoring the world’s underground freshwater supplies. Climate change has had and will continue to have an impact on the groundwater recharge rates and withdrawals for human usage. The effects of the changing climate will undoubtedly have lasting implications on the groundwater resources of all biomes and affect all strata of life on planet earth. Groundwater exploration, monitoring, and mapping are essential areas of research that can help better understand the resources underneath our feet. It is for this reason that a scoping review of three prominent geophysical methods for imaging subsurface structure and water saturation was needed. This paper lays the foundation for those within the geophysical community to see the work that has been done, as well as trends that are emerging. A cursory discussion of the three prominent methods (ERT, EM, and GPR) was detailed in the paper for audiences unfamiliar with geophysical tools. The study ties into a broader concept of a scoping review with a PRISMA diagram showing the methodology and selection criterion for examining current research publications available. The results of the study yielded graphical data that was analyzed for trends. These trends reveal an increase in groundwater geophysical surveying worldwide indiscriminate of climate or geography. The study points to the idea that climate change is altering where these surveys are being conducted and pointing to larger climatic issues of the changing landscape around us. For example, the expanding of arid environments into areas that were once subtropical or the peril the Mediterranean climate is in as it slowly converts to a more arid climate are just two examples of the scientific community surveying sites changing with the climate. These are all factors that drive research and publications in groundwater geophysical surveying. The discussion section of the paper delves into nuances of socioeconomics that show disparity in what countries are publishing surveys.
The geological setting affects the performance of geophysical methods and choice of methods. Most studies used ERT followed by EM and GPR. Investigation depth was greatest for EM followed by ERT and GPR. The 2D ERT configuration was found to be the maximum followed by pole-dipole and dipole–dipole, VES, TDEM and Wenner array. Various influencing factors including subsurface heterogeneity and high material conductivity often reduce resolution and distort signals. Resistivity and EM measurements are affected by salinity and saturation while GPR signals are attenuated in saturated and saline conditions. ERT data quality is affected by poor electrode-ground contact topography and cultural noise. Seasonal variability and frequency-depth trade-offs affect resolution and accuracy of surveying methods. Effectiveness and repeatability of the geophysical surveys methods are influenced by weather conditions and water table depth. Considering these factors, an adaptable and well-planned geophysical survey method selection in diverse geological setting can enhance the precision of groundwater recharge estimation.
These geophysical methods are crucial for subsurface investigation and valuable insight into groundwater resources contamination, transport, and lithological variations. Each geophysical method offers unique strengths. ERT covers subsurface profiling but is sensitive to electrode contact and heterogeneity. For conductive zones EM surveys are very effective in conductive zones through the penetration depth in resistive materials is limited. GPR offers valuable investigations in mapping shallow groundwater. Despite the limitations including resolution issues, environmental interference and the potential gap for extensive validation, sensors technology advancement, data and models’ integration and machine learning are the avenues to overcome these challenges. Multimethod approach, calibration accuracy, interdisciplinary collaborations can optimize more accurate and reliable estimation of subsurface rechange and processes. Understanding the factors and limitations of the geophysical survey methods for groundwater recharge estimation is important for selecting the more suitable method and/or integration of methods for improving recharge estimation accuracy.
Based on current synthesis of geophysical methods applications, future research could explore machine learning and artificial intelligence models’ integration to process large geophysical and hydro-environmental datasets thereby improving the interpretation and spatial resolution of recharge zones mapping. Quantum sensor technologies development can increase precision and accuracy measurement. Unmanned aerial vehicles (UAVs) or drones’ integration into geophysical technologies can improve accessibility. Another possible solution is to combine all the geophysical methods to mitigate the individual limitations. Integration of models and AI-driven analytics with geophysical techniques can facilitate real-time monitoring with accuracy and efficiency of the assessment. The trend line slope of groundwater geophysical surveys shows no sign of slowing down in the coming years. Future work in this area will likely include maintaining updated reviews of the new technology that emerges from all corners of the globe. Geophysical tools adapt and change with time, and with the advent of additional global climate issues, this technology will be dependent on groundwater analysis more than ever. The historical climate areas are changing, and therefore, water stress/demand will change accordingly. This will provide a space for future work to observe trends in publications and, perhaps more importantly, what drives the trends seen in the future.
Author contributions
NA: Methodology, Conceptualization, Investigation, Writing – review & editing, Data curation, Writing – original draft, Formal analysis, Visualization. JC: Writing – original draft, Data curation, Writing – review & editing, Formal analysis, Visualization, Investigation, Methodology, Resources. GS: Writing – review & editing, Investigation, Writing – original draft, Data curation, Formal analysis, Visualization, Methodology. GR: Investigation, Formal analysis, Methodology, Writing – review & editing, Visualization, Data curation, Writing – original draft. AR: Writing – review & editing, Formal analysis, Writing – original draft, Investigation, Visualization, Data curation. YD: Conceptualization, Writing – review & editing, Funding acquisition, Supervision, Methodology, Project administration, Writing – original draft.
Funding
The author(s) declare that financial support was received for the research and/or publication of this article. This work is supported by Project GREEEN, project award number GR24-008, from AgBioResearch and MSU Extension at Michigan State University, in partnership with the Michigan Department of Agriculture and Rural Development, United States Geography Service 104b through Michigan State University Institute of Water Research, and the United States Department of Agricultural Specialty Crop Block Grant.
Acknowledgments
We appreciate the Michigan State University Irrigation Lab members for their support.
Conflict of interest
The authors declare that the research was conducted in the absence of any commercial or financial relationships that could be construed as a potential conflict of interest.
Generative AI statement
The author(s) declare that no Gen AI was used in the creation of this manuscript.
Publisher’s note
All claims expressed in this article are solely those of the authors and do not necessarily represent those of their affiliated organizations, or those of the publisher, the editors and the reviewers. Any product that may be evaluated in this article, or claim that may be made by its manufacturer, is not guaranteed or endorsed by the publisher.
References
Abdel Zaher, M., Younis, A., Shaaban, H., and Mohamaden, M. I. I. (2021). Integration of geophysical methods for groundwater exploration: a case study of El sheikh Marzouq area, Farafra oasis, Egypt. Egypt. J. Aquat. Res. 47, 239–244. doi: 10.1016/j.ejar.2021.03.001
Aderemi, B. A., Olwal, T. O., Ndambuki, J. M., and Rwanga, S. S. (2022). A review of groundwater management models with a focus on IoT-based systems. Sustainability (Switzerland). doi: 10.3390/su14010148
Al Atawneh, D., Cartwright, N., and Bertone, E. (2021). Climate change and its impact on the projected values of groundwater recharge: a review. J. Hydrol. (Amst.) 601:126602. doi: 10.1016/j.jhydrol.2021.126602
Albuquerque, G. M., Mansur, K. L., Silva, G. C., Mello, C. L., and Braga, M. A. (2022). Fault mapping and characterization of a coastal aquifer related to a mangrove ecosystem, using electrical resistivity tomography (ERT), ground penetrating radar (GPR) and hydrochemical data: the case of the Mangue de Pedra aquifer, Armação dos Búzios, Brazil. J. S. Am. Earth Sci. 120:104095. doi: 10.1016/j.jsames.2022.104095
Amanambu, A. C., Obarein, O. A., Mossa, J., Li, L., Ayeni, S. S., Balogun, O., et al. (2020). Groundwater system and climate change: present status and future considerations. J. Hydrol. (Amst.) 589:125163. doi: 10.1016/j.jhydrol.2020.125163
Andaryani, S., Nourani, V., Abbasnejad, H., Koch, J., Stisen, S., Klöve, B., et al. (2023). Spatio-temporal analysis of climate and irrigated vegetation cover changes and their role in lake water level depletion using a pixel-based approach and canonical correlation analysis. Sci. Total Environ. 873. doi: 10.1016/j.scitotenv.2023.162326
Andrade, R. (2011). Intervention of electrical resistance tomography (ERT) in resolving hydrological problems of a semi arid granite terrain of southern India. J. Geol. Soc. India 78, 337–344.
Annan, A. P. E. T. E. R. (2005). “GPR methods for hydrogeological studies” in Hydrogeophysics (Dordrecht: Springer, Netherlands), 185–213.
Aquilina, L., Stumpp, C., Tonina, D., and Buffington, J. M. (2023). “Hydrodynamics and geomorphology of groundwater environments” in Groundwater ecology and evolution (Elsevier), 3–37.
Arato, A. (2013). 2-D and 3-D tools for electrical imaging in environmental applications. Italy: Politecnico Di Torino.
Ardali, A. S., Tezkan, B., and Gürer, A. (2018). On the salt water intrusion into the Durusu Lake, Istanbul: a joint central loop TEM and multi-electrode ERT field survey. Pure Appl. Geophys. 175, 3037–3050. doi: 10.1007/s00024-018-1813-1
Aslam, R. A., Shrestha, S., and Pandey, V. P. (2018). Groundwater vulnerability to climate change: a review of the assessment methodology. Sci. Total Environ. 612, 853–875. doi: 10.1016/j.scitotenv.2017.08.237
Ayari, S., Gabtni, H., and Zouhri, L. (2023). Imaging seawater flow in porous media under climate change water stress using geophysics: a case study of Menzel Horr coastline in northeastern Tunisia, Mediterranean basin. Environ. Earth Sci. 82:499. doi: 10.1007/s12665-023-11199-1
Azffri, S. L., Ibrahim, M. F., and Gödeke, S. H. (2022). Electrical resistivity tomography and induced polarization study for groundwater exploration in the agricultural development areas of Brunei Darussalam. Environ. Earth Sci. 81:233. doi: 10.1007/s12665-022-10284-1
Bathla, S. (1999). Water resource potential in northern India: constraints and analyses of price and non-price solutions. Environ. Dev. Sustain. 1, 105–121. doi: 10.1023/A:1010098508624
Bednar, J. B. (2005). A brief history of seismic migration. Geophysics 70:3MJ-20MJ. doi: 10.1190/1.1926579
Benedetto, A., and Benedetto, F. (2014). “Application field–specific synthesizing of sensing technology: civil engineering application of ground-penetrating radar sensing technology” in Comprehensive materials processing: Thirteen volume set. Ed. S. Hashmi (Elsevier), V13-393–V13-425.
Benedetto, A., Tosti, F., Ortuani, B., Giudici, M., and Mele, M. (2015). Mapping the spatial variation of soil moisture at the large scale using GPR for pavement applications. Near Surface Geophysics, (USA: Elsevier) 13, 269–278.
Bentley, L. R., and Trenholm, N. M. (2002). The accuracy of water table elevation estimates determined from ground penetrating radar data. J. Environ. Eng. Geophys. 7, 37–53. doi: 10.4133/JEEG7.1.37
Binley, A., Hubbard, S. S., Huisman, J. A., Revil, A., Robinson, D. A., Singha, K., et al. (2015). The emergence of hydrogeophysics for improved understanding of subsurface processes over multiple scales. Water Resour. Res. 51, 3837–3866. doi: 10.1002/2015WR017016
Boddice, D., Metje, N., and Chapman, D. (2017). Unique insight into the seasonal variability of geophysical properties of field soils: practical implications for near-surface investigations. Near Surface Geophysics 15, 515–526. doi: 10.3997/1873-0604.2017020
Boretti, A., and Rosa, L. (2019). Reassessing the projections of the world water development report. NPJ Clean Water 2:15. doi: 10.1038/s41545-019-0039-9
Busato, L., Boaga, J., Perri, M. T., Majone, B., Bellin, A., and Cassiani, G. (2019). Hydrogeophysical characterization and monitoring of the hyporheic and riparian zones: the Vermigliana Creek case study. Sci. Total Environ. 648, 1105–1120. doi: 10.1016/j.scitotenv.2018.08.179
Cardimona, S. J., Clement, W. P., and Kadinsky-Cade, K. (1998). Seismic reflection and ground-penetrating radar imaging of a shallow aquifer. Geophysics 63, 1310–1317. doi: 10.1190/1.1444432
Cassidy, N. J., and Jol, H. M. (2009). “Ground penetrating radar data processing, modelling and analysis” in Ground Penetrating Radar: Theory and Applications, ed. M. Harry 141–176.
Christensen, C. W., Hayashi, M., and Bentley, L. R. (2020). Hydrogeological characterization of an alpine aquifer system in the Canadian Rocky Mountains. Hydrogeol. J. 28, 1871–1890. doi: 10.1007/s10040-020-02153-7
Cuthbert, M. O., Gleeson, T., Moosdorf, N., Befus, K. M., Schneider, A., Hartmann, J., et al. (2019). Global patterns and dynamics of climate–groundwater interactions. Nat. Clim. Chang. 9, 137–141. doi: 10.1038/s41558-018-0386-4
Davamani, V., John, J. E., Poornachandhra, C., Gopalakrishnan, B., Arulmani, S., Parameswari, E., et al., (2023). A critical review of climate change impacts on groundwater resources: a focus on current status, Future Possibilities, and Role of Simulation Models. Atmosphere. 15:122.
De Carlo, L., Turturro, A. C., and Caputo, M. C. (2024). Assessing soil moisture variability in a vineyard via frequency domain electromagnetic induction data. Front. Soil Sci. 3. doi: 10.3389/fsoil.2023.1290591
Dornik, A., Cheţan, M. A., Crişan, T. E., Heciko, R., Gora, A., Drăguţ, L., et al. (2024). Geospatial evaluation of the agricultural suitability and land use compatibility in Europe’s temperate continental climate region. Int. Soil Water Conserv. Res. 12, 908–919. doi: 10.1016/j.iswcr.2024.01.002
Fan, Y., Clark, M., Lawrence, D. M., Swenson, S., Band, L. E., Brantley, S. L., et al. (2019). Hillslope hydrology in global change research and earth system modeling. Water Resour. Res. doi: 10.1029/2018WR023903
Farooque, A. A., Khan, F. S., Zaman, Q. U., Easu, T. J., and Schumann, A. W. (2020). Estimation of water table depth using DUALEM-2 system. Comput. Electron. Agric. 169:105227. doi: 10.1016/j.compag.2020.105227
Gao, Q., Shang, Y., Hasan, M., Jin, W., and Yang, P. (2018). Evaluation of a weathered rock aquifer using ERT method in South Guangdong, China. Water 10:293. doi: 10.3390/w10030293
Gómez, E., Larsson, M., Dahlin, T., Barmen, G., and Rosberg, J.-E. (2019). Alluvial aquifer thickness and bedrock structure delineation by electromagnetic methods in the highlands of Bolivia. Environ. Earth Sci. 78:84. doi: 10.1007/s12665-019-8074-x
Gong, C., Cook, P. G., Therrien, R., Wang, W., and Brunner, P. (2023). On groundwater recharge in variably saturated subsurface flow models. Water Resour. Res. 59. doi: 10.1029/2023WR034920
Gottschalk, I. P., Hermans, T., Knight, R., Caers, J., Cameron, D. A., Regnery, J., et al. (2017). Integrating non-colocated well and geophysical data to capture subsurface heterogeneity at an aquifer recharge and recovery site. J Hydrol (Amst) 555, 407–419. doi: 10.1016/j.jhydrol.2017.10.028
Greenwood, W., and Buth, T. (2017). Electrical resistivity surveying for characterizing contaminated sites : Geoengineer. Available at: https://www.geoengineer.org/education/web-class-projects/cee-549-geoenvironmental-engineering-fall-2017/assignments/electrical-resistivity-tomography-for-characterizing-contaminated-sites
Grelle, G., and Guadagno, F. M. (2009). Seismic refraction methodology for groundwater level determination: “water seismic index.”. J. Appl. Geophys. 68, 301–320. doi: 10.1016/j.jappgeo.2009.02.001
Gyeltshen, S., Tran, T. V., Teja Gunda, G. K., Kannaujiya, S., Chatterjee, R. S., and Champatiray, P. K. (2020). Groundwater potential zones using a combination of geospatial technology and geophysical approach: case study in Dehradun, India. Hydrol. Sci. J. 65, 169–182. doi: 10.1080/02626667.2019.1688334
Hasan, M., Shang, Y., Jin, W., and Akhter, G. (2020). An engineering site investigation using non-invasive geophysical approach. Environ. Earth Sci. 79:265. doi: 10.1007/s12665-020-09013-3
Heggy, E., Normand, J. C. L., Palmer, E. M., Scabbia, G., Al-Maktoumi, A. K. S., Mazzoni, A., et al. (2023). Probing shallow aquifers in hyperarid dune fields using VHF sounding radar. IEEE Trans. Geosci. Remote Sens. 61, 1–22. doi: 10.1109/TGRS.2023.3306286
Hussein, M. A., Ali, M. Y., and Hussein, H. A. (2023). Groundwater investigation through electrical resistivity tomography in the Galhareri District, Galgaduud region, Somalia: insights into hydrogeological properties. Water (Switzerland) 15:3317. doi: 10.3390/w15183317
Jiang, C., Igel, J., Dlugosch, R., Müller-Petke, M., Günther, T., Helms, J., et al. (2020). Magnetic resonance tomography constrained by ground-penetrating radar for improved hydrogeophysical characterization. Geophysics 85, JM13–JM26. doi: 10.1190/geo2020-0052.1
Jourde, H., and Wang, X. (2023). Advances, challenges and perspective in modelling the functioning of karst systems: a review. Environ. Earth Sci. 82:396. doi: 10.1007/s12665-023-11034-7
Judeh, T., Bian, H., and Shahrour, I. (2021). GIS-based spatiotemporal mapping of groundwater potability and palatability indices in arid and semi-arid areas. Water (Basel) 13:1323. doi: 10.3390/w13091323
Klassen, J., and Allen, D. M. (2017). Assessing the risk of saltwater intrusion in coastal aquifers. J. Hydrol. (Amst.). 551, 730–745. doi: 10.1016/j.jhydrol.2017.02.044
Konapala, G., Mishra, A. K., Wada, Y., and Mann, M. E. (2020). Climate change will affect global water availability through compounding changes in seasonal precipitation and evaporation. Nat. Commun. 11:3044. doi: 10.1038/s41467-020-16757-w
Kumar, B. S., Baraha, S., Sahoo, A. K., and Maiti, S. (2025). Enhancing subsurface exploration: a comprehensive review of advanced clutter removal techniques for ground penetrating radar imaging. Measurement 239:115432. doi: 10.1016/j.measurement.2024.115432
Lall, U., Josset, L., and Russo, T. (2020). A snapshot of the world’s groundwater challenges. Annual Review of Environment and Resources, 45, 171–194.
Leucci, G. (2008). Ground penetrating radar: the electromagnetic signal attenuation and maximum penetration depth. Scholar. Res. Exc. 2008, 1–7. doi: 10.3814/2008/926091
Lévesque, Y., Walter, J., and Chesnaux, R. (2021). Transient electromagnetic (TEM) surveys as a first approach for characterizing a regional aquifer: the case of the saint-Narcisse moraine, Quebec, Canada. Geosciences 11:415. doi: 10.3390/geosciences11100415
Lionello, P., Abrantes, F., Gacic, M., Planton, S., Trigo, R., and Ulbrich, U. (2014). The climate of the Mediterranean region: research progress and climate change impacts. Reg. Environ. Chang. 14, 1679–1684. doi: 10.1007/s10113-014-0666-0
Lu, D.-B., Zhou, Q.-Y., Junejo, S. A., and Xiao, A.-L. (2015). A systematic study of topography effect of ERT based on 3-D modeling and inversion. Pure Appl. Geophys. 172, 1531–1546. doi: 10.1007/s00024-014-1015-4
Luo, Q., Yang, Y., Qian, J., Wang, X., Chang, X., Ma, L., et al. (2020). Spring protection and sustainable management of groundwater resources in a spring field. J. Hydrol. 582. doi: 10.1016/j.jhydrol.2019.124498
Ma, J., Kong, K., Wu, Z., Jia, C., Wang, L., Pan, G., et al. (2024). Identification and water-rich evaluation of shallow buried paleochannel in saltwater intrusion areas using the ERT method. Environ. Earth Sci. 83:19. doi: 10.1007/s12665-023-11275-6
Matta, G. (2010). Freshwater: resources and pollution. Environ. Conserv. J. 11, 161–169. doi: 10.36953/ecj.2010.110330
McLachlan, P., Blanchy, G., Chambers, J., Sorensen, J., Uhlemann, S., Wilkinson, P., et al. (2021). The application of electromagnetic induction methods to reveal the hydrogeological structure of a riparian wetland. Water Resour. Res. 57. doi: 10.1029/2020WR029221
Mesbah, H. S., Morsy, E. A., Soliman, M. M., and Kabeel, K. (2017). Joint application of geoelectrical resistivity and ground penetrating radar techniques for the study of hyper-saturated zones. Case study in Egypt. NRIAG J. Astron. Geophys. 6, 256–266. doi: 10.1016/j.nrjag.2017.04.002
Mohamed, N. E., Yaramanci, U., Kheiralla, K. M., and Abdelgalil, M. Y. (2011). Assessment of integrated electrical resistivity data on complex aquifer structures in NE Nuba Mountains – Sudan. J. Afr. Earth Sci. 60, 337–345. doi: 10.1016/j.jafrearsci.2011.03.011
Mohammadi Vizheh, M., Oskooi, B., Bastani, M., and Kalscheuer, T. (2020). Using GPR data as constraints in RMT data inversion for water content estimation: a case study in Heby, Sweden. Pure Appl. Geophys. 177, 2903–2929. doi: 10.1007/s00024-019-02391-1
Morante-Carballo, F., Montalván-Burbano, N., Quiñonez-Barzola, X., Jaya-Montalvo, M., and Carrión-Mero, P. (2022). What do we know about water scarcity in semi-arid zones? A global analysis and research trends. Water 14:2685. doi: 10.3390/w14172685
Moulds, M., Gould, I., Wright, I., Webster, D., and Magnone, D. (2023). Use of electrical resistivity tomography to reveal the shallow freshwater–saline interface in the fens coastal groundwater, eastern England (UK). Hydrogeol. J. 31, 335–349. doi: 10.1007/s10040-022-02586-2
Mukherjee, A., Scanlon, B. R., Aureli, A., Langan, S., Guo, H., and McKenzie, A. (2021). “Global groundwater: From scarcity to security through sustainability and solutions” in Global Groundwater. Ed. L. Munro (USA: Elsevier), 3–20.
National Science Board (2021). Publications output: U.S. trends and international comparisons. USA: Science & Engineering Indicators.
Ntona, M. M., Busico, G., Mastrocicco, M., and Kazakis, N. (2022). Modeling groundwater and surface water interaction: an overview of current status and future challenges. Sci. Total Environ. 846:157355. doi: 10.1016/j.scitotenv.2022.157355
Oksana, T., and Dmytro, G. (2021). “Earth’s water distribution” in Clean water and sanitation. Ed. Shiklomanov. (Cham: Springer International Publishing), 1–14.
Oldenborger, G. A., Routh, P. S., and Knoll, M. D. (2005). Sensitivity of electrical resistivity tomography data to electrode position errors. Geophysical Journal International, 163, 1–9.
Oswald Spring, Ú., and Oswald Spring, Ú. (2019). “Interdisciplinarity in water research and water models” in Úrsula Oswald Spring: Pioneer on Gender, Peace, Development, Environment, Food and Water: With a Foreword by Birgit Dechmann, (Springer) 17, 507–541.
Park, Y., Kim, Y., Park, S. K., Shin, W. J., and Lee, K. S. (2018). Water quality impacts of irrigation return flow on stream and groundwater in an intensive agricultural watershed. Sci. Total Environ. 630, 859–868. doi: 10.1016/j.scitotenv.2018.02.113
Poluha, B., Porsani, J. L., Almeida, E. R., dos Santos, V. R. N., and Allen, S. J. (2017). Depth estimates of buried utility systems using the GPR method: studies at the IAG/USP geophysics test site. Int. J. Geosci. 8, 726–742. doi: 10.4236/ijg.2017.85040
Rauf, M., Khan, A. M., Ansari, A., Jilani, M. T., and Shahzeb, T. (2019). Skin depth verification of the electromagnetic waves for hydrocarbon detection. Int. J. Appl. Electromagn. Mech. 60, 313–326. doi: 10.3233/JAE-180105
Realpe Campaña, J. D., Porsani, J. L., Bortolozo, C. A., de Serejo Oliveira, G., and dos Monteiro Santos, F. A. (2017). Inversion of TEM data and analysis of the 2D induced magnetic field applied to the aquifers characterization in the Paraná basin, Brazil. J. Appl. Geophys. 138, 233–244. doi: 10.1016/j.jappgeo.2017.01.024
Redhaounia, B., Ilondo, B. O., Gabtni, H., Sami, K., and Bédir, M. (2016). Electrical resistivity tomography (ERT) applied to karst carbonate aquifers: case study from Amdoun, northwestern Tunisia. Pure Appl. Geophys. 173, 1289–1303. doi: 10.1007/s00024-015-1173-z
Reinecke, R., Wachholz, A., Mehl, S., Foglia, L., Niemann, C., and Döll, P. (2020). Importance of spatial resolution in global groundwater modeling. Groundwater 58, 363–376. doi: 10.1111/gwat.12996
Reynolds, J. M. (2011). An introduction to applied and environmental geophysics. UK: John Wiley & Sons.
Rezgui, H. (2018). In memory of professor Andrei Nikolaievitch Tikhonov (1906-1993) on the 25th anniversary of his death Hayat Rezgui. J. Humanist. Math. 8, 332–349. doi: 10.5642/jhummath.201801.16
Robinson, B. A., Cole, G., Carey, J. W., Witkowski, M., Gable, C. W., Lu, Z., et al. (2005). A Vadose zone flow and transport model for Los Alamos canyon, Los Alamos, New Mexico. Vadose Zone J. 4, 729–743. doi: 10.2136/vzj2004.0169
Ronczka, M., Voß, T., and Günther, T. (2015). Cost-efficient imaging and monitoring of saltwater in a shallow aquifer by using long electrode ERT. J. Appl. Geophys. 122, 202–209. doi: 10.1016/j.jappgeo.2015.08.014
Rücker, C., and Günther, T. (2011). The simulation of finite ERT electrodes using the complete electrode model. Geophysics 76, F227–F238. doi: 10.1190/1.3581356
Sethi, R. R., Kumar, A., and Sharma, S. P. (2009). Quantification of groundwater recharge in a hard rock terrain of Orissa: a case study. Water Sci. Technol. 60, 1319–1326. doi: 10.2166/wst.2009.403
Shaikh, M., and Birajdar, F. (2024). Groundwater and ecosystems: understanding the critical interplay for sustainability and conservation. EPRA Int. J. Multidiscipl. Res. 10, 181–186. doi: 10.36713/epra16111
Shtivelman, V., and Goldman, M. (2000). Integration of shallow reflection seismics and time domain electromagnetics for detailed study of the coastal aquifer in the Nitzanim area of Israel. J. Appl. Geophys. 44, 729–743. doi: 10.1016/S0926-9851(98)00053-6
Singh, S., and Tripura, J. (2023). Combined ERT survey and pumping test for correlation analysis of geoelectrical and aquifer parameters in hilly terrain. J. Earth Syst. Sci. 132:43. doi: 10.1007/s12040-023-02048-7
Smerdon, B. D. (2017). A synopsis of climate change effects on groundwater recharge. J Hydrol (Amst) 555, 125–128. doi: 10.1016/j.jhydrol.2017.09.047
Thapa, B. R., Shrestha, S. R., Okwany, R. O., and Neupane, M. (2019). Shallow aquifer potential mapping in the foothills of Churia in eastern Gangetic plain of Saptari District, Nepal. Appl Water Sci 9:92. doi: 10.1007/s13201-019-0971-3
Thomas, N., and Nigam, S. (2018). Twentieth-century climate change over Africa: seasonal Hydroclimate trends and Sahara Desert expansion. J. Clim. 31, 3349–3370. doi: 10.1175/JCLI-D-17-0187.1
Toushmalani, R. (2010). Application of geophysical methods in agriculture. Aust J Basic Appl Sci, 4, 6433–6439.
Turki, N., Elaoud, A., Gabtni, H., Trabelsi, I., and Khalfallah, K. K. (2019). Agricultural soil characterization using 2D electrical resistivity tomography (ERT) after direct and intermittent digestate application. Arabian Journal of Geosciences, 12, 1–11.
Urruela, A., Rivero, L., Casas, A., Garcia-Artigas, R., Sendrós, A., Lovera, R., et al. (2021). Improving the resolution of investigation using ERT instruments with a reduced number of electrodes. J. Appl. Geophys. 186:104239. doi: 10.1016/j.jappgeo.2020.104239
Vanderborght, J., Huisman, J. A., van der Kruk, J., and Vereecken, H. (2013). Geophysical methods for field-scale imaging of root zone properties and processes, Soil–water–root processes: advances in tomography and imaging, 61, 247–282.
Watlet, A., Kaufmann, O., Triantafyllou, A., Poulain, A., Chambers, J. E., Meldrum, P. I., et al. (2018). Imaging groundwater infiltration dynamics in the karst vadose zone with long-term ERT monitoring. Hydrology and Earth System Sciences, 22, 1563–1592.
Wheeler, J., and Cheadle, M. (2014). “Geophysics” in Reference module in earth systems and environmental sciences. Ed. S. A. Elias (USA: Elsevier).
Wiederhold, H., Kallesøe, A. J., Kirsch, R., Mecking, R., Pechnig, R., and Skowronek, F. (2021). Geophysical methods help to assess potential groundwater extraction sites. Grundwasser 26, 367–378. doi: 10.1007/s00767-021-00495-x
Wood, W. W., and Cherry, J. A. (2021). Food security and inaccurate quantification of groundwater irrigation use. Groundwater 59, 782–783. doi: 10.1111/gwat.13122
Yassin, R. R., Muhammad, R. F., Taib, S. H., and Al-Kouri, O. (2014). Application of ERT and aerial photographs techniques to identify the consequences of sinkholes hazards in constructing housing complexes sites over karstic carbonate bedrock in Perak, peninsular Malaysia. J. Geograp. Geol. 6:55. doi: 10.5539/jgg.v6n3p55
Zarroca, M., Bach, J., Linares, R., and Pellicer, X. M. (2011). Electrical methods (VES and ERT) for identifying, mapping and monitoring different saline domains in a coastal plain region (alt Empordà, Northern Spain). J. Hydrol. 409, 407–422. doi: 10.1016/j.jhydrol.2011.08.052
Zhang, J., Chen, K., Huang, H., Zhen, L., Ju, J., and Du, S. (2021). Discussion on monitoring and characterising group drilling pumping test within a massive thickness aquifer using the time-lapse transient electromagnetic method (TEM). Boll. Geofis. Teor. Appl. 62. doi: 10.4430/bgta0337
Keywords: groundwater recharge, geophysical surveys, hydro geophysics, electromagnetic, electrical resistivity tomography, ground penetrating radar, subsurface hydrology
Citation: Ali N, Chappuies J, Sloan G, Rouland G, Rai A and Dong Y (2025) A global perspective on electrical resistivity tomography, electromagnetic and ground penetration radar methods for estimating groundwater recharge zones. Front. Water. 7:1636613. doi: 10.3389/frwa.2025.1636613
Edited by:
Akhouri Pramod Krishna, Birla Institute of Technology, IndiaReviewed by:
Ionut Minea, Alexandru Ioan Cuza University, RomaniaTariku Takele, Dilla University, Ethiopia
Copyright © 2025 Ali, Chappuies, Sloan, Rouland, Rai and Dong. This is an open-access article distributed under the terms of the Creative Commons Attribution License (CC BY). The use, distribution or reproduction in other forums is permitted, provided the original author(s) and the copyright owner(s) are credited and that the original publication in this journal is cited, in accordance with accepted academic practice. No use, distribution or reproduction is permitted which does not comply with these terms.
*Correspondence: Younsuk Dong, ZG9uZ3lvdW5AbXN1LmVkdQ==