 Andres Goyburo
 Leonardo Gutierrez1
 Pedro Rau
 Waldo Lavado-Casimiro
- 1National Service of Meteorology and Hydrology of Peru (SENAMHI), Lima, Peru
- 2Water Research and Technology Center (CITA), Department of Civil and Environmental Engineering Universidad de Ingeniería y Tecnología (UTEC), Lima, Peru
Mudflows, a highly destructive natural phenomenon, frequently occurs in arid regions due to the activation of basins by extreme climate events. In Peru, the Pacific coastal basin and steep regions is particularly vulnerable to these events, which have caused significant damage and loss of life in recent years. This study aims to establish hourly rainfall thresholds for the initiation of mudflows events in Punta Hermosa, a region prone to these hazards. Acknowledging the shortcomings due to lack of observed precipitation data, this study utilizes gridded rainfall data to simulate mudflows events at an hourly scale. This methodology enables a more thorough investigation of rainfall patterns and their relationship with the occurrence of mudflows. Results indicates that the total rainfall during an event significantly influences the initiation of mudflows, with thresholds exceeding 10 mm consistently triggering these events. Furthermore, rainfall events lasting at least 5 h with an intensity of 1.13 mm/h or greater pose a substantial risk. The study emphasizes the significance of rainfall intensity, demonstrating that intensities surpassing 1.25 mm/h consistently result in mudflows. These findings offer valuable insights for developing reliable early warning systems and implementing effective mitigation strategies to safeguard vulnerable communities and infrastructure in Punta Hermosa and the applicability of this methodology for any other location in the Peruvian coast.
1 Introduction
Mudflows, defined as rapid gravity-driven surges of water mixed with sediment, are a serious natural hazard in arid and mountainous regions due to their destructive nature and unpredictability (Cepeda et al., 2010). In particular, steep slopes, erodible soils, and intense rainfall contribute to the generation of these events (Wieczorek and Glade, 2007). In recent years, mudflows have caused significant damage to infrastructure and loss of life in various parts of the world (Villacorta et al., 2020; Nam et al., 2019; Ortega et al., 2022; Wang and Yamada, 2014). Coastal regions of Peru, such as Punta Hermosa, are particularly vulnerable. Accurate prediction of these events is critical for the implementation of effective early warning systems to reduce potential human and economic losses.
Mudflows are often classified as rainfall-induced landslides (RILs) (Fustos-Toribio et al., 2022), typically triggered by intense or prolonged rainfall that destabilizes slopes and mobilizes large volumes of sediment. A widely used approach to assess the likelihood of RILs is through rainfall thresholds, which define the minimum rainfall conditions required to trigger slope failures (Guzzetti et al., 2008; Reichenbach et al., 1998). The thresholds are typically expressed as empirical curves that delineate the boundary between rainfall conditions that have historically led to mudflow occurrence and those that have not. These curves are often defined in terms of rainfall intensity and duration, and in some cases are associated with the probability of event occurrence. Additionally, they may include uncertainty bounds to reflect the limitations or incompleteness of the input data used to define them (Segoni et al., 2018).
Empirical thresholds are the most common form and are developed by analyzing historical landslide occurrences alongside rainfall measurements (Melillo et al., 2018; Bordoni et al., 2019). They can be tailored to different temporal scales to meet operational needs: hourly thresholds are essential for real-time early warning systems (RILEWS) (Fustos-Toribio et al., 2022; Ke et al., 2020), while daily or multi-day thresholds are useful for longer-term planning (Kuroiwa, 2002). In the absence of detailed observational data on mudflows events, physically based approaches such as two-dimensional hydraulic models have proven useful. These models simulate non-Newtonian flow behavior and incorporate rheological properties—such as shear-thinning or shear-thickening–to better replicate the dynamics of mudflows (O'Brien et al., 1993; Hungr, 1995; Gibson et al., 2022).
In Metropolitan Lima, over 2.8 million people live on vulnerable hillsides, often in informal and unplanned settlements (Comercio, 2016). Recent studies have identified Punta Hermosa and Cieneguilla as districts with accelerated growth in informal urban development, which increases their exposure to geohazards (Moya et al., 2024; Badillo-Rivera et al., 2024). For example, Lurigancho has recorded destructive mudflows since 1907 (Villacorta et al., 2020; Escobar et al., 2024), and in 2017 and 2023, Punta Hermosa experienced severe events that displaced residents and caused widespread infrastructure damage.
Despite international advances in the development of rainfall thresholds and the application of hydraulic models, there is limited research on hourly rainfall thresholds tailored specifically for mudflows prediction in coastal Peruvian regions like Punta Hermosa. Most existing studies focus either on general rainfall-landslide relationships (Fídel et al., 2006; Villacorta et al., 2020; Millán-Arancibia and Lavado-Casimiro, 2023) or on post-event hydraulic modeling (Iruri Guzman and Jiménez Garcia, 2021; Castillo et al., 2024). However, few efforts have attempted to define operational thresholds using hourly precipitation data for early warning purposes in such urbanized, hazard-prone areas. Moreover, Peru lacks comprehensive databases detailing the timing and magnitude of past mudflows events, which constrains the development of statistically robust threshold models. This gap calls for an integrated approach that combines historical event data, satellite-derived precipitation estimates, and hydraulic modeling to reconstruct and analyze triggering conditions.
This study aims to develop empirical rainfall thresholds for predicting mudflows in the district of Punta Hermosa. Building on previous work by (Goyburo et al. 2024), conducted in collaboration with the District Municipality of Punta Hermosa, this research integrates satellite-based hourly precipitation data (Huerta et al., 2022), historical event documentation, and 2D hydraulic modeling (O'Brien et al., 1993). We analyze rainfall conditions at the time of mudflows occurrence and during the preceding 2 h to identify threshold values capable of supporting early warning applications. By combining empirical analysis and physically based modeling, these thresholds are designed to be applied with near-real-time rainfall data, thereby providing a foundation for the development of future early warning systems (EWS). While this research does not present a fully operational real-time forecasting system, it offers critical baseline information that can be integrated with ongoing improvements in rainfall monitoring and prediction (e.g., numerical weather forecasts) to enable operational EWS in the near future.
2 Materials and methods
2.1 Study area
Punta Hermosa district is located in the Lima region, south of the capital of Peru. It is a coastal town known to be a popular tourist destination for national and international visitors. Figure 1 shows the study area divided into two parts: the contributing basin and the lower coastal plain regions where the mudflows have their ultimate impact.
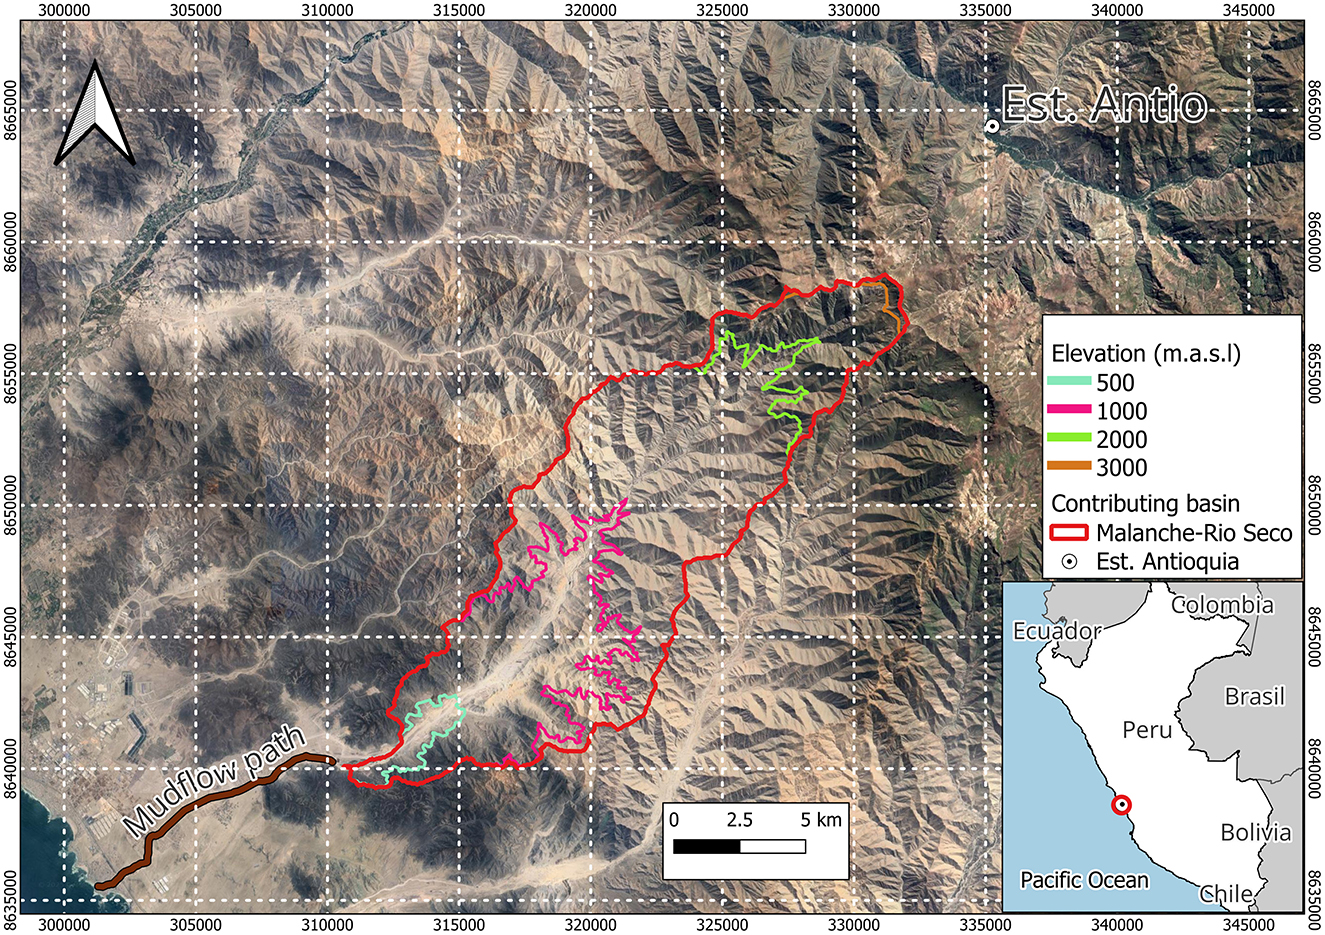
Figure 1. Overview of the study area, including elevation distribution and mudflows path.
The contributing basin, called Malanche-Rio Seco (ML), has a drainage area of 151.9 km2 and is characterized by steep slopes (0–85%), narrow channels, and loose sediment deposits that can be easily mobilized during heavy rainfall events. As shown in the satellite imagery, the land cover is predominantly bare soil, with only sparse vegetation observed in the uppermost part of the basin. Elevation ranges from 320 m to 3,380 m above sea level. The main channel can be described as an ephemeral stream, which falls under the framework of Intermittent Rivers and Ephemeral Streams (IRES) proposed by (Fovet et al. 2021). This classification is particularly relevant for the central coastal region of Peru, where non-perennial channels are highly responsive to extreme rainfall events and difficult to characterize using conventional hydrological methods. As described by (Rau 2025), these systems present increasing flood risks due to factors such as El Niño Costero, Cyclone Yaku (2023), and urban encroachment into dry channels. The IRES framework provides a conceptual foundation for addressing these challenges by emphasizing field-based hydrological reasoning and probabilistic approaches to estimate design flows in ungauged, dry-channel environments.
The main hydraulic properties include a length of 28.5 km and a mean slope of 5.7%. However, the hydrological processes are challenging to describe and assess due to the lack of hydrometric measurements.The coastal plain is where the mudflows reach their final deposition zones flowing through 11.3 km. This area is densely populated, with informal settlements located in the path of the mudflows, and the beach town of Punta Hermosa is located at the outlet, with residential and commercial buildings. Both suffer great damage at occurrence.
2.1.1 Climatology
The climatological pattern shown in Figure 2 represents the monthly average precipitation in the study area. Rainfall is extremely limited and highly seasonal, with the majority concentrated between December and April, reaching a peak in March with just over 1.25 mm on average. From May to August, precipitation drops sharply—often falling below 0.2 mm per month—indicating a prolonged and intense dry season. This contrast between wet and dry periods is characteristic of hyper-arid coastal environments in Peru, where annual precipitation is minimal and mudflow events are typically triggered by short, high-intensity rainfall associated with extreme meteorological events.

Figure 2. Monthly average precipitation in the study area.
Figure 3 presents the hourly precipitation preceding the study periods in March 2017 (A) and March 2023 (B). In both cases, the rainfall events that triggered the mudflows were preceded by several days of light to moderate precipitation. In 2017, scattered rainfall began around March 6, gradually increasing in frequency and intensity leading up to March 13, when heavy rainfall associated with ENSO conditions resulted in 12 mm of accumulation within 24 h. In 2023, a similar buildup occurred starting around March 12, culminating in a major event on March 14 with over 20.49 mm of rainfall in 24 h, which led to a widespread and catastrophic mudflow that damaged infrastructure and affected more than 5,000 families (ElPeruano, 2023). These antecedent rainfall pulses, although individually below threshold levels, likely contributed to progressive soil wetting prior to the main triggering events.
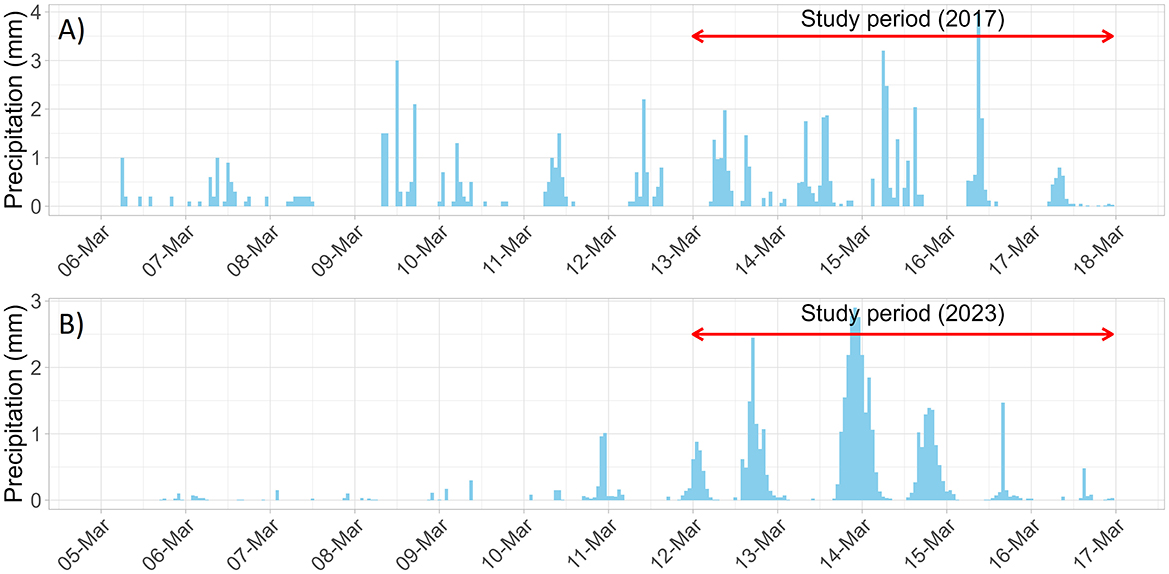
Figure 3. Hourly precipitation preceding the study periods for (A) 2017 and (B) 2023.
2.2 Method and data preprocessing
Figure 4 shows the methodology used in this study. To establish the rainfall thresholds for mudflows occurrence in Punta Hermosa, we combined a high-resolution digital elevation model, and remote sensing data to characterize the contributing basin and gridded hourly precipitation PISCOp_h (Huerta et al., 2022). First, we employed the FLO-2D model to reconstruct the hydrographs of major events in 2017 and 2023. Second, we used the hydrographs generated to determine the occurrence time and to generate flood inundation maps using the model FLO-2D. The validation process involved comparing the simulated flood extents with the actual flood imprints left by the modeled events and satellite imagery. The soil sampling carried out by (Goyburo et al. 2024); (Rau 2025) ensures that the debris flow modeling is based on rheological parameters that accurately reflect the real-world conditions. Finally, we applied the rainfall thresholds model to analyze the areal mean precipitation characteristics at the time and 2 h before their occurrence.
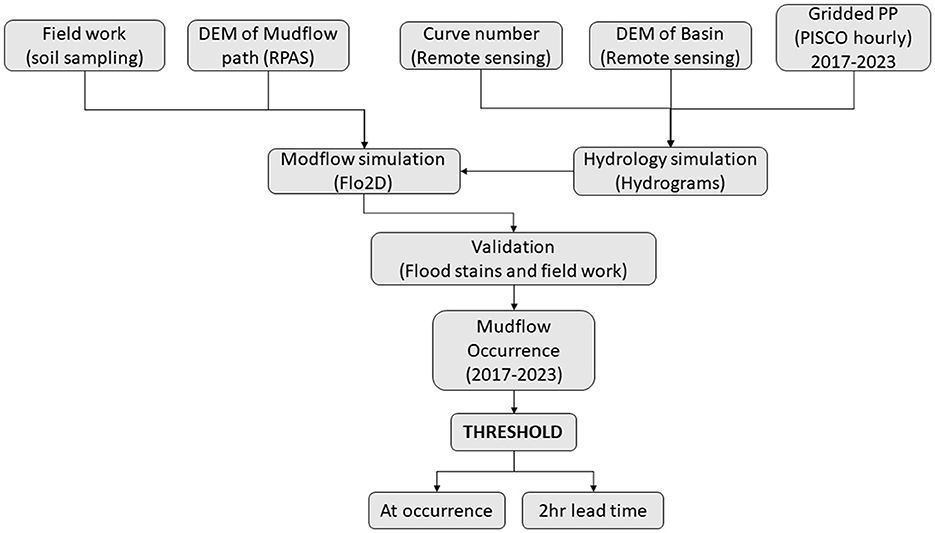
Figure 4. Methodology used to estimate and validate rainfall thresholds.
2.2.1 Digital elevation model for hydrology and hydraulic modeling
Two different digital elevation models (DEM) were used in this study. For the characterization of ML basin, FABDEM (Hawker et al., 2022) product with 30 m spatial resolution was utilized. FABDEM is a global elevation map with buildings and forests digitally removed. This removal process significantly improves elevation accuracy, especially in areas with dense forests or urban development. This makes it ideal for hydrological modeling as it provides a more accurate representation of the bare-earth terrain, leading to better water flow, infiltration, and runoff simulations. To provide a highly detailed and accurate representation of the mudflows path and urban areas, a 1 m resolution digital elevation model derived from high-resolution RPAS (remotely piloted aircraft system) surveys was employed. This fine-scale elevation data enabled us to precisely map the complex terrain and infrastructure (Figure 5) along the 11.09 km path, which covered a total area of 7.5 km2 in the lower coastal plain region where the mudflows deposits accumulated.
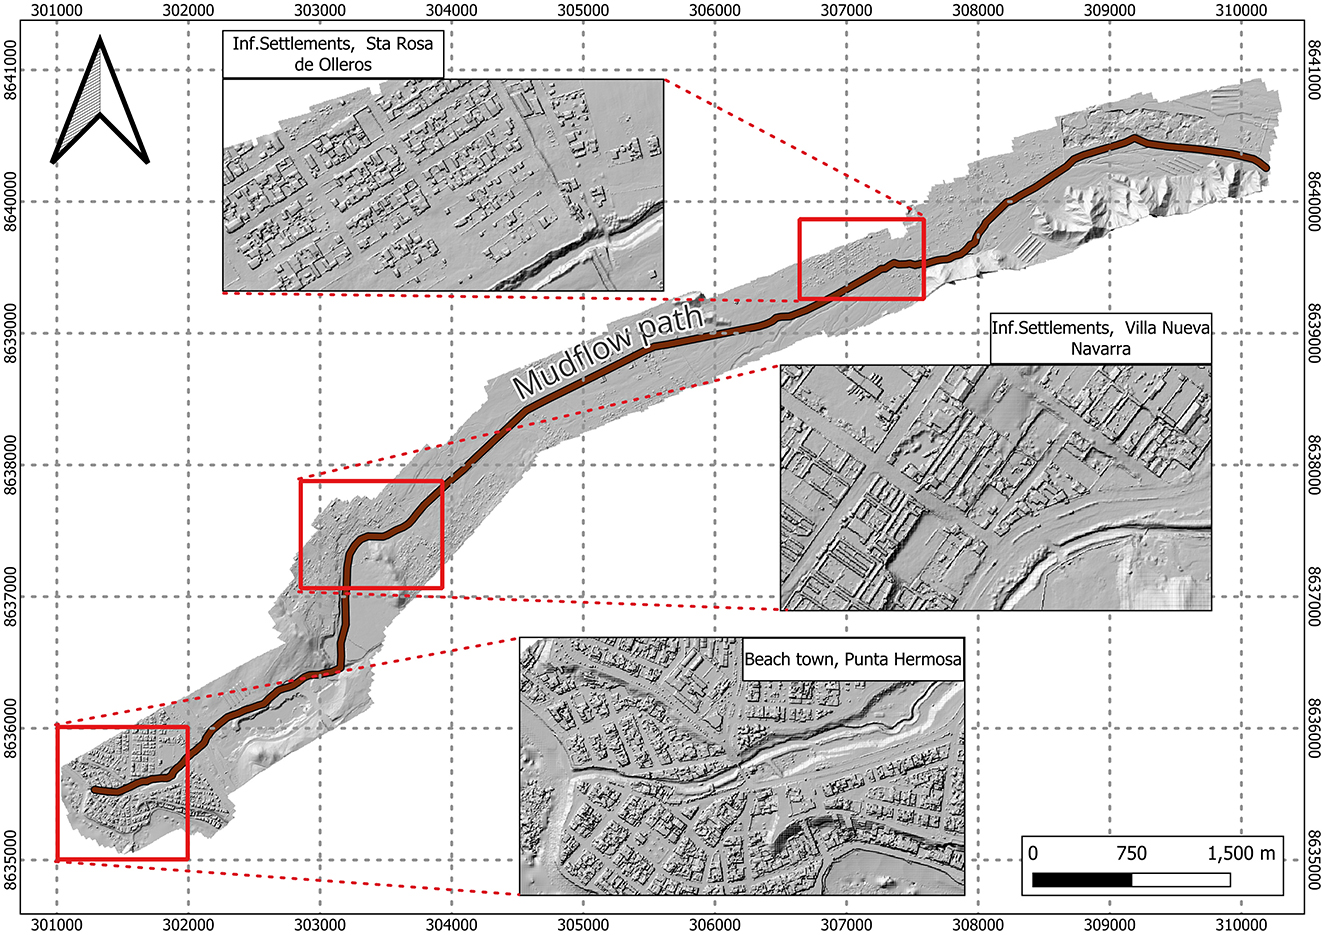
Figure 5. High-resolution digital elevation model from RPAS.
2.2.2 Gridded precipitation data (PISCOp_h)
Due to the inexistence of observed precipitation data, we used PISCOp_h (Huerta et al., 2022). It is a high-resolution (0.1 °) gridded hourly precipitation dataset for Peru, covering 2015-2020. It was created by temporally disaggregating the daily precipitation dataset PISCOp (Aybar et al., 2019) and incorporating data from 309 automatic weather stations and three satellite precipitation products (IMERG-Early, PERSIANN-CCS, and GSMaP_NRT). The process involved spatial interpolation of hourly precipitation and bias correction of the diurnal rainfall cycle. The analysis focused on the precipitation data from March 13–17, 2017, and March 12–16, 2023. Figure 6 shows the spatial distribution of the maximum precipitation during these periods, with 3.96 mm in 2017 and 2.90 mm in 2023. The PISCOp_h dataset, has recently been extended to include hourly precipitation data for the year 2023. Although this updated version has not yet been released for public use, it is available for internal research purposes within SENAMHI. This access enabled the inclusion of recent precipitation events that occurred in 2023 at the analysis of rainfall thresholds related to mudflows occurrences in the Punta Hermosa region.
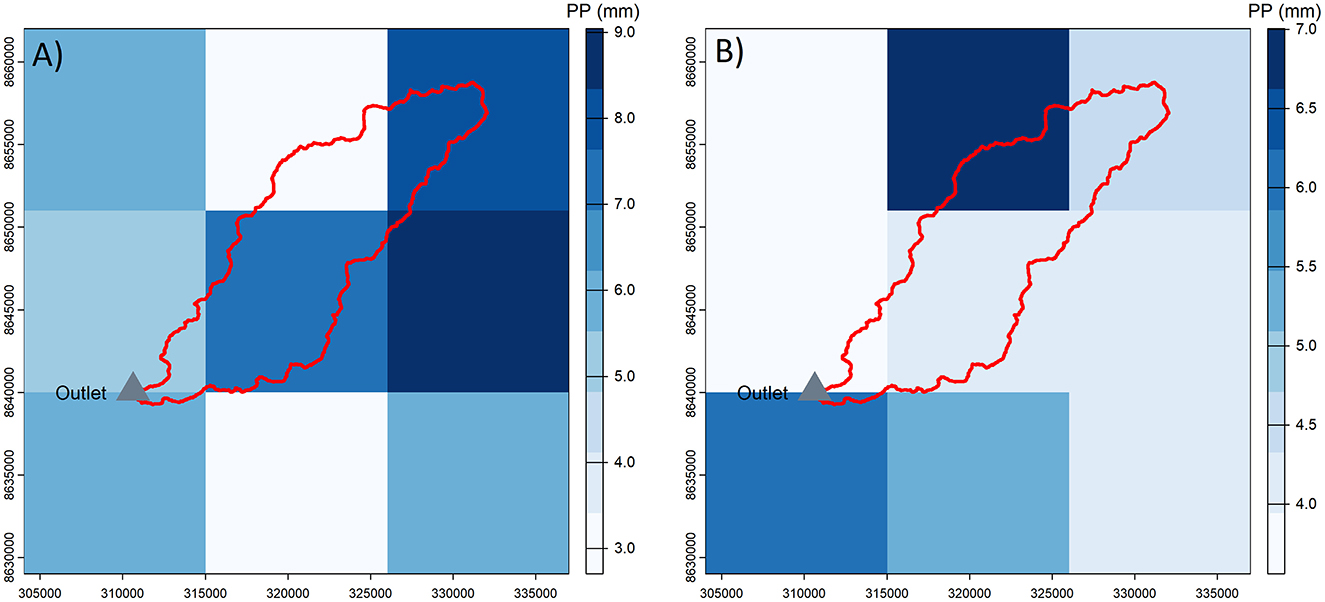
Figure 6. Max gridded precipitation for (A) March 13–17, 2017 and (B) March 12–16, 2023.
To assess whether the gridded precipitation data reproduces the magnitude of extreme observed precipitation events at Antioquia (Figure 1) conventional rain gauge station. We employed the Wilcoxon signed-rank test on paired annual maxima. This nonparametric test was chosen because it evaluates a location shift between two related samples without assuming normality of the differences, making it robust to skewness and outliers that frequently characterize extreme-value data (Helsel et al., 2020). The PISCOp dataset was used as the basis for this test because the Antioquia station provides daily observational records, enabling a consistent pairing of annual maxima. Furthermore, as noted previously, PISCOp_h is a disaggregation of PISCOp, so the cumulative precipitation and the timing/location of extreme events remain consistent between them; this ensures that differences detected by the test reflect the interpolation and representation process rather than discrepancies in event identification. By pairing the largest event of each year from the observed and gridded series, the test directly probes whether the central tendency of those maxima differs, whether the gridded values systematically over or under estimate the observed extremes while controlling for inter annual variability. This paired design isolates discrepancies attributable to the interpolation method itself rather than temporal changes in the climate or event occurrence.
2.2.3 Hydrology and hydraulic simulation (FLO-2D)
FLO-2D is a software model that simulates the behavior of water and mudflows. It works by dividing the terrain into a grid, with each cell having its elevation and roughness. By applying equations of motion and continuity to each cell, FLO-2D can calculate how the flow of water or mud would move and change over time, including its velocity, depth, and distribution (Guo et al., 2024). Its relative simplicity and ease of use make hydrology modeling accessible even for users with limited modeling experience (Mitra et al., 2021). FLO-2D can still provide valuable results even with limited or older datasets, which is particularly beneficial in data-scarce regions. Furthermore, the FLO-2D model can use precipitation data with a spatial and temporal distribution, allowing it to accurately represent these events. The model's ability to incorporate the spatial and time-varying characteristics of the precipitation data enables a more realistic simulation of the hydrological processes that lead to mudflows occurrences.
2.2.3.1 Hydrological modeling
For the hydrological modeling of the basin, the principal elements used were the precipitation data from PISCOp_H, the digital elevation model from FABDEM (Hawker et al., 2022). Curve number (CN) values ranging from 59 to 85 were obtained under dry soil conditions (Jaafar et al., 2019). The CN method was selected because the dominant runoff generation mechanism appears to be Hortonian (Gutiérrez-Jurado et al., 2019), implying that soil saturation is not a prerequisite for flow initiation.
The Curve Number (CN) method in FLO-2D estimates the precipitation excess (Pe) hence surface runoff from rainfall events based on land use, soil type, and antecedent moisture conditions. The key elements include rainfall depth (P), initial abstraction (Ia) (representing interception, infiltration, and surface storage), and potential maximum retention (S), which is determined by the Curve Number (CN). The CN value reflects the surface's runoff potential, with higher values indicating more runoff-prone surfaces. The Pe is calculated using the equation:
Where Ia = 0.2S and . FLO-2D assigns a CN value to each grid cell based on surface characteristics and adjusts the runoff calculation dynamically at each time step based on rainfall and infiltration losses.
According to USDA (1986), a 5-min time interval is recommended for hydrological modeling in small basins, particularly for generating hyetographs and hydrographs. In this study, the available gridded precipitation data had an hourly temporal resolution; therefore, each hourly value was evenly distributed across twelve 5-min intervals to preserve the total precipitation amount. Importantly, the original spatial distribution of the gridded dataset was maintained during this temporal disaggregation process. This finer temporal resolution was adopted to better represent the rapid runoff response observed in the study area. Consequently, hydrographs generated represent the first wave of mudflows, which is typically the most destructive due to its high velocity and substantial material transport (Yu et al., 2020). This initial surge carries the highest concentration of mud and sediment, causing the greatest damage to infrastructure and buildings, loss of life in the affected areas.
2.2.3.2 Hydraulic modeling
After obtaining the hydrographs corresponding to the 2017 and 2023 events, they are integrated as input flows into the hydraulic model. This model, by applying the specific rheological parameters, converts the flow series into hyper-concentrated flow.
Governing Equation:
The two-dimensional constitutive equations include the continuity equation.
and the two-dimensional equations of motion
In which h = flow depth; and Vx and Vy = depth-averaged velocity components along the x and y coordinates. The excess rainfall intensity i may be nonzero on the alluvial fan or the floodplain. The friction slope components Sfx and Sfy are written in Equations 3, 4 as a function of bed slope Sox and Soy, pressure gradient, and convective and local acceleration terms. A diffusive wave approximation to the equations of motion is defined by neglecting the last three acceleration terms of Equations 3, 4. Further, by neglecting the pressure term, a kinematic wave representation is derived. These approximations are valid for steep alluvial fans. The option of using either a kinematic wave or diffusive wave equation is available in FLO-2D.
Rheological model:
The total shear stress in highly concentrated sediment flows, such as mud and mud floods, can be calculated by summing five shear stress components.
where τc, τmc, τv, τt, and τd are viscous yield stress, Mohr-Coulomb shear stress, viscous shear stress, turbulent shear force, and discrete shear stress, respectively.
The above equation is rewritten into a dimensionless form as follows:
Where Sf is friction slope, Sy is yield slope, Sv is viscous slope, and Std is turbulence dispersion slope. This equation is mainly used to calculate stress changes.
The first term Sy, yield slope, in the above formula can be rewritten as .
The second term viscous slope, Sv, can be expressed by the average depth flow velocity u, which can be rewritten as .
The third term Std represents turbulent dispersion slope expressed as the velocity in terms of equivalent Manning's coefficient, water depth, and average depth, given by .
Where η is the viscosity coefficient, K is the laminar flow resistance coefficient, γm is the unit weight of mudflows, and ntd is the equivalent Manning coefficient.
The above three equations are substituted into Equation 6 to obtain the dimensionless form of the rheology equation
The continuity Equation 2, motion Equations 3, 4, and rheology Equation 7 are applied to each grid cell within the computational domain to solve for the key parameters that characterize the mudflows motion. This approach yields results that describe the overall mudflows fluid dynamics across the entire computational domain.
Viscosity Coefficient:
The simulation in FLO-2D requires the setting of viscosity coefficient (η) and yield stress τc. The formula is as follows
According to the formula, obtaining the viscosity coefficient and yield stress only requires determining the correlation coefficients of rheological parameters α1, α2, β1, and β2.
To determine the rheological parameters (Table 1), both the soil sampling conducted by (Goyburo et al. 2024) and the report published by INGEMMENT (2019) were used. In the field campaign, eleven test pits of 1 meter depth were excavated along the 11.3 km path of the mudflows. Due to the similarity among all the collected samples, three were selected for laboratory analysis. This approach allowed for a representative characterization of the alluvial deposits along the entire mudflows path. According to INGEMMENT (2019), the alluvial deposits found in the channel originate from the slopes of the contributing basin, where the material is mobilized by rainfall events. Therefore, it can be inferred that the material analyzed in this study effectively represents the sediment composition of the mudflows generated by the contributing basin.

Table 1. Values used in the modeling of mudflows.
Laboratory analysis of the samples revealed that the material consists of gravel embedded in a silt-sand matrix, with alternating layers of silt, sand, and a minor fraction of clay, along with a significant amount of unconsolidated particles. Based on these findings, the rheological properties of the mudflows were classified as corresponding to GLENWOOD SAMPLE 4.
2.2.4 Rainfall thresholds
In this study, a rainfall threshold is defined as the minimum rainfall condition expressed in terms of intensity and accumulation above which mudflows events have occurred. These thresholds are derived empirically by analyzing the statistical relationship between recorded precipitation and documented mudflows occurrences (Millán-Arancibia and Lavado-Casimiro, 2023; Garcia-Urquia and Axelsson, 2015; Prenner et al., 2018; Hsu et al., 2018), without explicitly modeling internal physical processes such as soil saturation. As such, the thresholds represent operational criteria that delineate rainfall conditions associated with a high likelihood of event initiation, rather than mechanistic triggers based on subsurface hydrological responses (Guzzetti et al., 2008; Segoni et al., 2018).
Empirical thresholds were evaluated using two metrics: event-duration and intensity-duration. Rainfall amounts were computed as the areal mean of ML. The resulting thresholds are represented as empirical threshold curves on the intensity-duration and accumulation-duration diagrams. These curves define the minimum rainfall conditions under which mudflow events were observed to occur. Thresholds were estimated for both the time of occurrence and for conditions 2 h prior to the events. In both cases, the threshold curves follow a power-law relationship of the form:
The equation defining rainfall thresholds takes the form of a power law function, where the cumulative event rainfall E (mm) is a function of the rainfall intensity I (mm/h) and the duration of rainfall event D (hrs). On a bi-logarithmic scale, this threshold curve appears as a straight line. The parameters α and β are empirically derived, with α representing a scaling factor and β controlling the slope curve. These parameters were determined by drawing lower-bound fitting curves through the data points. Figure 7 shows the process used to estimate and extract the average rainfall intensity from the storm's beginning to the mudflows occurrence and the concerned lead time.
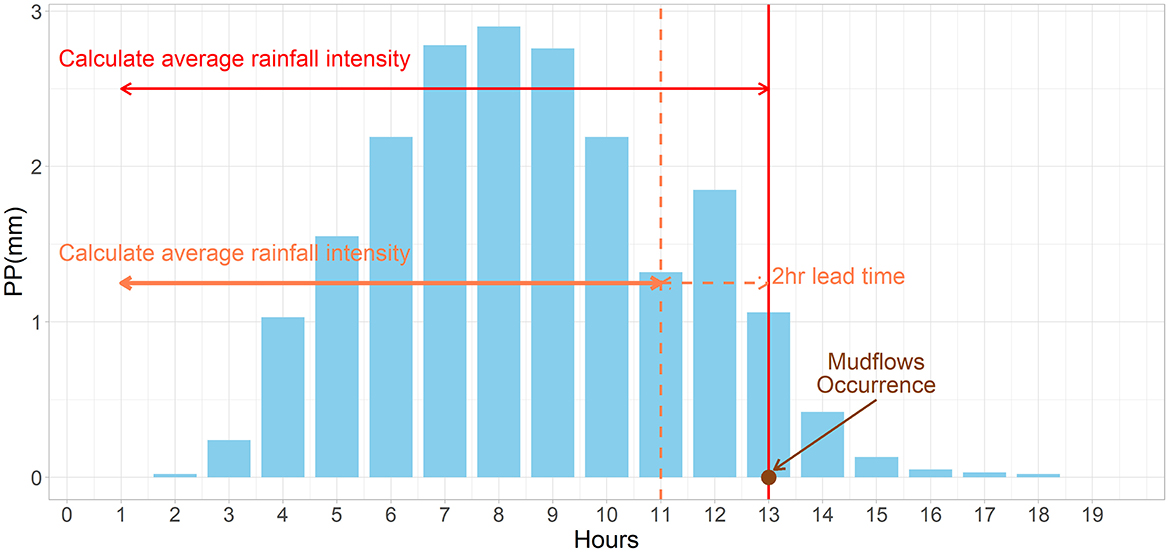
Figure 7. Example of determination of intensity and duration of storm leading to mudflows occurrence.
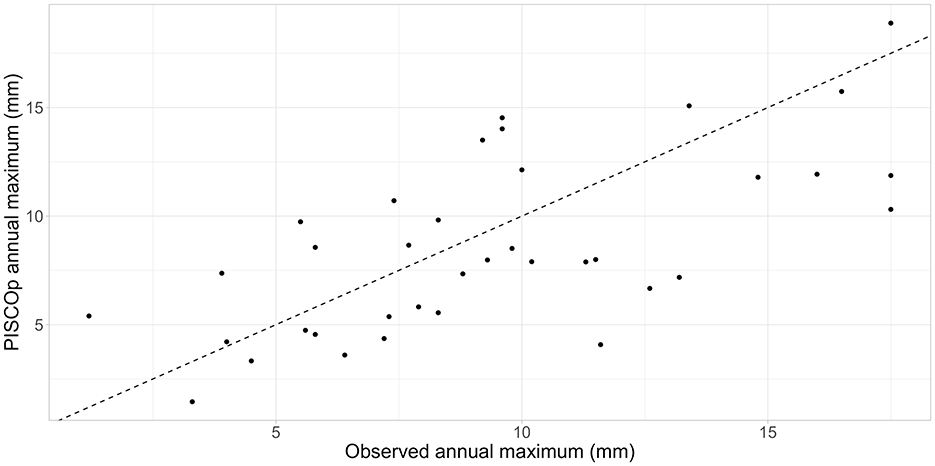
Figure 8. Observed vs. PISCOp gridded annual maximum precipitation (mm).
3 Results
3.1 Comparative PISCOp and observed data
Figure 8 compares paired annual maximum precipitation values from observed data against the PISCOp gridded series. Most points lie reasonably close to this line, indicating that the interpolated values generally capture the magnitude of the observed annual extremes, although there is noticeable scatter some years the interpolation overestimates and others underestimates the observed maximum. The Wilcoxon signed-rank test (V = 433, p = 0.22), given the non-significant difference in central tendency, the gridded annual maxima can be considered representative of the observed extremes, with no consistent over or underestimation of the largest yearly events.
3.2 Mudflows occurrence
Figure 9 illustrates both the hyper-concentrated flow (HyperFlow) and precipitation (PP) patterns. The marked mudflows events correspond to observed occurrences, confirmed by local records and satellite imagery. To determine the timing of these events within the simulations, two criteria were applied: the timing of the peak hyper-concentrated flow and the visual identification of flood wave impacts. As shown in Figure 9, during 2017, five peak flows coincided with observed mudflows, while one did not. Similarly, in 2023, three peaks were associated with observed mudflows, and one peak flow occurred without a corresponding event.
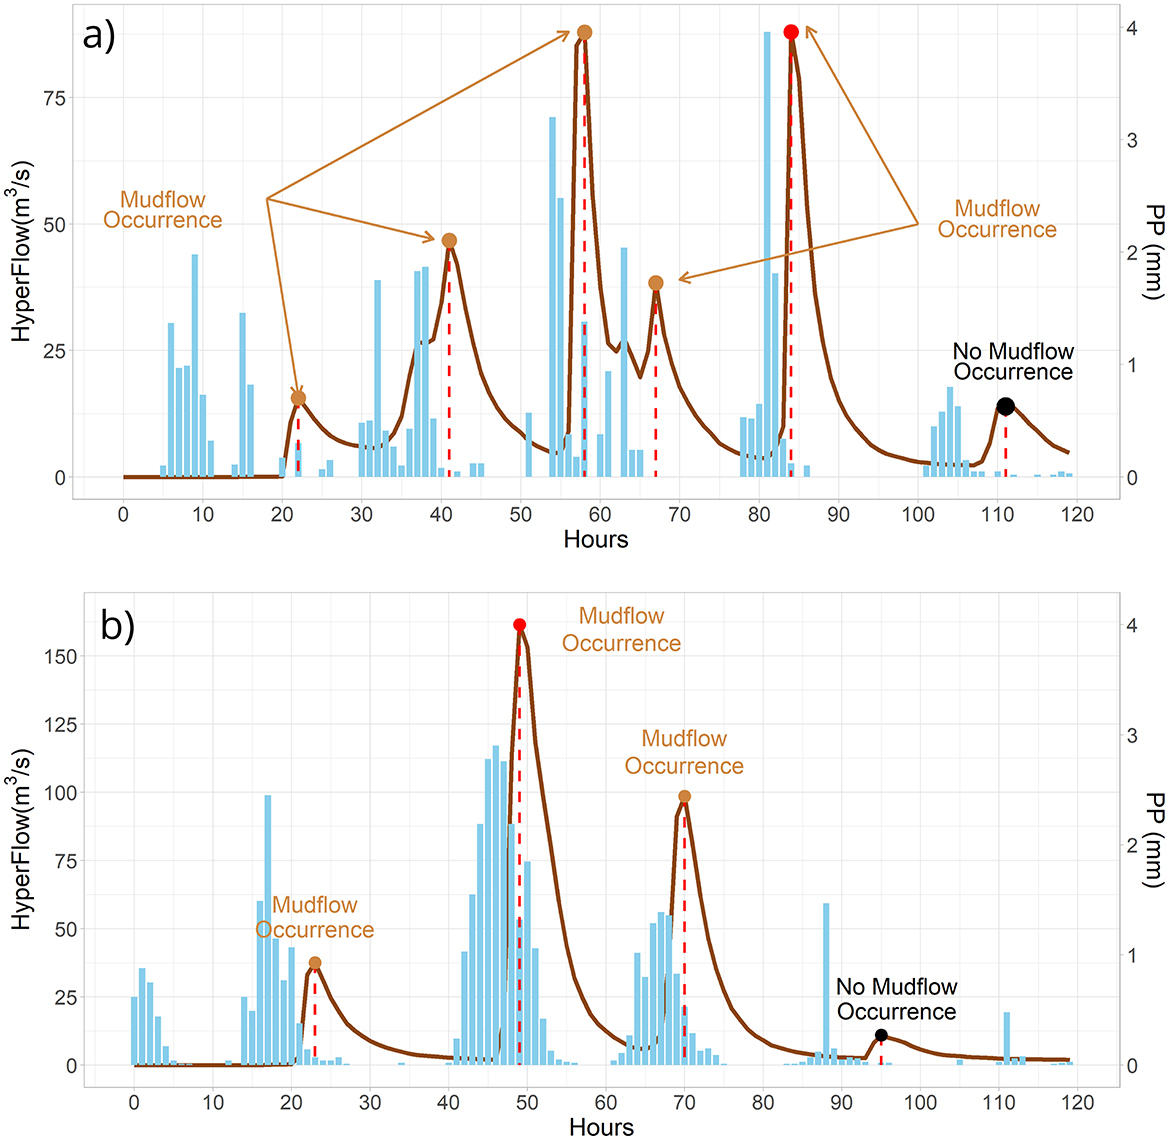
Figure 9. Precipitation and flow during mudflows events and time of occurrence and no ocurrence. (a) Precipitation and HyperFlow during the period of 13/03/2017 to 17/03/2017. (b) Precipitation and HyperFlow during the period of 12/03/2023 to 16/03/2023.
3.3 Thresholds assessment and validation
3.3.1 Event-duration (ED) thresholds
Figure 10 shows the distribution of accumulative rainfall (E) and duration (D) of events that resulted in mudflows at the time of occurrence (Equation 12) and 2 h before (Equation 13). The threshold curve for the possible occurrence of mudflows in the area of Punta Hermosa can be expressed by the following equation.
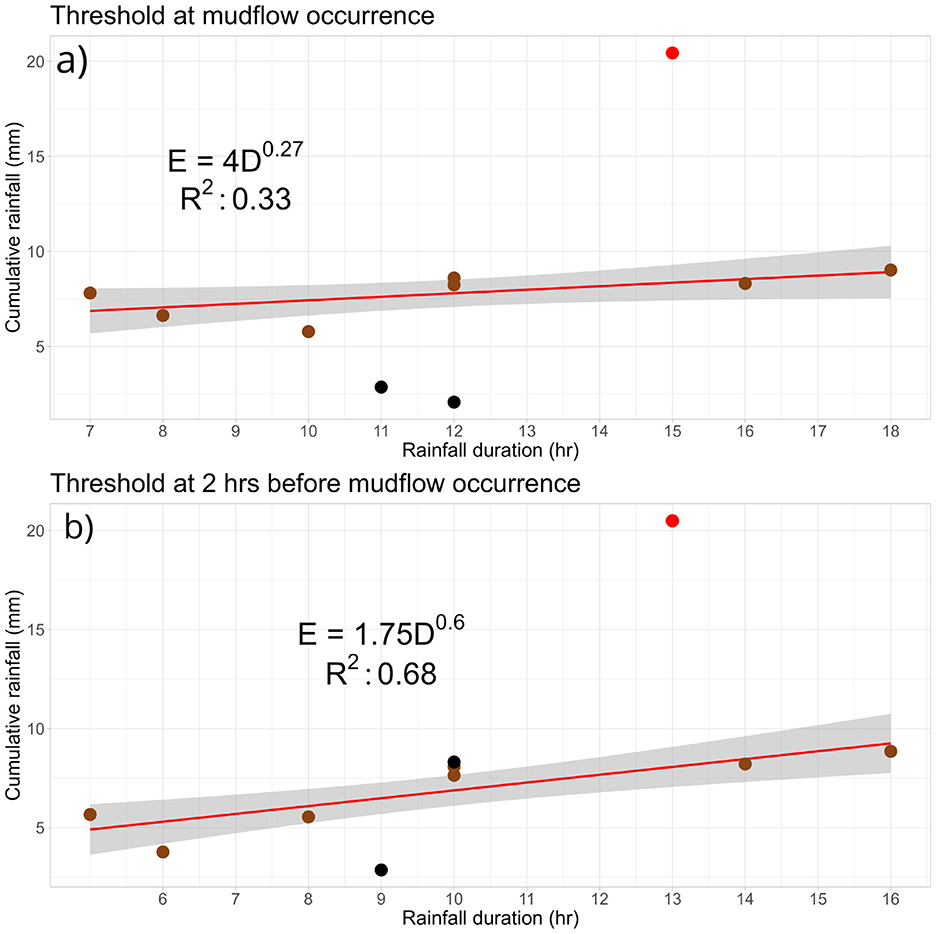
Figure 10. Empirical cumulative event rainfall-duration threshold at mudflows occurrence and 2 h before. Brown dots represent mudflows occurrence, black dots, no occurrence and red dot an extreme event (2023) (a) Rainfall-duration threshold at occurrence. (b) Rainfall-duration threshold 2 h before occurrence.
The threshold relationships reveal that the exponent coefficient β (0.3 and 0.6) is less than one in both cases, indicating a non-linear relationship where shorter-duration events require proportionally less rainfall to trigger mudflows. While this behavior is consistent with general hydrological understanding, confirming it empirically in the specific context of arid coastal basins helps strengthen the applicability of the thresholds and aligns with findings from previous studies (Guzzetti et al., 2008; Segoni et al., 2018). Validation results indicate that the thresholds effectively capture the distribution of mudflow occurrences, particularly when considering a 2-h lead time. The confidence interval, shown as a shaded band around the regression line, was calculated at a 95% level based on the fitted power-law model. Most observed events (brown dots) fall within or near this band, reinforcing the utility of the threshold for early warning. Non-triggering events (black dots) fall below the threshold, while one extreme case (red dot) lies above it without an observed mudflow, suggesting possible undocumented activity or a false positive. The regression curve serves to describe the lower bound of rainfall conditions that historically led to mudflows, and supports the establishment of a practical threshold–where cumulative rainfall exceeding 10 mm is consistently associated with mudflow initiation in the study area.
3.3.2 Intensity-duration (ID) thresholds
Rainfall intensity-duration thresholds are the most widely reported type of thresholds in the literature. Figure 11 shows the distribution of rainfall events that have resulted in mudflows at both the occurrence (Equation 14) and 2 h lead (Equation 15). The intensity-duration threshold relationships for the potential initiation of mudflows can be expressed using the following equations.
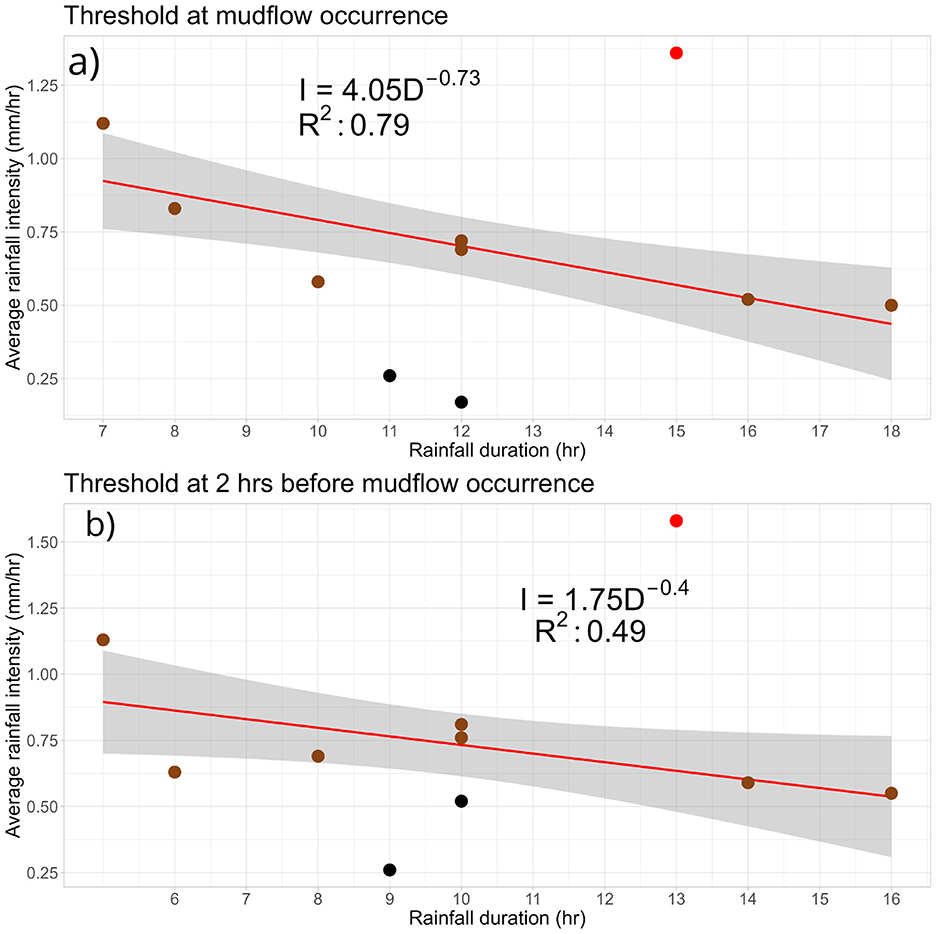
Figure 11. Empirical intensity-duration threshold at mudflows occurrence and 2 h before. Brown dots represent mudflows occurrence, black dots no occurrence and red dot an extreme event (2023). (a) Intensity-duration threshold at occurrence. (b)Intensity-duration threshold 2 h before occurrence.
The results demonstrate that the intensity-duration thresholds, evaluated both at the time of mudflow occurrence and with a 2-h lead time, achieved coefficients of determination (R2) of 0.79 and 0.49, respectively. The fitted power-law curves are shown with their associated 95% confidence intervals. Most observed mudflow events (brown dots) fall within or near the confidence bands, while non-triggering events (black dots) are clearly outside them. The red dot corresponds to a documented extreme event with high intensity, reinforcing the upper boundary of triggering conditions. These results support the use of intensity-based thresholds for early warning purposes. The analysis suggests that rainfall events with a minimum duration of 5 h and an average intensity of at least 1.13 mm/h are likely to initiate mudflows. For longer-duration events (e.g., 16 h), the threshold intensity decreases to 0.5 mm/h. Furthermore, events exceeding 1.25 mm/h in average intensity consistently resulted in mudflows.
3.4 Mudflows simulation
For threshold validation, hydraulic modeling of the events was employed. Calibration in the study area is particularly challenging due to the lack of observed data before, during, and after the mudflows events. However, satellite images from Google Earth Pro (Earth, 2023) revealed the extent of flood stains along the entire mudflows path resulting from the event that occurred in March of the same year. Additionally, soil samples were collected along the mudflows path, which enabled the characterization of rheological parameters.
Figure 12 shows the beach town of Punta Hermosa before and after the 2023 mudflow event, along with the simulated maximum depth extents for the 2017 and 2023 events. The spatial extent of the simulated events closely matches the sediment deposits observed after the 2023 event. However, no reliable measurements of maximum flood depth are available for direct validation of the simulations. Despite this limitation, the results are considered reliable due to the use of high-resolution topography and the detailed characterization of the sediment material. Furthermore, this urban area can be classified as an alluvial fan (Grodek and Benito, 2024), where floodwaters tend to spread out and dissipate energy, resulting in widespread sediment deposition and the formation of multiple shallow flow paths. The affected area spans 2.8 km2, with simulated maximum mudflow depths reaching up to 1 meter.
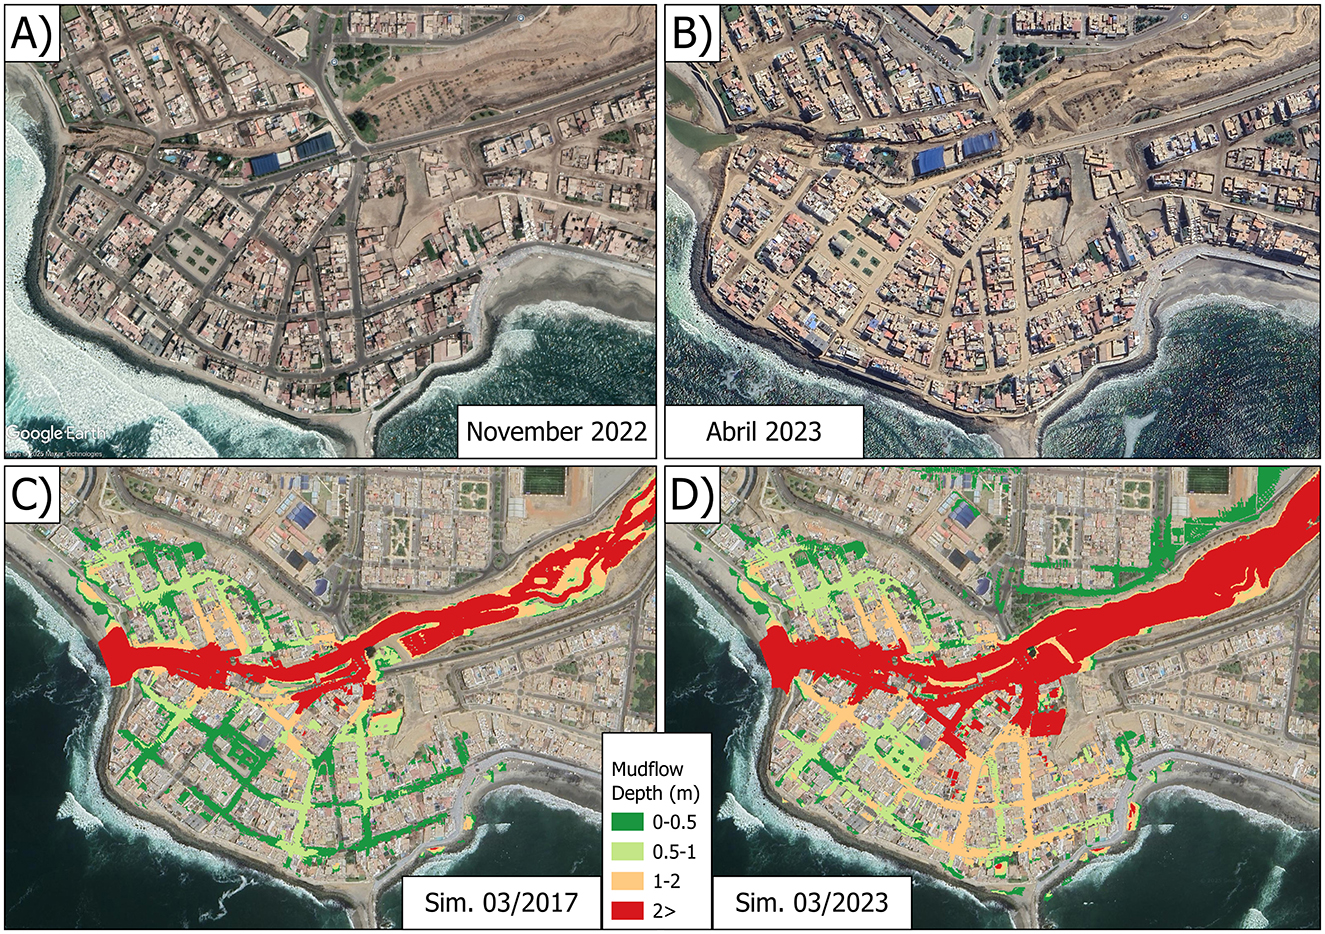
Figure 12. Comparison between observed and simulated mudflow extents in Punta Hermosa. (A) Aerial image before the 2023 event; (B) observed mudflow deposits after the 2023 event; (C) simulated extent of the 2017 mudflow; (D) simulated extent of the 2023 mudflow.
Therefore, this urban alluvial fan is a highly hazardous location for any mudflows that may occur. This fan-shaped area, formed by the deposition of sediments from past mudflows (Grodek and Benito, 2024), poses a significant risk to the surrounding urban settlement. Any future mudflows event in the area is likely to spread across this alluvial fan, potentially causing extensive damage and posing a threat to the lives and property. Thus, this urban alluvial fan is a high-risk area that requires appropriate mitigation measures to protect the residents and infrastructure.
Table 2 presents the area covered by each depth range in all the mudflow path, along with the corresponding number of affected houses and estimated population. To determine the number of houses impacted by the mudflow extent, we used the Open Buildings dataset (Sirko et al., 2021) to obtain georeferenced building footprints, which were spatially intersected with the mudflow polygons. The number of affected people was then estimated using an average household size of five individuals, based on national statistics (INEI, 2017). It is important to note that the impacts of the mudflows and disrupted services may have extended beyond the directly affected population. Unfortunately, official records regarding the number of people affected by these events are unavailable due to the lack of urban planning and updated census data. The number of affected individuals is expected to continue increasing, as, according to (Moya et al. 2024), Punta Hermosa is a district experiencing rapid growth in informal urban settlements.
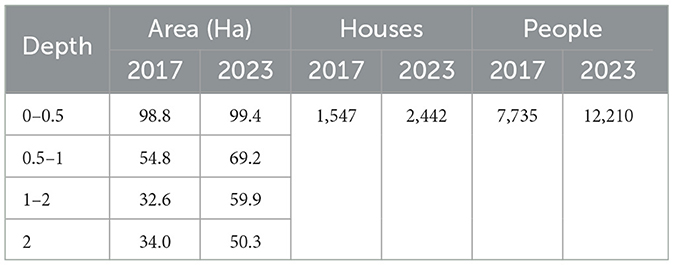
Table 2. Area coverage for each depth range and number of affected houses.
4 Discussion
This study builds upon the methodology developed in a previous assessment by (Goyburo et al. 2024), carried out in collaboration with the Municipality of Punta Hermosa. In that earlier work, storm distributions were generated using the time of concentration to estimate synthetic hyetographs, which allowed for hazard delineation based on design rainfall. However, that approach–based on daily rainfall records–did not allow for identifying the exact timing of mudflow initiation. In arid catchments like Punta Hermosa, where hydrological response is likely dominated by Hortonian runoff, the temporal link between rainfall input and mudflow generation remains poorly understood. For this reason, the present study uses gridded hourly precipitation (PISCOp_h) to improve the temporal resolution and better capture short-duration rainfall events.
Although this study focused on the definition of rainfall thresholds based on observed events and representative rheological properties, it is important to acknowledge the potential influence of parameter uncertainty on simulation outputs. The rheological values used in the hydraulic modeling were derived from field sampling and laboratory analysis, and were found to be relatively homogeneous along the mudflows path. This justified the selection of a single representative rheological configuration (GLENWOOD SAMPLE 4) for all simulations. However, variations in rheological properties–such as yield stress and dynamic viscosity can significantly affect the modeled flow depth, velocity, and inundation extent. While the homogeneity of the sampled material supports the robustness of the results under current conditions, a formal sensitivity analysis was not conducted in this study. Future work should evaluate the influence of parameter variability through sensitivity or uncertainty analyses. Incorporating a probabilistic modeling framework would allow for a better understanding of the reliability of the derived thresholds under different volumetric concentration and improve the resilience of early warning systems.
A key limitation of this study is the lack of observed or remotely sensed soil moisture data for the analyzed mudflows events (2017 and 2023), which prevented the explicit inclusion of antecedent moisture conditions in the derivation of rainfall thresholds. While soil moisture is widely recognized as a critical factor influencing runoff generation and sediment transport, recent findings from arid and semi-arid basins in southern Morocco suggest that its role may be limited in such environments. In particular, (Rachdane et al. 2024) reported consistently weak correlations (median values below 0.35) between the Soil Water Index and key flood variables across 20 basins with similar geomorphological and climatic characteristics. These results indicate that in regions dominated by infiltration-excess (Hortonian) processes–such as steep, sparsely vegetated basins with shallow soils–sub-daily flood response can be primarily driven by rainfall intensity alone.
The methodology used in this study focuses on an empirical, data-driven framework based on the analysis of input-output relationships: precipitation as the input, and documented mudflow occurrence as the output. As such, internal physical processes like soil saturation or moisture redistribution were not explicitly modeled. Therefore, although the omission of antecedent soil moisture data represents a constraint, the rainfall thresholds derived in this study are considered robust within the context of prevailing hydrological conditions in Punta Hermosa. Nonetheless, future research should aim to integrate soil moisture dynamics where possible, particularly as high-resolution satellite products and in-situ monitoring networks become more accessible.
Another important source of uncertainty in this study relates to the use of the gridded precipitation dataset PISCOp_h (Huerta et al., 2022), which was adopted due to the lack of observed hourly rainfall data for the 2017 and 2023 events. PISCOp_h provides hourly precipitation at 0.1° spatial resolution ( 10 km) by temporally disaggregating the daily PISCOp product (Aybar et al., 2019), using bias-corrected satellite products and data from 309 automatic weather stations. According to the validation conducted by (Huerta et al. 2022), the performance of PISCOp_h is moderate to high in the central coastal region of Peru, where the study area is located. Specifically, frequency and intensity ratios between PISCOp_h and automatic weather stations were generally within ±25% during the austral summer season, suggesting acceptable accuracy for hydrometeorological applications in this region. To further assess its representativeness, Figure 8 compares annual maximum precipitation values from observed conventional stations against PISCOp gridded data. Most paired points lie close to the perfect fit line, indicating that the interpolated dataset generally captures the magnitude of extreme rainfall events. Nonetheless, due to its spatial resolution, PISCOp_h may not fully capture localized convective rainfall peaks that can trigger mudflows in arid coastal basins. Therefore, the hourly rainfall thresholds derived in this study should be interpreted as regional-scale approximations that provide a useful basis for early warning systems but may underestimate localized extremes. Future efforts should aim to complement gridded products with denser ground-based networks or radar observations to enhance the precision of threshold-based forecasting in highly vulnerable coastal zones.
Rainfall thresholds have been widely used to identify the possible triggering of landslides on global, regional, and local scales, which encompasses diverse climatic, morphological, and geotechnical settings (Lainas et al., 2016). This paper presents a first approach to define empirical statistical intensity-duration (ID) and event-duration (ED) rainfall thresholds for the potential occurrence and the 2-h lead time of mudflows in an arid basin of the Pacific coast. This methodology has been used before by (Villacorta et al. 2020); Song Chang-Ho (2021); (Yang et al. 2020); (Wang and Yamada 2014), highlighting the need for such an approach in these regions to develop a reliable early warning system for mudflows events. This study focused on the most severe mudflows events that occurred in 2017 and 2023 within the Punta Hermosa district of Lima, Peru, as the basis for the analysis.
The proposed rainfall thresholds are derived from empirical data analysis, and their reliability is contingent on the quality of available data. Incorporating more, such as observed hourly rainfall, detailed analysis of antecedent soil moisture conditions, precise timing and characteristics of past events, could substantially enhance the applicability and accuracy of these thresholds. This initial effort represents an important step forward and can motivate further research and collaborations aimed at developing a robust and comprehensive early warning system to safeguard properties, infrastructure, and local communities from the devastating impacts of rainfall-induced hazards.
Rainfall-induced landslide early warning systems (RILEWS) are crucial in many parts of the world (Fustos-Toribio et al., 2022) but are often hampered by the lack of high-quality data, especially in remote or developing regions (Miardini and Susanti, 2020). The development of rainfall thresholds for triggering mudflows provides a valuable tool for forecasting and mitigating these hazards (Thomas et al., 2018). Extreme climate events, such as the El Niño (Morera et al., 2017) phenomenon or the highly unusual tropical depression system dubbed “Cyclone Yaku” (Peng et al., 2024), are the primary drivers for the initiation of mudflows processes. These extreme events can significantly disrupt the region, leading to severe impacts on local communities and the built environment.
Establishing representative rainfall thresholds for triggering mudflows in Punta Hermosa could prove valuable in developing an Rainfall-induced landslide early warning systems (RILEWS) in the near future. As described by (Aleotti 2004), an effective early warning system typically consists of three key components: precipitation forecasts, real-time monitoring, and established rainfall-mudflows thresholds. Given that the rainfall thresholds presented in this study were generated using data from 2017 and 2023, an update and analysis of new events is necessary to assess the ongoing performance and continued relevance of these thresholds. This study also highlights the pressing need to establish a national politics, whose primary objective would be to promptly evaluate mudflows and provide technical insights into their underlying causes and mechanisms. This will enable the expansion of mudflows database with entries where rainfall has been confirmed as the primary trigger, excluding those events whose human-induced factors have hindered the establishment of a reliable threshold. Deploying additional rainfall monitoring stations in the Malanche basin is also necessary to mitigate uncertainties associated with spatial variability in precipitation patterns. These stations can then be used to provide real-time monitoring and issue warnings if the established rainfall thresholds are surpassed. Finally, as improvements in weather forecasting technology enhance the reliability of rainfall predictions, municipal emergency teams can prepare and execute evacuation protocols if real-time rainfall monitoring indicates the potential for critical conditions, as defined by the established thresholds.
5 Conclusions
This study demonstrates that empirical rainfall thresholds can serve as a robust tool for predicting mudflows events in arid coastal basins, particularly in the vulnerable region of Punta Hermosa, Peru. By integrating high-resolution gridded hourly rainfall data with detailed digital elevation models and 2D hydraulic simulations using FLO-2D, the research has successfully established both event-duration (ED) and intensity-duration (ID) threshold relationships for mudflows initiation.
The results indicate that the cumulative event rainfall (E) plays a more significant role than the rainfall duration (D) in shaping the thresholds for mudflows occurrence. The event-duration (ED) relationship showed a stronger correlation for the 2-h lead time, suggesting the thresholds can serve as a reliable early warning system. Furthermore, the analysis reveals that cumulative rainfall exceeding 10 mm will consistently trigger mudflows occurrences. For the intensity-duration (ID) thresholds, both, at time of occurrence and 2 h prior achieved acceptable mean square error values (0.79 and 0.49), validating their applicability. The findings suggest that rainfall events with a minimum duration of 5 h and an intensity of at least 1.13 mm/h can initiate mudflows. For longer-duration events, the minimum intensity required to trigger is 0.5 mm/h. Additionally, an intensity exceeding 1.25 mm/h, will consistently result in occurrences.
The methodology presented not only provides a framework for hazard assessment in data-scarce regions but also underscores the importance of integrating meteorological data with hydrological and hydraulic modeling to improve predictive capabilities. The results support the implementation of proactive risk mitigation strategies and the development of early warning systems that can significantly reduce damage and enhance community resilience. Future research should focus on incorporating observed hourly rainfall data, refining antecedent soil moisture assessments, and expanding the rainfall monitoring network to further reduce uncertainties. Such improvements will enhance the reliability of the thresholds and ensure that the early warning systems remain effective under varying climatic conditions.
Overall, this work should be viewed as a foundational step toward the development of operational early warning systems, rather than as a fully established real-time tool. The thresholds derived here offer actionable criteria that can already be applied with near real-time rainfall products, and they form the groundwork for integration with numerical forecasts, denser monitoring networks, and municipal emergency protocols. As such, this study represents a critical step in the progressive development of operational EWS for rainfall-induced mudflows in arid coastal basins.
Data availability statement
The datasets presented in this article are not readily available because all data, shapefile and model outputs will be made available on request to the correspondent author email with appropriate justification. Requests to access the datasets should be directed to YWdveWJ1cm9Ac2VuYW1oaS5nb2IucGU=.
Author contributions
AG: Validation, Visualization, Formal analysis, Conceptualization, Writing – review & editing, Methodology, Data curation, Investigation, Writing – original draft. LG: Writing – review & editing, Formal analysis, Data curation, Writing – original draft. PR: Funding acquisition, Writing – original draft, Writing – review & editing. WL-C: Validation, Funding acquisition, Writing – original draft, Supervision, Writing – review & editing.
Funding
The author(s) declare that financial support was received for the research and/or publication of this article. This research received external funding for the District Municipality of Punta Hermosa through the agreement titled “Convenio de cooperación específico entre la Municipalidad Distrital de Punta Hermosa y el Servicio Nacional de Meteorología e Hidrología del Perú."
Acknowledgments
Pedro Rau acknowledges the support of Universidad de Ingenieria y Tecnologia-UTEC through the UTEC Seed Fund Program 2024 (Principal Investigator: Pedro Rau).
Conflict of interest
The authors declare that the research was conducted in the absence of any commercial or financial relationships that could be construed as a potential conflict of interest.
Generative AI statement
The author(s) declare that no Gen AI was used in the creation of this manuscript.
Any alternative text (alt text) provided alongside figures in this article has been generated by Frontiers with the support of artificial intelligence and reasonable efforts have been made to ensure accuracy, including review by the authors wherever possible. If you identify any issues, please contact us.
Publisher's note
All claims expressed in this article are solely those of the authors and do not necessarily represent those of their affiliated organizations, or those of the publisher, the editors and the reviewers. Any product that may be evaluated in this article, or claim that may be made by its manufacturer, is not guaranteed or endorsed by the publisher.
References
Aleotti, P. (2004). A warning system for rainfall-induced shallow failures. Eng. Geol. 73, 247–265. doi: 10.1016/j.enggeo.2004.01.007
Aybar, C., Fernández, C., Huerta, A., Lavado, W., Vega, F., and Felipe-Obando, O. (2019). Construction of a high-resolution gridded rainfall dataset for peru from 1981 to the present day. Taylor Francis 65, 770–785. doi: 10.1080/02626667.2019.1649411
Badillo-Rivera, E., Olcese, M., Santiago, R., Poma, T., Muñoz, N., Rojas-León, C., et al. (2024). A comparative study of susceptibility and hazard for mass movements applying quantitative machine learning techniques—case study: northern lima commonwealth, peru. Geosciences 14:168. doi: 10.3390/geosciences14060168
Bordoni, M., Corradini, B., Lucchelli, L., Valentino, R., Bittelli, M., Vivaldi, V., et al. (2019). Empirical and physically based thresholds for the occurrence of shallow landslides in a prone area of northern italian apennines. Water 11:2653. doi: 10.3390/w11122653
Castillo, S. J., Atala, V. A. R., and Mogrovejo, G. R. E. (2024). “Debris flow modeling using flo-2d for hazard identification in the rio seco creek,” Trends in Environmental Sustainability and Green Energy, eds. in J. Kim, and Z. Chen (Cham: Springer Nature Switzerland), 53–69. doi: 10.1007/978-3-031-52330-4_5
Cepeda, J., Höeg, K., and Nadim, F. (2010). Landslide-triggering rainfall thresholds: a conceptual framework. Q. J. Eng. Geol. Hydrogeol. 43, 69–84. doi: 10.1144/1470-9236/08-066
Comercio, E. (2016). Vivir en las alturas. Available online at: https://elcomercio.pe/eldominical/actualidad/vivir-alturas-392960-noticia/ (Accessed June 3, 2024).
Earth, G. (2023). SatelliteImageryofCoastalAreaNear−12.337760°, -76.825123°. Imagery dates: April 2, 2023 and November 17, 2022. Image © 2025 Airbus. Accessed via Google Earth. Available online at: https://earth.google.com (Accessed June 3, 2024).
ElPeruano. (2023). Punta hermosa: Nuevo huaico se registró esta tarde (punta hermosa: New mudslide recorded this afternoon). Available online at: https://elperuano.pe/noticia/207791-punta-hermosa-nuevo-huaico-se-registro-esta-tarde (Accessed June 3, 2024).
Escobar, A., Castro, N., and Rau, P. (2024). “Evaluation of the impact of urban expansion and hyper concentrated flow generation in a dry creek,” in Proceedings of the 22nd LACCEI International Multi-Conference for Engineering, Education, and Technology (San Jose: Sustainable Engineering for a Diverse, Equitable, and Inclusive Future at the Service of Education, Research, and Industry for a Society 5.0).
Fídel, L., Zegarra, J., Vilchez, M., Castillo, L., and Jackson, L. (2006). “Evolution of landslide activity, and the origin of debris flows in the el niño affected payhua creek basin, matucana area, huarochiri, peru," in International Association for Engineering Geology and the Environment (London: The Geological Society of London), 1–12.
Fovet, O., Belemtougri, A., Boithias, L., Braud, I., Charlier, J.-B., Cottet, M., et al. (2021). Intermittent rivers and ephemeral streams: perspectives for critical zone science and research on socio-ecosystems. WIREs Water 8:e1523. doi: 10.1002/wat2.1523
Fustos-Toribio, I., Manque-Roa, N., Vásquez Antipan, D., Hermosilla Sotomayor, M., and Letelier Gonzalez, V. (2022). Rainfall-induced landslide early warning system based on corrected mesoscale numerical models: an application for the southern andes. Nat. Hazards Earth Syst. Sci. 22, 2169–2183. doi: 10.5194/nhess-22-2169-2022
Garcia-Urquia, E., and Axelsson, K. (2015). Rainfall thresholds for the occurrence of urban landslides in tegucigalpa, honduras: an application of the critical rainfall intensity. Taylor Francis 97, 61–83. doi: 10.1111/geoa.12092
Gibson, S., Moura, L. Z., Ackerman, C. T., Ortman, N., de Amorim, R. C., Floyd, I., et al. (2022). Prototype scale evaluation of non-newtonian algorithms in hec-ras: mud and debris flow case studies of santa barbara and brumadinho. Multidisciplinary Digital Publishing Institute 12:134. doi: 10.3390/geosciences12030134
Goyburo, A., Millan, C., Gutierrez, L., Gutierrez, M., and Lavado, W. (2024). “Caraterización del peligro por movimento de masas debido a lluvias extremas en la quebrada malanche, distrito de punta hermosa (characterization of hazard from mass movements due to extreme rainfall in the malanche ravine, punta hermosa district)," Servicio Nacional de Metereología e Hidrologia del Peru-SENAMHI (Lima: National Service of Meteorology and Hydrology of Peru (SENAMHI)), 71.
Grodek, T., and Benito, G. (2024). Reevaluating flood protection: disaster risk reduction for urbanized alluvial fans. Nat. Hazards Earth Syst. Sci. Discuss. 2024, 1–28. doi: 10.5194/nhess-2024-171
Guo, Y., Feng, Z., Wang, L., Tian, Y., and Liang, C. (2024). Hazard assessment of debris flow: a case study of the huiyazi debris flow. Multidisciplinary Digital Publishing Institute 16:1349. doi: 10.3390/w16101349
Gutiérrez-Jurado, K. Y., Partington, D., Batelaan, O., Cook, P., and Shanafield, M. (2019). What triggers streamflow for intermittent rivers and ephemeral streams in low-gradient catchments in mediterranean climates. Water Resour. Res. 55, 9926–9946. doi: 10.1029/2019WR025041
Guzzetti, F., Peruccacci, S., Rossi, M., and Stark, C. P. (2008). The rainfall intensity-duration control of shallow landslides and debris flows: an update. Landslides 5, 3–17. doi: 10.1007/s10346-007-0112-1
Hawker, L., Uhe, P., Paulo, L., Sosa, J., Savage, J., Sampson, C., et al. (2022). A 30 m global map of elevation with forests and buildings removed. IOP Publishing 17:24016. doi: 10.1088/1748-9326/ac4d4f
Helsel, D., Hirsch, R., Ryberg, K., Archfield, S., and Gilroy, E. (2020). Statistical Methods in Water Resources, volume Book 4, Chapter A3 of Techniques and Methods. U.S. Geological Survey. Supersedes USGS Techniques of Water-Resources Investigations, book 4, chap. A3, version 1.1. Reston, VA: U.S. Geological Survey. doi: 10.3133/tm4A3
Hsu, Y.-C., Chang, Y.-L., Chang, C.-H., Yang, J.-C., and Tung, Y.-K. (2018). Physical-Based Rainfall-Triggered Shallow Landslide Forecasting. Berlin: Springer Science and Business Media LLC, 3. doi: 10.1186/s40713-018-0011-8
Huerta, A., Lavado-Casimiro, W., and Felipe-Obando, O. (2022). High-resolution gridded hourly precipitation dataset for peru (piscoph). Data Brief 45:108570. doi: 10.1016/j.dib.2022.108570
Hungr, O. (1995). A model for the runout analysis of rapid flow slides, debris flows, and avalanches. Can. Geotech. J. 32, 610–623. doi: 10.1139/t95-063
INEI. (2017). Censos nacionales 2017: Xii de población, vii de vivienda y iii de comunidades indígenas (2017 national census: Xii population, vii housing, and iii indigenous communities). Available online at: https://censo2017.inei.gob.pe/ (Accessed July 08, 2024).
INGEMMENT. (2019). Evaluación de peligros geológicos en el distrito de punta hermosa. región lima, provincia lima (geological hazard assessment in the district of punta hermosa, lima region, lima province). Lima: Instituto Geológico, Minero y Metalúrgico - INGEMMET, 29.
Iruri Guzman, O. V., and Jiménez Garcia, L. F. (2021). Delimitación de áreas críticas mediante el modelamiento de flujo de lodos con el software flo 2d en la quebrada malanche, distrito de punta hermosa, Lima-Perú.
Jaafar, H. H., Ahmad, F. A., and Beyrouthy, N. E. (2019). GCN250, new global gridded curve numbers for hydrologic modeling and design. Sci. Data 6:145. doi: 10.1038/s41597-019-0155-x
Ke, Q., Tian, X., Bricker, J. D., Tian, Z., Guan, G., Cai, H., et al. (2020). Urban pluvial flooding prediction by machine learning approaches—a case study of Shenzhen city, China. Elsevier BV 145:103719. doi: 10.1016/j.advwatres.2020.103719
Kuroiwa, J. (2002). Sustainable cities, a regional seismic scenario, and the 6-23-2001 arequipa Peru earthquake. American Society of Civil Engineers 3, 158–162. doi: 10.1061/(ASCE)1527-6988(2002)3:4(158)
Lainas, S., Sabatakakis, N., and Koukis, G. (2016). Rainfall thresholds for possible landslide initiation in wildfire-affected areas of western greece. Bull. Eng. Geol. Environ. 75, 883–896. doi: 10.1007/s10064-015-0762-5
Melillo, M., Brunetti, M. T., Peruccacci, S., Gariano, S. L., Roccati, A., and Guzzetti, F. (2018). A tool for the automatic calculation of rainfall thresholds for landslide occurrence. Environ. Model. Softw. 105, 230–243. doi: 10.1016/j.envsoft.2018.03.024
Miardini, A., and Susanti, P. D. (2020). Determination of cumulative rainfall threshold trigger of landslides in grindulu watershed as an early warning effort. J. Degrad. Min. Lands Manag. 7, 2059–2064. doi: 10.15243/jdmlm.2020.072.2059
Millán-Arancibia, C., and Lavado-Casimiro, W. (2023). Rainfall thresholds estimation for shallow landslides in peru from gridded daily data. Nat. Hazards Earth Syst. Sci. 23, 1191–1206. doi: 10.5194/nhess-23-1191-2023
Mitra, D., Das, D., and Ghosh, A. R. (2021). “Flood mapping and prediction using flo-2d basic model," in Advances in Water Resources Management for Sustainable Use, eds. P. K. Roy, M. B. Roy, and S. Pal (Springer Singapore: Singapore), 109–120. doi: 10.1007/978-981-33-6412-7_9
Morera, S. B., Condom, T., Crave, A., Steer, P., and Guyot, J. L. (2017). The impact of extreme el niño events on modern sediment transport along the western peruvian andes (1968–2012). Sci. Rep. 7:11947. doi: 10.1038/s41598-017-12220-x
Moya, L., Vilela, M., Jaimes, J., Espinoza, B., Pajuelo, J., Tarque, N., et al. (2024). Vulnerabilities and exposure of recent informal urban areas in lima, peru. Prog. Disaster Sci. 23:100345. doi: 10.1016/j.pdisas.2024.100345
Nam, D. H., Kim, M.-I., Kang, D. H., and Kim, B. S. (2019). Debris flow damage assessment by considering debris flow direction and direction angle of structure in south korea. Water 11:328. doi: 10.3390/w11020328
O'Brien, J. S., Julien, P. Y., and Fullerton, W. T. (1993). Two-dimensional water flood and mudflow simulation. J. Hydraul. Eng. 119, 244–261. doi: 10.1061/(ASCE)0733-9429(1993)119:2(244)
Ortega, J. C. B., Bendezu, M. A. L., Savio, A. A. D., and Canales, F. A. (2022). Effect of lithological and geotechnical characteristics on the generation of debris flows in the arid basin of mirave, peru. Ambiente Água 17:1. doi: 10.4136/ambi-agua.2785
Peng, Q., Xie, S.-P., Passalacqua, G. A., Miyamoto, A., and Deser, C. (2024). The 2023 extreme coastal el niño: atmospheric and air-sea coupling mechanisms. Sci. Adv. 10:eadk8646. doi: 10.1126/sciadv.adk8646
Prenner, D., Kaitna, R., Mostbauer, K., and Hrachowitz, M. (2018). The value of using multiple hydrometeorological variables to predict temporal debris flow susceptibility in an alpine environment. Wiley-Blackwell 54, 6822–6843. doi: 10.1029/2018WR022985
Rachdane, M., Saidi Mohamed, E., El Khalki, E. M., Hadri, A., Boughdadi, S., Nehmadou Mohamed, A., et al. (2024). Unraveling flood dynamics at sub-daily time scales in semi-arid to arid basins in south morocco. Natural Hazards 12, 5413–5433. doi: 10.1007/s11069-024-07022-0
Rau, P. (2025). Estimación de crecientes en quebradas efímeras, un enfoque desde la hidrología de campo y la simulación probabilística. Caso de la quebrada malanche rio seco, lima.
Reichenbach, P., Cardinali, M., DeVita, P., and Guzzetti, F. (1998). Regional hydrological thresholds for landslides and floods in the tiber river basin (central italy). Environ. Geol. 35, 146–159. doi: 10.1007/s002540050301
Segoni, S., Piciullo, L., and Gariano, S. L. (2018). A review of the recent literature on rainfall thresholds for landslide occurrence. Landslides 15, 1483–1501. doi: 10.1007/s10346-018-0966-4
Sirko, W., Kashubin, S., Ritter, M., Annkah, A., Bouchareb, Y. S. E., Dauphin, Y. N., et al. (2021). Continental-scale building detection from high resolution satellite imagery. arXiv preprint arXiv:2107.12283. doi: 10.48550/arXiv.2107.12283
Song, C.-H., Lee, J-S., and Kim, Y.-T. (2021). Predicting the initiation area of a debris flow using geomorphological characteristics and a physically-based model. J. Korean Soc. Hazard Mitig 21, 137–147. doi: 10.9798/KOSHAM.2021.21.2.137
Thomas, M. A., Mirus, B. B., and Collins, B. D. (2018). Identifying physics-based thresholds for rainfall-induced landsliding. Geophys. Res. Lett. 45, 9651–9661. doi: 10.1029/2018GL079662
USDA. (1986). Urban hydrology for Small Watersheds. Technical Report 55 (TR-55), USDA Soil Conservation Service, Washington DC.
Villacorta, S. P., Evans, K. G., Nakatani, K., and Villanueva, I. (2020). Large debris flows in chosica, lima, peru: the application of hydraulic infrastructure for erosion control and disaster prevention. Aust. J. Earth Sci. 67, 425–436. doi: 10.1080/08120099.2020.1690577
Wang, C.-W., and Yamada, T. (2014). Development of early warning system for geotechnical multi-hazards induced by rainfall. J. Jpn. Soc. Civ. Eng., Ser. B1 70, 205–210. doi: 10.2208/jscejhe.70.I_205
Wieczorek, G. F., and Glade, T. (2007). “Climatic factors influencing occurrence of debris flows," in Debris-Flow Hazards and Related Phenomena, eds. M. Jakob, and O. Hungr (Springer Berlin Heidelberg), 325–362. doi: 10.1007/3-540-27129-5_14
Yang, Z., Wang, L., Qiao, J., Uchimura, T., and Wang, L. (2020). Application and verification of a multivariate real-time early warning method for rainfall-induced landslides: implication for evolution of landslide-generated debris flows. Landslides 17, 2409–2419. doi: 10.1007/s10346-020-01402-w
Keywords: rainfall, hydrology, hydraulic, mudflows, thresholds
Citation: Goyburo A, Gutierrez L, Rau P and Lavado-Casimiro W (2025) Empirical rainfall thresholds for mudflow events in an arid basin of the Peruvian coast. Front. Water 7:1637115. doi: 10.3389/frwa.2025.1637115
Received: 28 May 2025; Accepted: 25 August 2025;
Published: 11 September 2025.
Edited by:
Seifu Admassu Tilahun, International Water Management Institute (IWMI), GhanaReviewed by:
Katherine Vammen, Institute of Interdisciplinary Research in Natural Sciences (IICN), NicaraguaShrabani Tripathy, Washington University in St. Louis, United States
Copyright © 2025 Goyburo, Gutierrez, Rau and Lavado-Casimiro. This is an open-access article distributed under the terms of the Creative Commons Attribution License (CC BY). The use, distribution or reproduction in other forums is permitted, provided the original author(s) and the copyright owner(s) are credited and that the original publication in this journal is cited, in accordance with accepted academic practice. No use, distribution or reproduction is permitted which does not comply with these terms.
*Correspondence: Andres Goyburo, YWdveWJ1cm9Ac2VuYW1oaS5nb2IucGU=