 Brian E. Saccardi1*
 Ashlee L. Dere2
 Allison E. Goodwell1
 Jennifer Druhan3
 Lisa R. Welp4
 Neal E. Blair5Erin Bauer6James Haken6Martha E. Jimenez-Castaneda7Timothy Filley7Ian Frantal4
 Praveen Kumar1,8
- 1Prairie Research Institute, University of Illinois at Urbana-Champaign, Champaign, IL, United States
- 2Department of Geography/Geology, University of Nebraska at Omaha, Omaha, NE, United States
- 3Department of Earth Science and Environmental Change, University of Illinois at Urbana-Champaign, Champaign, IL, United States
- 4Department of Earth, Atmospheric, and Planetary Sciences, Purdue University, West Lafayette, IN, United States
- 5Department of Earth, Environmental, and Planetary Sciences, Northwestern University, Evanston, IL, United States
- 6Illinois State Water Survey, University of Illinois at Urbana-Champaign, Champaign, IL, United States
- 7Institute for Resilient Environmental and Energy Systems, University of Oklahoma, Norman, OK, United States
- 8Civil and Environmental Engineering, University of Illinois at Urbana-Champaign, Champaign, IL, United States
Soil CO2 fluxes are a key component of the terrestrial carbon cycle. However, these fluxes are notoriously expensive to measure, especially in remote and understudied regions. This is primarily due to the cost of methods currently in use to measure soil CO2 fluxes. To address this gap, we developed and tested a low-cost, lightweight, and portable CO₂ flux chamber designed for use in remote environments. The chambers we developed are built from primarily open source and off-the-shelf components that use minimum power and are designed to be easy to construct and use. We evaluated the sensors’ performance through error analysis and tested them in the field at agricultural and prairie sites in Illinois and Nebraska USA. We use field data to produce a partial soil CO2 budget using the chamber flux estimates and production estimates from a gradient-based method. Overall, the results show that chamber size and sampling frequency can be used to reduce measurement error. Additionally, our results fall within the observed ranges for prairie CO2 fluxes in the literature. The simplicity, affordability, and ease of construction of our design make it a valuable tool for expanding soil carbon flux monitoring networks, facilitating education, and improving our understanding of ecosystem carbon budgets.
Introduction
Soils contain an estimated 2,500–3,300 Pg of total carbon, making them an important component of the global carbon (C) budget (Brevik, 2012; Cavallaro et al., 2018). This carbon is cycled between the soil, vegetation, and the atmosphere with mean residence times that range from days to thousands of years (Davidson et al., 2006; Shi et al., 2020). The rapid turnover of soil carbon is facilitated by plant and microbial communities which take up and rerelease 130 Pg C/yr. (Friedlingstein et al., 2025; Jansson and Hofmockel, 2020). The magnitude of these biotic processes is altered by both the changing climate and land use which in turn can act to reduce or enlarge the terrestrial carbon sink, depending on the direction of change. Despite the central role soils play in the global carbon cycle, soil carbon fluxes remain difficult to constrain due to their high spatial and temporal variability and the lack of sensors at high resolutions that could be used for remote monitoring.
High spatiotemporal variability in soil carbon fluxes necessitates more in-situ measurements to quantify climate and land use change impacts on the carbon cycle and validate remote sensing and model outputs (Buczko et al., 2015; Wang et al., 2024). Direct measurements of changes within carbon stocks are possible but require years of continuous measurement and primarily provide quantification of changes within carbon stocks within the context of past events (Guo and Gifford, 2002). Comparatively, soil CO2 flux can be measured rapidly and provide a physical basis for modeling efforts which predict future changes to the carbon cycle. Soil CO2 is measured through a variety of methods including modeled production based on measured soil CO2 profiles, surface chamber-based methods, and eddy covariance flux towers (Lund et al., 1999; Makita et al., 2018; Pedersen et al., 2010; Wagner et al., 1997; M. Wang et al., 2010; Winnick et al., 2020). Additionally, new methods are under development which would measure in-situ changes to soil stocks through time which would allow us to capture changes in many aspects of the soil C cycle (Gyawali et al., 2025). The high costs of these methods lead to few monitored sites that capture a variety of different soil CO2 measurements. For example, eddy covariance towers capture aboveground respiration, and gradients capture soil CO2 production, instead of direct soil fluxes. This study addresses the need for more, and less expensive, measurements of soil carbon fluxes. Toward this, we describe the development of a low-cost and portable chamber-based CO2 sampler.
Each of the methods mentioned above has advantages and drawbacks in terms of area sampled, price, data requirements, and ease of use. Eddy flux towers provide a continuous ecosystem scale estimate of fluxes along with many other meteorological measurements. These flux estimates are based on the eddy covariance method, which relies on covariances between high frequency observations of wind speed and CO2 concentration to quantify upward or downward fluxes at sub-hourly timescales (Baldocchi, 2003). However, eddy flux towers are very expensive to install and maintain (installation $10,000 s to $100,000, upkeep $1000s yearly) due to the large number of sensors and necessary tower height (Haszpra et al., 2005). Additionally towers capture net ecosystem exchange, which combines soil respiration and photosynthetic uptake. Alternatively, soil CO2 profiles involve estimating soil CO2 production by utilizing measured CO2 gradients in the soil and Fick’s second law of diffusion to predict the net rate of soil CO2 production or consumption. These profiles can be relatively inexpensive ($100 s) if manual sampling is conducted but are time consuming, require additional continuous costs for analyzing samples ($100 s per sampling), and rely on detailed site-specific knowledge (Cerling, 1984; Davidson et al., 2006; Davidson and Trumbore, 1995; Tang et al., 2005; Winnick et al., 2020).
Chamber-based methods are another common approach that directly measure soil CO2 flux (Bouma et al., 1997; Conen and Smith, 1998; Cueva et al., 2017; Li et al., 2021). In principle, chamber-based methods take a parcel of atmospheric air, trap it against the soil surface and then measure the change in concentration of that air parcel to estimate production or fluxes into or out of the soil (Davidson et al., 2002). There are two types of chamber-based methods: the active method and the passive method (Gao and Yates, 1998). The active method, sometimes called a dynamic chamber, takes a continuous measurement of soil CO2 production. This is achieved by continuously pumping a known amount of air with a measured concentration of CO2 into and out of the chamber. The difference in the concentration of CO2 leaving and entering the chamber can then be used to calculate the rate of production continuously (Fang et al., 1996; Heinemeyer and McNamara, 2011). The additional pumps require extra equipment and power, causing the active method to be more complicated. The passive chamber method takes a snapshot of soil CO2 production by measuring the buildup of CO2 in a sealed chamber over time. This is in principle the simplest direct measurement of soil CO2 flux (Gao and Yates, 1998). A primary benefit of chamber-based methods is that they provide a direct measurement of soil CO₂ fluxes and are relatively simple to use. Chamber methods also require minimal site information, such as soil moisture, diffusion, and texture, which makes them ideal for use in understudied or remote regions. Often passive chambers are automated to open and close at set intervals, enabling semi-continuous measurements of an area, however this increases the power and equipment costs. Due to these benefits, chamber-based methods offer a middle ground, allowing for rapid, high-resolution, direct measurements of soil fluxes without some of the extreme costs that eddy flux towers incur, or detailed site knowledge required for gradient methods.
While automated chambers are ideal for some sites, they are still power consumptive and relatively expensive to implement ($1000s per chamber). In general, the financial and infrastructural challenges of established methods and chamber designs to measure CO2 fluxes make for few heavily monitored sites where soil flux measurements are collected, leaving many under-studied regions (Perez-Quezada et al., 2023). In response to the cost of current chamber systems on the market and with the variety of readily available non-dispersive infrared (NDIR) sensors, many studies have developed less expensive chambers to allow for greater access to automated chamber-based measurements (Gagnon et al., 2016; Midwood et al., 2008; Zawilski and Bustillo, 2023). However, these often attempt to fully recreate the industry available automated chambers (making them expensive when compared to our design), power consumptive, and requiring significant fabrication skills and access to tools to construct (Gagnon et al., 2016). While the open-source fully automated chambers are beneficial in allowing for a cheaper alternative to install at an intensely monitored site, there is still a need for a maximally simple and portable solution for measurements in remote locations, multiple locations, or to rapidly pair flux samples with other data. We have thus developed a light, portable, low-power, inexpensive, and easily constructed chamber-based CO2 flux sampler to fill the gap of an easily deployable sampler that can measure soil fluxes in conjunction with sampling activities. This sampler is composed of readily available components that can be obtained from most hardware stores or major online retailers and uses open-source electronics when possible. We anticipate that this design along with the detailed build guide (Supplementary Information) will allow for greater spatial coverage of soil CO2 flux sampling. Therefore, in this manuscript we compare our new design to fluxes measured using a gas chromatograph, provide a sensitivity analysis for critical measurement factors, and show examples of applications in which our sensor could be used.
Methods
Site description
The sensors were implemented in the Critical Interface Network (CINet) Management Induced Reactive Zone (MIRZ) (Supplementary Figure 1) sites in Illinois and Nebraska. The MIRZ sites were designed to monitor the rooting zone where biogeochemical processes are influenced by plants in both prairie and agricultural environments. The Illinois sites include an active agricultural field (ILAG) rotated annually between corn and soybeans and a restored prairie site (ILPR) established in 2007. Both sites feature soils with an average bulk density of 1.47 gdw cmws−3 (dry weight, wet soil volume). They receive an average annual precipitation of 101.9 cm a year and have a mean air temperature of 11.5 °C (MRCC, CHAMPAIGN 3S (IL) USC00118740). During the summer and fall of 2024 a D0 drought (20 to 30 percentile for most indicators as defined by U.S. Drought Monitor) (Simeral and Artusa, 2025) lasted from mid-June to mid-July reaching D2 (5 to 10 percentile for most indicators) at its peak, which lasted from September 2024 to January 2025 [National Drought Mitigation Center (NDMC), U.S. Department of Agriculture (USDA) and National Oceanic and Atmospheric Administration (NOAA)]. The ILPR site is located 365 m from the Sangamon River, while the ILAG site is tile-drained to an adjacent ditch that is a tributary to the Sangamon River. The Nebraska sites are within the Glacier Creek Preserve, consisting of restored prairie (NEPR) and agricultural land (NEAG) (Dere et al., 2019). Both are located on adjacent hilltop summits with slopes <0.05 m m−1. The soils are Contrary-Monona-Ida Complex, derived from loess, with bulk densities of 1.11 ± 0.09 gdw cmws−3 for agricultural and 1.14 ± 0.05 gdw cmws−3 for prairie soils. NEPR, restored ~50 years ago, is maintained with periodic 3-year burns, whereas NEAG is in a yearly corn-soy rotation and has a deep water table (~20 m). The Nebraska sites receive 78 cm of annual precipitation with an average temperature of 10 °C (Dere et al., 2019). Douglas County NE was in a drought reaching D2 stage at its peak for all of 2024 except June through August which were not considered a drought (U. S. Drought Monitor) Currently all the MIRZ sites are monitored via sensor arrays installed at depths of 20, 60, 110, and 180 cm. These sensor arrays included Eosence eosGP for CO₂, Apogee SO-110 for O₂, and Campbell Scientific CS655 and Meter Group Teros 12 for soil moisture and temperature in Nebraska and Illinois, respectively.
Flux sensor design
The soil flux sensor is designed after the passive chambers that are commonly used (Conen and Smith, 1998), and was redesigned after field testing two additional times leading to V1, V2, and V3 chambers. The V2 sensor redesign was primarily to move the non-sensor electronics out of the sensor chamber to minimize corrosion, and the sample interval was decreased from 15 min to 10 s (supplemental Build Guide V2). The V3 was developed as a cheaper and easier to assemble version for educational and research purposes, and therefore data from the V3 is not included in this study (supplemental Build Guide V3). The sensors are programmed to take data at set intervals (15 min for V1 and 10 s for V2 and V3) and are comprised of two major parts: the datalogger and the sensor chamber. For all versions the sensor chamber consists of 6in PVC housing. V1 and V2 had two sensors, one to measure CO2 and one for relative humidity and temperature, whereas version 3 used a combined sensor for all three measurements (Figure 1). The CO2 sensor used in V1 and V2 were the “006-0-0008 Senseair Sunrise HVAC,” a non-dispersive infrared sensor that has a measurement range of 400–10,000 ppm and an accuracy of ±30 ppm or 3% of the reading. The Sunrise CO2 sensor was chosen as it can operate at 3.05–5.5 V and uses 1–34 μA of power. However, alternative sensors such as the “030-8-0006K30,” “004-0-0053 Senseair S8,” “Adafruit SCD-41,” or “Adafruit SCD-30” are available and in the V3 design (which has yet to be field tested) the “Adafruit SCD-30” is used. For the relative humidity (RH) and temperature sensor, an Adafruit SHT30 was used in V1 and V2 with an accuracy of ±1.5 for RH and ±0.1 °C for temperature. The datalogger is made up of three components: an SD card reader for data storage, a clock, and an Arduino which is consistent across all versions except V3, which omits the clock. For a detailed guide on how to build V2 and V3, see the Supplemental Documents.
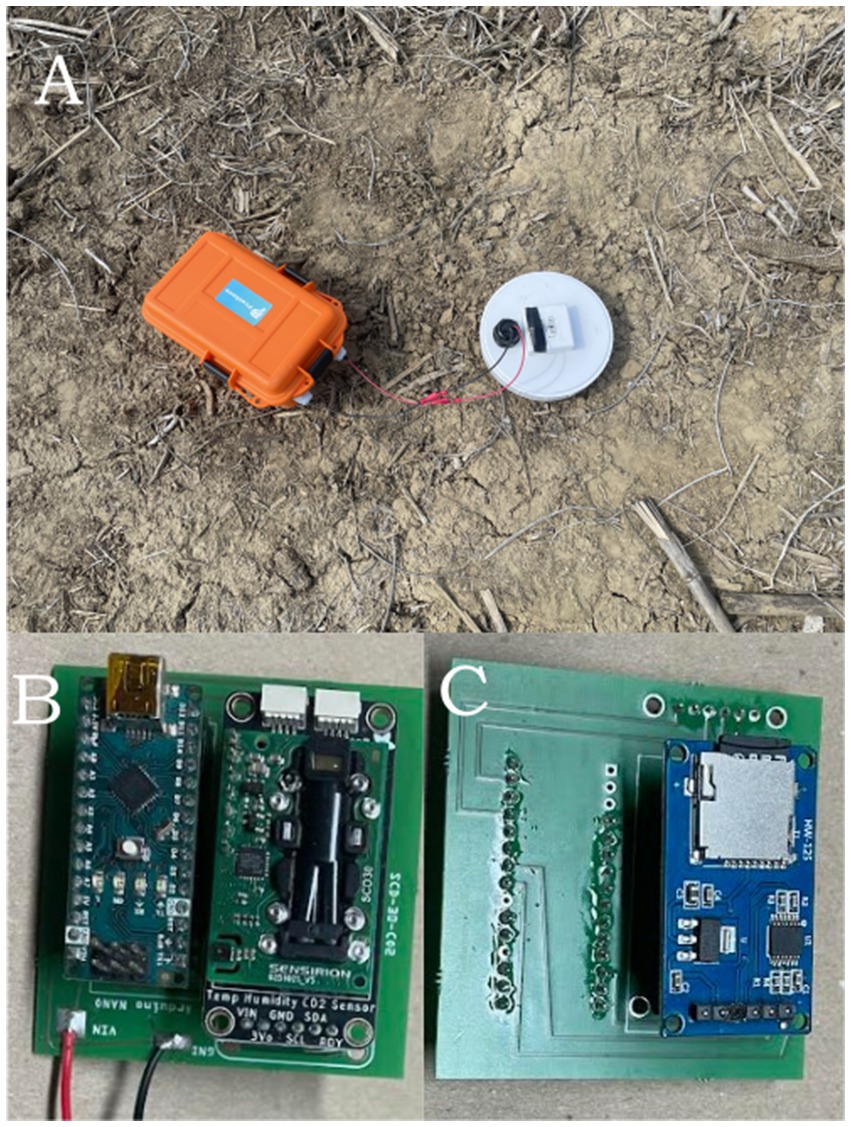
Figure 1. V1 sensor deployed in the field. The orange box is the battery box and the white PVC is the chamber (A). V3 sensor top (B) and bottom (C) including, from left to right, the Arduino Nano, Adafruit SCD-30, and SD card reader.
Analytical methods
Throughout the growing season two methods were used to measure soil CO2 fluxes and one was used to measure production from the sites. These include the static chamber sensor developed here to measure surface fluxes (Davidson et al., 2002) a static chamber measured using samples which were run on a gas chromatography to compare our sensor to, and a gradient-based approach for determining soil CO2 production (Cerling, 1984; Davidson et al., 2006; Winnick et al., 2020). The gradient method used a diffusion model, and CO2 was measured using an Eosence eosGP CO2 sensor installed in a PVC housing (Supplementary Figure 1). These soil production and flux measurements were used to estimate a percentage of the CO2 production that was released to the atmosphere. This was done by taking the mean CO2 production at 20 cm for each site from 10:00 a.m. to 5:00 p.m. each day that chamber data was available and then calculating the percent of that which was released to the atmosphere using the CO2 soil flux rate. Although these methods are temporally paired, there is still the possibility of deeper soil production or buildup from prier respiration and therefore may result in greater than 100% fluxes as the CO2 was produced either deeper than the current flux or before the current flux measurements. However, since the surface soils account for most production, this can be considered an upper bound of the percent of CO2 production released.
The chambers were installed at each site using a PVC female threaded to non-threaded adapter. The non-threaded side was pressed into the ground 5 cm and left in the field between measurements to minimize disturbance. The sensor housing was connected to the battery and threaded onto the PVC adapter for at least 15 min. During separate deployments the chambers were also sampled at 2-min intervals for 20 min as a comparison for the sensor fluxes. The data was cleaned by manually removing all points that were after the CO2 peak. This was done because after CO2 has peaked within the chamber, the sample is no longer measuring a flux rate but is instead measuring the CO2 concentration at equilibrium. This will artificially flatten the regression, under predicting the rate of soil CO2 flux. Fluxes were calculated from the chamber data using the Hutchinson and Mosier Regression (HMR) Library in R (Pedersen et al., 2010; R Core Team, 2025) which uses a hybrid approach that classifies data into linear, nonlinear, or no significant flux (Supplemental text).
An uncertainty analysis was conducted by propagating error through the flux equation. We considered error from the measurement of the chamber volume, sample size, rate of CO2 buildup and the CO2 sensor error across a range of mean chamber CO2 concentrations. We used the Ideal Gas Law and the linear rate of change in chamber CO₂ concentration over time to determine the chamber flux (F, μmol m−2 s−1) estimation error using Equation 1:
where P is atmospheric pressure (Pa), V is the chamber volume (m3), R is the universal gas constant (8.314 J mol−1 K−1), T is air temperature in the chamber (K), A is the chamber footprint area (m2), and dC/dt is the linear rate of change in CO₂ concentration over time (ppm s−1). The uncertainty in the slope was estimated based on the sensor error with Equation 2:
Where σC is the standard deviation of CO₂ concentration based on sensor accuracy (3% of the mean CO₂ concentration during the measurement), N is the number of samples in the regression, and Δt is the total sample time in seconds. The flux uncertainty (σF) was then estimated by propagating error through the flux equation using standard techniques for uncertainty propagation resulting in Equation 3:
Where σT is the uncertainty of the temperature measurement and σV is the uncertainty of the chamber volume.
Additionally, we performed correlations to compare the chamber measurements to additional data such as temperature and Normalized Difference Vegetation Index (NDVI). Specifically, we used Pearson correlations of soil temperature at 20 cm and NDVI to CO2 fluxes. The NDVI data was acquired from Landsat 8 through Google Earth Engine and all calculations were done in R (R Core Team, 2025).
Results and discussion
Chamber component-based errors
When comparing our chamber measured fluxes from the two methods (manual sampling or NDIR sensor) during the growing season (May to Oct) we note no significant differences (Figure 2). Despite no significant differences in the mean the ranges seen at each site vary with the sensor measurements in NEAG having the largest range. This is due primarily to the outlier in July which had a flux of 10.7 μmol m−2 s−1 3.6X higher than any other measurement in NE during the growing season. Despite this large difference there is no corresponding rain or fertilization event with the time of the NEAG July flux outlier. However, this sample was conducted using the V1 sensor which had a sample interval of 15 min resulting in just three readings before exceeding the sensor range likely resulting in the excessively high measurement. While the long sampling interval saves power and is sufficient for times when fluxes are low, we fixed this oversite in the V2 sensors as it samples at a 10 s interval. Overall, the developed sensors show reasonably similar fluxes over the growing season for all sites and the measured fluxes fall within the range seen within the literature.
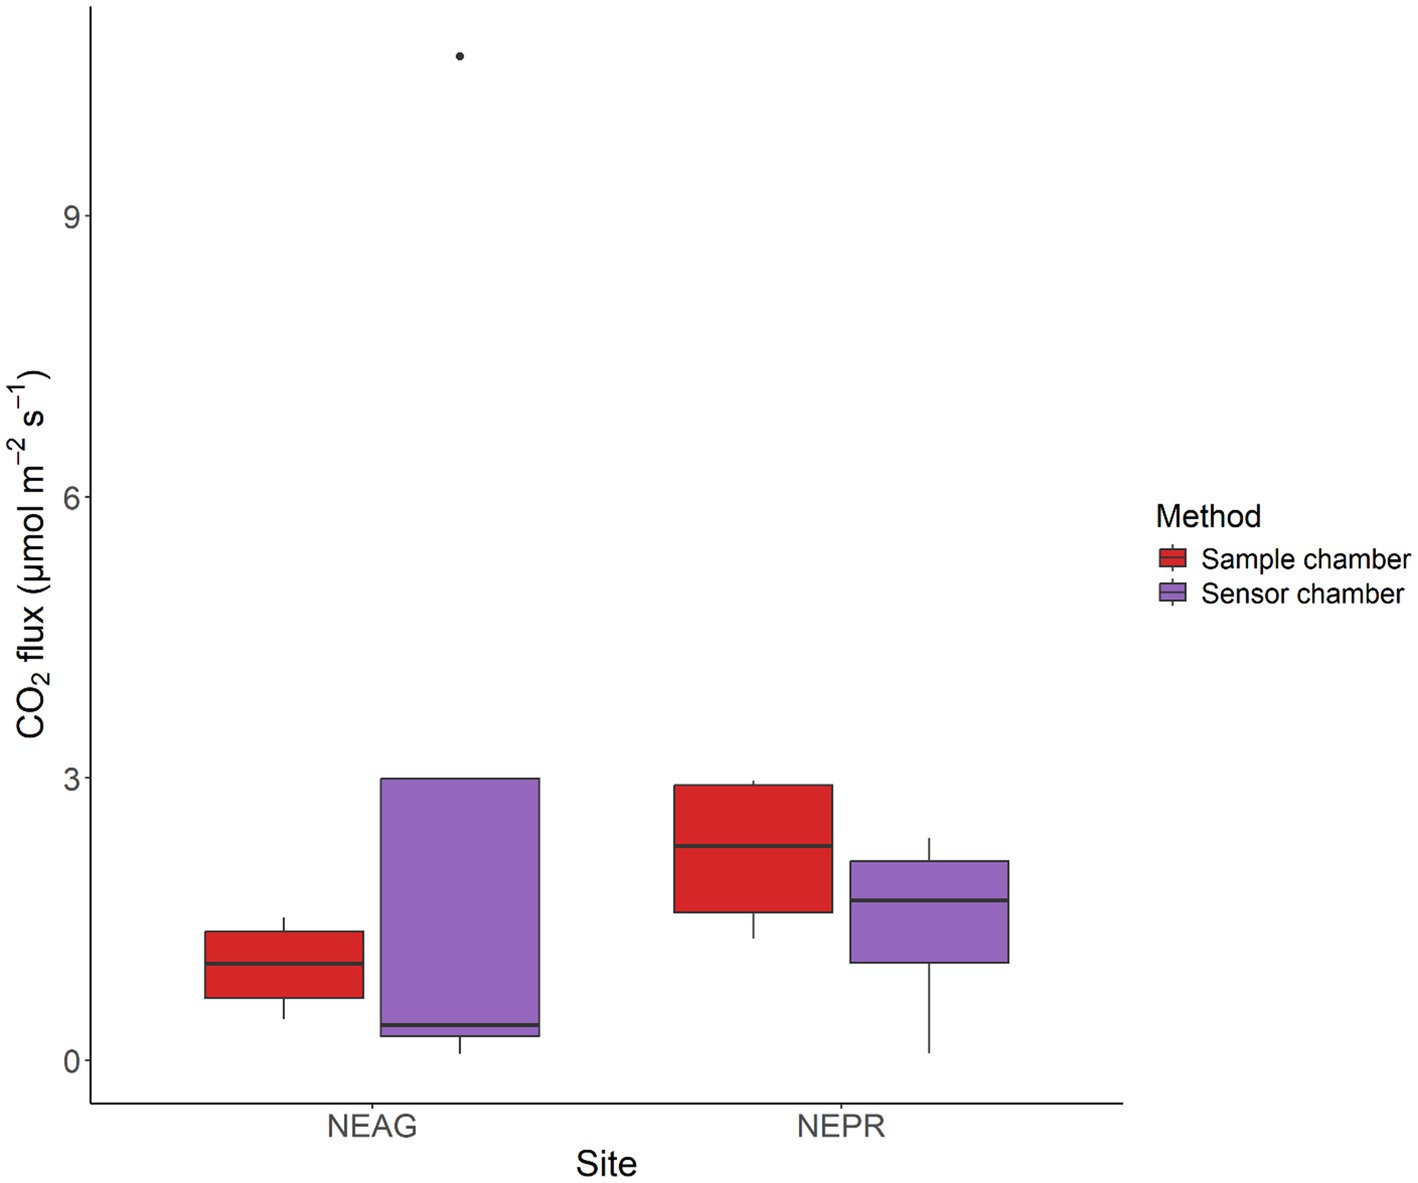
Figure 2. Fluxes measured using the static chamber methods at the NEAG and NEPR sites during the growing season months (May to Oct). Each site has an N of 4. Red (left) are from the samples and purple (right) are from the sensor chamber developed here. The center line of each box is the median, the box bounds the first and third quartile, the whiskers are 1.5 times the interquartile range, and all other points are outside of the interquartile range.
Our flux chamber design is based on the static chamber method and uses an NDIR (nondispersive infrared) CO2 gas sensor, both of which are commonly used in measuring soil CO2 fluxes, as chamber measurements have been around since the 1920s (Davidson et al., 2002; Lundegardh, 1926). Therefore, past studies have identified many of the potential sources of error such as changes in pressure, the number of samples taken, or alterations to the CO2 gradient due to buildup in the chamber (Davidson et al., 2002). Furthermore, many of these errors are due to the soil environment in which the chamber is installed (Butnor et al., 2005) or due to the length of time that the chamber is closed. Conventionally, shorter sample durations are an easy method to reduce some of these sampling biases; however, too few samples can also increase error. Therefore, we present an idealized analysis of the error due to chamber size, mean chamber CO2 concentration, CO2 rate of buildup, and sample duration so that errors can be minimized for each deployment.
In contrast to manual sampling, these sensors allow for near continuous measurements (every 2 s), making shorter deployments possible without reducing the number of sample points (Figure 3). This is a critical aspect of reducing error within chamber measurements as uncertainties of over 10% are seen when less than 100 samples are taken, especially when mean chamber CO2 concentrations are high (Figure 4). From this analysis we found that chamber size plays a smaller role in the uncertainty associated with measurements (Figure 4) with chambers of 1,000 cm3 or larger sufficient for the sensor limitations used within our design which used a 1,390 cm3 chamber. The rate of CO2 buildup from the soil can influence measurement error with lower slopes having higher errors (Figure 4). This means that sites or times with minimum soil respiration are likely to have larger errors and therefore it is prudent to increase the number of samples taken to minimize this additional error. However, this comes with a tradeoff of increased sample duration which may result in additional errors due to changing chamber conditions. Therefore, sampling interval should be decreased to compensate. With proper installation and well-planned deployments, it is possible to minimize errors due to chamber construction and soil chamber interactions. We suggest that in times of low respiration such as winter months or uncharacterized remote locations it is best to use moderately sized (1,000 to 2,000 cm3) chambers and short (2 s) sampling intervals to minimize errors from slow CO2 buildup and under-sampling.
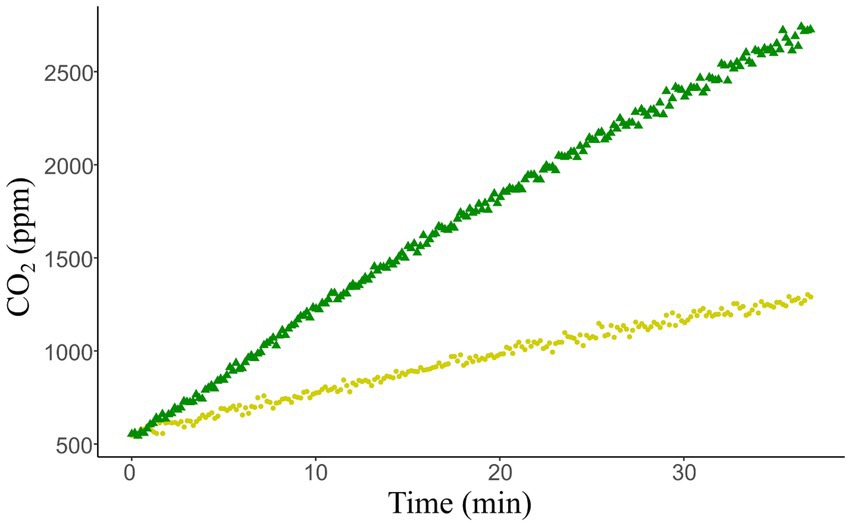
Figure 3. CO2 concentration data taken at the NEAG (yellow circles) and NEPR (green triangle) on August 28, 2024. The calculated fluxes for the sites were 0.4 μmol m−2 s−1 for NEAG and 1.4 μmol m−2 s−1 for NEPR.
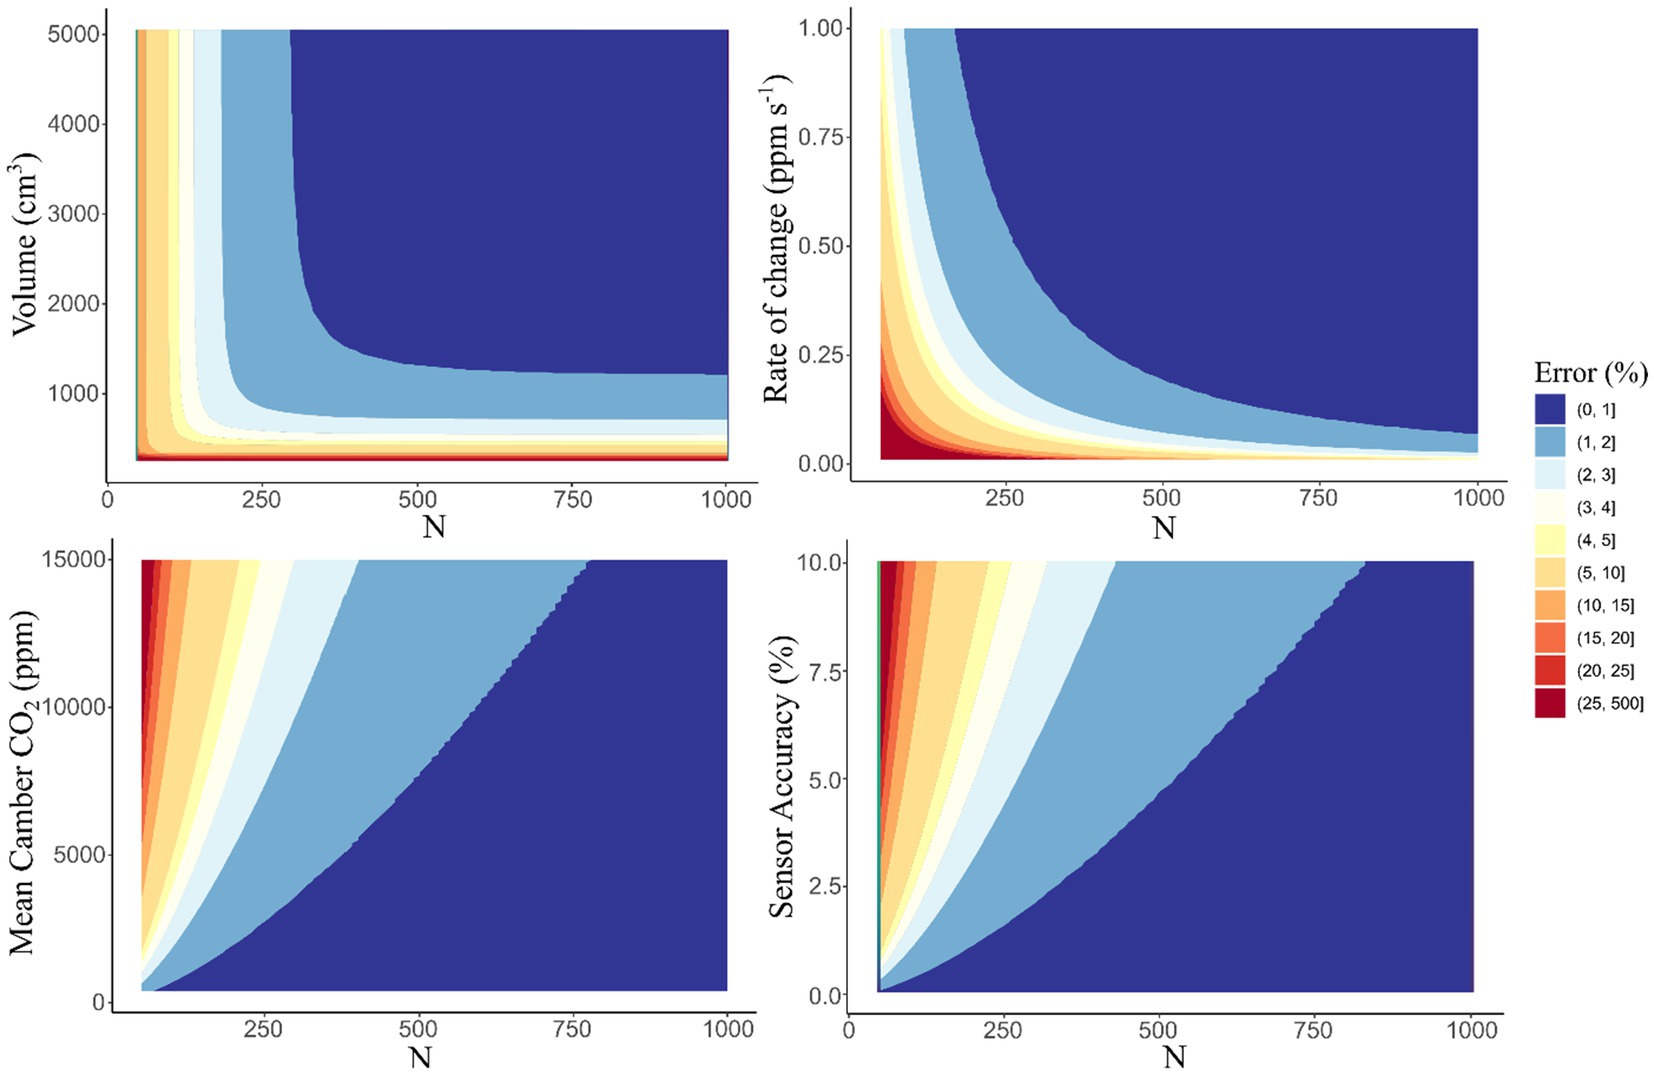
Figure 4. Percent error of the soil chamber in ideal conditions in relation to the number of samples collected (N). The plots represent the range of errors in fluxes as a percentage for varying modeled conditions. When the respective variable is not the Y axis, the values used in the model are chamber volume (1,390 ± 10 cm3), rate of CO2 change (0.3 ppm s−1), mean chamber CO2 (5,000 ppm), and CO2 sensor accuracy (3%).
Flux drivers
When we compare the fluxes measured to those found for other prairie sites in the literature, we note that our values are within the range reported −16 to 27 (μmol ms−2 s−1) (Bovsun et al., 2021; Dugas et al., 1999; Frank and Dugas, 2001; Mielnick and Dugas, 2000; Suyker and Verma, 2001). In addition to determining the magnitude of soil CO2 fluxes, observations over time can help infer processes. For example, we find statistically significant correlations between CO2 fluxes with temperature and NDVI. However, NDVI showed stronger correlations with CO2 fluxes than soil temperature did with fluxes across all the sites except ILAG, and with net CO2 production in soil in NE (Table 1). These correlations are from the seasonality of CO2 fluxes due to both rising temperatures increasing microbial and enzyme activity and plant–soil interactions (Fang and Moncrieff, 2001; Tang et al., 2005). The stronger correlation with NDVI likely relates to the important role that plant exudates play in CO2 production in these environments as they supply soil microbes with substrate to increase respiration (Huang et al., 2014). In other research we have seen similar results with stronger daily CO2 flux correlations with NDVI than temperature (Saccardi et al., in review).
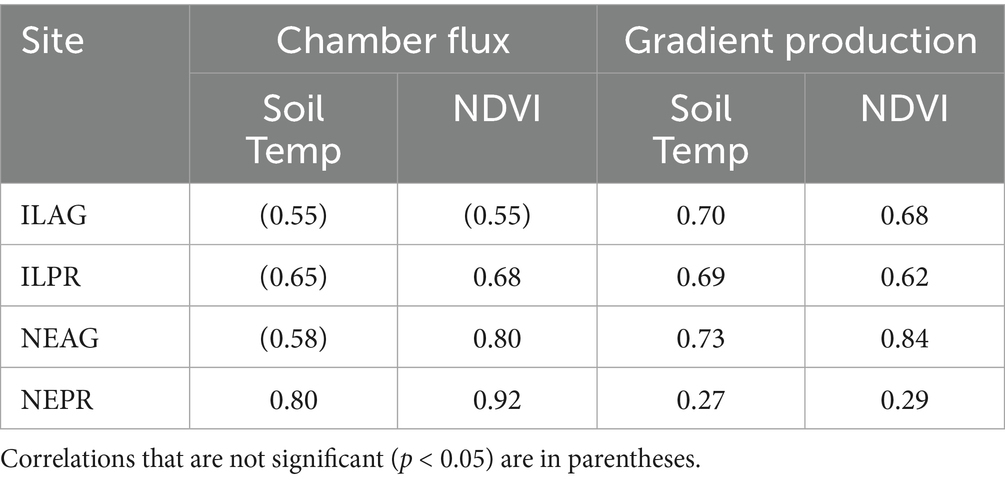
Table 1. Correlations between method predicted fluxes and soil temperature at 20 cm or NDVI for each site.
Soil CO2 budgets
When determining the effects of climate and land use on soil budgets, produced CO2 is primarily lost through diffusion into groundwater, chemical weathering, or evasion to the atmosphere. With the measurements taken at each site, the net soil CO2 production, which accounts for both soil CO2 respiration and weathering losses as well as surface fluxes, were calculated using a gradient and chamber method, respectively. From this we determined the average net soil CO2 production emitted to the atmosphere in ILAG at 47% ± 46%, ILPR at 21% ± 29%, NEAG at 17% ± 8%, and NEPR at 106% ± 159%. While patterns are less distinguished in NE, the IL sites often show a larger percentage of soil production contributing to surface fluxes at the agricultural site (Figure 5). This may be due to the shallower roots, tile drains, and often lower rates of net CO2 production seen in agricultural compared to prairie environments. Furthermore, these results suggest a weaker connection between agricultural soil gases and groundwater, which may have implications for carbon sequestration based on weathering exports and suggests that prairie soils may offer grater sequestration potential.
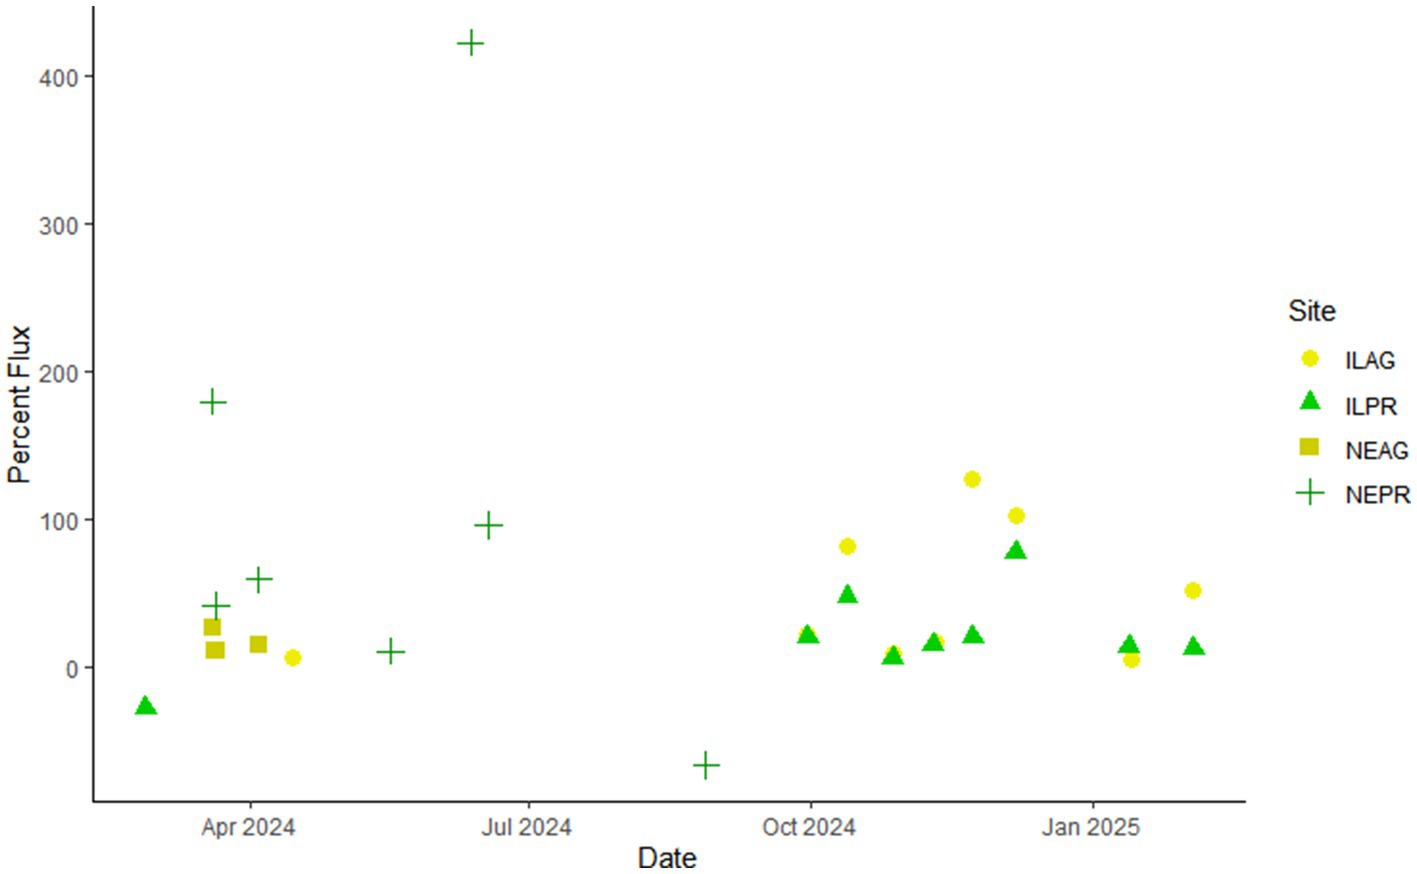
Figure 5. The percentage of the net soil CO2 production rate at 20 cm that is attributed to surface fluxes for reach measured day. Note that IL has stronger trends, with ILAG often showing a greater percent evaded CO2 than ILPR. The colors and shapes represent the different sites.
Future improvements and educational opportunities
Through collaboration with educators a V3 was developed which simplifies the design, code, and reduces the power consumption. To make the V3 easier to build and use we have also included the printed circuit board (PCB) design (Supplemental Documents) as it can be easily and cheaply ordered from several online retailers. This improvement allows for minimum experience with circuitry, and minimal soldering required. Furthermore, the sensor used was switched to an all-in-one temperature, relative humidity, and CO2 sensor with the same level of precision and accuracy as the original. These changes improve the user friendliness of the system and allow for the sensor to be used as a teaching tool. For this to be feasible the third version was made to be significantly cheaper at roughly half the price of V1 or V2. The educational modules will allow students to learn about soil carbon as well as how object-oriented coding languages work. To help achieve the goal of reducing barriers in education and science we include a detailed build guide in the Supplemental Documents.
Considerations for designing chamber sensors
Overall, the chamber flux sensors used in this research are extremely inexpensive (~$150 for V3 in 2024), easily portable and made of readily available materials. These characteristics were among our priorities during the design of the sensor as they allow for easier adoption and use of the technology regardless of the fabrication tools and skill of the user. Although scientists often need a variety of skills, especially when conducting field work, adding additional skills such as fabrication and circuitry are often a barrier to the use of many homemade sensors. Not only are the required skills often outside of the typical, so are the tools required to fabricate housing and other parts, often leading to clunky or delicate workarounds that differ from the original design or require significant investment in fabrication services or equipment. Our V3 design circumvents these barriers, as we freely provide prebuilt code and PCB schematics that are easily purchased from a variety of inexpensive sources. Furthermore, the components used are off-the-shelf and many are open source making them both inexpensive and available from a variety of sources. The final design requires the one-time use of a soldering iron as the only specialized equipment and the fully built sensor uses quick connectors so all parts are easily individually replaceable.
Power consumption and weight were additional priorities during development as they are often barriers to data collection in remote locations. Therefore, the V3 sensor is designed to be lightweight weighing only 36 g, plus a 9 V battery at 45 g, and housing at 762 g. Furthermore, the sensor uses on average 0.31 watts of power and can be used with any dc power supply ranging from 6–12 V. The design includes onboard data storage so that it can be deployed while other samples are taken, minimizing the time requirements of taking the flux measurements. These design decisions were specifically made to make this sensor easy to adopt and use in remote or power limited environments without sacrificing measurement quality, as a spatially robust dataset is needed to understand the effects the climate is having on soils in a variety of environments.
Data availability statement
The original contributions presented in the study are publicly available. This data can be found here: http://www.hydroshare.org/resource/137239e80ebc475e92f55e7ee41c1ea4.
Author contributions
AD: Writing – review & editing, Supervision, Resources, Methodology, Conceptualization. AG: Supervision, Writing – review & editing. JD: Writing – review & editing. LW: Writing – review & editing. NB: Writing – review & editing. EB: Writing – review & editing, Resources. JH: Resources, Writing – review & editing. MJ-C: Writing – review & editing. TF: Writing – review & editing. IF: Writing – review & editing, Resources. PK: Funding acquisition, Resources, Supervision, Writing – review & editing, Project administration. BS: Conceptualization, Formal analysis, Methodology, Software, Visualization, Writing – original draft, Writing – review & editing.
Funding
The author(s) declare that financial support was received for the research and/or publication of this article. We acknowledge National Science Foundation (NSF) Grant EAR #2012850 (PI P. Kumar) for the Critical Interface Network for Intensively Managed Landscapes (CINet).
Conflict of interest
The authors declare that the research was conducted in the absence of any commercial or financial relationships that could be construed as a potential conflict of interest.
Generative AI statement
The author(s) declare that Gen AI was used in the creation of this manuscript. ChatGPT was used as a spelling and grammar check for this paper. The prompt used was “can you check this document for spelling and grammar mistakes as well as make suggestions on ways to improve the manuscript?”.
Any alternative text (alt text) provided alongside figures in this article has been generated by Frontiers with the support of artificial intelligence and reasonable efforts have been made to ensure accuracy, including review by the authors wherever possible. If you identify any issues, please contact us.
Publisher’s note
All claims expressed in this article are solely those of the authors and do not necessarily represent those of their affiliated organizations, or those of the publisher, the editors and the reviewers. Any product that may be evaluated in this article, or claim that may be made by its manufacturer, is not guaranteed or endorsed by the publisher.
Supplementary material
The Supplementary material for this article can be found online at: https://www.frontiersin.org/articles/10.3389/frwa.2025.1638540/full#supplementary-material
References
Baldocchi, D. D. (2003). Assessing the eddy covariance technique for evaluating carbon dioxide exchange rates of ecosystems: past, present and future. Glob. Chang. Biol. 9, 479–492. doi: 10.1046/j.1365-2486.2003.00629.x
Bouma, T. J., Nielsen, K. L., Eissenstat, D. M., and Lynch, J. P. (1997). Estimating respiration of roots in soil: interactions with soil CO 2, soil temperature and soil water content. Plant Soil 195:1334. doi: 10.1023/A:1004278421334
Bovsun, M. A., Castaldi, S., Nesterova, O. V., Semal, V. A., Sakara, N. A., Brikmans, A. V., et al. (2021). Effect of biochar on soil CO2 fluxes from agricultural field experiments in Russian Far East. Agronomy 11:1559. doi: 10.3390/agronomy11081559
Brevik, E. C. (2012). Soils and climate change: gas fluxes and soil processes. Soil Horiz. 53:12. doi: 10.2136/sh12-04-0012
Buczko, U., Bachmann, S., Gropp, M., Jurasinski, G., and Glatzel, S. (2015). Spatial variability at different scales and sampling requirements for in situ soil CO2 efflux measurements on an arable soil. Catena 131, 46–55. doi: 10.1016/j.catena.2015.03.015
Butnor, J. R., Johnsen, K. H., and Maier, C. A. (2005). Soil properties differently influence estimates of soil CO2 efflux from three chamber-based measurement systems. Biogeochemistry 73, 283–301. doi: 10.1007/s10533-004-4022-1
Cavallaro, N., Shrestha, G., Birdsey, R., Mayes, M. A., Najjar, R. G., Reed, S. C., et al. (Eds.). (2018). Second state of the carbon cycle report.
Cerling, T. E. (1984). The stable isotopic composition of modern soil carbonate and its relationship to climate. Earth Planet. Sci. Lett. 71, 229–240. doi: 10.1016/0012-821X(84)90089-X
Conen, F., and Smith, K. A. (1998). A re-examination of closed flux chamber methods for the measurement of trace gas emissions from soils to the atmosphere. Eur. J. Soil Sci. 49, 701–707. doi: 10.1046/j.1365-2389.1998.4940701.x
Cueva, A., Bullock, S. H., López-Reyes, E., and Vargas, R. (2017). Potential bias of daily soil CO2 efflux estimates due to sampling time. Sci. Rep. 7:11925. doi: 10.1038/s41598-017-11849-y
Davidson, E. A., Savage, K. E., Trumbore, S. E., and Borken, W. (2006). Vertical partitioning of CO2 production within a temperate forest soil. Glob. Chang. Biol. 12, 944–956. doi: 10.1111/j.1365-2486.2005.01142.x
Davidson, E. A., Savage, K., Verchot, L. V., and Navarro, R. (2002). Minimizing artifacts and biases in chamber-based measurements of soil respiration. Agric. For. Meteorol. 113, 21–37. doi: 10.1016/S0168-1923(02)00100-4
Davidson, E. A., and Trumbore, S. E. (1995). Gas diffusivity and production of CO2 in deep soils of the eastern Amazon. Tellus Ser. B Chem. Phys. Meteorol. 47, 550–565. doi: 10.3402/tellusb.v47i5.16071
Dere, A. L., Miller, A. W., Hemje, A. M., Parcher, S. K., Capalli, C. A., and Bettis, E. A. (2019). Solute fluxes through restored prairie and intensively managed critical zones in Nebraska and Iowa. Front. Earth Sci. 7, 1–15. doi: 10.3389/feart.2019.00024
Dugas, W. A., Heuer, M. L., and Mayeux, H. S. (1999). Carbon dioxide fluxes over bermudagrass, native prairie, and sorghum. Agric. For. Meteorol. 93, 121–139. doi: 10.1016/S0168-1923(98)00118-X
Fang, C., and Moncrieff, J. B. (2001). The dependence of soil CO2 eflux on temperature. Soil Biol. Biochem. 33, 155–165. doi: 10.1016/S0038-0717(00)00125-5
Fang, G., Yates, S. R., Yates, M. V., Jianying, G., and Ernst, F. F. (1996). Design, fabrication, and application of a dynamic chamber for measuring gas emissions from soil. Environ. Sci. Technol. 31, 148–153.
Frank, A. B., and Dugas, W. A. (2001). Carbon dioxide fluxes over a northern, semiarid, mixed-grass prairie. Agric. For. Meteorol. 108, 317–326. doi: 10.1016/S0168-1923(01)00238-6
Friedlingstein, P., O’Sullivan, M., Jones, M. W., Andrew, R. M., Hauck, J., Landschützer, P., et al. (2025). Global carbon budget 2024. Earth Syst. Sci. Data 17, 965–1039. doi: 10.5194/essd-17-965-2025
Gagnon, S., L’Hérault, E., Lemay, M., and Allard, M. (2016). New low-cost automated system of closed chambers to measure greenhouse gas emissions from the tundra. Agric. For. Meteorol. 228-229, 29–41. doi: 10.1016/j.agrformet.2016.06.012
Gao, F., and Yates, S. R. (1998). Laboratory study of closed and dynamic flux chambers: experimental results and implications for field application. J. Geophys. Res. Atmos. 103, 26115–26125. doi: 10.1029/98JD01346
Guo, L. B., and Gifford, R. M. (2002). Soil carbon stocks and land use change: a meta analysis. Glob. Chang. Biol. 8, 345–360. doi: 10.1046/j.1354-1013.2002.00486.x
Gyawali, A. J., Wiseman, M., Ackerson, J. P., Coffman, S., Meissner, K., and Morgan, C. L. S. (2025). Measuring in situ soil carbon stocks: a study using a novel handheld VisNIR probe. Geoderma 453:7152. doi: 10.1016/j.geoderma.2024.117152
Haszpra, L., Barcza, Z., Davis, K. J., and Tarczay, K. (2005). Long-term tall tower carbon dioxide flux monitoring over an area of mixed vegetation. Agric. For. Meteorol. 132, 58–77. doi: 10.1016/j.agrformet.2005.07.002
Heinemeyer, A., and McNamara, N. P. (2011). Comparing the closed static versus the closed dynamic chamber flux methodology: implications for soil respiration studies. Plant Soil 346, 145–151. doi: 10.1007/s11104-011-0804-0
Huang, X. F., Chaparro, J. M., Reardon, K. F., Zhang, R., Shen, Q., and Vivanco, J. M. (2014). Rhizosphere interactions: root exudates, microbes, and microbial communities1. Botany 92, 267–275. doi: 10.1139/cjb-2013-0225
Jansson, J. K., and Hofmockel, K. S. (2020). Soil microbiomes and climate change. Nat. Rev. Microbiol. 18, 35–46. doi: 10.1038/s41579
Li, C., Han, W., Peng, M., and Zhang, M. (2021). Abiotic and biotic factors contribute to CO2 exchange variation at the hourly scale in a semiarid maize cropland. Sci. Total Environ. 784:147170. doi: 10.1016/j.scitotenv.2021.147170
Lund, C. P., Riley, W. J., Pierce, L. L., and Field, C. B. (1999). The effects of chamber pressurization on soil-surface CO2 flux and the implications for NEE measurements under elevated CO2. Glob. Chang. Biol. 5, 269–281. doi: 10.1046/j.1365-2486.1999.00218.x
Makita, N., Kosugi, Y., Sakabe, A., Kanazawa, A., Ohkubo, S., and Tani, M. (2018). Seasonal and diurnal patterns of soil respiration in an evergreen coniferous forest: evidence from six years of observation with automatic chambers. PLoS One 13:e0192622. doi: 10.1371/journal.pone.0192622
Midwood, A. J., Thornton, B., and Millard, P. (2008). Measuring the 13 C content of soil-respired CO 2 using a novel open chamber system. Rapid Commun. Mass Spectrom. 22, 2073–2081. doi: 10.1002/rcm.3588
Mielnick, P. C., and Dugas, W. A. (2000). Soil CO 2 ¯ux in a tallgrass prairie. Soil Biol. Biochem. 32, 221–228. doi: 10.1016/S0038-0717(99)00150-9
Pedersen, A. R., Petersen, S. O., and Schelde, K. (2010). A comprehensive approach to soil-atmosphere trace-gas flux estimation with static chambers. Eur. J. Soil Sci. 61, 888–902. doi: 10.1111/j.1365-2389.2010.01291.x
Perez-Quezada, J. F., Meijide, A., and Leitner, S. (2023). Editorial: greenhouse gas measurements in underrepresented areas of the world. Front. Soil Sci. 3:1240930. doi: 10.3389/fsoil.2023.1240930
R Core Team. (2025). R: A language and environment for statistical computing (4.4.3). R foundation for statistical computing. Available online at: https://www.r-project.org/ (Accessed March 28, 2025).
Shi, Z., Allison, S. D., He, Y., Levine, P. A., Hoyt, A. M., Beem-Miller, J., et al. (2020). The age distribution of global soil carbon inferred from radiocarbon measurements. Nat. Geosci. 13, 555–559. doi: 10.1038/s41561-020-0596-z
Simeral, D., and Artusa, A. (2025). U.S. drought monitor. Western regional climate Center, NOAA/NWS/NCEP/CPC.
Suyker, A. E., and Verma, S. B. (2001). Year-round observations of the net ecosystem exchange of carbon dioxide in a native tallgrass prairie. Glob. Chang. Biol. 7, 279–289. doi: 10.1046/j.1365-2486.2001.00407.x
Tang, J., Baldocchi, D. D., and Xu, L. (2005). Tree photosynthesis modulates soil respiration on a diurnal time scale. Glob. Chang. Biol. 11, 1298–1304. doi: 10.1111/j.1365-2486.2005.00978.x
Wagner, S. W., Reicosky, D. C., and Alessi, R. S. (1997). Regression models for calculating gas fluxes measured with a closed chamber. Agron. J. 89, 279–284. doi: 10.2134/agronj1997.00021962008900020021x
Wang, M., Guan, D. X., Han, S. J., and Wu, J. L. (2010). Comparison of eddy covariance and chamber-based methods for measuring CO2 flux in a temperate mixed forest. Tree Physiol. 30, 149–163. doi: 10.1093/treephys/tpp098
Wang, T., Zhang, Y., Yue, C., Wang, Y., Wang, X., Lyu, G., et al. (2024). Progress and challenges in remotely sensed terrestrial carbon fluxes. Geo-spat. Inf. Sci. 28, 1–21. doi: 10.1080/10095020.2024.2336599
Winnick, M. J., Lawrence, C. R., McCormick, M., Druhan, J. L., and Maher, K. (2020). Soil respiration response to rainfall modulated by plant phenology in a montane meadow, East River, Colorado, USA. J. Geophys. Res. Biogeosci. 125:e2020JG005924. doi: 10.1029/2020JG005924
Keywords: soil, carbon, soil fluxes, agricultura, prairie
Citation: Saccardi BE, Dere AL, Goodwell AE, Druhan J, Welp LR, Blair NE, Bauer E, Haken J, Jimenez-Castaneda ME, Filley T, Frantal I and Kumar P (2025) A low-power, low-cost, chamber-based CO2 sensor. Front. Water. 7:1638540. doi: 10.3389/frwa.2025.1638540
Edited by:
Bhavna Arora, Berkeley Lab (DOE), United StatesReviewed by:
Paolo Madonia, National Institute of Geophysics and Volcanology (INGV), ItalyKevin Bundy, University of California, Santa Cruz, United States
Copyright © 2025 Saccardi, Dere, Goodwell, Druhan, Welp, Blair, Bauer, Haken, Jimenez-Castaneda, Filley, Frantal and Kumar. This is an open-access article distributed under the terms of the Creative Commons Attribution License (CC BY). The use, distribution or reproduction in other forums is permitted, provided the original author(s) and the copyright owner(s) are credited and that the original publication in this journal is cited, in accordance with accepted academic practice. No use, distribution or reproduction is permitted which does not comply with these terms.
*Correspondence: Brian E. Saccardi, c2FjY2FyZGlAaWxsaW5vaXMuZWR1