 Brian E. Saccardi1*
 Ashlee L. Dere2
 Allison E. Goodwell1
 Jennifer Druhan3
 Lisa R. Welp4
 Neal E. Blair5Erin Bauer6
 James Haken6
 Martha E. Jimenez-Castaneda7
 Timothy Filley7
 Praveen Kumar1,8
- 1Prairie Research Institute, University of Illinois at Urbana-Champaign, Champaign, IL, United States
- 2Department of Geography/Geology, University of Nebraska Omaha, Omaha, NE, United States
- 3Department of Earth Science and Environmental Change, University of Illinois at Urbana-Champaign, Champaign, IL, United States
- 4Department of Earth, Atmospheric, and Planetary Sciences, Purdue University, West Lafayette, IN, United States
- 5Department of Earth, Environmental, and Planetary Sciences, Northwestern University, Evanston, IL, United States
- 6Illinois State Water Survey, University of Illinois at Urbana-Champaign, Champaign, IL, United States
- 7Department of Geography and Environmental Sustainability, University of Oklahoma, Norman, OK, United States
- 8Civil and Environmental Engineering, University of Illinois at Urbana-Champaign, Champaign, IL, United States
Soil carbon is the largest active terrestrial reservoir in the carbon cycle, and potential feedbacks involving soil carbon play an important role in future climate change. Understanding how combinations of factors, such as vegetation, temperature, and soil moisture, affect soil carbon dioxide (CO2) production in various environments across sub-daily to seasonal timescales is essential to accurately predict climate impacts on the carbon cycle. Here we present a quantitative accounting of factors governing CO2 production in agricultural and prairie soils, using high-resolution monitoring of below-ground soil CO2 concentrations and estimates of soil respiration fluxes. We compare Soil CO2 with Normalized Difference Vegetation Index (NDVI), soil temperature, radiation, and volumetric moisture content using correlations and regressions at a variety of sampling frequencies. We find that NDVI tends to predict soil CO2 concentration and production more effectively than soil temperature at daily timescales. At the time scale of a rain event, rain frequently leads to rapid drops in CO2 concentration due to soil CO2 abiotically equilibrating with rain water followed by prolonged increases in inferred CO2 production. This pattern was only visible due to the high resolution of the soil CO2 concentration data. We also found that prairie soils, which host a greater diversity of plant species, have a higher rate of CO2 production than agricultural soils under comparable climate drivers. Finally, we examine how the temporal resolution of soil CO2 data affects the magnitude of environmental correlations. These findings highlight that seasonal environmental and vegetation conditions strongly influence local soil CO2 responses.
Introduction
Soils are the largest active terrestrial pool of carbon (C), containing an estimated 2,500–3,300 Pg total C globally, roughly five times the amount stored in the atmosphere (Brevik, 2012; Cavallaro et al., 2018). Much of this soil C is in the form of organic matter with mean residence times that range from days to thousands of years (mean organic matter age in the upper 1 m is 4,830 ± 1,730 yr) (Davidson et al., 2006; Shi et al., 2020). However, these residence times are expected to shorten as the climate warms (Chen et al., 2013). The range in residence times of soil organic carbon primarily depends on the rate of in-situ production and burial of organic matter and soil respiration rates. Currently, it is estimated that soils emit 54–95 Pg C/yr (Hashimoto, 2012) into the atmosphere; for comparison, the net terrestrial sink removes 0.5–3.9 Pg C/yr., or roughly 30% of anthropogenic emissions (Schimel et al., 2001; Luo et al., 2003; Friedlingstein et al., 2022, 2025). Therefore, soils have the potential to mitigate anthropogenic C emissions or act as a source of C to the atmosphere. In this study, we focus on how CO2 is produced within soil profiles in agricultural and prairie landscapes based on in-situ observations.
Soil carbon is produced from plant organic matter (Cotrufo et al., 2019) and lost through respiration and erosion (Brevik, 2012). While erosion removes organic carbon from its initial location through the movement of wind or water, these processes do not directly convert that carbon back to CO2. The respiration of organic carbon produces CO2 that may be lost to the atmosphere either directly or through lateral transport in inland waters (Cole et al., 2007; Saccardi and Winnick, 2021). This respiration is from either microbial metabolism or released directly as CO2 from plant roots. While microbial respiration is frequently identified as the primary driver of soil CO2 production (Jansson and Hofmockel, 2020; Adekanmbi et al., 2022), plants contribute to soil respiration both directly through root respiration and indirectly through the release of organic molecule exudates which are respired by microbes (Keiluweit et al., 2015). Soil CO2 production from a combination of root respiration and respiration due to exudates (plant-mediated microbial respiration) has been found to contribute up to a quarter of soil respiration in agriculture and prairie lands (Nichols et al., 2016). Meanwhile, other studies have found that direct root respiration accounts for 11–62% and microbial respiration, including the respiration of exudates, for the other 38–89% of the total soil respiration (Kuzyakov and Larionova, 2006). Regardless of the source of soil CO2, the sensitivity of soil respiration to environmental conditions is of primary concern when looking to understand feedbacks that may arise from climate and land use change.
Soil incubation experiments are commonly used to determine how temperature, moisture, or other environmental variables affect microbial respiration (Sponseller, 2007; Adekanmbi et al., 2022). These studies often find strong correlations between temperature, volumetric water content (VWC), or nutrients and soil organic matter to CO2 production, which allow the formulation of mathematical models as a function of these factors (Fang and Moncrieff, 2001; Jian et al., 2020). Incubation-based models have successfully represented global patterns of soil carbon stocks driven by temperature relationships (Jian et al., 2020). An alternative approach is the chamber-based measurement, which directly measures CO2 fluxes at the surface from field studies (Heinemeyer and McNamara, 2011). Chamber-based measurements have been used to show that soil respiration increases with rising temperatures (Bond-Lamberty and Thomson, 2010). However, there is still debate as to whether these same relationships can be used to predict future changes in soil CO2 production and, therefore, changes in carbon stocks (Conant et al., 2011; Shi et al., 2018; Tao et al., 2023; Xianjin et al., 2024). Particularly, there are many factors other than temperature that may result in emergent behaviors not seen in lab incubation or field chamber studies (Wang et al., 2025). For example, many factors influence CO2 concentration, including the rate of soil respiration, the diffusion of CO2 to the atmosphere, and the dissolution and evasion of CO2 between the soil, water, and air (Oh et al., 2005; Gallagher and Breecker, 2020). The rate of diffusion depends on several factors including the CO2 gradient between the soil and atmosphere as well as the air-filled porosity, and the water filled porosity. Diffusivity in air is four orders of magnitude faster than in water (Unver and Himmelblau, 1964; Ellis and Holsen, 1969). The CO2 gradient between the soil gas and the atmosphere or soil water drives which direction CO2 will diffuse. These gradients change through time as CO2 production increases or with changing soil conditions allowing the soil water to act as a source or sink depending on pH and temperature. Furthermore, soil conditions can cause buildup of CO2 in deeper layers due to diffusive barriers. These barriers include changes to the volumetric water content (VWC) which represent a change in the proportion of air and water filled pore space and therefore the rate of diffusion. Due to these factors, observed VWC is often used in diffusion models to predict variable rates of diffusion (Campbell, 1985; Steefel et al., 2015; Winnick et al., 2020). The soil respiration rate plays a major role in observed concentrations, as soil pCO2 results from the balance of inputs and losses.
Many other factors alter the rate of respiration and patterns of soil CO2, including soil carbon protection mechanisms, carbon inputs, mineral weathering, and advection or diffusion processes (DeForest et al., 2006; Vyn et al., 2013; Liu et al., 2019; Gallagher and Breecker, 2020; Winnick et al., 2020; Roque-Malo et al., 2022). The multitude of processes that alter soil CO2 production and subsequent interactions likely leads to emergent behaviors that are not easily predicted by lab incubation experiments. Some studies have sought to determine the role of plants, temperature, and moisture on soil carbon stability based on long-term soil warming and CO2 enrichment experiments. These warming experiments have been conducted across many environments and in prairies have found that temperature effects can increase the C/N ratio of the organic carbon in soils (Xu et al., 2012; Li X. et al., 2023). Studies focused on agricultural practices and forests found that greater organic carbon inputs from plants increased soil respiration (Vyn et al., 2013; Li et al., 2022). Furthermore, abiotic factors such as calcite dissolution and precipitation can cause rapid and often large under or overestimates in soil CO2 production as carbon is stored and then rereleased during wetting and drying events; often these times are missed in sampling or not represented in models (Gallagher and Breecker, 2020).
Despite these findings, there is still much that is unknown about how soil carbon responds to our changing environment, including how compounding factors such as drought or intensive land management alter soil carbon respiration. This is particularly important as intensively managed landscapes increased rapidly from the mid-1800s to the mid-1900s replacing as much as 80% of the native grasslands in Illinois (Li N. et al., 2023) and at least 40% nationally (Lark, 2020) making prairie lands one of the most endangered ecosystems. Furthermore, conversion to agricultural land was often accompanied by a drop in soil organic carbon stocks compared with prairie lands, losing 12.8 Mg C ha−1 between 1845 and 2012 (Li N. et al., 2023). With the prevalence of land use change and its apparent alterations to the carbon cycle it is important that we understand which processes alter fluxes within these environments.
In-situ soil CO2 monitoring has been employed to understand the production of CO2 across a variety of environmental conditions; however, many of these experiments rely on infrequent sampling, missing event scale responses, and day-night patterns (Hirano et al., 2003; Tang et al., 2003; Cueva et al., 2017; Jian et al., 2018; Winnick et al., 2020; Zhu et al., 2020; Anjileli et al., 2021; Bond-Lamberty et al., 2024). The omission of short (hourly) time scales leads to uncertainty within our current understanding of soil CO2 production and the factors that play essential roles at seasonal, daily, and event scales. In this study, we use an in-situ measurement technique within agricultural and prairie soils at four sites in the Midwest USA. We consider high-frequency temporal changes in CO2 concentration and production to address the following questions: Does the knowledge of vegetation state enhance the relationship between CO2 and other drivers? Do agricultural or prairie systems have higher CO2 production rates? To address these, we first detect correlations between potential autotrophic drivers of respiration to the seasonal and daily patterns of soil CO2 concentration and production. Next, we investigate how rain events influence soil CO2 at hourly timescales, and compare how the aforementioned factors differ between agriculture and restored prairie environments.
Methods
Site description
The four sites were chosen to represent a mixture of land use and geologic history, with Illinois and Nebraska each having paired agricultural and restored prairie sites on similar soils. These sites are part of the Critical Interface Network (CINet), which examines the role of hydrological, biological, ecological, geological, and chemical processes within the critical zone of these intensively managed landscapes (Kumar et al., 2023). The Illinois sites (Illinois, USA) are both located in the Upper Sangamon River Basin (Figure 1), and include ILAG (Illinois Agriculture), which is an active farm with an annual crop rotation of corn and soybean, and ILPR (Illinois prairie), which is a tallgrass prairie that was restored in 2007. The Illinois soils have a similar average bulk density of 1.47 ± 0.20 g cm−3 in agricultural (ILAG) and 1.47 ± 0.22 g cm−3 in prairie (ILPR). However, the ILAG soils have a higher average bulk density near the surface at 1.31 ± 0.10 gm cm−3 in the 0–20 cm layer, compared to the ILPR at 1.14 ± 0.20 gm cm−3 in the 0–20 cm layer. ILAG is less dense at depth with a bulk density of 1.44 ± 0.05 gm cm−3 in the 60–110 cm layer. In contrast, ILPR soils have an average bulk density of 1.65 ± 0.00 gm cm−3 in the 60–110 cm layer. The ILAG soil is Sable silty clay loam whereas the ILPR soil is Elliott silty clay loam (USDA) and parent material is loess over glacial till. The average annual air temperature between 1995 and 2023 was 11.5 °C, and the sites receive an average of 101.9 cm yr.−1 of precipitation and are not irrigated (MRCC, 2024). However, 2022 and 2023 were both drought years, receiving only 88.8 and 84.0 cm yr.−1, respectively (NDMC, 2024; USDA, n.d.; NOAA, n.d.). Both the IL sites have slopes less than 0.03 m m−1, and the landscape is generally uniform in this regard (OpenStreetMap Contributors, 2023). Both ILPR site is 365 m from the Sangamon River, whereas the ILAG site is tile drained at 1 m to the adjacent drainage ditch (QGIS, 2023).
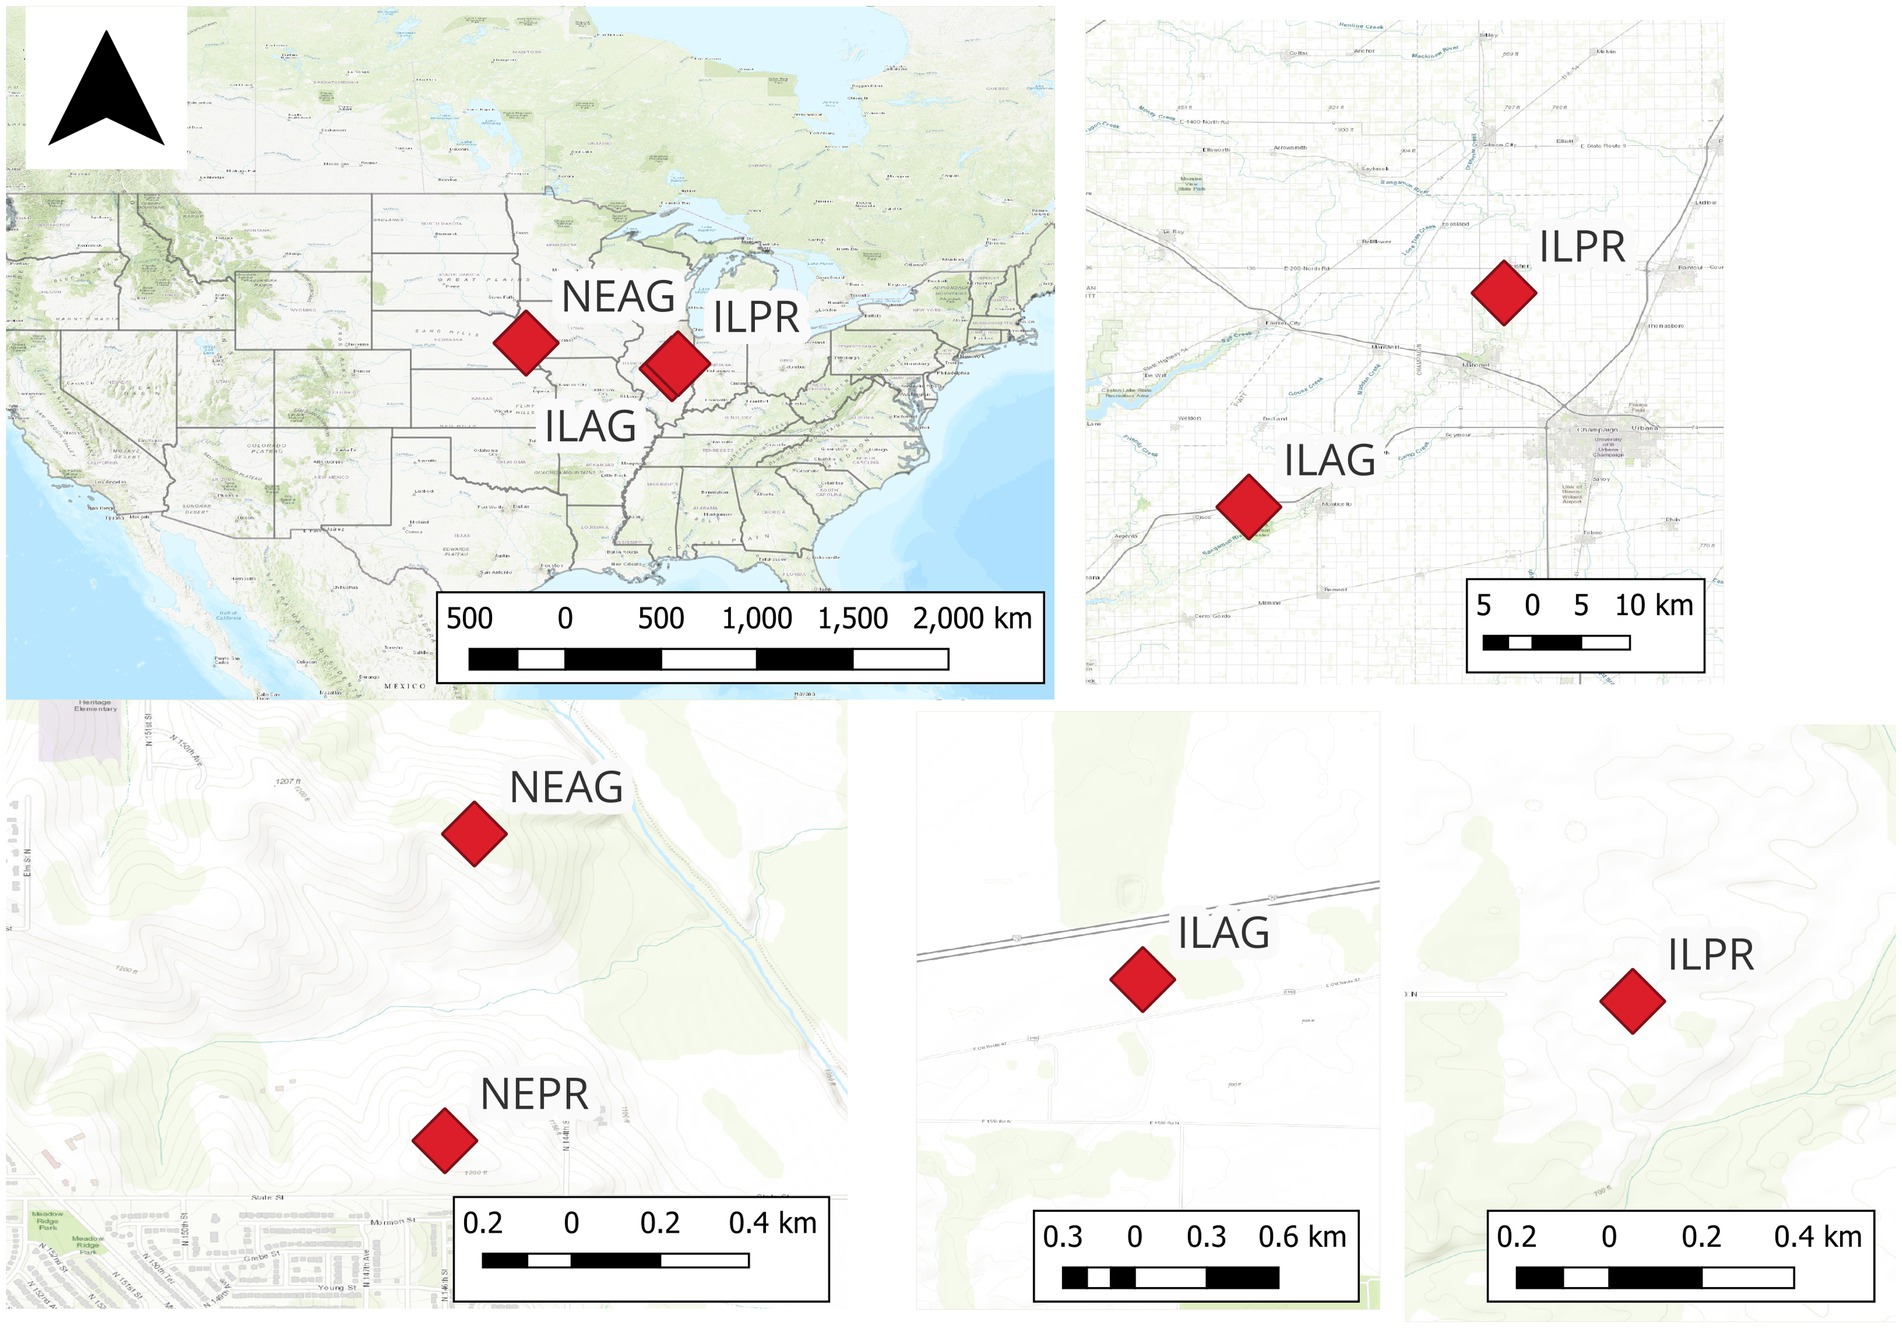
Figure 1. The management induced rooting zone (MIRZ) sites which include an agricultural (AG) and prairie (PR) sites in Illinois (IL) and two sites in Nebraska (NE).
The Nebraska sites (Nebraska, USA) are both within the Glacier Creek Preserve (Figure 1), a 4 km2 watershed with a mix of restored prairie and agricultural fields. The research stations are at the top of adjacent knolls, and both drain to Glacier Creek, which has a median discharge of < 0.01 m3 sec−1. The slopes of the NE sites are similar on top of the knolls (< 0.05 m m−1), reaching a max slope of 15% on the hillslope between the sites and the creek (Dere et al., 2019). The soils are Contrary-Monona-Ida Complex (Ryan et al., 2018), and more specifically, the agricultural soils are Contrary silt loam, and the prairie soils are Monona silt loam. The parent material of the soils is loess, and the Ag soils have a bulk density of 1.11 ± 0.09 g cm−3 versus 1.14 ± 0.05 g cm−3 of the prairie soils with both sites having denser soils closer to the surface. The sites receive 78 cm yr.−1 of precipitation with an average annual temperature of 10 °C (Dere et al., 2019). The NEPR (Nebraska prairie) site was restored in 1970 after a century of agriculture and is maintained with periodic (3-year) burns, (Dere et al., 2019) with the last burn in 2024. NEAG (Nebraska Agriculture) has been in annual corn-soybean rotation for the duration of the study and is not tile drained nor irrigated, and has a relatively deep water Table (20 m). ILAG and NEAG were both planted with corn in 2022 and soy in 2023.
Sensors and monitoring
Monitoring was conducted with a sensor array installed within the soil profiles measuring hourly soil gases, volumetric water content (VWC), and temperature. Supporting atmospheric sensor data were collected at 1 min to hourly time intervals. In addition to the sensors, manual sampling was conducted on a two-week basis for both soil and atmospheric data. The installation was completed by May 2022 at all sites, with additional atmospheric data available from previous research initiatives. The data used in this work is from May 2022 through Sep 2023 for ILAG, Aug 2021 to Sep 2023 for ILPR, (soil gases operational May 2022), and Jan 2022 to Nov 2023 for NEPR and NEAG (VWC operational May 2022, soil gases operational Sep 2022).
To minimize soil disturbance, the sensor arrays were installed into intact soil at depths of 20, 60, 110, and 180 cm. Soil pits approximately two meters deep, three meters long, and 1 m wide, were excavated using a backhoe or by hand (NEPR), allowing for horizontal installation of sensors into the pit wall at the desired depths. Using a hand auger, holes were cut into the side of the profile at an 45o angle allowing PVC pipes to be inserted so the sensors were stacked vertically as seen in the diagram presented in Figure 2. Additionally, paired temperature and moisture sensors were directly inserted into the soil pit wall at each depth and the cables were sleeved with a protective flexible conduit. Finally, gas wells were installed horizontally into the soil pit wall to allow for manual sampling of gases for laboratory measurements of concentrations and stable isotope values (Frantal, 2024) using methods modified from Brecheisen et al. (2019). However, data from these manual samplings are not included in this study. After installation of all sensors was completed, the soil pit was backfilled replacing the removed soil from each depth in the original positions. This method of installing soil sensor arrays, while intensive in its initial construction, offers substantial benefits, including the ability to easily remove sensors installed in the PVC pipes for calibration, maintenance, and replacement which allows for shorter data gaps and reduced maintenance costs. A detailed installation guide, parts list, and data logger code is available in Supplementary materials.
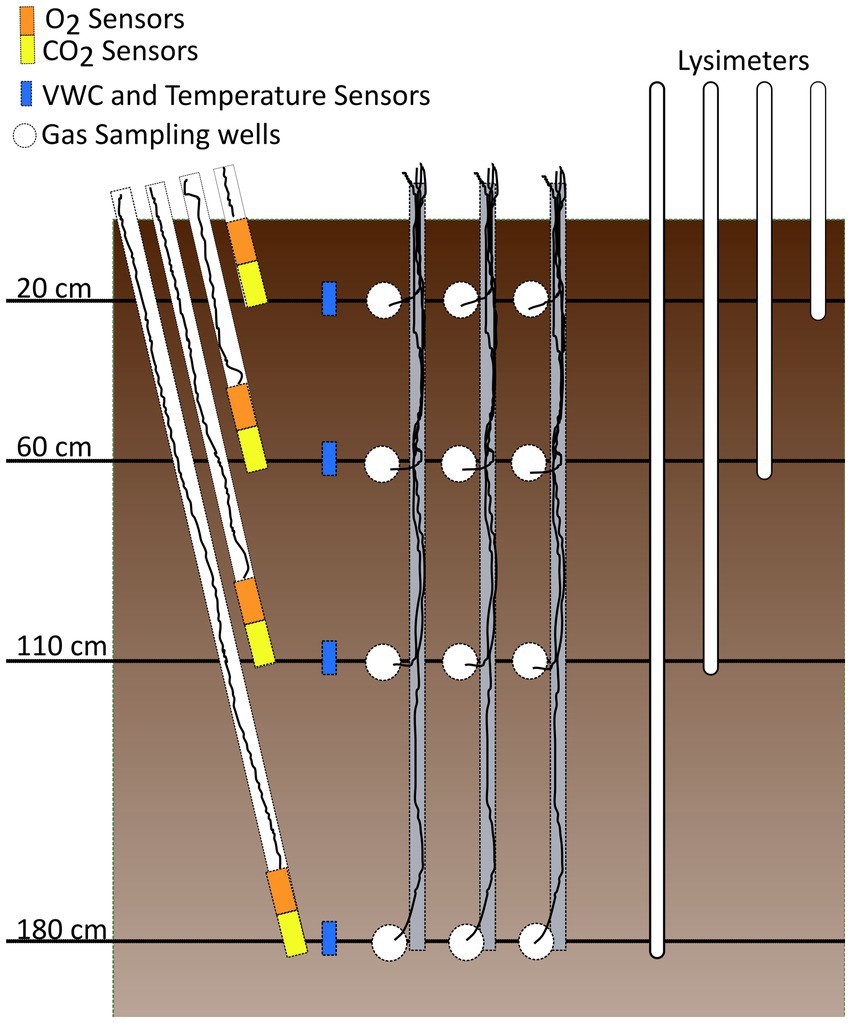
Figure 2. Illustration of soil sensor layout. O2, CO2, and soil moisture/temperature sensors are labeled as well as the gas wells for manual gas sampling and porewater lysimeters which were installed in a similar fashion at all sites.
Each depth hosts a CO2, O2, and volumetric water content (VWC) and temperature sensor, and each sensor has a built-in temperature probe for parameter corrections. The continuous CO2 measurements were taken with an Eosence eosGP sensor with a measurement range of 0–20% and an accuracy of 3.5%. CO2 data with known sensor errors were removed manually if a problem in the field was noted such as damage to equipment. Some data display characteristics of a sensor construction design flaw which resulted in rapid drops of the measured CO2 values primarily during the first winter (2022), and these data were removed from the 180 cm data at NEAG and NEPR using an automated detection method. Specifically, we removed points that showed an average hourly drop of greater than 67 ppm hr.−1 in NEAG and 450 ppm hr.−1 in NEPR over a 12 h period. The oxygen sensors are Apogee SO-110 with a range of 0–100% and accuracy of better than 1%. Both the O2 and CO2 sensors were inserted into an airtight 63 mm OD PVC pipe perforated at the depth of measurement with the CO2 sensor on the bottom and the O2 sensor on top. Campbell Scientific CS655 VWC/temperature sensors were installed directly into the side of the soil pit to record both VWC and soil temperature. The VWC was corrected for temperature based on the manufacturers default equation. Atmospheric sensors were installed next to the soil pit and included a Campbell Scientific EE181-L air temperature sensor, Campbell Scientific 03002-L wind speed and direction sensors, and Campbell Scientific TE525WS precipitation sensor. The observed atmospheric temperatures at the weather stations had values outside of the regional recorded range and were scaled to the maximum and minimum temperatures recorded over the measurement years for the local county using National Weather Service data (National Weather Service, n.d.). Additionally, the Nebraska sites had Campbell Scientific SP230 solar radiation sensors, which measure 360 to 1,120 nm wavelengths, whereas the solar radiation monitoring for the Illinois sites used a Kipp and Zonen CNR4 Pyranometer shortwave radiation sensor (300–2,800 nm) at the Goose Creek Eddy Covariance Flux Tower, located 16.3 and 23.5 km from ILAG and ILPR, respectively, (Hernandez Rodriguez et al., 2023).
NDVI
The Normalized Difference Vegetation Index (NDVI) was calculated using Planet Lab data (Planet Team, 2022). The planet lab images have a 3 day return period with occasional gaps due to cloud cover. To quantify NDVI an area adjacent to the sensor array, but not including the sensor array, was chosen to represent the field conditions. The image date, location, and NDVI interpolated to a 1 day resolution were then exported and used to interpolate NDVI at a 1 h timescale.
Soil CO2 production model
We used a previously published model (Cerling, 1984; Winnick et al., 2020) to simulate the 1-D production of CO2 within each soil profile (Equation 1). This model is based on Fick’s second law of diffusion and has been used in many past studies (Davidson and Trumbore, 1995; Tang et al., 2005; Davidson et al., 2006; Winnick et al., 2020). The model equation is
where C is the observed concentration of CO2 (mol cm−3), t is time (s), D* is effective diffusivity (cm2 s−1), z is depth (cm), and P is net CO2 production (mol cm−3 s−1) (Table 1). This temporally-transient equation was solved using a first-order centered difference approximation at a 1 h timestep for the 20 cm, 60 cm, and 110 cm depths (Supplemental information). Effective diffusivity was estimated as a linear function (Equation 2) of volumetric water content (VWC, cm3 water cm−3 dry soil) and dry soil diffusivity or D (cm2 s−1) (Campbell, 1985; Steefel et al., 2015; Winnick et al., 2020) as follows:
where VWCo (cm3 cm−3) is the residual soil water content, which was assumed to be the minimum value observed across all soil depths at a site. The VWC (cm3 cm−3) at saturation or porosity (VWCsat, cm3 cm−3) was assumed to be the maximum VWC at each site across all soil depths. T is the soil temperature in degrees Kelvin (K) and 283 is a reference temperature (Winnick et al., 2020). Dry soil diffusivity D (cm2 s−1) was calculated from soil physical properties using the following Equation 3 (Davidson et al., 2006).
where DCO2 is the diffusion coefficient of CO2 in air at STP (0.162 cm2 s−1), and is the total soil porosity (cm3 cm−3). Total soil porosity was calculated from (Equation 4) bulk density (BD, g cm−3) and weighted average particle density (PD, 2.61 g cm−3) using the following equation (Davidson et al., 2006).
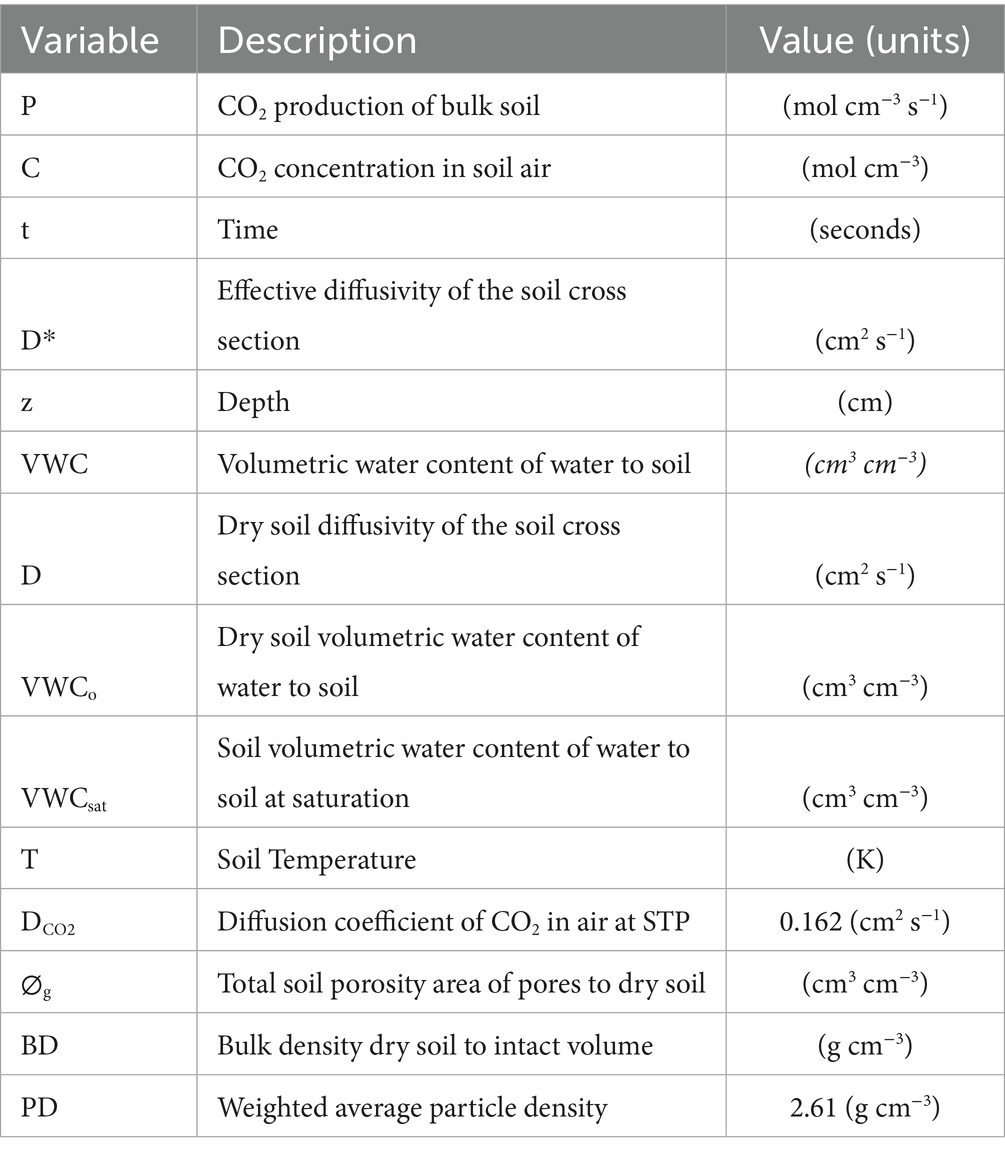
Table 1. Parameters, variables and units used to estimate CO2 production from concentration.
The bulk density was measured at all sampling depths (20, 60, 110, and 180 cm) using the core method. The core volume was 98.17 cm−3 across all sites; however, replicates at ILAG were made with an additional core volume of 242.63 cm−3. A bulk density measured at each depth was used in the model.
Statistical methods
Each site was characterized using summary statistics such as the mean ± 2 standard deviations of CO2 and CO2 production. To determine when and if factors such as temperature, VWC, solar radiation, and plant cover, covary with CO2 concentrations or production, we calculated Pearson’s correlations between these variables for each soil depth over a range of timescales and data resolutions (Pearson, 1920). Specifically, CO2 production and concentration were tested for correlations with temperature, solar radiation, and VWC at hourly, mean daily, and mean monthly scales for each soil depth across the entire data set and by season. The concentration and production of CO2 were also tested for correlations with daily NDVI, both seasonally and across the data record, as hourly data was unavailable. For correlations with CO2 concentration, the logarithm of CO2 (log10 CO2) was used as CO2 data is often right skewed. Additionally, as the environmental variables are interrelated, we tested for correlations between temperature, VWC, solar radiation, and NDVI. Furthermore, multiple linear regressions between CO2 and NDVI, temperature, and VWC were applied to determine how interactions between parameters affected CO2 responses. We used t-tests to determine statistical significance (95% confidence) (Student, 1908). Beyond correlations, we also studied instances of hysteresis between soil CO2 and soil VWC observed over wetting events to determine the effects of storms on soil CO2. These individual events were analyzed in conjunction with summary statistics and antecedent conditions to infer how the system reacted to wetting in different seasonal conditions. The data analysis was conducted in R statistical language version 4.4.3 (R Core Team, 2025).
Results
Soil CO₂ dynamics: seasonal patterns, depth gradients, and environmental controls
The CO2 concentration was generally highest at deeper depths, 110 cm or 180 cm, across all sites, with CO2 at 180 cm often falling just below the peak at 110 cm during mid to late summer. These peaks reached 59,551 ppm, 44,825 ppm, 25,201 ppm, and 33,492 ppm in ILAG, ILPR, NEAG, and NEPR, respectively, (Figure 3). The minimum recorded values at each site were 255 ppm, 452 ppm, 374 ppm, and 113 ppm in ILAG, ILPR, NEAG, and NEPR, respectively, all of which were at 20 cm. Conversely the largest seasonal variability of CO2 ppm was at the 110 cm depth. The mean CO2 concentration at 20 cm was 5,485 ± 12,270 ppm at ILAG, 3946 ± 5,074 ppm at ILPR, 2936 ± 5,734 ppm at NEAG, and 2,453 ± 6,324 ppm at NEPR. Despite having higher concentrations at the 20 cm depth in agricultural soils, CO2 production has the opposite pattern. The mean CO2 production at 20 cm at each site was 0.93 ± 5.06 g CO2 m−3 h−1 in ILAG, 1.99 ± 4.01 g CO2 m−3 h−1 in ILPR, 0.44 ± 2.67 g CO2 m−3 h−1 in NEAG, and 0.58 ± 3.18 g CO2 m−3 h−1 in NEPR (mean ± 2x standard deviation). Therefore, although ILPR soils are producing more CO2 at 20 cm then ILAG, the rate of evasion must be higher at ILPR to account for the lower concentrations observed at the ILPR sites.
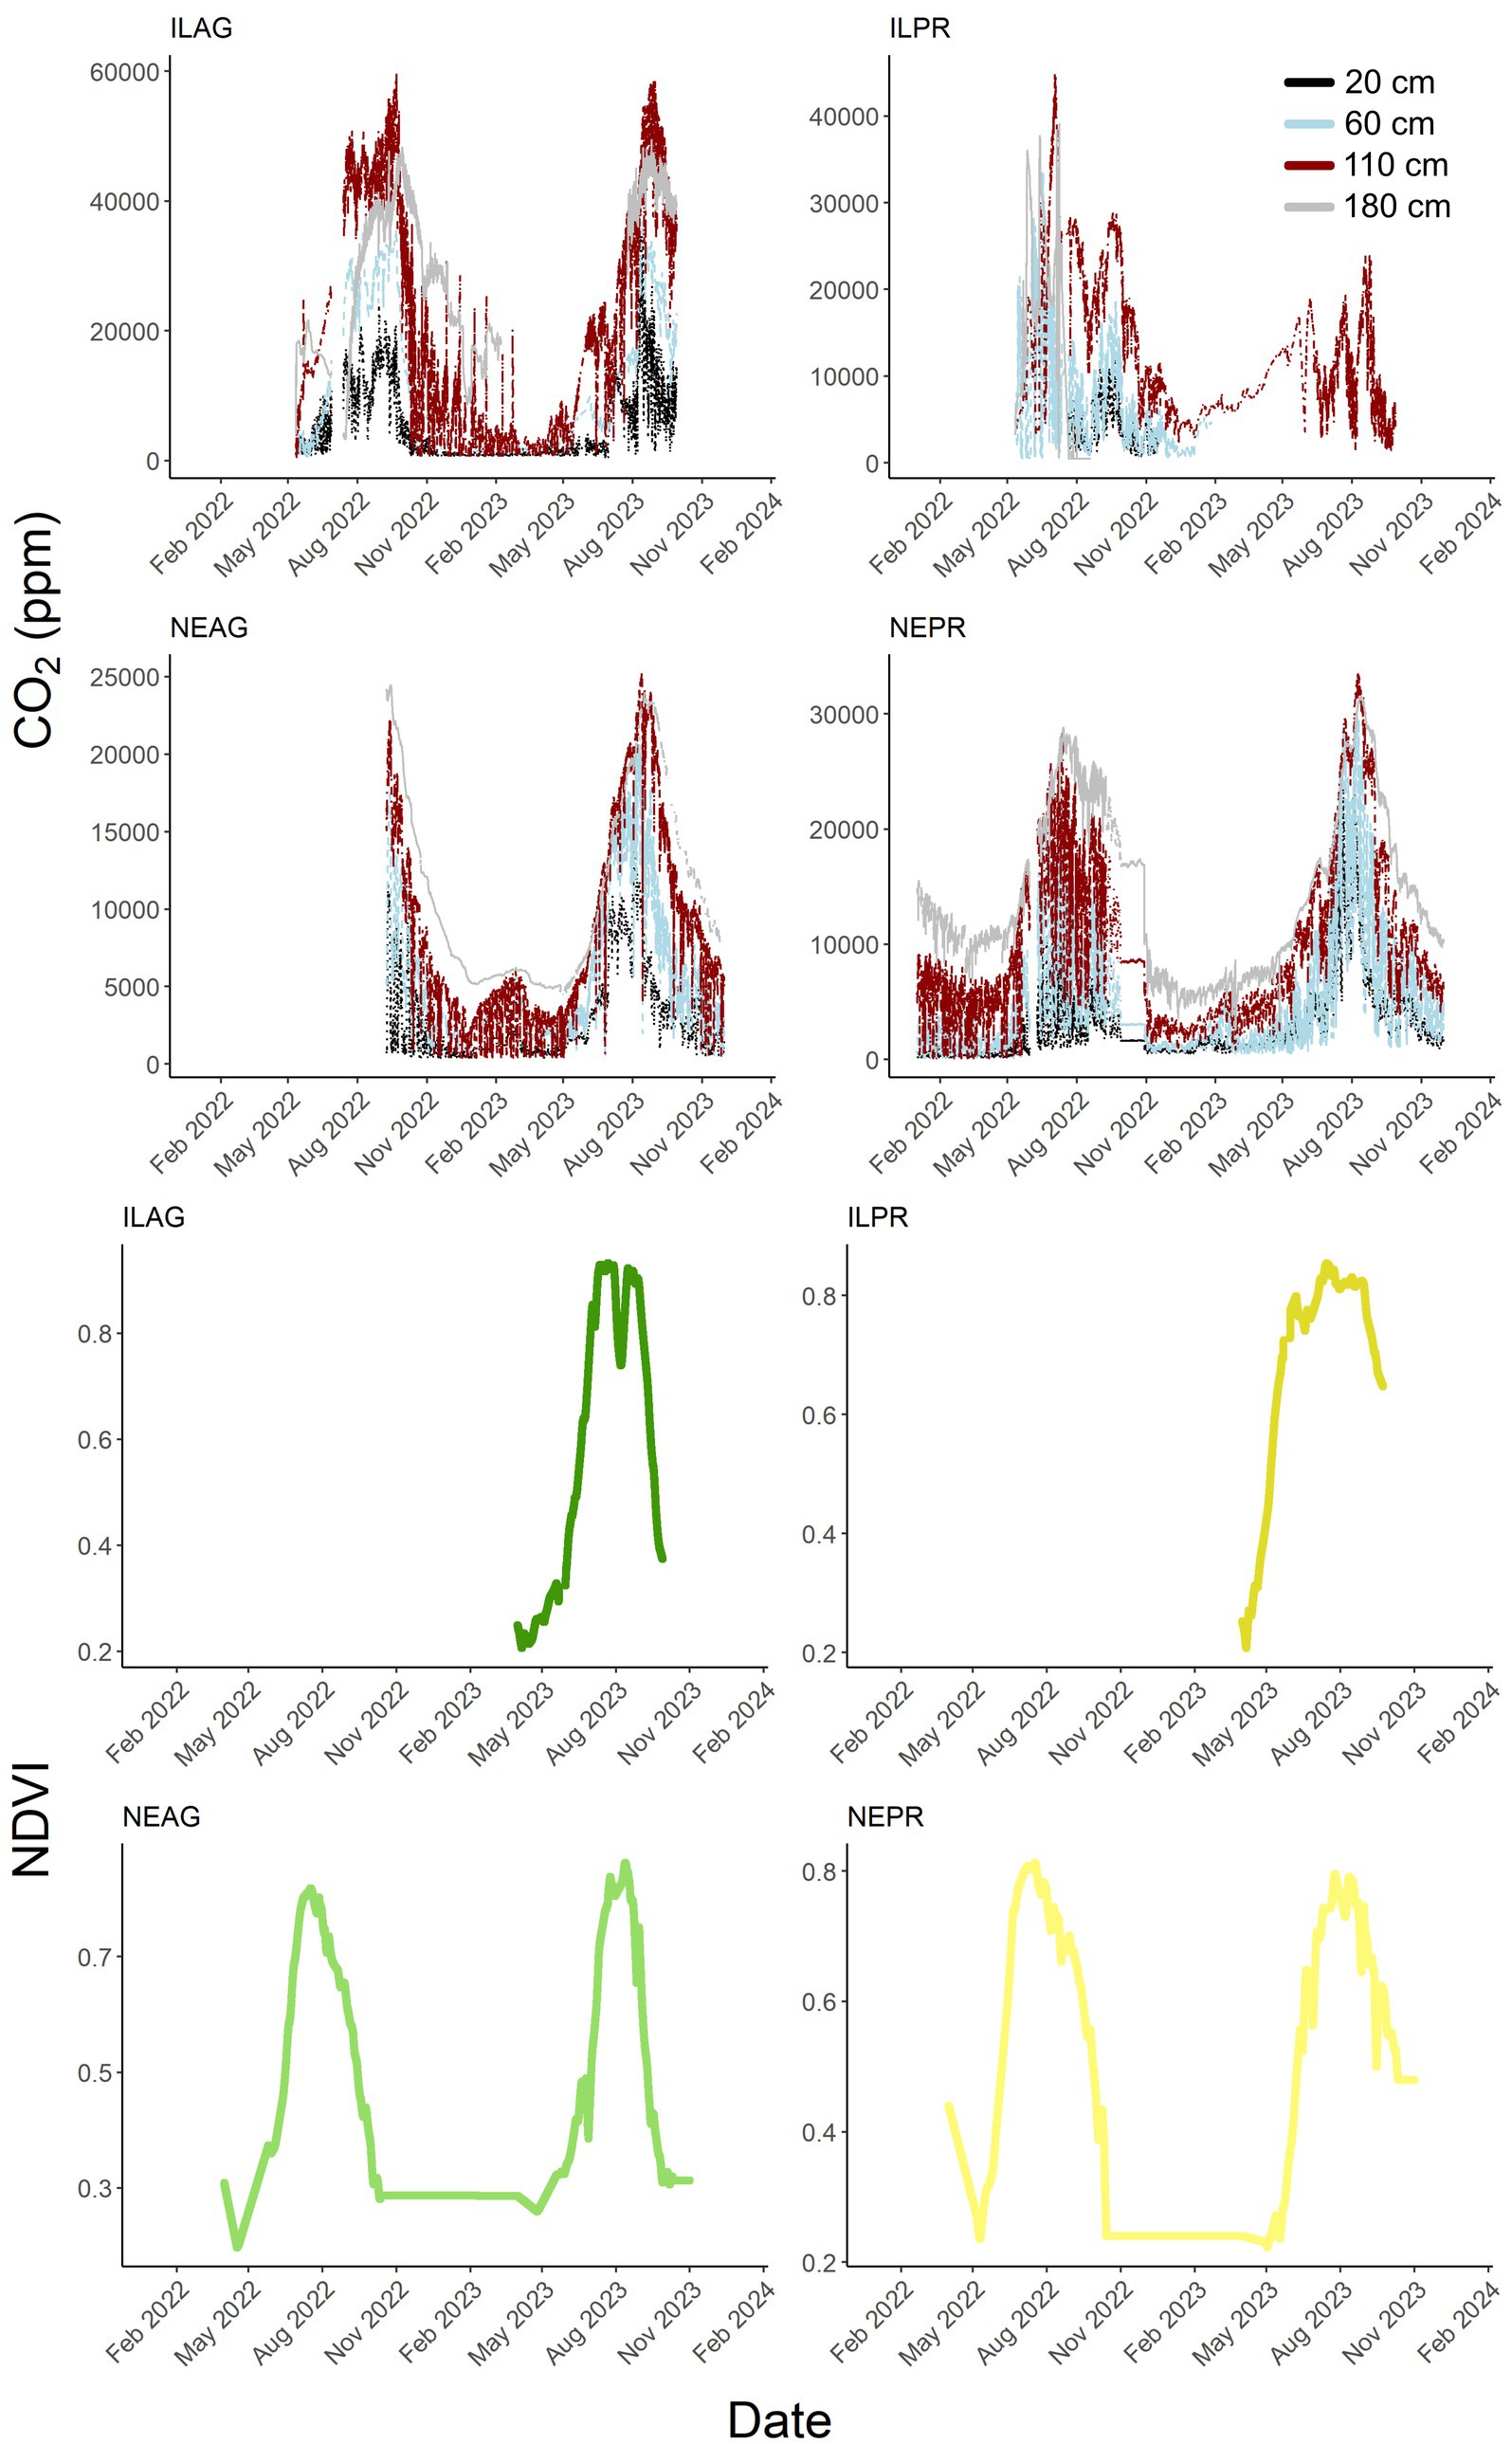
Figure 3. Hourly CO2 concentrations in ppm at 20, 60, 110, and 180 cm through the study period for each of the four sites. Black, blue, red, and gray are from shallowest to deepest depth. Planet Lab NDVI for each site is shown in bottom panels with green representing agricultural sites and yellow prairie sites.
NDVI peaked in June through August in NE and IL with both site-pairs showing higher peaks in the agricultural sites in 2023 and prairie sites in 2022. NDVI peaks reached 0.86 in NEAG, 0.81 in NEPR, 0.93 in ILAG and 0.85 in ILPR. The Planet Lab NDVI data correlated significantly to both air temperature (ILAG R = 0.39, ILPR R = 0.52, NEAG R = 0.59, and NEPR R = 0.68) and solar radiation (ILAG R = 0.13, ILPR R = not significant, NEAG R = 0.15, and NEPR R = 0.17). Overall, NDVI shows a consistent seasonal pattern varying between 0.20 in winter and 0.93 in summer with sharp seasonal changes in spring and fall.
The summer months had the largest daily fluctuations in CO2 concentrations. The amplitude of the diurnal cycles seen in the CO2 concentrations were up to 25,000 ppm at 20 cm and persisted to depths of 180 cm across all sites. When comparing the daily cycle of CO2 to that of solar radiation we used minimum pCO2 per day. This was done as the maximum daily CO2 values are generally at night causing a bias to midnight if there was an increasing or decreasing trend in the data. Most solar radiation peaks were within 2 h of the minimum daily CO2 concentration at 20 cm across the sites in summer months, with a minimum CO2 concentration between 11:00 and 13:00, whereas solar radiation maximums were later at 12:00 to 13:00 (Figure 4).
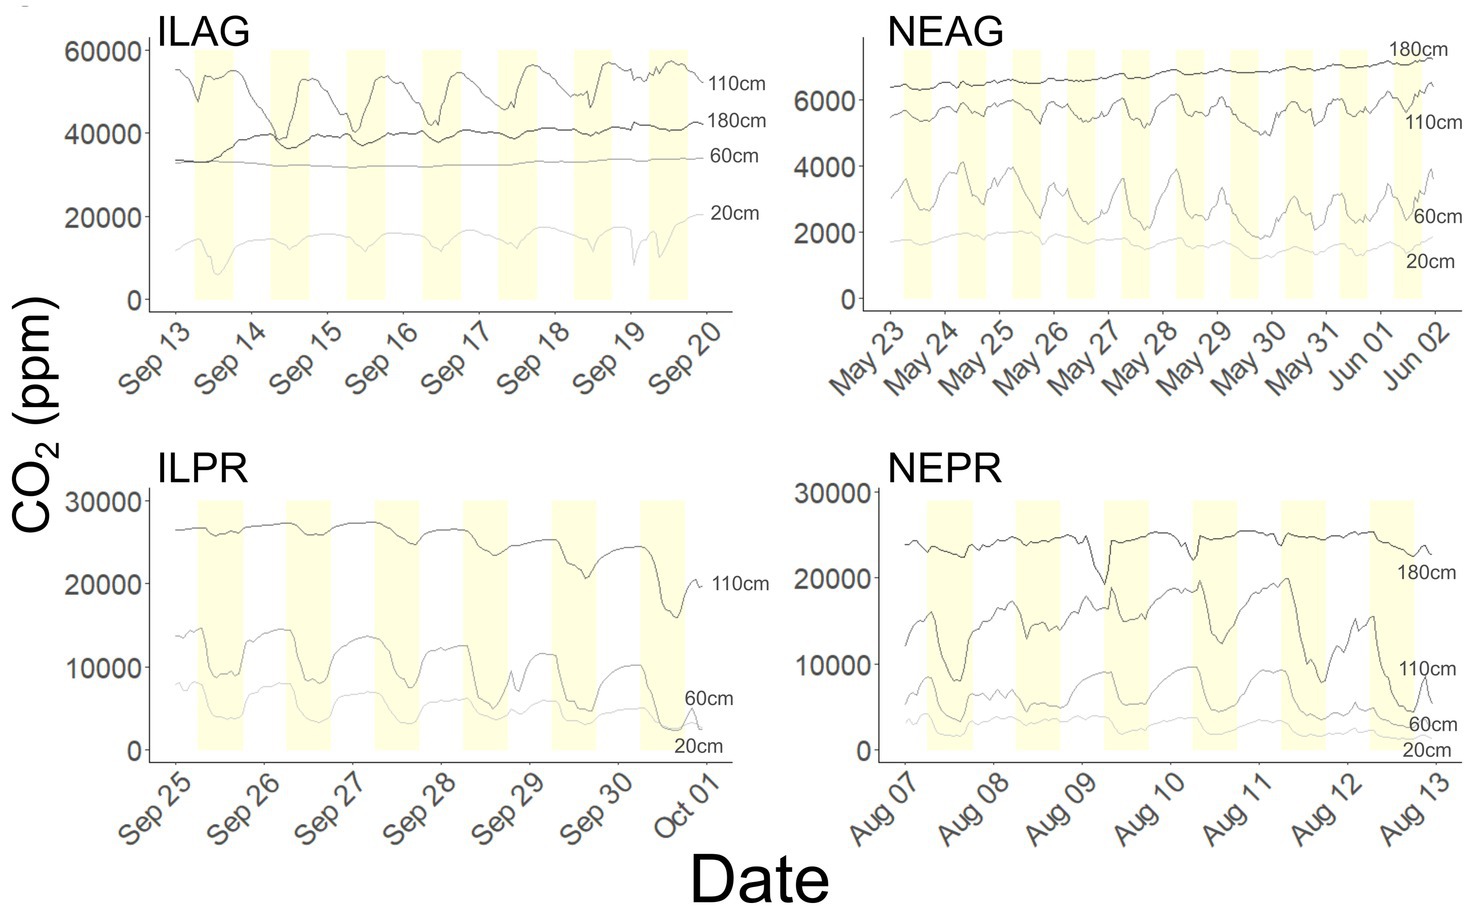
Figure 4. Diurnal oscillations of CO2 at each depth at the four sites. Yellow denotes the daytime interval from 6:00 to 18:00. The 180 cm CO2 sensor was nonfunctional in ILPR during the graphed times. The IL sites and NEAG are from the year 2022 and NEPR is from 2023.
Soil wetting events show a distinct response in CO2 concentrations, with sharp declines often occurring at the onset of wetting, then rapidly returning to pre-storm or elevated conditions (Figure 5). These rapid dips in CO2 concentration were present at all depths when VWC increased and were more pronounced when antecedent CO2 concentrations were higher and wetting events were larger. Similar patterns were seen in O2 with soil wetting events resulting in rapid increases in soil O2, when soil O2 was depleted before the rain event. In essence, these wetting events caused O2 to increase towards atmospheric values and CO2 to decrease towards atmospheric values because rain water entering the soil was previously equilibrated with atmospheric gas concentrations. O2 approached but never exceeded typical atmospheric values, and CO2 always remained elevated above atmospheric values (Figure 5). Hysteresis plots between soil CO2 and soil VWC showed that some wetting events led to prolonged increases in CO2 during the following days, particularly those in mid-summer when NDVI was high (Figure 6).
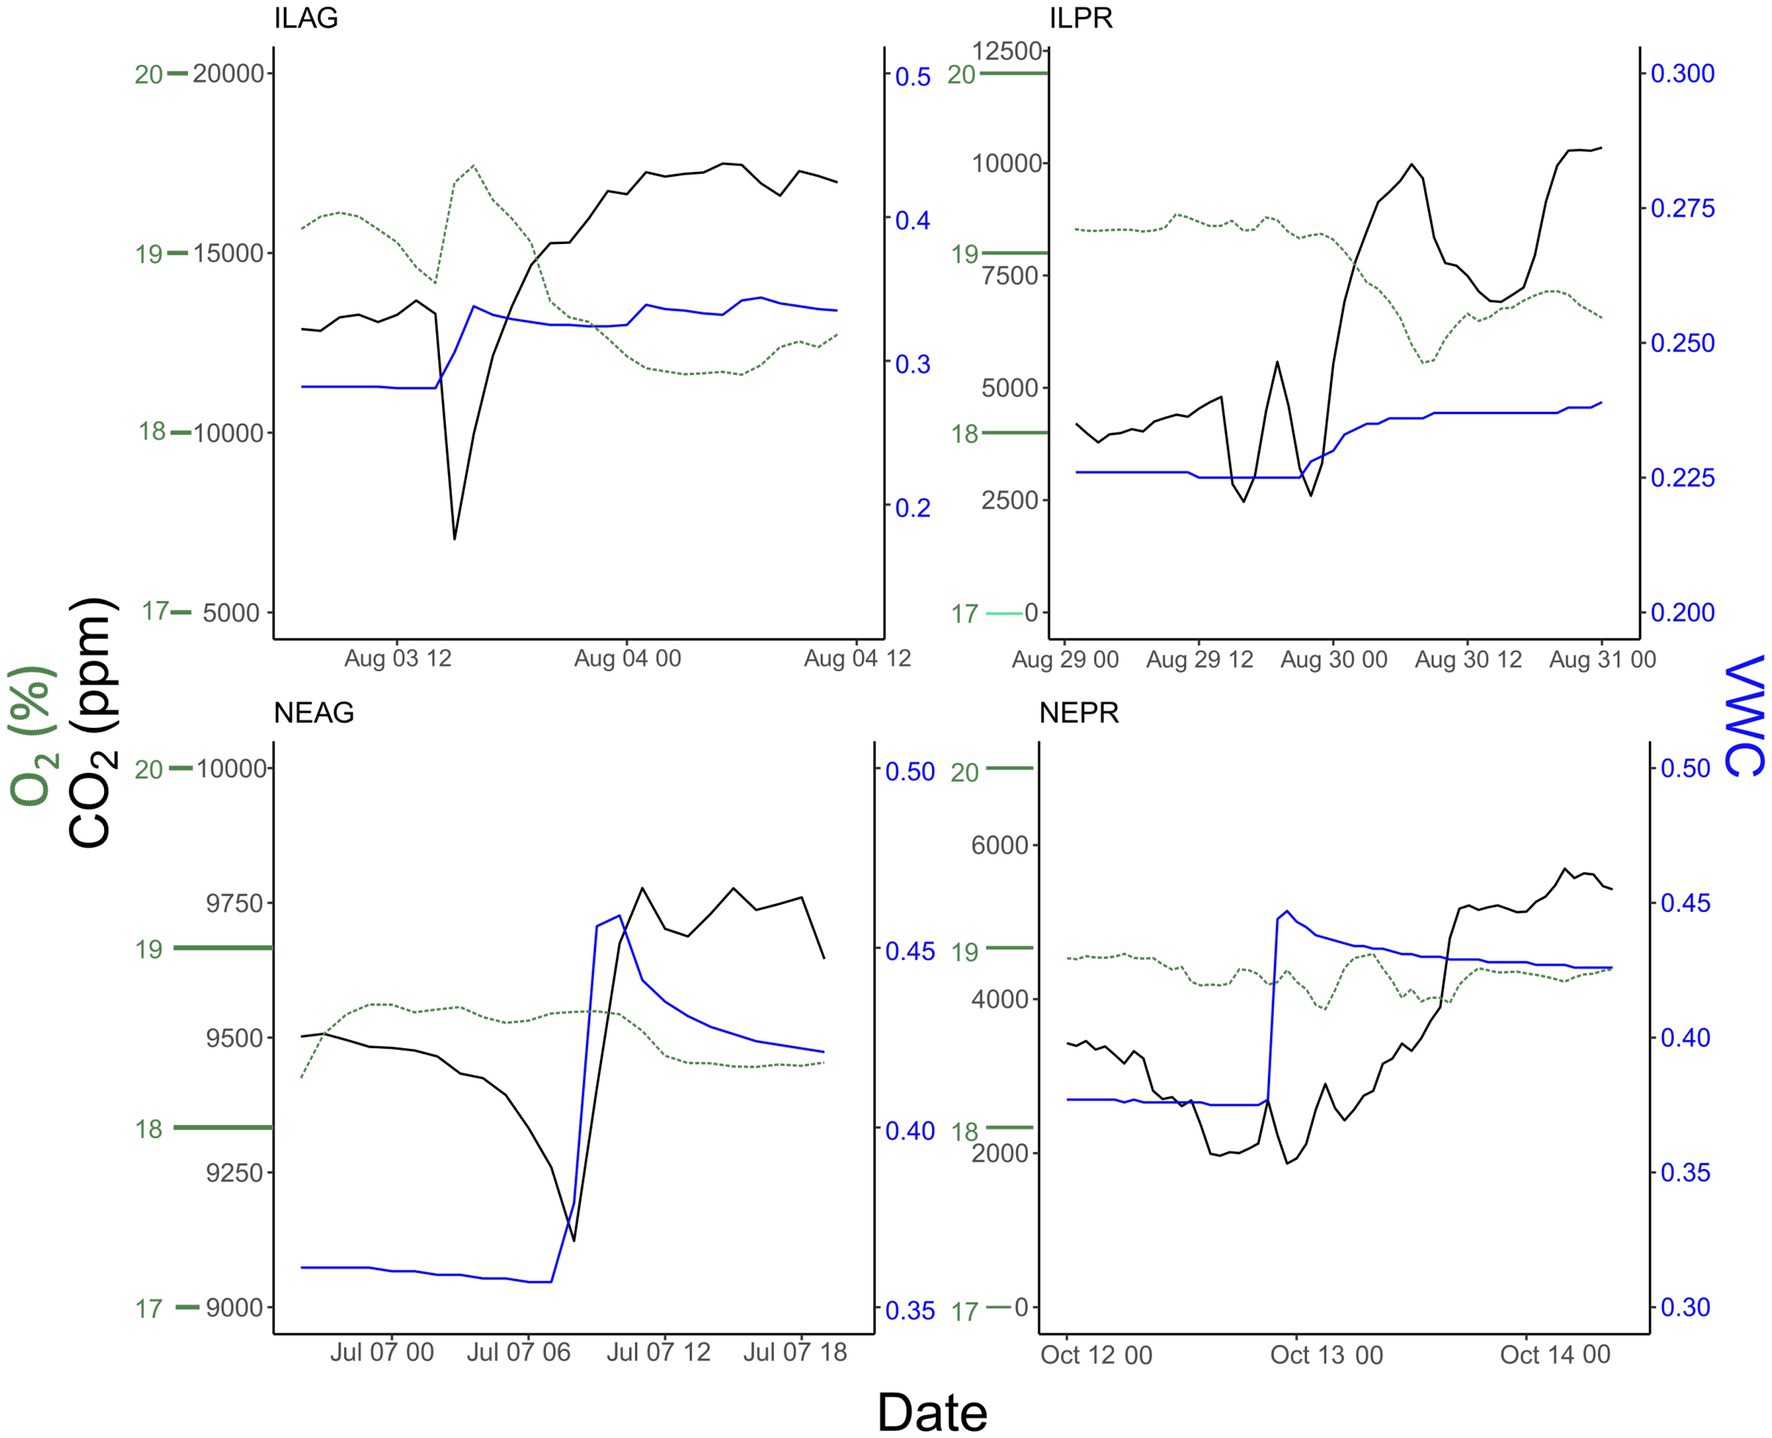
Figure 5. Examples of wetting events at 20 cm causing a drop in CO2 and rise in O2 followed by a recovery of CO2 to higher values. Blue lines indicate VWC, black lines indicate soil gas pCO2, and green indicates O2. The small initial drop in CO2 at ILPR at the onset of the wetting event is likely due to a combination of low CO2 ppm at the start of the event and a very small increase in VWC. This means that the soil gas and rainwater likely reached an equilibrium above 20 cm.
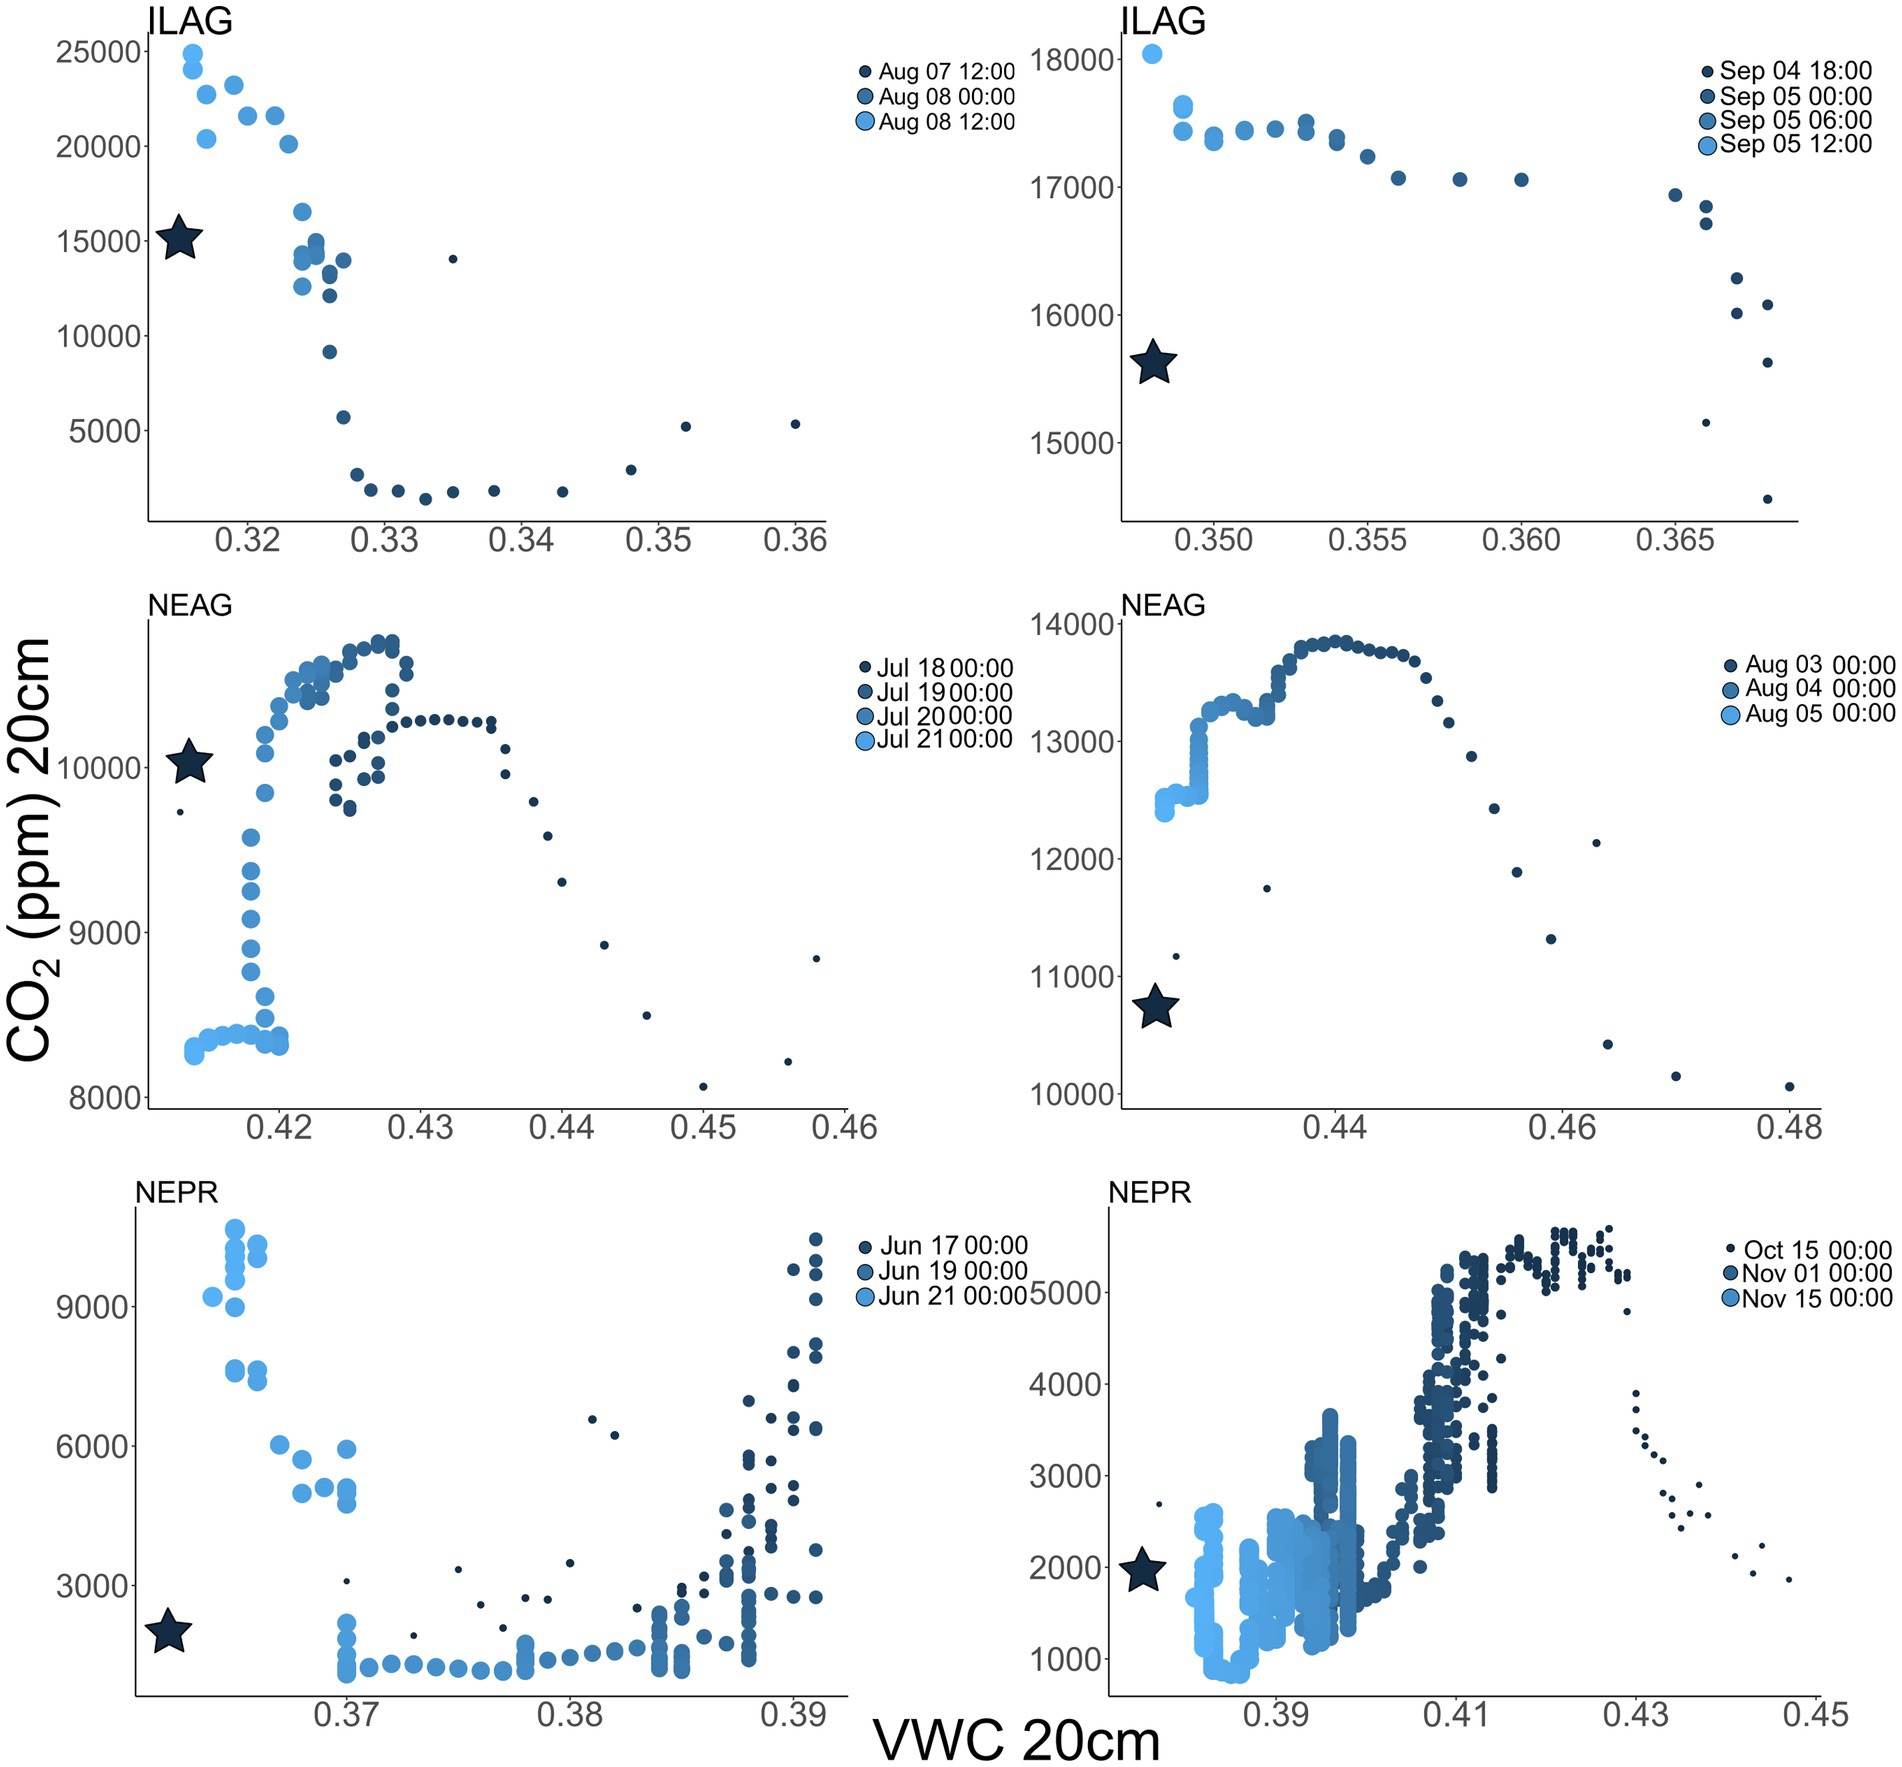
Figure 6. Soil CO2 vs. VWC in ILAG, NEAG, and NEPR. Darker colors and smaller dots indicate early time points in the event with the star indicating the start of the event. Most events show hysteresis with initial drops in CO2 as VWC rises followed by increasing CO2 on the return to initial VWC conditions.
NDVI had a significant positive correlation to Log10 CO2 concentrations in NE (NEAG R = 0.71, NEPR R = 0.72) and IL (ILAG R = 0.78), and log10 CO2 production NE (NEAG R = 0.27, NEPR R = 0.55) and IL (ILAG R = 0.60) with the NEPR having a stronger coefficient of determination than NEAG, unfortunately not enough data was available in ILPR (Table 2). Furthermore, log10 CO2 concentrations at 20 cm show statistically significant (p < 0.05) negative correlations with solar radiation when preforming a correlation for each day in summer, yielding mean correlation coefficient of the daily correlations at each site of −0.60, −0.35, −0.46, and −0.52 in ILAG, ILPR, NEAG, and NEPR, respectively. Similarly, CO2 production had significant (p < 0.05) positive daily correlations with solar radiation in summer, yielding mean R of the daily correlations at each site of 0.43, 0.54, 0.42, and 0.43 in ILAG, ILPR, NEAG, and NEPR, respectively. We also detected correlations between soil temperature and log10 CO2 concentration at 20 cm in NE (NEAG R = 0.68, NEPR R = 0.73) and IL (ILAG R = 0.75, ILPR R = 0.37) and weaker but still statistically significant correlations between soil temperature and CO2 production at 20 cm with R of 0.36, 0.53, 0.32, and 0.20 in NEAG, NEPR, ILAG, and ILPR, respectively. Furthermore, we find that correlations between soil temperature and CO2 concentration or production are both inconsistent with depth and data coarseness (Table 3). In general, CO2 concentration correlations with soil temperature increase with depth at ILPR and NEAG but fluctuate at ILAG and NEPR. Soil temperature correlations with production generally decrease with depth, however the 60 cm correlations are generally negative (Figure 7, Supplementary Table 1). Additionally, correlations become weaker when only considering summer months at all sites except for CO2 production at ILAG at 110 cm depth. We also note an increase in the correlation coefficient and decrease in Akaike Information Criterion between soil temperature and CO2 concentration or production when coarser data is used, such as daily or monthly data (Table 3).
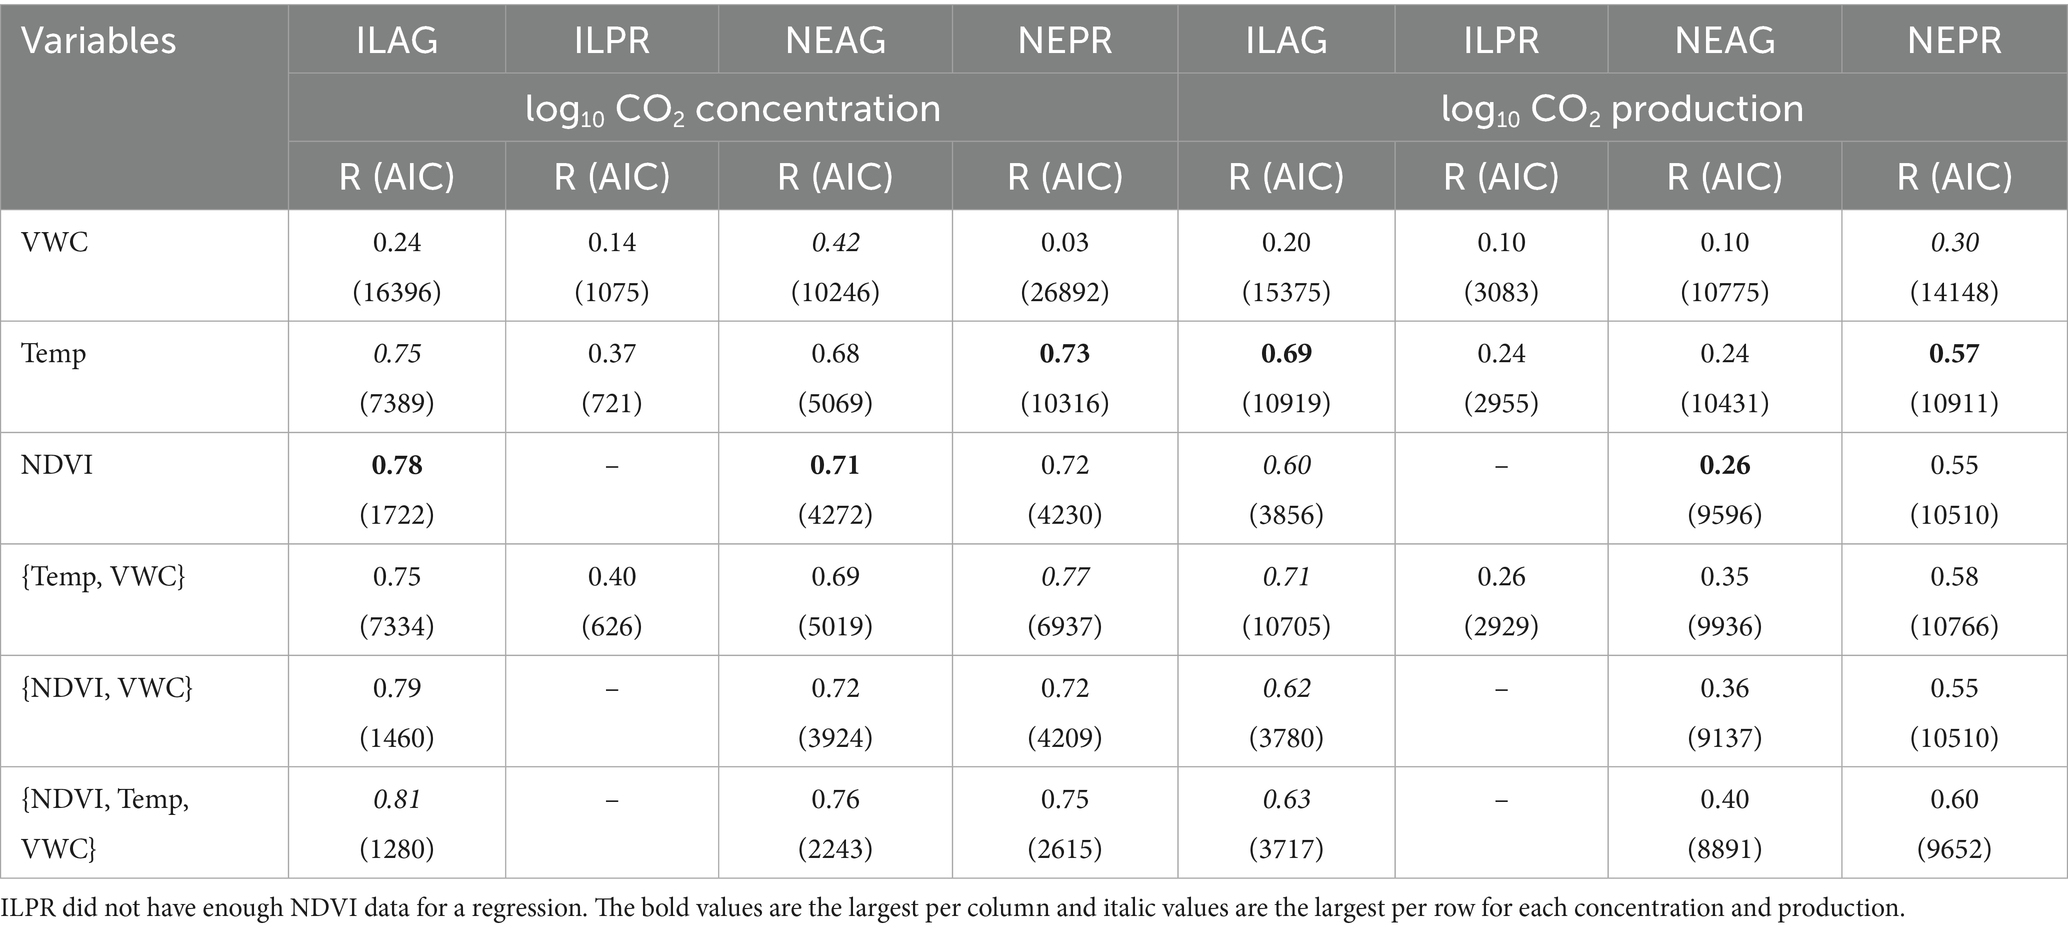
Table 2. Results of individual and multivariate linear regressions between log10 CO2 concentration or log10 CO2 production at 20 cm and temperature at 20 cm, VWC at 20 cm, and NDVI for each field station are shown with the AIC values from the regressions in parentheses.
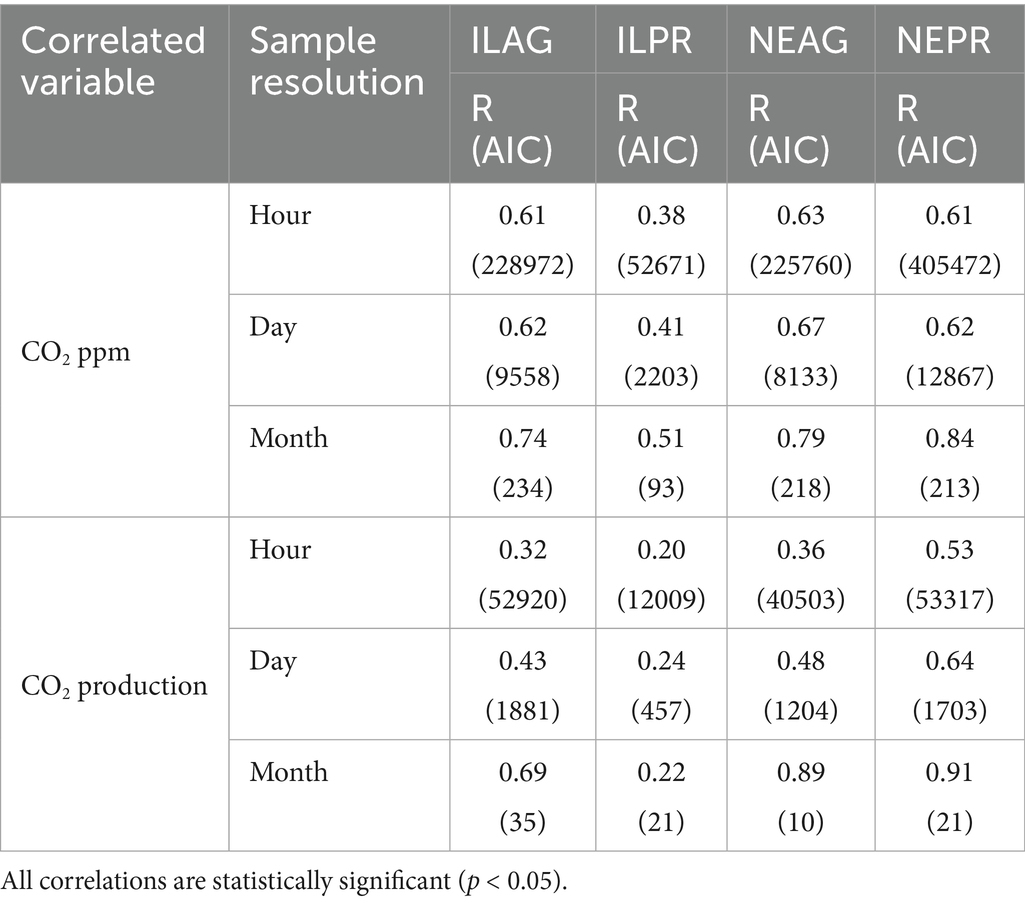
Table 3. Correlations between CO2 and mean soil temperature at an hourly, daily, and monthly scale at 20 cm.
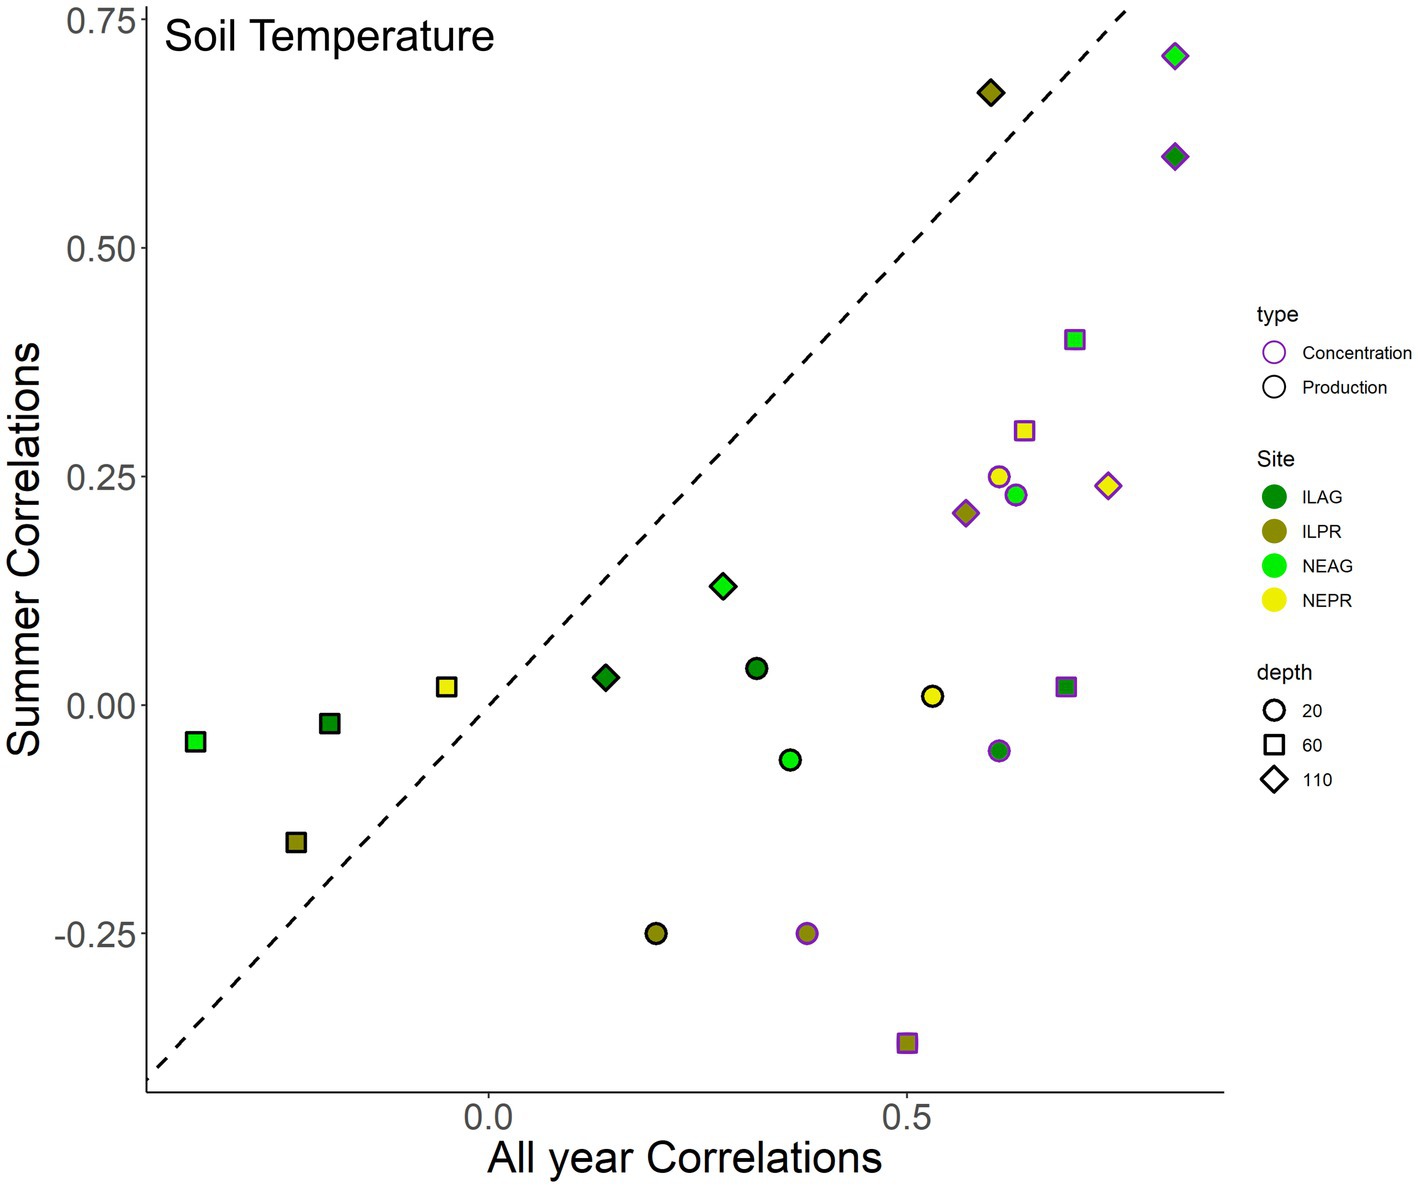
Figure 7. Correlation coefficients (R) between CO2 concentration (purple outlines) or CO2 production (black outlines) with soil temperature, where colors indicate site and marker types indicate depths, based on hourly data. For each correlation, temperature and CO2 variables are at the same depth of 20 cm, 60 cm, and 110 cm. Summer months include June to September. The values shown are statistically significant (p < 0.05).
Patterns of VWC and NDVI most strongly relate to CO2
VWC shows an annual cycle with declining soil moisture through the summer growing season (yellow shading in Figure 8), with pulses of rapid wetting due to rain events followed by drying. Between both IL sites, 99 individual events over the course of the study increased VWC at 20 cm, of which only 42% reached 60 cm, 27% reached 110 cm, and 12% reached 180 cm. Across both NE sites, 64 events increased VWC at 20 cm with 34, 16, and 8% of the 64 events reaching 60, 110, and 180 cm, respectively. In both regions, the AG sites had at least 1.4 times more wetting events at depths of 60 cm or greater than PR sites. In NE, the deepest 180 cm soils were wettest in all seasons except spring when 20 cm was wettest. ILPR generally had wetter conditions at the 20 cm and 60 cm depths, however 20 cm was the driest in summer. At ILAG, soil was wettest at the 60 depth for all seasons. Seasonal differences in VWC were highest in the shallower soils, with the largest variability at 20 cm. Specifically, VWC ranged from 0.123 to 0.499 in NE and from 0.2 to 0.435 in IL at the same depths. Additionally, NEAG had the largest swings in VWC, and ILAG had the smallest (Figure 8, Supplementary Table 2). Correlation between CO2 concentrations and VWC were generally weak especially in the shallow soils (20 and 60 cm) and were stronger in summer than across the entire year (Figure 9). However, only the summer (Jun-Sep) correlations for ILPR at 20 cm and NEAG at 110 cm had correlations above 0.50 (Figure 9, Supplementary Table 3). Furthermore, the correlations between CO2 production and VWC were generally weaker than those with CO2 concentration. Of the sites, only ILPR showed correlations above R = 0.50 (Figure 9, Supplementary Table 3).
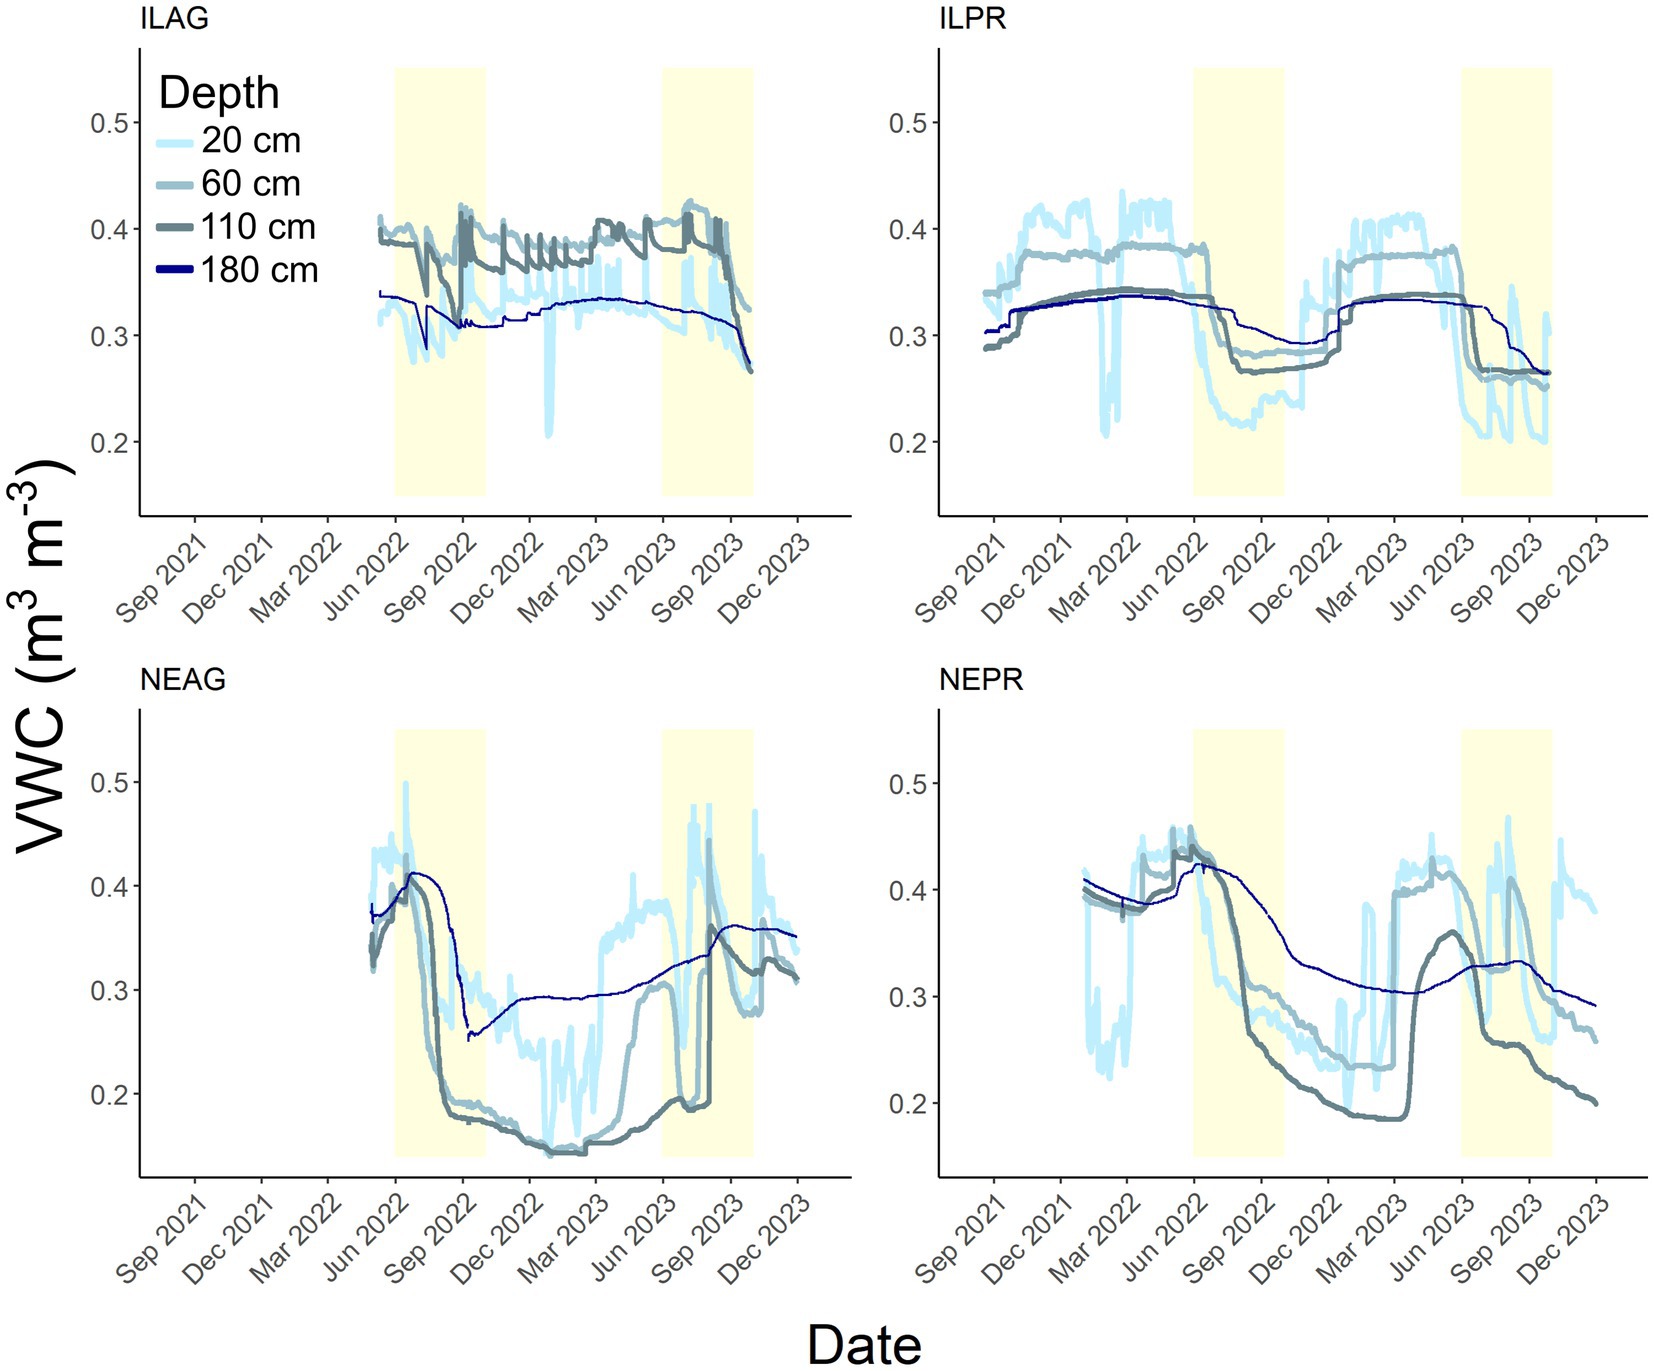
Figure 8. Soil volumetric water content (m3 m−3) for each site and depth over the study period. The lightest blue color is 20 cm the darkest blue is 180 cm. The shaded yellow areas indicate summer (June 1 to September 30) of 2022 and 2023 for all sites (and late summer of 2021 for ILPR).
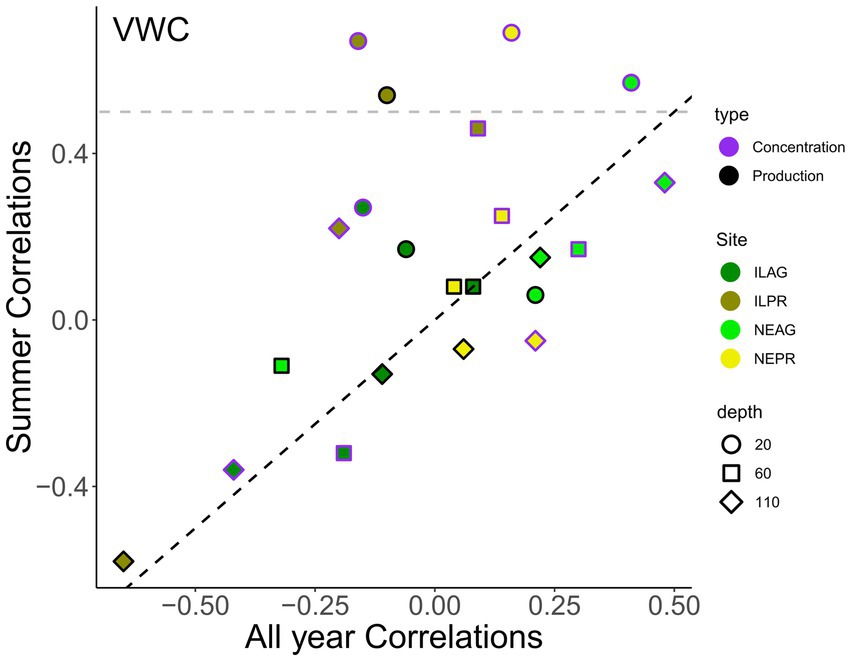
Figure 9. Correlation coefficients (R) between CO2 concentration (purple outlines) or CO2 production (black outlines) with soil VWC, where colors indicate site. For each correlation variables are all at the same depth of 20 cm (circles), 60 cm (squares), and 110 cm (diamonds), and hourly data was used. Summer months include June to September. The values shown are significant p < 0.05. Summer correlations tend to be higher than correlations over the year, especially at shallow depths (circles) and for prairie (ILPR, NEPR) sites. The horizontal gray line is 0.5.
Temperature also showed a seasonal and daily cycle driven by solar radiation, and correlations between radiation and air temperature were noted in IL (R = 0.49 AG, R = 0.42 PR) and NE (R = 0.41 AG, R = 0.42 PR). In Nebraska, air temperatures ranged from −27 to 40 °C, whereas Illinois was on average warmer and ranged from −24 to 37 °C. Daily swings in air temperature were generally lowest in December and January and largest in April and October, with daily temperature swings as large as 32 °C and as small as 1 °C. Peak air temperatures were offset from solar radiation by an average of 2.5 h after maximum solar radiation in IL and 1.9 h in NE. This was consistent throughout the year in NE, whereas in IL some winter months had small temporal offsets. Soil temperatures at the agricultural sites showed greater variability, especially at the shallowest 20 cm depths where soil temperature ranged from −8.8 to 30 °C in NE and −1.8 to 32 °C in IL. Additionally, 20 cm was the only depth to show a clear diurnal oscillation in soil temperature. Deeper soils showed seasonal variability, which was muted and lagged with depth (Figure 10).
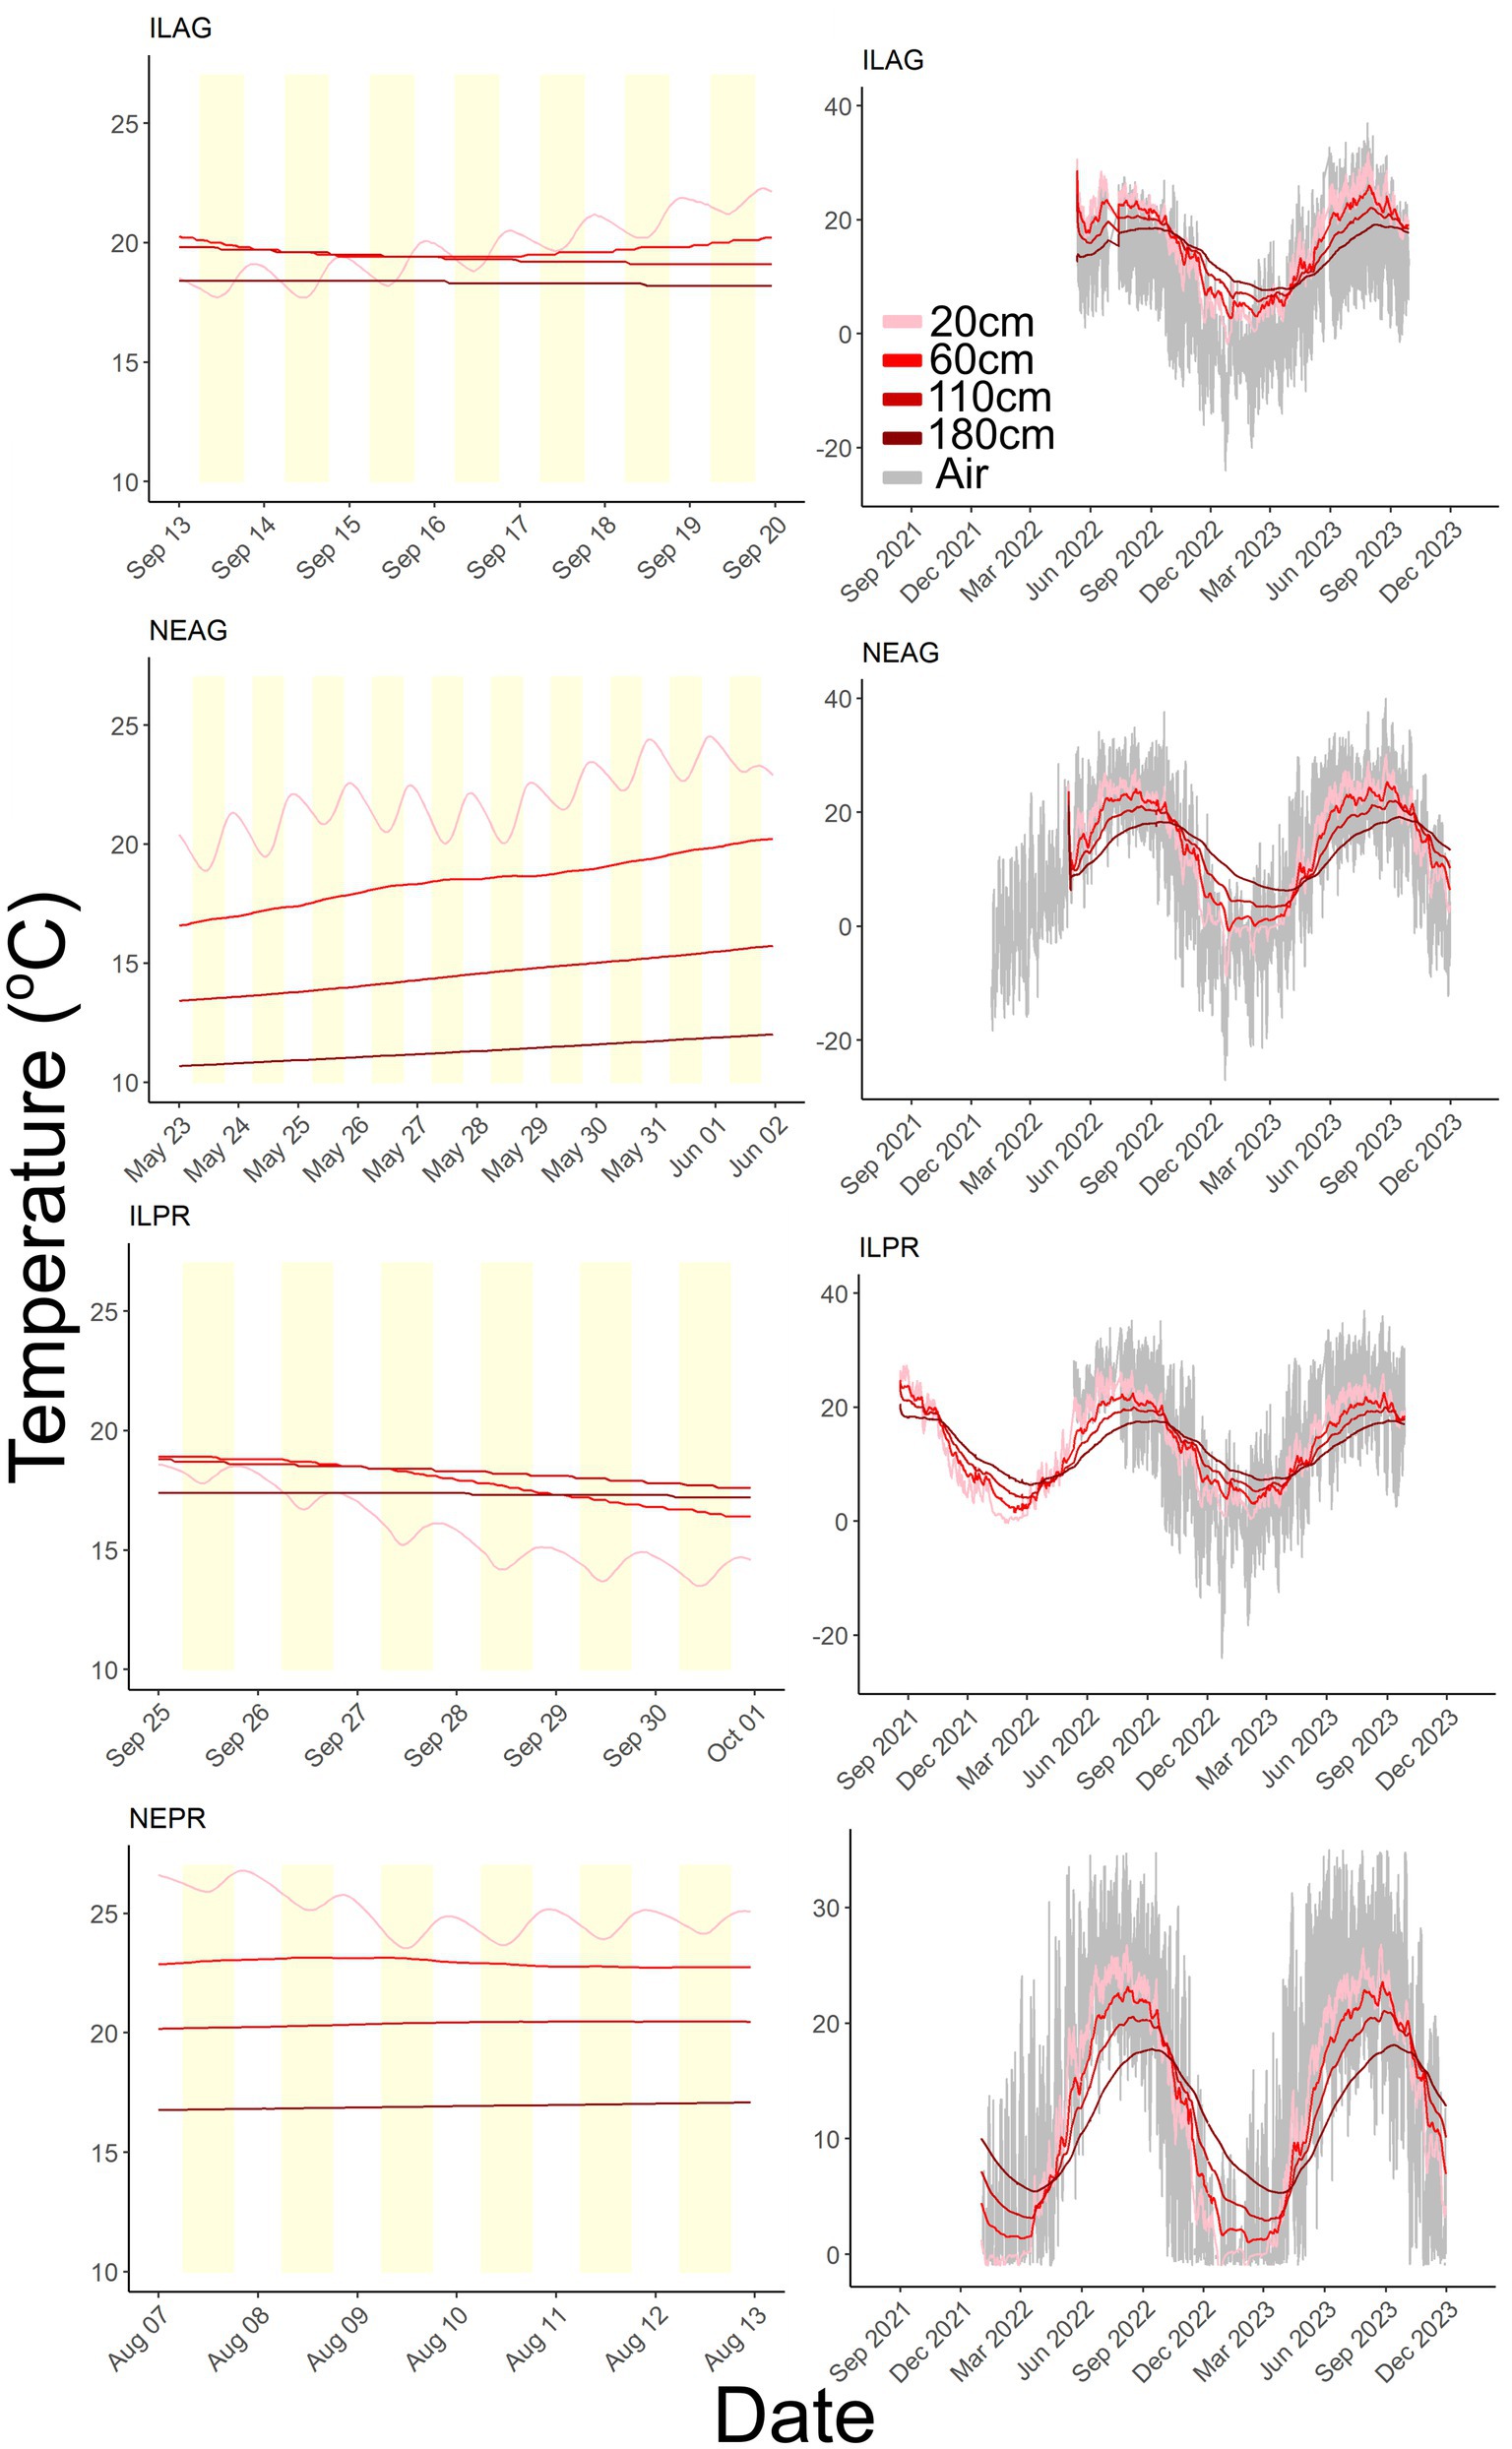
Figure 10. Soil temperature at 20, 60, 110, and 180 cm, where lighter red colors indicate shallower depths and air temperature in gray. Yellow shading denotes the daytime window from 6:00 to 18:00. The IL sites and NEAG data segments are from 2022 and NEPR is from 2023. Only the 20 cm depth shows diurnal oscillation and deeper depths reflect more seasonal patterns.
Discussion
We found that CO2 production and concentration correlate strongly to plant growth metrics and solar radiation at both seasonal and daily timescales, indicating that plants exert strong and significant controls on soil CO2. Sub-daily data also suggests that the antecedent conditions in soils, such as CO2 concentration and plant cover, can alter responses to rain events. Furthermore, as rainwater equilibrates with soil gases, the soil CO2 is dissolved into the rainwater. This causes rapid decreases in soil CO2 concentrations at the onset of storms toward atmospheric concentrations and O2 increases toward atmospheric concentrations (Figure 5). Additionally, soil CO2 concentration responses to solar radiation and NDVI are consistent in both agricultural and prairie environments; however, the strength of the responses between CO2 and NDVI show stronger correlations at the NEPR sites (Table 2). These differences are likely due to the types of plant communities and their rooting densities in agricultural and prairie environments, which are often annual monocultures and a mix of perennials, respectively. The greater rooting density of perries likely leads to the stronger correlations seen between NDVI and soil CO2 concentrations and production.
Autotrophic drivers
Our results underscore the strong influence of plants, likely from root respiration and microbial respiration stimulated by root exudates, on soil CO2 dynamics. This influence is evident across seasonal and daily timescales, especially during the growing season when plant phenology and activity plays a dominant role (Table 3). Previous studies have highlighted the importance of autotrophic drivers in soil CO2 production (Lei et al., 2023; Liu et al., 2024), as root growth processes (root respiration and microbial respired exudates) can account for 29–90% (Dugas et al., 1999; Li et al., 2021) and 22% of soil CO2 fluxes in prairie and corn systems, respectively, (Nichols et al., 2016) and indices like Enhanced Vegetation Index strongly predict shallow soil CO2 in ecosystems such as rocky mountain meadows (Winnick et al., 2020). Similarly, soils with active root systems under tree cover exhibit significantly higher respiration compared to adjacent areas without roots (Tang et al., 2005). Within our data, soil CO2 production and concentration show distinct and sharp seasonal shifts that indicate plant interactions are a significant driver (Figure 3). Primarily, soil CO2 concentration in the agricultural sites correlate more strongly to the sharp seasonal trends of NDVI than the gradual change in temperature (Table 2). This indicates that the onset of plant growth is a stronger driver than temperature driven microbial respiration alone. This stronger correlation to NDVI is seen at both agricultural sites and is consistent across measurement years, indicating this is a consistent pattern across the agricultural landscapes.
Further support for the importance of plant mediated respiration is seen in the daily oscillation of CO2 concentration and production within the data and the negative correlation between solar radiation and CO2 concentrations at 20 cm in summer months. These daily oscillations are roughly 12 h offset from solar radiation availability, resulting in the lowest CO2 around peak solar radiation and the highest CO2 at night (Figure 4). Hirano et al. (2003) and Tang et al. (2005) observed similar patterns with CO2 minimums occurring during the day. Tang et al. (2005) also noted soil CO2 production peaks and photosynthesis peaks were offset by 7–12 h in forested environments which was attributed to the slow transport of carbohydrates from leaves to the roots. This matches with other research that shows grasses have a 12.5 ± 7.5 h (mean ± standard deviation) time lag in carbohydrate transport from leaves to the roots through the phloem (Kuzyakov and Gavrichkova, 2010). The presence of these oscillations in CO2 concentrations, which potentially match the pulses of carbohydrates from roots, means that during the growing season the availability of easily respired C limits respiration instead of temperature. As this represents a potentially large shift in how many models handle soil CO2 respiration, further research is needed to corroborate these findings.
Soil temperature is likely not the primary driver of measured total soil respiration, as soil temperature does not show diurnal oscillations at depths greater than 20 cm (Figure 10), while CO2 concentrations show these oscillations at much deeper depths. If temperature influences on microbial respiration were the primary driver of soil CO2 concentration variability, then we would expect soil temperature and CO2 concentration to jointly oscillate across the same depths, as temperature enhances microbial activity and drives respiration (Han et al., 2007). Similar mismatches between temperatures and CO2 concentration variability have been documented in the literature (Makita et al., 2018; Liu et al., 2006), and recent findings have shown that diurnal cycles play an important role in soil respiration response to rising temperature with larger daily temperature swings resulting in muted responses of respiration (Adekanmbi and Sizmur, 2022; Adekanmbi et al., 2022). Furthermore, these CO2 oscillations are present in the late spring, summer, and early fall at all sites but not in early spring, late fall, or winter when plant cover is low, indicating that these oscillations are caused by plant cover. Additionally, our data show that the daily oscillations of CO2 concentration persist to depths of 60, 110, and 180 cm, far deeper than daily soil temperature swings, which are only present to 20 cm (Figures 4, 10). These findings are strong indicators that although temperature plays a role in CO2 production in soils, plant induced respiration represents a primary driver during the growing season. This research is not the first study to show plant mediated soil CO2 production (Liu et al., 2006; Han et al., 2007; Makita et al., 2018; Li et al., 2021; Lei et al., 2023), it does so at a depth (1.8 m) and magnitude (25,000 ppm) of CO2 oscillations not often seen. Our data show that accurate predictions of soil respiration at sub daily scales rely on the influence of plant soil interactions such as exudates to accurately understand the respiration rates of microbial communities and should be considered when determining soil C budgets even at these rapid time scales or within deep soils.
These findings suggest that partitioning soil respiration into direct root respiration or root-exudate stimulated microbial respiration is important to fill current knowledge gaps within the soil carbon cycle. This could be accomplished through isotope-based age classifications or other partitioning methods as plant mediated respiration may come from a multitude of sources that would have different responses to climatic or land use changes. Additionally, the contributions of plant species, genus, or functional type should be considered in future work as previous studies have shown that individual species (Johnson et al., 2008) or root sizes (Bahn et al., 2006) may contribute to respiration at higher rates than others. This difference will be important to consider when planning restoration projects, determining how species composition changes post agricultural abandonment may alter soil carbon (Ladouceur et al., 2023) and how climate shifts in plant ranges could alter soil carbon feedback. Furthermore, the links between root exudates, plant diversity, and microbial respiration are an important component to consider as many studies have shown connections between species richness, microbial activity, and soil carbon storage all of which are susceptible to rapid changes with both climate and land use change (Zak et al., 2003; Lange et al., 2015; Steinauer et al., 2016; Chen et al., 2019; Prommer et al., 2020). These plant and microbial interactions in the soil represent a diverse array of possible outcomes that depend on human as well as climatic drivers and therefore need to be better characterized so that we can accurately predict carbon stocks and cycling.
Effects of temperature and VWC
Temperature effects on soil CO2 production are difficult to determine, as many factors co-vary with both temperature and soil CO2 production (Han et al., 2007). In the past, temperature was viewed as a primary driver of soil respiration (Ouyang et al., 2015) as it speeds up microbial respiration through its effects on enzyme-mediated reactions (Conant et al., 2011). However, there are many confounding influences on soil respiration that may make temperature an indirect and potentially inaccurate determining feature of soil respiration (Auffret et al., 2016; Lei et al., 2023). The common covariance between temperature and other seasonal changes led to the significant correlation between soil temperature and CO2 production seen in our data (Figure 7, Table 2). This is easily seen when we compare hourly to daily and monthly correlations between soil CO2 production and 20 cm soil temperature as R values often double for monthly compared to hourly data (Table 3). Furthermore, despite a correlation existing, the magnitude and direction of this correlation change with depth is not consistent at individual sites through time (Figure 7, Supplementary Table 1). Additionally, during summer months (Jun-Sep) the temperature to CO2 production correlations become weaker or not statistically significant (Figure 7). The inconsistency of the temperature and CO2 production correlation plus the bias in coarser data leads us to similar conclusions as past studies (Conant et al., 2011; Winnick et al., 2020), which find that temperature is likely not a strong direct driver of soil CO2 production during summer months. This finding is further supported by the lack of diurnal temperature patterns in the deeper soils despite diurnal CO2 patterns. Future studies are necessary to explore specific mechanisms related to temperature as the covariations among temperature and other factors pose a large unknown in soil respiration modeling and future climate feedbacks.
Like temperature, VWC does not show a strong correlation to CO2 production; furthermore, the correlations we do find are inconsistent in both their direction and magnitude (Figure 7, 9, Supplementary Table 3). The nonsignificant effects of VWC are similar to the findings of other research (Bouma et al., 1997). This inconsistency suggests that VWC may affect a range of factors that alter CO2 production, causing differences in the correlation depending on which factors are currently limiting. Furthermore, these inconsistencies in correlations suggest that antecedent conditions play an important role in determining how the system reacts to rain. For example, VWC is not a strong driver of CO2 production during the summer drought (Figure 9, Supplementary Table 3). This finding is different from past research, which has found that VWC becomes a more important driver of soil CO2 production with drought, particularly at the expense of plant-related metrics (Huang et al., 2014). This divergence from past research might be due to ecosystem differences as these studies were conducted in deciduous forests and mountain meadow environments, or methodological differences such as the timescales of the data. Alternatively, the moderate severity of the drought at our sites could be such that plants were not sufficiently stressed for VWC to become the limiting resource in surface soils.
Event responses
Rain events over the monitoring period were relatively infrequent as the region experienced drought conditions during the summer and fall seasons in 2022 and 2023. However, the data still capture some rain events and show different patterns depending on antecedent conditions. Often, responses to rain in soils are interpreted as a stimulation of microbial respiration (Griffiths and Birch, 1961; Unger et al., 2010; Winnick et al., 2020) however, physical processes play a prominent role in determining the immediate responses to rain events, while biological processes affect respiration hours to days after the event. At the onset of storms in the growing season where soil CO2 was greater than 5,000 ppm and VWC increased, our data showed a rapid drop in CO2 lowering concentrations by up to 7,000 ppm. This drop is interpreted as the equilibration of rainwater with soil gases, resulting in dissolution of soil CO2 into the aqueous phase (carbonic acid). After a wetting event, soil CO2 concentration often returned to pre-storm or higher levels within a few hours, reaching a new (often elevated) state which could last hours to days. These responses are due to biological responses often referred to as the Birch effect which describes an increase in microbial activity after a wetting event (Birch, 1958; Griffiths and Birch, 1961).
Our data show evidence of CO2 production responses to events during the growing season when the CO2 concentration responses were much larger. Post-wetting respiration CO2 concentration responses often appeared to be delayed by hours due to the equilibration of atmospheric rainwater with soil gases. Without the high resolution of our data, these could be misinterpreted as a delay in the microbial response if captured during infrequent sampling, neglecting the buildup of CO2 in the aqueous phase. As soil CO2 is dynamic, representing the balance between production within the soils and losses due to diffusion to the atmosphere or from the dissolution of weatherable minerals, these physical controls on soil CO2 need to be considered when interpreting changes in soil CO2 concentrations to accurately predict how soil respiration responds to environmental conditions. To mathematically model soil CO2 production, soil VWC and CO2 concentration were used to predict the rate at which CO2 is being produced or consumed (Davidson and Trumbore, 1995; Davidson et al., 2006; Steefel et al., 2015; Winnick et al., 2020). This production can then be interpreted as the net result of environmental factors such as microbial respiration rate and the dissolution of weatherable minerals (Gallagher and Breecker, 2020). However, this interpretation is incomplete, as CO2 dissolution into carbonic acid is neglected, this additional sink could be directly accounted for if soil pore water pH was measured. If these models are used without accounting for this sink, the rate of soil respiration and the magnitude of the response to wetting events would be underestimated by the magnitude of this sink.
Agricultural vs. prairie
Previous studies have shown that plant growth stage plays an important role in how soil respiration reacts to changes in temperature and VWC (DeForest et al., 2006; Winnick et al., 2020). Here we find that this role is amplified in prairie environments and that plant mediation of soil respiration shows distinct differences in the magnitude of CO2 production between agriculture and prairie environments. This is seen in the stronger correlations between NDVI and CO2 production at prairie in the NE sites. Additionally, larger variability of CO2 concentration and significantly higher mean CO2 concentrations in spring and fall months were noted in the NE prairie site. These differences were likely due to the ability of the PR sites to respond more readily to favorable conditions during colder months as the plant composition is more diverse and made up of primarily perennial species (Prairie et al., 1993; Chimner and Welker, 2005; Polley et al., 2005; Johnson et al., 2008). In contrast, agricultural soils are planted with an annual monoculture that is harvested in the fall for the winter and planted again in late spring, reducing the ability of soil microbes to respond to favorable conditions as plant roots and associated exudates are not present. Beyond the differences in the plant communities, the lack of ground cover in agricultural sites leads to often colder soils in the fall and winter, likely minimizing the microbial response during colder months. In the summer months, we note significantly higher CO2 production in prairie sites.
Conclusion
Our study highlights the critical role of plants in driving soil CO2 dynamics in midwestern agriculture and prairie soils. It underscores the influence of plant-mediated soil respiration at sub daily timescales to depths of 1.8 m. It also shows the importance of considering CO2 dissolution following rain events in interpretations of CO2 production data. Rain events induced a physical response through an immediate dilution effect on CO2 concentrations, followed by a biological increase. Soil CO2 concentration and production were correlated most strongly NDVI and solar radiation rather than soil temperature. Within the soils CO2 had a diurnal oscillation, with a 12-h offset from solar radiation during the growing season matching transport times within prairie grasses. Additionally, these oscillations of CO2 persisted to significant depths, and are decoupled from temperature oscillations which did not propagate past 20 cm. Furthermore, we find that prairie soils exhibited higher CO2 production rates than agricultural soils, likely driven by the greater diversity of the prairie plant community.
Future research should investigate the specific contributions of root-mediated microbial respiration to soil CO2 production using surface gas flux chambers and isotopic measurements. Additionally, assessing both the quantity and quality of soil carbon across diverse plant communities, will elucidate the mechanisms driving observed patterns. Additionally, the effects of data resolution should be further investigated to understand how current data collection practices alter CO2 predictions including how measurement frequency can be considered when designing studies that look to understand the controls of soil CO2 respiration. Furthermore, understanding how shifts in plant community composition affect soil CO2 dynamics under changing environmental conditions is critical for predicting ecosystem feedbacks to climate change. This study advances our understanding of soil CO2 dynamics and the interplay between biological and physical drivers through high resolution data, and provides critical insights into an often underexplored component of the carbon cycle. These findings underscore the urgency of integrating soil–plant interactions into climate models to better predict ecosystem responses to environmental change.
Data availability statement
Original datasets are available in a publicly accessible repository: https://www.hydroshare.org/resource/405c8669069147b690c04b7063cad6ce/.
Author contributions
BS: Conceptualization, Data curation, Formal analysis, Methodology, Visualization, Writing – review & editing. AD: Writing – review & editing, Supervision, Resources, Data curation, Conceptualization. AG: Writing – review & editing, Methodology. JD: Writing – review & editing. LW: Writing – review & editing. NB: Writing – review & editing. EB: Writing – review & editing, Data curation, Resources. JH: Resources, Writing – review & editing, Data curation. MJ-C: Data curation, Writing – review & editing, Resources. TF: Writing – review & editing. PK: Resources, Writing – review & editing, Project administration, Funding acquisition.
Funding
The author(s) declare that financial support was received for the research and/or publication of this article. We acknowledge National Science Foundation (NSF) Grant EAR #2012850 (PI P. Kumar) for the Critical Interface Network for Intensively Managed Landscapes (CINet).
Conflict of interest
The authors declare that the research was conducted in the absence of any commercial or financial relationships that could be construed as a potential conflict of interest.
Generative AI statement
The authors declare that Gen AI was used in the creation of this manuscript. ChatGPT was used to check spelling and grammar using the prompt "can you list any spelling or grammar mistakes and correction for each for this paper." or similar prompts for sections of the paper.
Any alternative text (alt text) provided alongside figures in this article has been generated by Frontiers with the support of artificial intelligence and reasonable efforts have been made to ensure accuracy, including review by the authors wherever possible. If you identify any issues, please contact us.
Publisher’s note
All claims expressed in this article are solely those of the authors and do not necessarily represent those of their affiliated organizations, or those of the publisher, the editors and the reviewers. Any product that may be evaluated in this article, or claim that may be made by its manufacturer, is not guaranteed or endorsed by the publisher.
Supplementary material
The Supplementary material for this article can be found online at: https://www.frontiersin.org/articles/10.3389/frwa.2025.1638541/full#supplementary-material
References
Adekanmbi, A. A., Shu, X., Zou, Y., and Sizmur, T. (2022). Legacy effect of constant and diurnally oscillating temperatures on soil respiration and microbial community structure. Eur. J. Soil Sci. 73:13319. doi: 10.1111/ejss.13319
Adekanmbi, A. A., and Sizmur, T. (2022). Importance of diurnal temperature range (DTR) for predicting the temperature sensitivity of soil respiration. Front. Soil Sci. 2:969077. doi: 10.3389/fsoil.2022.969077
Anjileli, H., Huning, L. S., Moftakhari, H., Ashraf, S., Asanjan, A. A., Norouzi, H., et al. (2021). Extreme heat events heighten soil respiration. Sci. Rep. 11:6632. doi: 10.1038/s41598-021-85764-8
Auffret, M. D., Karhu, K., Khachane, A., Dungait, J. A. J., Fraser, F., Hopkins, D. W., et al. (2016). The role of microbial community composition in controlling soil respiration responses to temperature. PLoS One 11:e0165448. doi: 10.1371/journal.pone.0165448
Bahn, M., Knapp, M., Garajova, Z., Pfahringer, N., and Cernusca, A. (2006). Root respiration in temperate mountain grasslands differing in land use. Glob. Chang. Biol. 12, 995–1006. doi: 10.1111/j.1365-2486.2006.01144.x
Birch, H. F. (1958). The effect of soil drying on humus decomposition and nitrogen availability. Plant Soil 10, 9–31.
Bond-Lamberty, B., Ballantyne, A., Berryman, E., Fluet-Chouinard, E., Jian, J., Morris, K. A., et al. (2024). Twenty years of progress, challenges, and opportunities in measuring and understanding soil respiration. J. Geophys. Res. Biogeosci. 129. doi: 10.1029/2023JG007637
Bond-Lamberty, B., and Thomson, A. (2010). Temperature-associated increases in the global soil respiration record. Nature 464, 579–582. doi: 10.1038/nature08930
Bouma, T. J., Nielsen, K. L., Eissenstat, D. M., and Lynch, J. P. (1997). Estimating respiration of roots in soil: Interactions with soil CO2, soil temperature and soil water content. Dordrecht, Netherlands: Kluwer Academic Publishers.
Brecheisen, Z. S., Cook, C. W., Heine, P. R., Ryang, J., and Richter, D. de B. (2019). Development and deployment of a field-portable soil O2 and CO2 gas analyzer and sampler. PLoS One 14. doi: 10.1371/journal.pone.0220176
Brevik, E. C. (2012). Soils and climate change: gas fluxes and soil processes. Soil Horizons 53, 12–23. doi: 10.2136/sh12-04-0012
Campbell, G. S. (1985). Soil physics with basic transport models for soil-plant systems. 1st Edn. Pullman: Elsevier Science.
Cavallaro, N., Shrestha, G., Birdsey, R., Mayes, M. A., Najjar, R. G., Reed, S. C., et al. (2018). Second state of the carbon cycle report. Washington, DC: U.S. Global Change Research Program.
Cerling, T. E. (1984). The stable isotopic composition of modern soil carbonate and its relationship to climate. Earth Planet. Sci. Lett. 71, 229–240. doi: 10.1016/0012-821X(84)90089-X
Chen, C., Chen, H. Y. H., Chen, X., and Huang, Z. (2019). Meta-analysis shows positive effects of plant diversity on microbial biomass and respiration. Nat. Commun. 10:1332. doi: 10.1038/s41467-019-09258-y
Chen, S., Huang, Y., Zou, J., and Shi, Y. (2013). Mean residence time of global topsoil organic carbon depends on temperature, precipitation and soil nitrogen. Glob. Planet Change 100, 99–108. doi: 10.1016/j.gloplacha.2012.10.006
Chimner, R. A., and Welker, J. M. (2005). Ecosystem respiration responses to experimental manipulations of winter and summer precipitation in a Mixedgrass Prairie, WY, USA. Biogeochemistry 73, 257–270. doi: 10.1007/s10533-004-1989-6
Cole, J. J., Prairie, Y. T., Caraco, N. F., McDowell, W. H., Tranvik, L. J., Striegl, R. G., et al. (2007). Plumbing the global carbon cycle: integrating inland waters into the terrestrial carbon budget. Ecosystems 10, 171–184. doi: 10.1007/s10021-006-9013-8
Conant, R. T., Ryan, M. G., Ågren, G. I., Birge, H. E., Davidson, E. A., Eliasson, P. E., et al. (2011). Temperature and soil organic matter decomposition rates - synthesis of current knowledge and a way forward. Glob. Chang. Biol. 17, 3392–3404. doi: 10.1111/j.1365-2486.2011.02496.x
Cotrufo, M. F., Ranalli, M. G., Haddix, M. L., Six, J., and Lugato, E. (2019). Soil carbon storage informed by particulate and mineral-associated organic matter. Nat. Geosci. 12, 989–994. doi: 10.1038/s41561-019-0484-6
Cueva, A., Bullock, S. H., López-Reyes, E., and Vargas, R. (2017). Potential bias of daily soil CO2 efflux estimates due to sampling time. Sci. Rep. 7:11925. doi: 10.1038/s41598-017-11849-y
Davidson, E. A., Savage, K. E., Trumbore, S. E., and Borken, W. (2006). Vertical partitioning of CO2 production within a temperate forest soil. Glob. Chang. Biol. 12, 944–956. doi: 10.1111/j.1365-2486.2005.01142.x
Davidson, E. A., and Trumbore, S. E. (1995). Gas diffusivity and production of CO2 in deep soils of the eastern Amazon. Tellus, Series B 47B, 550–565. doi: 10.3402/tellusb.v47i5.16071
DeForest, J. L., Noormets, A., McNulty, S. G., Sun, G., Tenney, G., and Chen, J. (2006). Phenophases alter the soil respiration-temperature relationship in an oak-dominated forest. Int. J. Biometeorol. 51, 135–144. doi: 10.1007/s00484-006-0046-7
Dere, A. L., Miller, A. W., Hemje, A. M., Parcher, S. K., Capalli, C. A., and Bettis, E. A. (2019). Solute fluxes through restored prairie and intensively managed critical zones in Nebraska and Iowa. Front. Earth Sci. 7, 1–15. doi: 10.3389/feart.2019.00024
Dugas, W. A., Heuer, M. L., and Mayeux, H. S. (1999). Carbon dioxide fluxes over bermudagrass, native prairie, and sorghum. Agric. For. Meteorol. 93, 121–139. doi: 10.1016/S0168-1923(98)00118-X
Ellis, C. S., and Holsen, J. N. (1969). Diffusion coefficients for helium-nitrogen and nitrogen-carbon dioxide at elevated temperatures. IEC Fundament. 18:52.
Fang, C., and Moncrieff, J. B. (2001). The dependence of soil CO 2 eflux on temperature. Soil Biol. Biochem. 2001, 155–165. doi: 10.1016/S0038-0717(00)00125-5
Frantal, I. (2024). Comparison of soil carbon dynamics between restored Prairie and agricultural soils in the U.S : Midwest. West Lafayette: Purdue University.
Friedlingstein, P., Jones, M. W., O’Sullivan, M., Andrew, R. M., and Bakker, D. C. E. (2022). Global carbon budget 2021, raport earth system science data. Earth Syst. Sci. Data 14, 1917–2005. doi: 10.5194/essd-14-1917-2022
Friedlingstein, P., O’Sullivan, M., Jones, M. W., Andrew, R. M., Hauck, J., Landschützer, P., et al. (2025). Global Carbon Budget 2024. Earth Syst. Sci. Data 17, 965–1039. doi: 10.5194/essd-17-965-2025
Gallagher, T. M., and Breecker, D. O. (2020). The obscuring effects of calcite dissolution and formation on quantifying soil respiration. Glob. Biogeochem. Cycles 34:584. doi: 10.1029/2020GB006584
Griffiths, E., and Birch, H. F. (1961). Microbiological changes in freshly moistened soil. Nature 189:424. doi: 10.1038/189424a0
Han, G., Zhou, G., Xu, Z., Yang, Y., Liu, J., and Shi, K. (2007). Soil temperature and biotic factors drive the seasonal variation of soil respiration in a maize (Zea mays L.) agricultural ecosystem. Plant Soil 291, 15–26. doi: 10.1007/s11104-006-9170-8
Hashimoto, S. (2012). A new estimation of global soil greenhouse gas fluxes using a simple data-oriented model. PLoS One 7. doi: 10.1371/journal.pone.0041962
Heinemeyer, A., and McNamara, N. P. (2011). Comparing the closed static versus the closed dynamic chamber flux methodology: implications for soil respiration studies. Plant Soil 346, 145–151. doi: 10.1007/s11104-011-0804-0
Hernandez Rodriguez, L. C., Goodwell, A., and Kumar, P. (2023). Inside the flux footprint: The role of organized land cover heterogeneity on the dynamics of observed land-atmosphere exchange fluxes. Frontiers in Water 5:1033973. doi: 10.3389/frwa.2023.1033973
Hirano, T., Kim, H., and Tanaka, Y. (2003). Long-term half-hourly measurement of soil CO2 concentration and soil respiration in a temperate deciduous forest. J. Geophys. Res. Atmos. 108:766. doi: 10.1029/2003JD003766
Huang, N., Gu, L., and Niu, Z. (2014). Estimating soil respiration using spatial data products: a case study in a deciduous broadleaf forest in the Midwest USA. J. Geophys. Res. 119, 6393–6408. doi: 10.1002/2013JD020515
Jansson, J. K., and Hofmockel, K. S. (2020). Soil microbiomes and climate change. Nat. Rev. Microbiol. 18, 35–46. doi: 10.1038/s41579
Jian, J., Steele, M. K., Day, S. D., Quinn Thomas, R., and Hodges, S. C. (2018). Measurement strategies to account for soil respiration temporal heterogeneity across diverse regions. Soil Biol. Biochem. 125, 167–177. doi: 10.1016/j.soilbio.2018.07.003
Jian, S., Li, J., Wang, G., Kluber, L. A., Schadt, C. W., Liang, J., et al. (2020). Multi-year incubation experiments boost confidence in model projections of long-term soil carbon dynamics. Nat. Commun. 11:5864. doi: 10.1038/s41467-020-19428-y
Johnson, D., Phoenix, G. K., and Grime, J. P. (2008). Plant community composition, not diversity, regulates soil respiration in grasslands. Biol. Lett. 4, 345–348. doi: 10.1098/rsbl.2008.0121
Keiluweit, M., Bougoure, J. J., Nico, P. S., Pett-Ridge, J., Weber, P. K., and Kleber, M. (2015). Mineral protection of soil carbon counteracted by root exudates. Nat. Clim. Chang. 5, 588–595. doi: 10.1038/nclimate2580
Kumar, P., Anders, A., Bauer, E., Blair, N. E., Cain, M., Dere, A., et al. (2023). Emergent role of critical interfaces in the dynamics of intensively managed landscapes. Earth Sci. Rev. 244:104543. doi: 10.1016/j.earscirev.2023.104543
Kuzyakov, Y., and Gavrichkova, O. (2010). Review: time lag between photosynthesis and carbon dioxide efflux from soil: a review of mechanisms and controls. Glob. Chang. Biol. 16, 3386–3406. doi: 10.1111/j.1365-2486.2010.02179.x
Kuzyakov, Y. V., and Larionova, A. A. (2006). Contribution of rhizomicrobial and root respiration to the CO2 emission from soil (a review). Eurasian Soil Sci. 39, 753–764. doi: 10.1134/S106422930607009X
Ladouceur, E., Isbell, F., Clark, A. T., Harpole, W. S., Reich, P. B., Tilman, G. D., et al. (2023). The recovery of plant community composition following passive restoration across spatial scales. J. Ecol. 111, 814–829. doi: 10.1111/1365-2745.14063
Lange, M., Eisenhauer, N., Sierra, C. A., Bessler, H., Engels, C., Griffiths, R. I., et al. (2015). Plant diversity increases soil microbial activity and soil carbon storage. Nat. Commun. 6:707. doi: 10.1038/ncomms7707
Lark, T. J. (2020). Protecting our prairies: research and policy actions for conserving America’s grasslands. Land Use Policy 97:104727. doi: 10.1016/j.landusepol.2020.104727
Lei, X., Shen, Y., Zhao, J., Huang, J., Wang, H., Yu, Y., et al. (2023). Root exudates mediate the processes of soil organic carbon input and efflux. Plants 12:630. doi: 10.3390/plants12030630
Li, C., Han, W., Peng, M., and Zhang, M. (2021). Abiotic and biotic factors contribute to CO2 exchange variation at the hourly scale in a semiarid maize cropland. Sci. Total Environ. 784:147170. doi: 10.1016/j.scitotenv.2021.147170
Li, N., Zhou, S., and Margenot, A. J. (2023). From prairie to crop: spatiotemporal dynamics of surface soil organic carbon stocks over 167 years in Illinois, U.S.A. Sci. Total Environ. 857:159038. doi: 10.1016/j.scitotenv.2022.159038
Liu, L., Ouyang, Z., Hu, C., and Li, J. (2024). Quantifying direct CO2 emissions from organic manure fertilizer and maize residual roots using 13C labeling technique: a field study. Sci. Total Environ. 906:167603. doi: 10.1016/j.scitotenv.2023.167603
Liu, Q., Edwards, N. T., Post, W. M., Gu, L., Ledford, J., and Lenhart, S. (2006). Temperature-independent diel variation in soil respiration observed from a temperate deciduous forest. Glob. Chang. Biol. 12, 2136–2145. doi: 10.1111/j.1365-2486.2006.01245.x
Liu, Y., Lawrence, C. R., Winnick, M. J., Hsu, H. T., Maher, K., and Druhan, J. L. (2019). Modeling transient soil moisture limitations on microbial carbon respiration. J. Geophys. Res. Biogeosciences 124, 2222–2247. doi: 10.1029/2018JG004628
Li, X., Feng, J., Zhang, Q., and Zhu, B. (2023). Warming inhibits the priming effect of soil organic carbon mineralization: a meta-analysis. Sci. Total Environ. 904:166170. doi: 10.1016/j.scitotenv.2023.166170
Li, Y., Zhang, J., Li, E., Miao, Y., Han, S., Liu, Y., et al. (2022). Changes in carbon inputs affect soil respiration and its temperature sensitivity in a broadleaved forest in Central China. Catena 213. doi: 10.1016/j.catena.2022.106197
Luo, Y., White, L. W., Canadell, J. G., DeLucia, E. H., Ellsworth, D. S., Finzi, A., et al. (2003). Sustainability of terrestrial carbon sequestration: a case study in Duke Forest with inversion approach. Glob. Biogeochem. Cycles 17:923. doi: 10.1029/2002GB001923
Makita, N., Kosugi, Y., Sakabe, A., Kanazawa, A., Ohkubo, S., and Tani, M. (2018). Seasonal and diurnal patterns of soil respiration in an evergreen coniferous forest: evidence from six years of observation with automatic chambers. PLoS One 13:622. doi: 10.1371/journal.pone.0192622
MRCC Midwest regional climate center (MRCC) (2024). West Lafayette: National Centers for Environmental Information (NCEI) and Purdue University.
National Weather Service (n.d.). Local climate data for Central Illinois (ILX) and Omaha/valley, NE, OAX. Fort Worth: National Oceanic and Atmospheric Administration.
Nichols, V., Miguez, F., Sauer, T., and Dietzel, R. (2016). Maize and prairie root contributions to soil CO2 emissions in the field. Crop Sci. 56, 2791–2801. doi: 10.2135/cropsci2016.01.0048
NOAA (n.d.). National Oceanic and Atmospheric Administration. Lincoln: National Oceanic and Atmospheric Administration.
Oh, N.-H., Kim, H.-S., and Richter, D. D. (2005). What regulates soil CO 2 concentrations? A Modeling approach to CO 2 diffusion in deep soil profiles. Environ. Eng. Sci. 22, 38–45. doi: 10.1089/ees.2005.22.38
OpenStreetMap Contributors (2023). OpenTopoMap. OpenStreetMap Foundation. Available online at: openstreetmap.org (Accessed September 12, 2023).
Ouyang, W., Lai, X., Li, X., Liu, H., Lin, C., and Hao, F. (2015). Soil respiration and carbon loss relationship with temperature and land use conversion in freeze-thaw agricultural area. Sci. Total Environ. 533, 215–222. doi: 10.1016/j.scitotenv.2015.06.109
Pearson, K. (1920). Notes on the History of Correlation. Oxford University Press on behalf of Biometrika Trust 13, 25–45. Available online at: https://about.jstor.org/terms (Accessed October 09, 2025).
Planet Team (2022). Planet Application Program Interface : In Space for Life on Earth. San Francisco, CA. Available online at: https://api.planet.com/
Polley, H. W., Derner, J. D., and Wilsey, B. J. (2005). Patterns of plant species diversity in remnant and restored tallgrass prairies. Restor. Ecol. 13, 480–487. doi: 10.1111/j.1526-100X.2005.00060.x
Prairie, T., Vinton, M. A., Hartnett, D. C., Finck, E. J., and Briggs, J. M. (1993). The University of Notre Dame Interactive effects of fire, Bison (Bison bison) Grazing and Plant Community Composition. Notre Dame: The University of Notre Dame.
Prommer, J., Walker, T. W. N., Wanek, W., Braun, J., Zezula, D., Hu, Y., et al. (2020). Increased microbial growth, biomass, and turnover drive soil organic carbon accumulation at higher plant diversity. Glob. Chang. Biol. 26, 669–681. doi: 10.1111/gcb.14777
R Core Team (2025). R: A language and environment for statistical computing. Available online at: https://www.r-project.org/ (Accessed March 28, 2025).
Roque-Malo, S., Druhan, J. L., and Kumar, P. (2022). REWTCrunch: a modeling framework for vegetation induced reactive zone processes in the critical zone. J. Geophys. Res. Biogeosciences 127, 1–31. doi: 10.1029/2021JG006562
Ryan, E. M., Ogle, K., Kropp, H., Samuels-Crow, K. E., Carrillo, Y., and Pendall, E. (2018). Modeling soil CO2 production and transport with dynamic source and diffusion terms: testing the steady-state assumption using DETECT v1.0. Geosci. Model Dev. 11, 1909–1928. doi: 10.5194/gmd-11-1909-2018
Saccardi, B., and Winnick, M. (2021). Improving predictions of stream CO2 concentrations and fluxes using a stream network model: a case study in the East River watershed, CO, USA. Glob. Biogeochem. Cycles 35:972. doi: 10.1029/2021GB006972
Schimel, D. S., House, J. I., Hibbard, K. A., Bousquet, P., Ciais, P., Peylin, P., et al. (2001). Recent patterns and mechanisms of carbon exchange by terrestrial ecosystems. Nature 414, 169–172. doi: 10.1038/35102500
Shi, Z., Allison, S. D., He, Y., Levine, P. A., Hoyt, A. M., Beem-Miller, J., et al. (2020). The age distribution of global soil carbon inferred from radiocarbon measurements. Nat. Geosci. 13, 555–559. doi: 10.1038/s41561-020-0596-z
Shi, Z., Crowell, S., Luo, Y., and Moore, B. (2018). Model structures amplify uncertainty in predicted soil carbon responses to climate change. Nat. Commun. 9:2171. doi: 10.1038/s41467-018-04526-9
Sponseller, R. A. (2007). Precipitation pulses and soil CO2 flux in a Sonoran Desert ecosystem. Glob. Chang. Biol. 13, 426–436. doi: 10.1111/j.1365-2486.2006.01307.x
Steefel, C. I., Appelo, C. A. J., Arora, B., Jacques, D., Kalbacher, T., Kolditz, O., et al. (2015). Reactive transport codes for subsurface environmental simulation. Comput. Geosci. 19, 445–478. doi: 10.1007/s10596-014-9443-x
Steinauer, K., Chatzinotas, A., and Eisenhauer, N. (2016). Root exudate cocktails: the link between plant diversity and soil microorganisms? Ecol. Evol. 6, 7387–7396. doi: 10.1002/ece3.2454
Student, B.. (1908). The probable error of a mean. Available online at: https://about.jstor.org/terms (Accessed March 09, 2025).
Tang, J., Baldocchi, D. D., Qi, Y., and Xu, L. (2003). Assessing soil CO2 efflux using continuous measurements of CO2 profiles in soils with small solid-state sensors. Agric. For. Meteorol. 118, 207–220. doi: 10.1016/S0168-1923(03)00112-6
Tang, J., Baldocchi, D. D., and Xu, L. (2005). Tree photosynthesis modulates soil respiration on a diurnal time scale. Glob. Chang. Biol. 11, 1298–1304. doi: 10.1111/j.1365-2486.2005.00978.x
Tao, F., Huang, Y., Hungate, B. A., Manzoni, S., Frey, S. D., Schmidt, M. W. I., et al. (2023). Microbial carbon use efficiency promotes global soil carbon storage. Nature 618, 981–985. doi: 10.1038/s41586-023-06042-3
Unger, S., Máguas, C., Pereira, J. S., David, T. S., and Werner, C. (2010). The influence of precipitation pulses on soil respiration - assessing the “Birch effect” by stable carbon isotopes. Soil Biol. Biochem. 42, 1800–1810. doi: 10.1016/j.soilbio.2010.06.019
Unver, A. A., and Himmelblau, D. M. (1964). Diffusion coefficients of CO2, C2H4, CsHe, and C4H8 in water from 6° to 65° C. Available online at: https://pubs.acs.org/sharingguidelines (Accessed May 08, 2025).
Vyn, T. J., Omonode, R. A., Smith, D. R., Gal, A., Hegymegi, P., and Hall, L. (2013). Soil sequestration and gas emissions of carbon after 3 decades of tillage Systems for Corn and Soybean Production in Indiana, in 17th triennial conference of the international soil tillage research organisation (ISTRO), 27.
Wang, M., Zhang, S., Wang, G., Xiao, L., Gu, B., Zheng, M., et al. (2025). Increased plant productivity exacerbates subsoil carbon losses under warming via nitrogen mining. Nat. Geosci. 18, 510–517. doi: 10.1038/s41561-025-01697-1
Winnick, M. J., Lawrence, C. R., McCormick, M., Druhan, J. L., and Maher, K. (2020). Soil Respiration Response to Rainfall Modulated by Plant Phenology in a Montane Meadow, East River, Colorado, USA. J. Geophys. Res. Biogeosci. 125:e2020JG005924. doi: 10.1029/2020JG005924
Xianjin, H., Abramoff, R., abs, E., Georgiou, K., Zhang, H., and Goll, D. (2024). Model uncertainty obscures major driver of soil carbon. Nature 618, 981–985. doi: 10.1038/s41586-023-06999-1
Xu, X., Sherry, R. A., Niu, S., Zhou, J., and Luo, Y. (2012). Long-term experimental warming decreased labile soil organic carbon in a tallgrass prairie. Plant Soil 361, 307–315. doi: 10.1007/s11104-012-1265-9
Zak, D. R., Holmes, W. E., White, D. C., Peacock, A. D., and Tilman, D. (2003). Plant diversity, soil microbial communities, and ecosystem function: are there any links? Ecology 84, 2042–2050. doi: 10.1890/02-0433
Keywords: soil CO2, soil carbon, agricultural soils, prairie soils, critical zone
Citation: Saccardi BE, Dere AL, Goodwell AE, Druhan J, Welp LR, Blair NE, Bauer E, Haken J, Jimenez-Castaneda ME, Filley T and Kumar P (2025) The scale of influence: how different drivers determine CO2 production at event, daily, and seasonal scales. Front. Water. 7:1638541. doi: 10.3389/frwa.2025.1638541
Edited by:
Bhavna Arora, Berkeley Lab (DOE), United StatesReviewed by:
Devon Kerins, University College Dublin, IrelandKayalvizhi Sadayappan, The Pennsylvania State University (PSU), United States
Copyright © 2025 Saccardi, Dere, Goodwell, Druhan, Welp, Blair, Bauer, Haken, Jimenez-Castaneda, Filley and Kumar. This is an open-access article distributed under the terms of the Creative Commons Attribution License (CC BY). The use, distribution or reproduction in other forums is permitted, provided the original author(s) and the copyright owner(s) are credited and that the original publication in this journal is cited, in accordance with accepted academic practice. No use, distribution or reproduction is permitted which does not comply with these terms.
*Correspondence: Brian E. Saccardi, c2FjY2FyZGlAaWxsaW5vaXMuZWR1