 Roxana Nicte Ha Hughes Lomelin1
 Mario Alberto Hernández-Hernández2*
 Sonia Tatiana Sanchez Quispe1
 Josué Medellín-Azuara3
 J. Andrés Morande3,4
 Thomas Harmon4
- 1Hydraulics Department, Universidad Michoacana de San Nicolás de Hidalgo, Morelia, Mexico
- 2Institute of Geophysics, Universidad Nacional Autonoma de Mexico, Mexico City, Mexico
- 3Water Systems Management Laboratory, University of California Merced, Civil and Environmental Engineering, Merced, CA, United States
- 4Sierra Nevada Research Institute, University of California Merced, Civil and Environmental Engineering, Merced, CA, United States
This research report evaluates and proposes strategies to address the ongoing problem of elevated fluoride and arsenic concentrations in the Aguascalientes Valley aquifer (AVA) in Mexico, which serves as the main water supply for almost 1.35 million people and supports over 65,000 hectares of irrigated agriculture. First, we evaluate the AVA’s historical piezometric surface and fluoride and arsenic concentrations. We then develop simplified groundwater flow and transport models to integrate regional hydrogeological and water quality datasets, providing a basis for recommended management interventions. Results indicate mean fluoride concentrations of 2.30 ± 1.43 mg/L (MX fluoride standard = 1.5 mg/L), with higher levels southeast of Aguascalientes City and a positive temporal trend. Arsenic concentrations average 0.0126 ± 0.008 mg/L (MX As standard = 0.01 mg/L), with higher concentrations north of the city and a negative temporal trend. The global average concentration in both cases exceeds the national and international regulatory limits, underscoring the need for immediate action. The piezometric level information was sufficient to reproduce the hydrodynamic behavior of the aquifer reliably, while the transient flow model successfully reproduced the spatial gradient of concentrations. According to the developed mathematical models, water security issues are observed within the AVA, while increasing drawdowns and As and F concentrations. To improve water quality and quantity in the AVA, sustainable practices should be implemented, including potential actions to restore groundwater levels, such as managed aquifer recharge options and nature-based solutions.
1 Introduction
Geographical and climatological conditions in Aguascalientes, Mexico, render surface water sources scarce, and groundwater supplies about 94% of the water demand (Hernández-Marín et al., 2018). Most extractions come from the Aguascalientes Valley aquifer (AVA), which underlies 95% of the population (1.35 million inhabitants) and economic activity of the state (Sainz-Santamaria and Martinez-Cruz, 2019). Not surprisingly, regional water budget estimates have concluded that the current level of extraction is excessive, roughly 80% above sustainable extraction volumes (SEMARNAT, 2012; Sainz-Santamaria and Martinez-Cruz, 2019). To address this, a ban on further AVA exploitation has been in place since May 1963, although unregistered groundwater continues to occur. This policy forbids the installation of new production wells and limits urban, industrial, agricultural, and other uses, but achieving compliance is difficult without monitoring systems or mathematical models that are useful for decision-making, leading to unsustainable exploitation of groundwater.
Groundwater quality represents another issue in Aguascalientes. The intensive extraction of groundwater from aquifers combined with a natural presence of toxic elements can increase their concentrations (Armienta and Segovia, 2008), as is the case of fluoride (F–) and arsenic (As) in the AVA. Fluoride and arsenic concentrations have long been a focal point in regional water quality assessments. These contaminants place the population at risk of chronic-degenerative diseases (Commission on Habitat, Environment and Sustainability, 2016). The harmful effects of fluoride (dental and bone fluorosis, conditions of the liver, kidneys, heart, lungs, thyroid, development of the nervous system and reproductive abilities) and arsenic (lesions and cancer of the skin, lungs, heart, vascular system and kidneys) are well-documented (Chandrajith et al., 2020). The World Health Organization (WHO, 2018) has established Maximum Permissible Limits (MPL) for fluoride and arsenic in water for human consumption at 1.5 and 0.01 mg/L, respectively, which align with Mexican standards (NOM-127-SSA1-2021, 2022).
Computational models are useful for simulating groundwater pumping, flow dynamics, and associated contaminant transport behavior. Given adequate spatiotemporal data on aquifer properties, groundwater levels, and contaminant concentrations, such models provide quantitative connections between past, present, and future groundwater conditions. For instance, simulations can be used to analyze various phenomena that arise from changes in the system’s physical parameters, such as modifications in extraction rates and locations, or engineered aquifer recharge aimed at mitigating overdraft (González-Mendoza, 2016). While model outcomes are subject to uncertainties, they nonetheless enhance decision-making and water resources management (Epstein, 2008).
This research report aims to assess the current condition of AVA groundwater quantity and quality, and to provide advice on water security questions in this heavily populated region. Previous works on the area trace back to the 1971 (Ariel Construcciones SA in 1971, Consultores SA in 1981, and SARH in 1987, described at CONAGUA, 2020), where the first hydrogeological study was developed, presenting the conceptualization of the functioning of the aquifer system, integrating information from adjacent valleys (Chicalote-Calvillo and Venadero), and recognizing their interconnection; more recently Martín-Clemente et al. (2015) and De Figueroa Jesús, 2007 present estimates of water availability that reveal a water deficit such that the groundwater reserve is not renewable in terms of the annual balance; lastly, Hughes Lomelín et al. (2023, 2024), integrates the pre-existing information regarding the mathematical modeling of the aquifer, proposing a simplified version of flow simulation, including a particular study on the estimation of hydraulic conductivity based on previous lithological studies of the Aguascalientes Valley. We analyzed piezometric head and water quality data, using GIS and descriptive statistics to assess data quality and identify spatiotemporal trends. Groundwater flow (MODFLOW) and transport (MT3D-MS) models were parameterized using available hydrogeologic information, and calibrated and validated using subsets of the data (SM-1). Potential next steps toward refining our understanding of the problem are then discussed, along with potential management strategies aimed at groundwater sustainability.
2 Materials and methods
2.1 Study area
The AVA is located in the state of Aguascalientes in the high plains of Central Mexico (Figure 1). The elevation varies from 1,900 m on the valley floor to nearly 3,000 m in the surrounding mountain ranges (INEGI, 2013). The climate is semi-arid (BS1kw Köppen) with an average annual temperature ranging between 18 and 22°C, while the average annual precipitation is limited to 510 mm, due to its location relative to the subtropical high-pressure belt and the general orientation of the mountain ranges that limit and isolate it from the seas, distributed mainly between May and October (García Amaro de Miranda, 2003), and an average annual potential evaporation of 2,010 mm (National Water Commission; CONAGUA, 2020). Administratively, the AVA belongs to the Hydrological Region VIII “Lerma-Santiago-Pacífico” and the Hydrological Region No. 12 “Lerma-Chapala-Santiago.” In this report, we focus on the narrow valley region of the AVA, consistent with prior work on the AVA (CONAGUA, 2020; Guerrero Martínez, 2016, 2020), where data are available and where most of the human activity occurs.
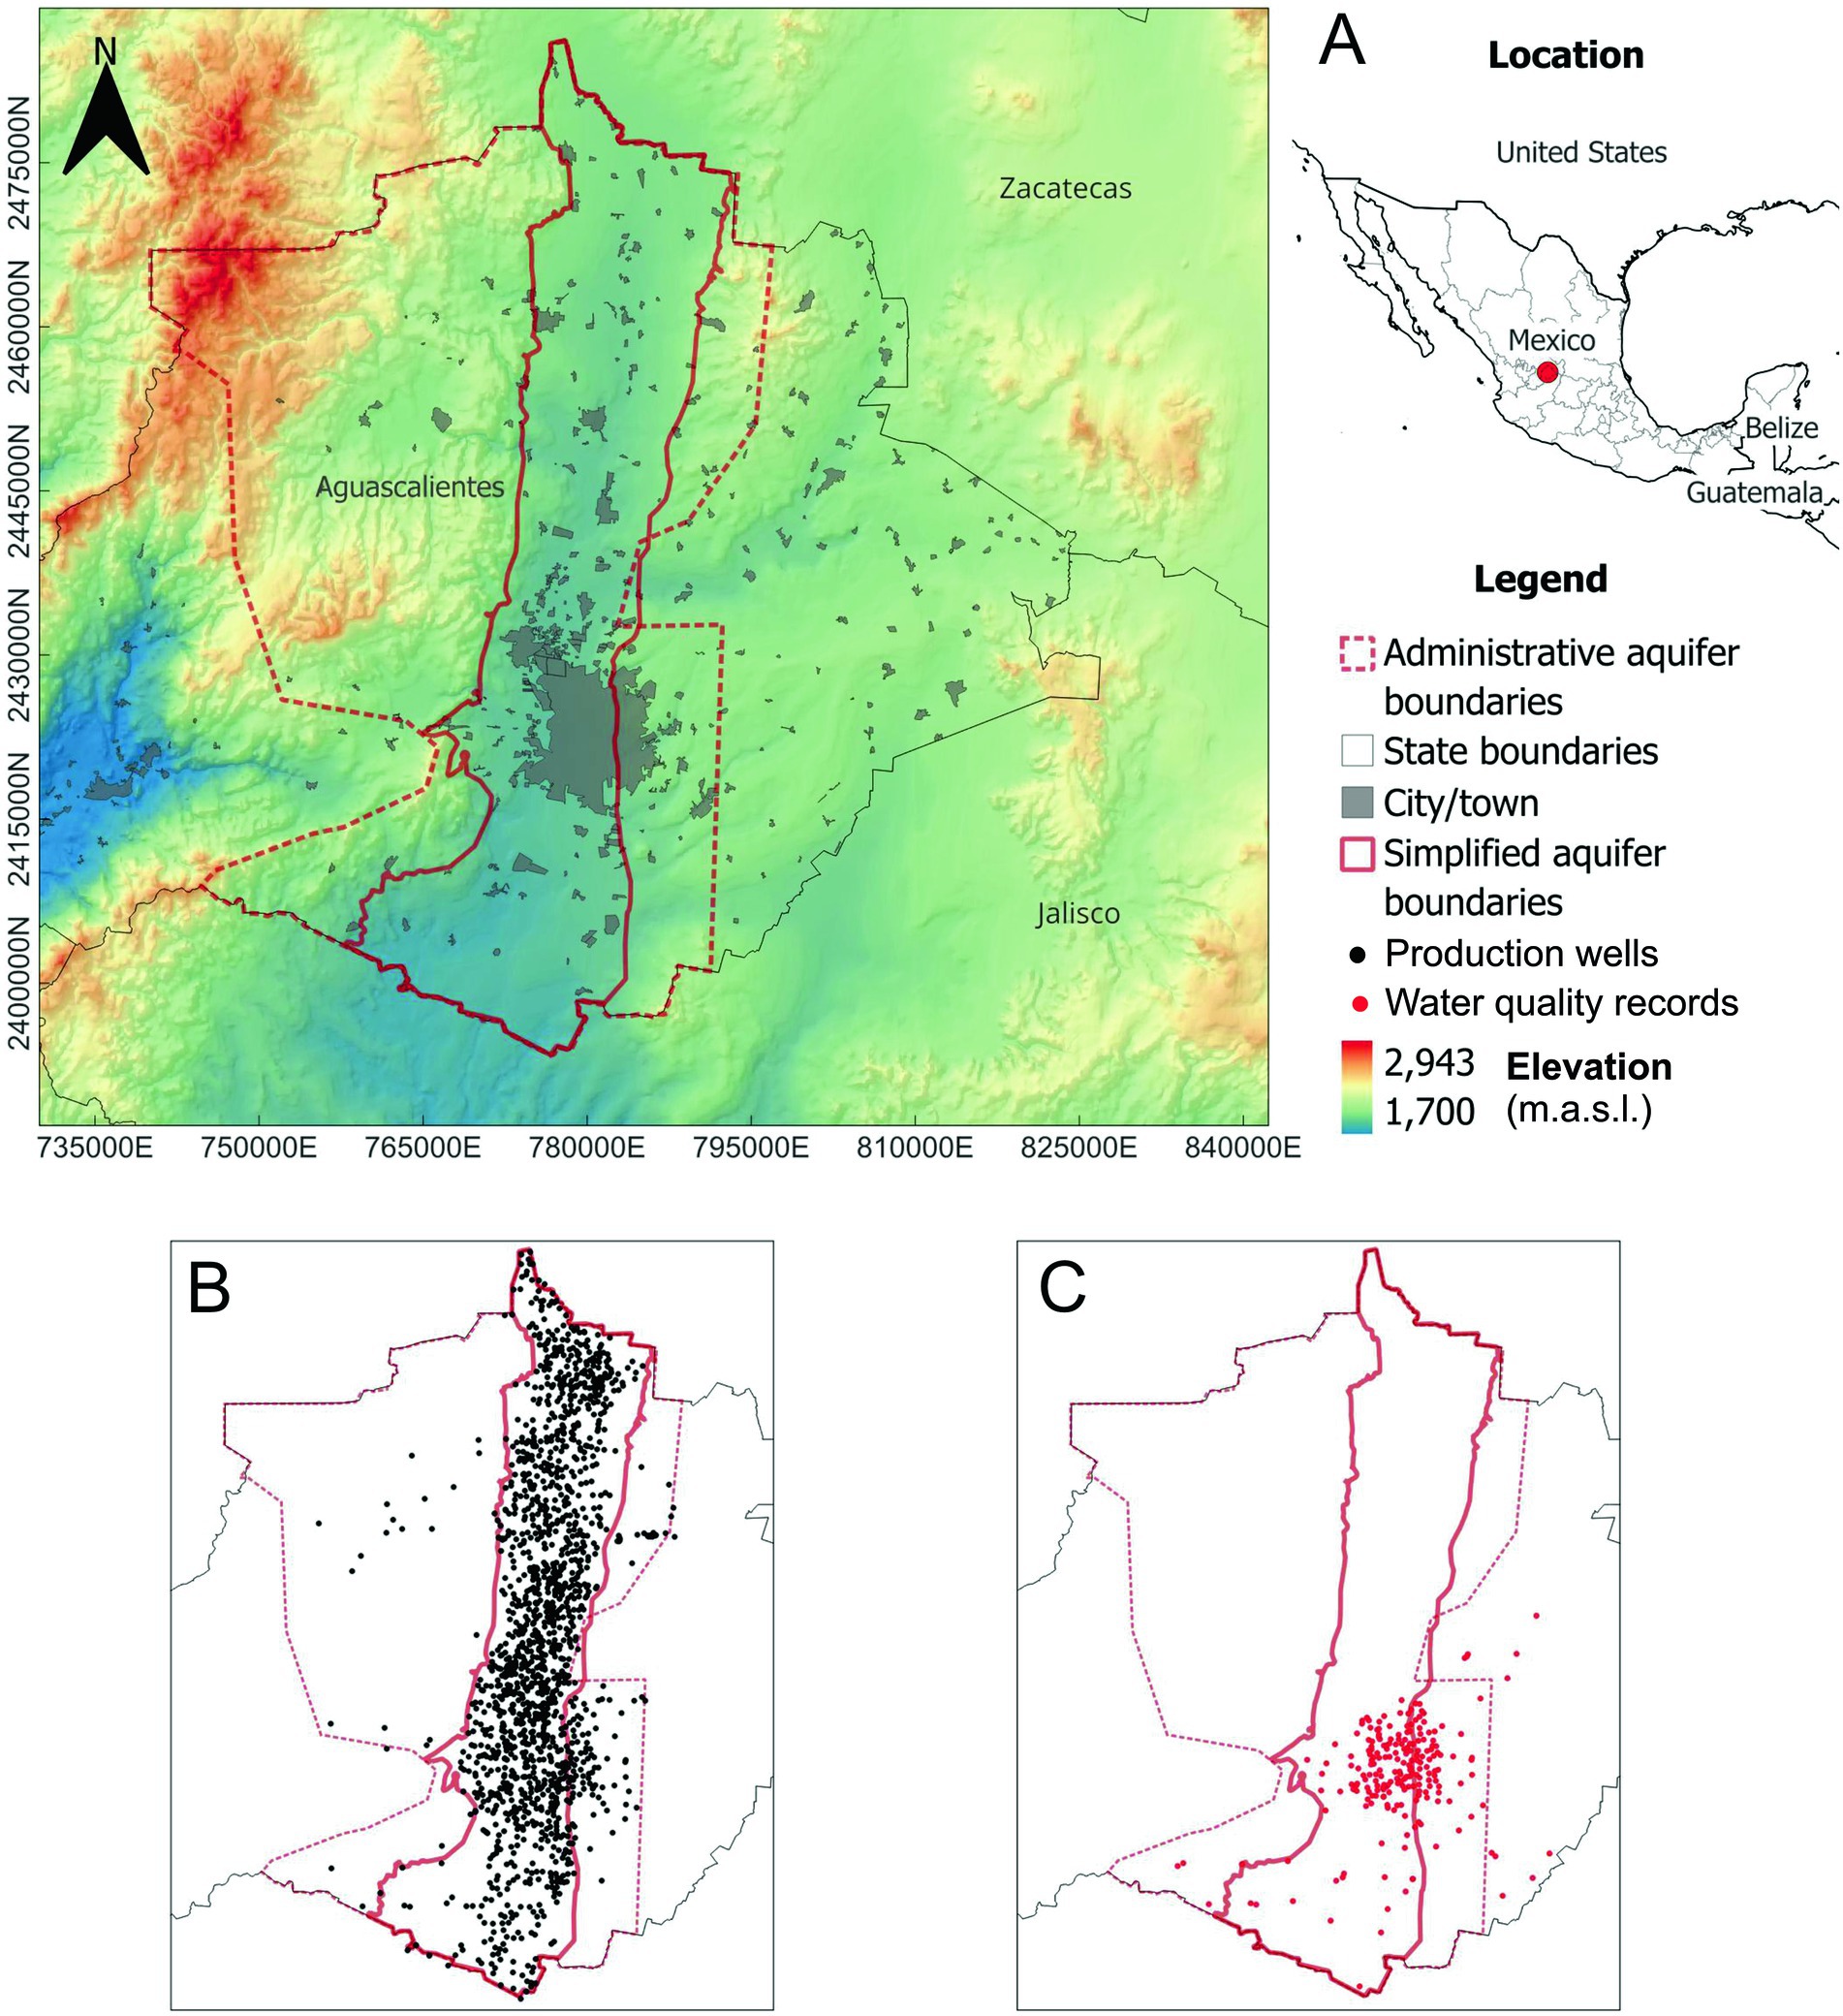
Figure 1. (A) Location map of the Aguascalientes Valley aquifer (AVA). (B) Location of production wells. (C) Wells with water quality records.
The regional geology associated with the AVA is the result of the events that originated the Sierra Madre Occidental (CONAGUA, 2020), with units of different lithographic characteristics, including metamorphosed strata from the Cretaceous era, volcanic in the Sierra Madre Occidental from the Tertiary, and Quaternary, and basalt/alluvial material from the Quaternary. Based on well boring logs, CONAGUA (2020) describes the AVA as an unconfined, heterogeneous, and anisotropic aquifer, where groundwater flows through three different media: (i) porous media with primary, secondary, intergranular, and fractured permeability; (ii) fractured media with secondary permeability; (iii) double porous media with combined, intergranular and fracture permeability. The AVA was simplified considerably in the groundwater model developed for this work.
2.2 Data acquisition and sources
The data required for groundwater and transport modeling of the aquifer were obtained from the databases of CONAGUA and the local Citizen Commission for Drinking Water and Sewerage of the Municipality of Aguascalientes (CCAPAMA, 2022), as well as complementary sources from CONAGUA (2020) and previous studies (Hernández-Marín et al., 2018; Guerrero Martínez, 2016; De Figueroa Jesús, 2007). Groundwater piezometric head and water quality data (1,469 and 320 sampling points, respectively) was collected for the period 1985–2014.
To assess AVA groundwater conditions, we obtained data from CONAGUA (2020), which showed 1,830 registered users (1,769 deep-drilled wells and 61 shallow wells), with 1,468 active at the time. The available piezometric data is specified by sampling point (usually a production well) and collected annually (from 1990 through 2014), once the pumping is turned off and static conditions in the well are reached. Scarce and semiannual F- and As concentration data were obtained from 320 wells from 2003 to 2022, using a limited subset (years 2004–2014) to later compare the performance of the model. These concentrations were obtained from the water quality laboratory at the local water utility (CCAPAMA), in accordance with Mexican standards (NMX–AA–077–SCFI–2001, 2002—Test Method, 2016). Piezometric data and F- and As concentrations were spatially distributed through kriging to obtain gridded maps for each available year. Simple statistics (mean, standard deviation, maximum, and minimum values) were determined to describe and visualize the piezometric surface and chemical concentrations through time.
2.3 Groundwater flow and transport modeling
We used MODFLOW (Harbaugh, 2005) within the ModelMuse (Winston, 2022) users’ interface to develop the AVA groundwater model. We employed a single-layer model structure, owing to the preliminary nature of this effort. Given the digital elevation model (DEM) for the region and the well borehole logs, the aquifer model has a variable thickness, from 300 m to the west to 450 m to the East, which was consistent with thicknesses reported in prior work (Pacheco-Martínez et al., 2013). We calculated an effective value of hydraulic conductivity for each well using a weighted average of estimated values from well borehole records (SM-2, Sánchez San Román, 2022). Simple kriging was then used to create a gridded hydraulic conductivity product as the initial MODFLOW layer. We applied a uniform initial value of 0.16 for the aquifer-specific yield parameter (Sy), as proposed by CONAGUA (2020). The resulting model geometry included 335 active 2 × 2 km cells (828 total) arranged in 46 rows × 18 columns in the single, heterogeneous layer.
The model simulations required information on natural and anthropogenic inflow and outflow, such as potential recharge from precipitation (vertical recharge), well extractions based on contracted annual values, and horizontal groundwater flows. In order to estimate vertical recharge, we employed annual infiltration rates obtained from a monthly HBV precipitation-runoff model (Bergström, 1992) calibrated for the area (Hughes Lomelín, 2023). Regional inflows and outflows were distributed within the model boundaries, with values based on an AVA water budget created by CONAGUA (2020).
Starting with the initial piezometric surface, the groundwater model was executed in a transient state for 29 years (1985–2014), driven by annual changes in extraction and vertical recharge. The model was calibrated following a scheme focused on 10 wells located along a longitudinal transect (A-A’ in Figure 2), considering the piezometric levels of the years 1990, 1996, and 2000, and validated using 2007 and 2014. We adjusted the hydraulic conductivity (K) and specific yield (Sy) distributions in the model by applying a scaling factor, optimizing model-fitting metrics for the 11 transect well locations (Moriasi et al., 2007; Lucas Urbina, 2018; Roohollah et al., 2020; Akter and Ahmed, 2021) (Figure 2; Supplementary Tables 1, 2).
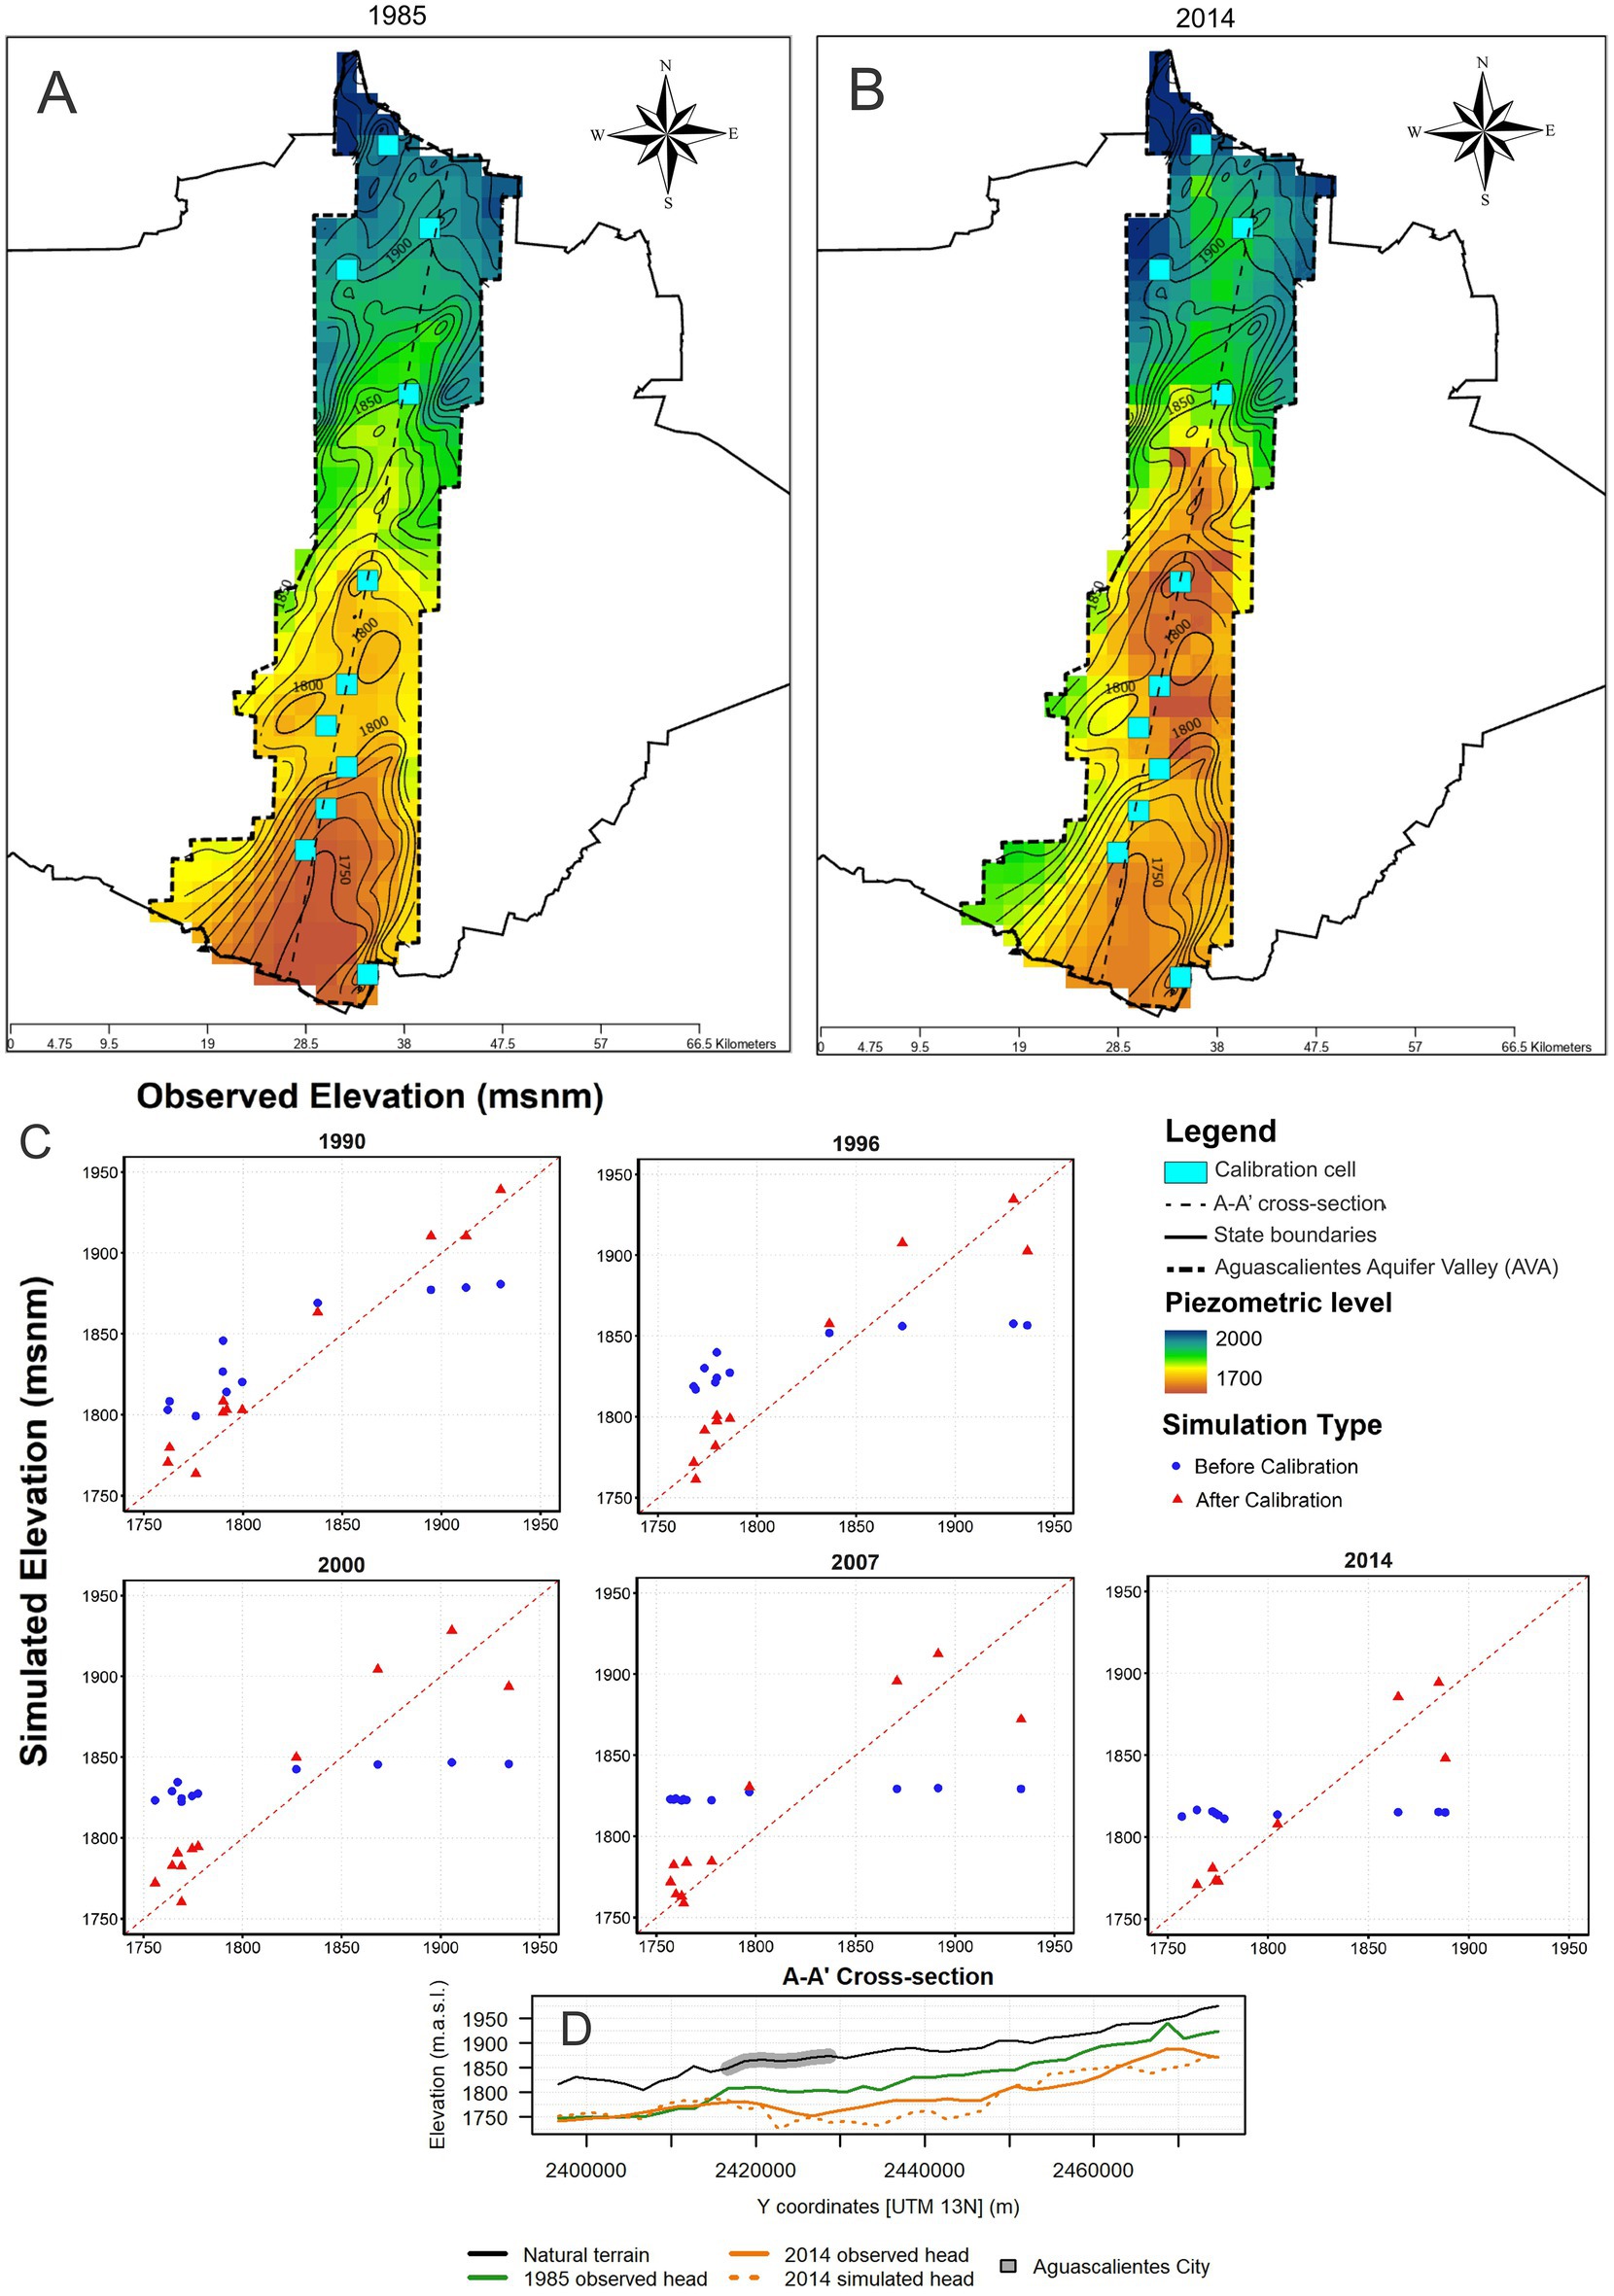
Figure 2. (A,B) MODFLOW simulation (1985–2014) for the Aguascalientes Valley Aquifer (AVA) model. (C) Calibration (1990, 1996, 2000) and validation outcomes (2007, 2014), associated with 10 observation cells. (D) Cross-section showing changes in simulated and observed piezometric head in the AVA model.
In the case of the solute transport model (MT3DMS, Zheng, 2012) utilizes groundwater discharge distributions from the groundwater flow model to distribute chemical solutes by advection and dispersion. Its model geometry was also developed using ModelMuse with the same computational mesh as the MODFLOW model, but reducing the total active cells to 248, to overlap with the region where water quality data were available. Initial fluoride and arsenic concentration conditions were set to the gridded 2003 values, and the source zones were indicated in MT3DMS cells associated with the maximum observed concentrations (Sathe and Mahanta, 2019). The transport simulations were limited to the period 2003–2014, the final year of the MODFLOW simulation.
The transport model calibration and validation were carried out similarly to the flow model, applying scaling factors to the initial longitudinal dispersivity and porosity values. Initial values for longitudinal hydrodynamic dispersion and effective porosity were assigned to two zones with different geology, corresponding to conglomerate sandstone and rhyolitic tuff. These values, both initial and calibrated, are shown in Table 1. In the absence of additional information about these contaminants in the aquifer, both fluoride and arsenic were assumed in this work to behave as nonreactive and nonsorbing solutes (i.e., conservative tracers). While the fluoride anion is not expected to react or sorb to aquifer sediments or confining units, arsenic is known to adsorb to various metal oxides and clays (Stollenwerk, 2003). However, assuming that the current regional dissolved concentrations represent long-term steady-state plumes with respect to the source zones, we can use the conservative tracer assumption to facilitate the simulations; although geogenic sources are expected in the area due to thermalism and similar behavior in other aquifers in the region (Morales-deAvila et al., 2023; Padilla-Reyes et al., 2024). Due to the limited simulation period, fluoride and arsenic observations were applied to model calibration and validation, respectively. The transport model was calibrated by comparing observed and simulated fluoride concentrations in a group of eight additional calibration cells, which differed from those used to calibrate the groundwater model due to the reduced modeled area and the location of the sampling wells. Kriging interpolation method was chosen for both, piezometric and water quality distributions, since correlations between observations in space is better represented by the spatial structure of the variogram, avoiding over-smoothing the spatial distributions.
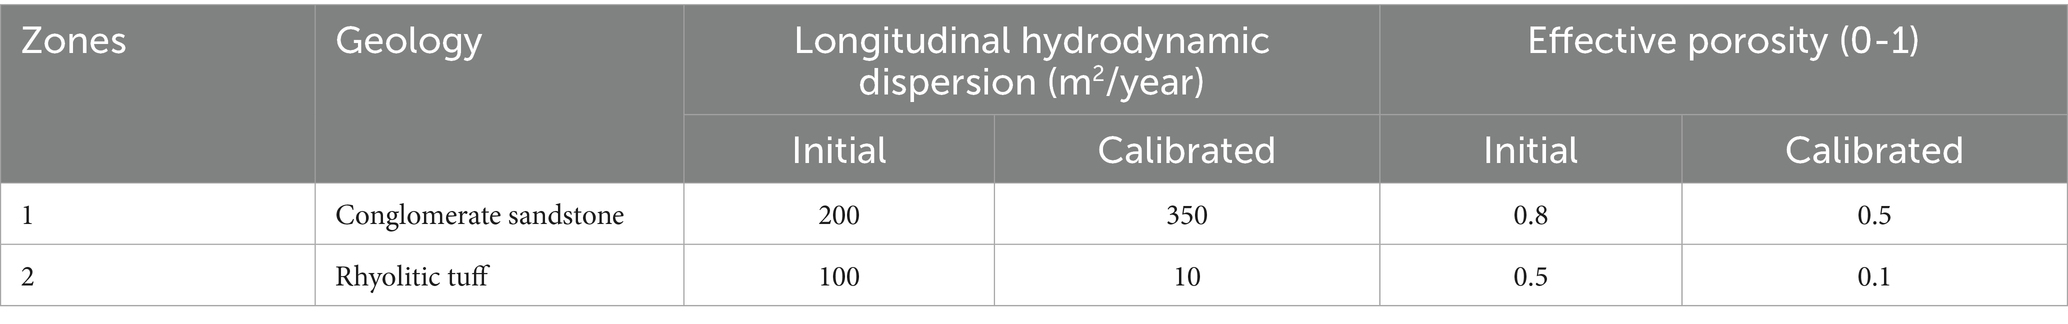
Table 1. Longitudinal hydrodynamic dispersion and effective porosity values in the two geological zones of the study, proposed with an initial value (according to literature, Custodio and Llamas, 1983; Vázquez-Sánchez and Jaimes-Palomera, 1989; Gómez, 2016), and then calibrated by a trial and error procedure.
3 Results
3.1 Groundwater flow model
Groundwater recharge as the main input to the system was obtained in a parallel work developed for the area, then it was later imposed as a lateral flow entering the active domain of the modeled aquifer. Later, the observed AVA piezometric surface was compared with observations, showing a decrease throughout the 1990–2014 period (Figure 2), as expected with increasing population and groundwater extractions during this period. The calibrated groundwater model reflected the slope of the observed surface, ramping downward from north to south in accordance with regional topography (see section A-A’ in part D of Figure 2, years 1990, 1996, 2000; Supplementary Table 1, models fit quality indexes; Supplementary Table 2, classification of the fit quality), but was consistently above the observed surface. For the validation of the groundwater model, we used the results for 2007, were simulated piezometric head is more consistent with the observed water table. Although 2014 simulations yielded acceptable results, they significantly overestimated drawdowns in the urban region of the AVA. Additionally, the hydrological model shows a lower mean precipitation in 2009–2014 (305 mm/year) compared to previous years (418.4 mm/year in 2004–2008), that might have impacted the recharge in the period. The argument of increasing urbanization and impervious surfaces supports the hypothesis of decreased recharge in the AVA area.
3.2 Groundwater transport model
In the case of the transport model, the observed arsenic concentrations at the sources were consistently above the maximum permissible levels during the studied period, as were the fluoride concentrations, except for source 3 (Figure 3). For the calibration points, the F- concentrations range from about 1 to more than 4 mg/L; As levels clustered between 0.015 and 0.0175 mg/L for 2004 and 2006 data. Later observations found the arsenic data in the range of 0.009 and 0.017 mg/L, suggesting that some dilution occurred in later years. Recalling that the fluoride observations were used for calibration, the MT3DMS simulations show good agreement with observed concentrations over a range of values, particularly for the earlier 3 years (2004, 2006, 2008). The model slightly overestimates the observed concentrations in these years. However, in the later cases (2011, 2014), there is significantly more variation in the observed fluoride concentrations, and the model underestimates are more evident.
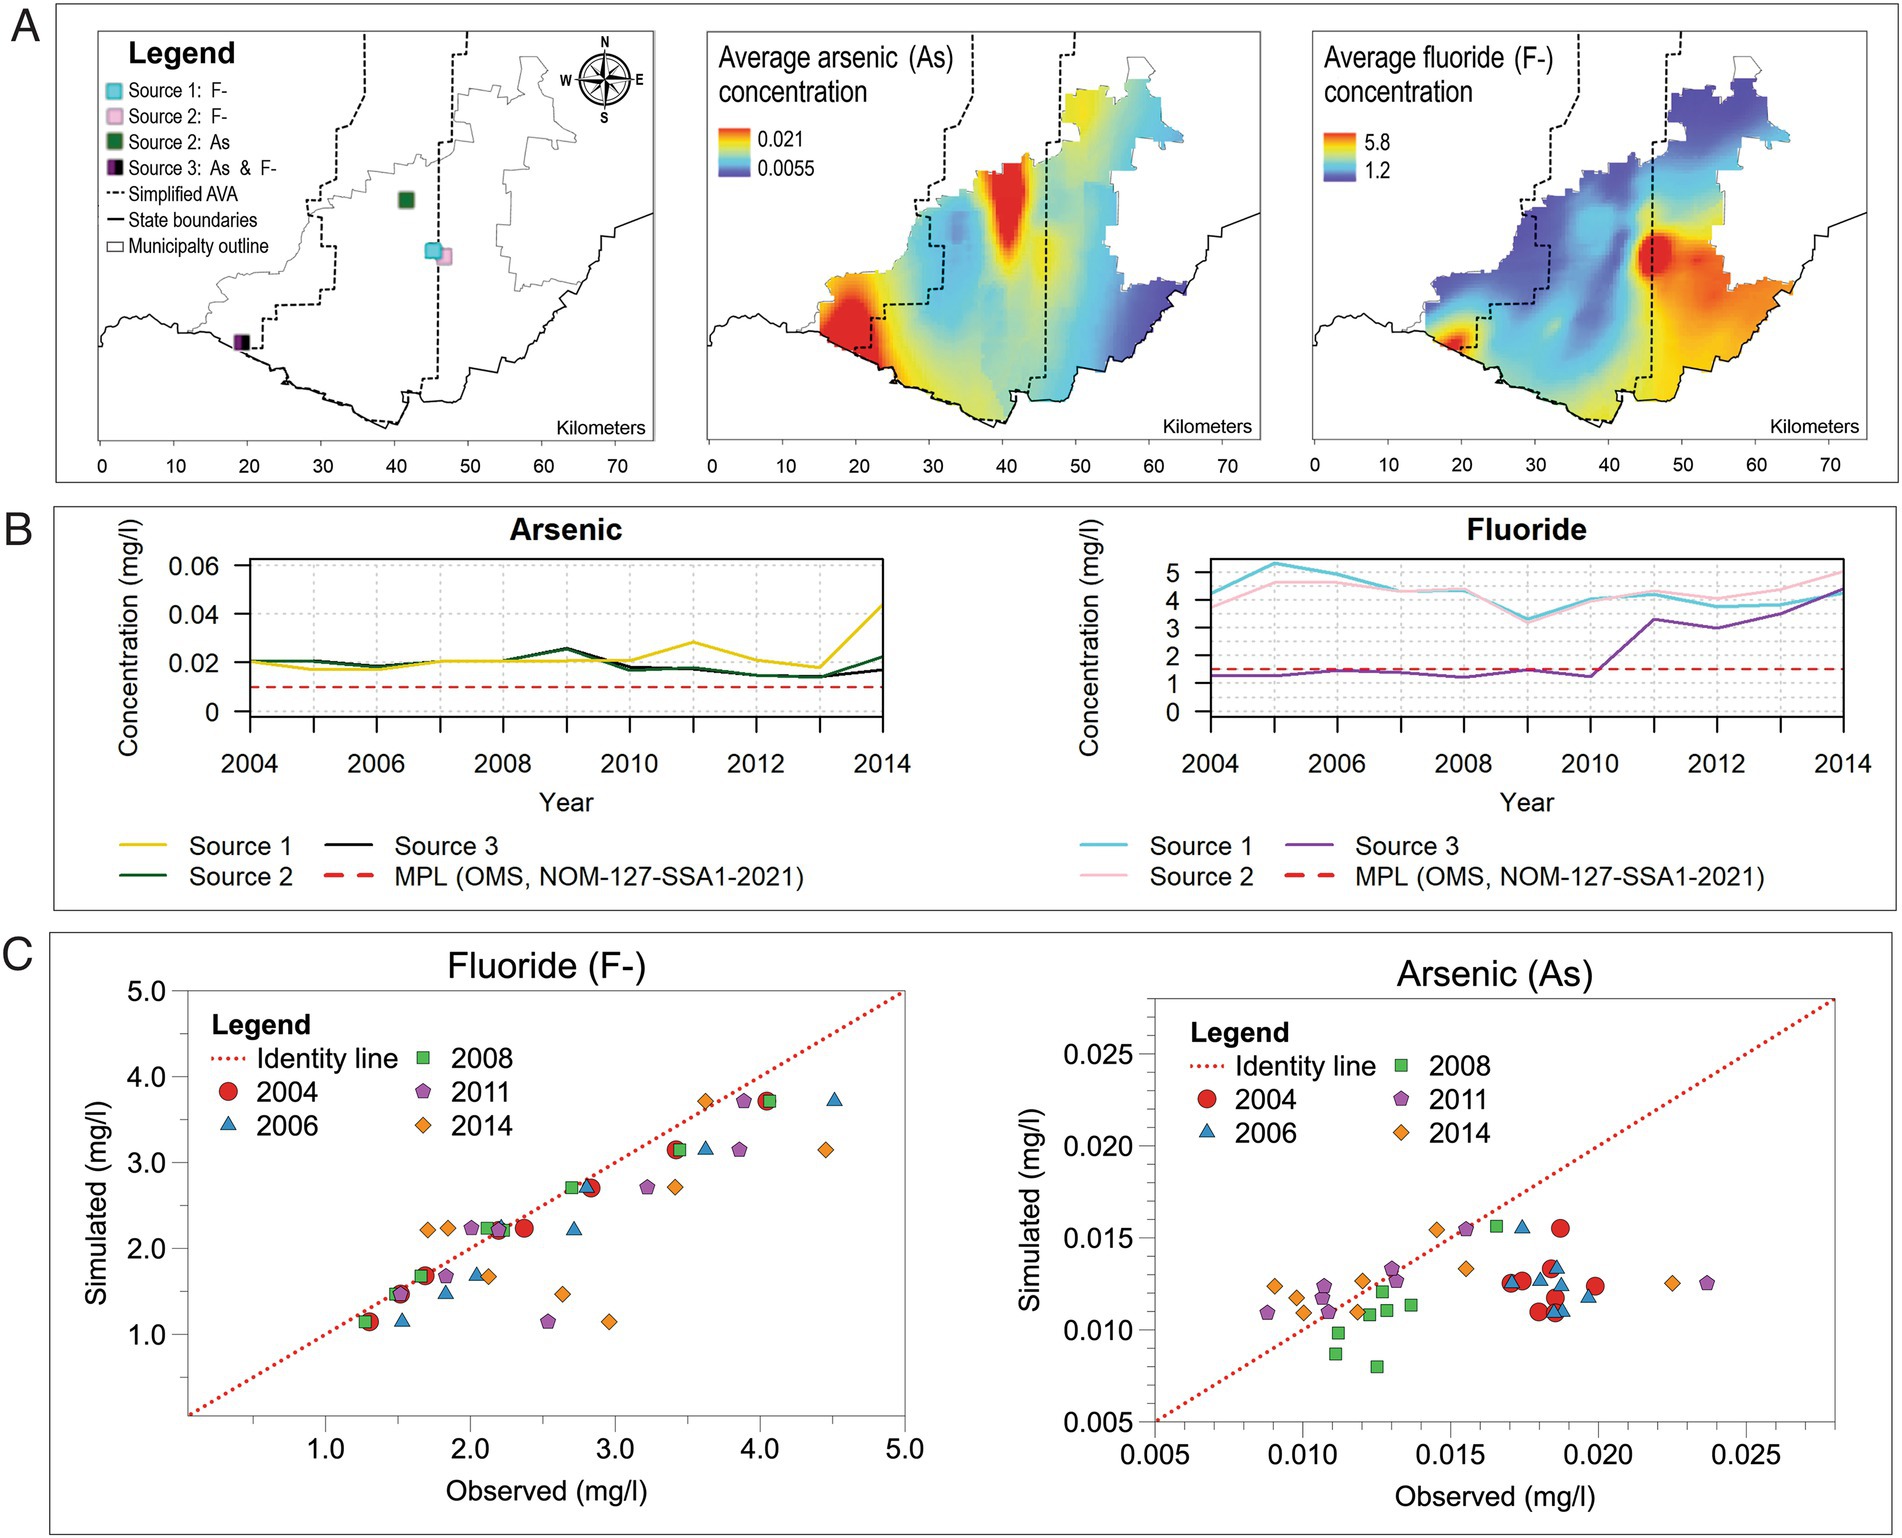
Figure 3. (A) Transport model MT3DMS simulation outcomes for the Aguascalientes Valley Aquifer. (B) Evolution of As and F- concentrations, compared with national and international maximum permit limits. (C) Comparison of simulated and observed concentrations for F- and As.
The validation data (arsenic) are difficult to describe, as the earlier outcomes (2004, 2006) exhibit a clustered pattern, with the simulation consistently overestimating the observed concentrations. Nevertheless, the validation improved in the later arsenic data (2008, 2011, 2014), as the clustering disperses.
4 Discussion
The data and models presented in this study highlight water security issues in the Aguascalientes Valley aquifer (AVA), a groundwater reservoir that supports 1.35 million people and US$156 million in annual agricultural revenue. The aquifer exhibits increasing drawdown and As and F- concentrations.
The flow and transport models are simplistic, single-layer models, but both captured the dynamics of the AVA relatively well. However, the flow model tends to underestimate aquifer drawdown relative to observed values during its calibration, and shifts to overestimating drawdown in the validation period. As noted, we used water concessions as extraction volumes in the model. Under-extraction (relative to water concessions) and increased extraction in the respective calibration and validation phases explain the differences in drawdown estimation, as reported in previous works when dealing with scarce data (Navarro-Farfán et al., 2024), and intense groundwater use (Ávila-Carrasco et al., 2023; Rubio-Arellano et al., 2023).
The AVA transport simulations capture the behavior of F- dispersion better than that of As, which exhibited concentrations clustered at about 18 ppb in 2004 and 2006 before dispersing to agree more with the later simulations. This behavior is challenging to explain, but may suggest that changes in pumping after 2006 modified the system, causing the As concentrations to disperse, as well as REDOX and pre-existing geochemical conditions might also contribute to the control of the release and transport of these and other contaminants. The aforementioned adsorption tendencies of As species may also complicate its transport behavior, particularly if new pumping results in As transport into previously uncontaminated zones. Decreases in the simulated F- concentrations are in agreement with observed concentrations in recent years, which could also be caused by changes in pumping extraction or the addition of fresh water coming from leakages in the water supply system and agricultural irrigation returns, causing oxidation of water with current high concentrations, as occurs in the San Joaquín Valley California (Haugen et al., 2021).
The results of this research highlight the need for a more comprehensive investigation of the AVA system, including potential actions to restore and implement sustainable groundwater practices. A good first step would involve revisiting the soil boring logs in the region, developing a multi-layer AVA flow and transport model, and an intensified groundwater monitoring program (quarterly at a minimum). An effort to identify the critical horizontal and vertical locations of F- and As should be coupled with the expanded modeling effort. The resulting model would help identify future extraction and recharge strategies to deliver water while minimizing further water quality degradation. Once calibrated, the model would also be valuable for assessing the impact of climate change and human behavior modifications on the AVA system.
The long-term sustainability of the regions will depend on more judicious use of the AVA system. First and foremost, legal restrictions on current and pending groundwater extraction will need to be more closely monitored and enforced. Second, coupling water reuse and managed aquifer recharge (MAR) with population growth and wastewater treatment planning is strongly recommended, or a combination with nature-based solutions such as constructed wetlands and limestone filters. Examples of that management can be seen in the San Joaquin Valley California (Casillas-Trasvina et al., 2025; Haugen et al., 2021), and in Central Valley California (Warrack and Kang, 2021), which can be replicable in the AVA, where similar conditions of decrease in arsenic concentration is occurring, possibly caused by the movement downwards of oxidizing groundwater. Such efforts should include careful studies on the role of changes in recharge water chemistry on the mobilization and transport of F- and, particularly As, as well as trace chemicals typically present in water reuse scenarios, such as chloride and nitrate compounds.
Data availability statement
The raw data supporting the conclusions of this article will be made available by the authors, without undue reservation.
Author contributions
RH: Formal analysis, Writing – original draft, Methodology, Investigation, Visualization, Validation, Writing – review & editing. MH-H: Conceptualization, Investigation, Writing – original draft, Writing – review & editing, Supervision, Visualization, Methodology. SS: Methodology, Supervision, Writing – review & editing, Investigation. JM-A: Writing – review & editing, Investigation, Formal analysis, Methodology, Validation. JM: Supervision, Writing – review & editing, Resources, Visualization, Project administration. TH: Methodology, Writing – review & editing, Supervision, Conceptualization, Validation, Formal analysis.
Funding
The author(s) declare that financial support was received for the research and/or publication of this article. This research project was partially funded by the Secretariat of Science, Humanities, Technology, and Innovation (SECIHTI), and the collaboration among institutions was facilitated by the UC ALIANZA MX strategic grant IRGUCMX2021-02 Water Management to Increase Climate Extreme Resilience for Agriculture, Ecosystems, and Communities in the US and Mexico.
Acknowledgments
We thank the efforts of Morgan Malone and Daniel Marroquin for their support in the manuscript.
Conflict of interest
The authors declare that the research was conducted in the absence of any commercial or financial relationships that could be construed as a potential conflict of interest.
The author(s) declared that they were an editorial board member of Frontiers, at the time of submission. This had no impact on the peer review process and the final decision.
Generative AI statement
The author(s) declare that no Gen AI was used in the creation of this manuscript.
Any alternative text (alt text) provided alongside figures in this article has been generated by Frontiers with the support of artificial intelligence and reasonable efforts have been made to ensure accuracy, including review by the authors wherever possible. If you identify any issues, please contact us.
Publisher’s note
All claims expressed in this article are solely those of the authors and do not necessarily represent those of their affiliated organizations, or those of the publisher, the editors and the reviewers. Any product that may be evaluated in this article, or claim that may be made by its manufacturer, is not guaranteed or endorsed by the publisher.
Supplementary material
The Supplementary material for this article can be found online at: https://www.frontiersin.org/articles/10.3389/frwa.2025.1638569/full#supplementary-material
References
Akter, A., and Ahmed, S. (2021). Modeling of groundwater level changes in an urban area. Sustain. Water Resour. Manag. 7:7. doi: 10.1007/s40899-020-00480-x
Armienta, M. A., and Segovia, N. (2008). Arsenic and fluoride in the groundwater of Mexico. Environ. Geochem. Health 30, 345–353. doi: 10.1007/s10653-008-9167-8
Ávila-Carrasco, J. R., Hernández-Hernández, M. A., Herrera, G. S., and Hernández-García, G. J. (2023). Urbanization effects on the groundwater potential recharge of the aquifers in the southern part of the basin of Mexico. Hydrol. Res. 54, 663–685. doi: 10.2166/nh.2023.103
Bergström, S. (1992). The HBV model – Its structure and applications, SMHI reports hydrology, Norrköping, Sweden, RH 4
Casillas-Trasvina, A., Meles, M. B., Cui, W., Hatch, T., Bradford, S., and Harter, T. (2025). Integrated hydrologic modeling of groundwater flow dynamics and recharge in the San Joaquin Valley. J. Hydrol. :660-133377. doi: 10.1016/j.jhydrol.2025.133377
CCAPAMA (2022). Datos de pozos de monitoreo para el Valle de Aguascalientes en el municipio de Aguascalientes. [Well-monitoring Data for the Aguascalientes Valley Aquifer in Aguascalientes Municipality]
Chandrajith, R., Diyabalanage, S., and Dissanayake, C. B. (2020). Geogenic fluoride and arsenic in groundwater of Sri Lanka and its implications to community health. Groundw. Sustain. Dev. 10:100359. doi: 10.1016/j.gsd.2020.100359
Commission on Habitat, Environment and Sustainability. (2016). Bases del proyecto de implementación de sistemas de captación de agua pluvial y modelos de agua segura ante la problemática de contaminación por arsénico, fluoruro y otros elementos en aguas subterráneas de consumo humano en México. [Foundations of the Project for Implementing Rainwater Harvesting Systems and Safe Water Models in Response to the Problem of Arsenic, Fluoride, and Other Contaminants in Groundwater for Human Consumption in Mexico]
CONAGUA (2020). Actualización de la Disponibilidad Media Anual de Agua en el Acuífero del Valle de Aguascalientes (0101), Estado de Aguascalientes
Custodio, E., and Llamas, M. R. (1983). Hidrología Subterránea. Barcelona, Spain: (2 tomos) Omega, 2350.
De Figueroa Jesús, M. M. (2007). Gestión de recursos hídricos del acuífero Valle de Aguascalientes, Ags., aplicando el método ZOOP. [M.I. Universidad Nacional Autónoma de México, Facultad de Ingeniería, Ingeniería de Sistemas]. Available online at: https://ru.dgb.unam.mx/server/api/core/bitstreams/8271a3fd-89ea-4ba3-a941-284bec6b9939/content (accessed May 16, 2025)
Epstein, J. M. (2008). Why model? J. Artif. Soc. Soc. Simul. 11:12. https://www.jasss.org/11/4/12.html
García Amaro de Miranda, E. (2003). Distribución de la precipitación en la República Mexicana. Investigaciones geográficas 50, 67–76. http://www.scielo.org.mx/scielo.php?script=sci_arttext&pid=S0188-46112003000100009&lng=es&nrm=iso
Gómez, M. L. (2016). Estimación de parámetros de transporte y mecanismos que gobiernan su respuesta frente a la contaminación: caso de estudio de un acuífero poroso clástico. Bol. Soc. Geol. Mex. 68, 339–356. doi: 10.18268/BSGM2016v68n2a11
González-Mendoza, J. L. (2016). Obtención de la disponibilidad hídrica media anual en la cuenca del Río Tuxpan, mediante la NOM-011-CONAGUA-2015 y el modelo hidrológico HBV [Undergraduate, Universidad Michoacana de San Nicolás de Hidalgo]
Guerrero Martínez, L. (2016). Evaluación de la recarga natural del acuífero del Valle de Aguascalientes mediante el análisis de variación de niveles de agua subterránea y datos de precipitación. [M.Eng., Universidad Autónoma de Aguascalientes]. Available online at: http://bdigital.dgse.uaa.mx:8080/xmlui/handle/11317/669 (accessed May 26, 2025)
Guerrero Martínez, L. (2020). Comportamiento hidrodinámico de acuífero del Valle de Aguascalientes y su relación con las discontinuidades superficiales [Ph.D., Universidad Autónoma de Aguascalientes]. Available online at: http://bdigital.dgse.uaa.mx:8080/xmlui/handle/11317/1880 (accessed May 26, 2025)
Harbaugh, A. W. (2005). MODFLOW-2005, the US geological survey modular ground-water model: The ground-water flow process, vol. 6. Reston, VA, USA: US Department of the Interior, US Geological Survey.
Haugen, E. A., Jurgens, B. C., Arroyo-López, J. A., and Bennett, G. L. (2021). Groundwater development leads to decreasing arsenic concentrations in the San Joaquin Valley, California. Sci. Total Environ. 771:145223. doi: 10.1016/j.scitotenv.2021.145223
Hernández-Marín, M., Guerrero-Martínez, L., Zermeño-Villalobos, A., Rodríguez-González, L., Burbey, T. J., Pacheco-Martínez, J., et al. (2018). Spatial and temporal variation of natural recharge in the semi-arid valley of Aguascalientes, Mexico. Hydrogeol. J. 26, 2811–2826. doi: 10.1007/s10040-018-1819-x
Hughes Lomelín, Roxana Nicte-Há (2023). Implementación de un modelo matemático conjunto en el sistema hidrogeológico del acuífero Valle de Aguascalientes para el transporte de fluoruro y arsénico. [M.Sc., Universidad Michoacana de San Nicolás de Hidalgo]. Available online at: http://bibliotecavirtual.dgb.umich.mx:8083/xmlui/handle/DGB_UMICH/16749 (accessed January 18, 2025)
Hughes Lomelin, R. N., Martinez Cinco, M. A., Sánchez Quispe, S. T., and Hernández Bedolla, J. (2024). Cálculo de conductividad hidráulica de estudio litológico en el Valle de Ags, México y comparativa del rendimiento del modelo subterráneo con su uso. Ciencia Nicolaita 90:2024. doi: 10.35830/cn.vi90.7802024
Hughes Lomelín, R. N., Sánchez Quispe, S. T., Hernández-Hernández, M. A., and Hernández Bedolla, J. (2023). Mathematical model of the Aguascalientes Valley aquifer hydraulic behavior. Proceedings of the 40th IAHR world congress: Rivers connecting mountains and coasts. Vienna, Austria. International Association of Hydro-environment Engineering and Research.
INEGI. (2013). Continuo de Elevaciones Mexicano 3.0. Instituto Nacional de Estadística y Geografía (INEGI). Available online at: https://www.inegi.org.mx/temas/relieve/continental/#Mapa (accessed May 16, 2025)
Lucas Urbina, O. (2018). Análisis del transporte de nitratos mediante la modelación subterránea (MODFLOW-MT3D) en los acuíferos Zacapu y Pastor Ortiz (Michoacán). [M.Sc., Universidad Michoacana de San Nicolás de Hidalgo]. Available online at: http://bibliotecavirtual.dgb.umich.mx:8083/xmlui/handle/DGB_UMICH/4764 (accessed May 16, 2025)
Martín-Clemente, C. R., Sosa Ramírez, J., Maass Moreno, M., Luna Ruíz, J. J., Meráz Jiménez, A.J., and Flores Ancira, E. (2015). Comparación de métodos para estimar disponibilidad hídrica en cuencas forestales. Terra Latinoamericana. Vol. 33, No. 1. Chapingo. Available online at: https://www.scielo.org.mx/scielo.php?script=sci_arttext&pid=S0187-57792015000100017 (accessed January 18, 2025)
Morales-deAvila, H., Gutiérrez, M., Colmenero-Chacón, C. P., Júnez-Ferreira, H. E., and Esteller-Alberich, M. V. (2023). Upward trends and lithological and climatic controls of groundwater arsenic, fluoride, and nitrate in Central Mexico. Minerals 13:1145. doi: 10.3390/min13091145
Moriasi, D. N., Arnold, J. G., Van Liew, M. W., Bingner, R. L., Harmel, R. D., and Veith, T. L. (2007). Model evaluation guidelines for systematic quantification of accuracy in watershed simulations. Trans. ASABE 50, 885–900. doi: 10.13031/2013.23153
Navarro-Farfán, M. M., García-Romero, L., Martínez-Cinco, M. A., Hernández-Hernández, M. A., and Sánchez-Quispe, S. T. (2024). Comparison between MODFLOW groundwater modeling with traditional and distributed recharge. Hydrology 11:9. doi: 10.3390/hydrology11010009
NMX–AA–077–SCFI–2001 (2002). Análisis de Aguas. Determinación de Fluoruros En Aguas Naturales, Residuales y Residuales Tratadas
NOM-127-SSA1-2021. (2022). Agua Para Uso y Consumo Humano. Límites Permisibles de La Calidad Del Agua, Diario Oficial de la Federación https://dof.gob.mx/nota_detalle.php?codigo=5650705&fecha=02/05/2022#gsc.tab=0
Pacheco-Martínez, J., Hernandez-Marín, M., Burbey, T. J., González-Cervantes, N., Ortíz-Lozano, J. Á., Zermeño-De-Leon, M. E., et al. (2013). Land subsidence and ground failure associated to groundwater exploitation in the Aguascalientes Valley, México. Eng. Geol. 164, 172–186. doi: 10.1016/j.enggeo.2013.06.015
Padilla-Reyes, D. A., Dueñas-Moreno, J., Mahlknecht, J., Mora, A., Kumar, M., Ornelas-Soto, N., et al. (2024). Arsenic and fluoride in groundwater triggering a high risk: probabilistic results using Monte Carlo simulation and species sensitivity distribution. Chemosphere 359:142305. doi: 10.1016/j.chemosphere.2024.142305
Roohollah, N., Farhad, H., Saman, J., Mehrnaz, D., Fuqiang, T., Adamowski, J. F., et al. (2020). PODMT3DMS-tool: proper orthogonal decomposition linked to the MT3DMS model for nitrate simulation in aquifers. Hydrogeol. J. 28, 1125–1142. doi: 10.1007/s10040-020-02114-0
Rubio-Arellano, A. B., Ramos-Leal, J. A., Vázquez-Báez, V. M., and Rodriguez Mora, J. I. (2023). Modeling the groundwater dynamics of the Celaya Valley aquifer. Water 15:1. doi: 10.3390/w15010001
Sainz-Santamaria, J., and Martinez-Cruz, A. L. (2019). How far can investment in efficient irrigation technologies reduce aquifer overdraft? Insights from an expert elicitation in Aguascalientes, Mexico. Water Resour. Econ. 25, 42–55. doi: 10.1016/j.wre.2017.10.003
Sánchez San Román, F. J. (2022). Hidrología Superficial y Subterránea. 2nd Edn. Salamanca, Spain: Kindle Direct Publishing.
Sathe, S. S., and Mahanta, C. (2019). Groundwater flow and arsenic contamination transport modeling for a multi-aquifer terrain: assessment and mitigation strategies. J. Environ. Manag. 231, 166–181. doi: 10.1016/j.jenvman.2018.08.057
SEMARNAT (2012). Acuerdo por el que se dan a conocer los estudios técnicos de los acuíferos Valle de Aguascalientes, clave 0101 en el Estado de Aguascalientes; Encarnación, clave 1422 en el Estado de Jalisco y Ojocaliente, clave 3212 en el Estado de Zacatecas. Mexico City, Mexico: Diario Oficial de La Federación.
Stollenwerk, K. G. (2003). “Geochemical processes controlling transport of arsenic in groundwater: a review of adsorption” in Arsenic in ground water. eds. A. H. Welch and K. G. Stollenwerk (Boston, MA: Springer).
Vázquez-Sánchez, E., and Jaimes-Palomera, R. (1989). Geología de la Cuenca de México. Geofis. Int. 28, 133–190. doi: 10.22201/igeof.00167169p.1989.28.2.1026
Warrack, J., and Kang, M. (2021). Challenges to the use of a base of fresh water in groundwater management: Total dissolved solids vs. depth across California. Front. Water 3:730942. doi: 10.3389/frwa.2021.730942
Keywords: groundwater quality, drawdown, Aguascalientes Valley aquifer, groundwater transport modeling, fluoride and arsenic concentrations, intense groundwater extraction, agricultural and urban water demands
Citation: Hughes Lomelin RNH, Hernández-Hernández MA, Sanchez Quispe ST, Medellín-Azuara J, Morande JA and Harmon T (2025) Groundwater modeling of the Aguascalientes Valley aquifer to evaluate the transport of fluoride and arsenic: current state and recommended next steps. Front. Water. 7:1638569. doi: 10.3389/frwa.2025.1638569
Edited by:
Reza Kerachian, University of Tehran, IranReviewed by:
Oluwafemi Adewole Adeyeye, Southwest University, ChinaKossitse Venyo Akpataku, Université de Kara, Togo
Copyright © 2025 Hughes Lomelin, Hernández-Hernández, Sanchez Quispe, Medellín-Azuara, Morande and Harmon. This is an open-access article distributed under the terms of the Creative Commons Attribution License (CC BY). The use, distribution or reproduction in other forums is permitted, provided the original author(s) and the copyright owner(s) are credited and that the original publication in this journal is cited, in accordance with accepted academic practice. No use, distribution or reproduction is permitted which does not comply with these terms.
*Correspondence: Mario Alberto Hernández-Hernández, bWFsYmhlckBpZ2VvZmlzaWNhLnVuYW0ubXg=