 Jiangyulong Wang
 He Zhang
 Junjian Liu1*
 Jingtao Shi
- 1Langfang Natural Resources Comprehensive Survey Center, China Geological Survey, Langfang, China
- 2College of Chemistry and Material Science, Langfang Normal University, Langfang, China
Heavy metals pose a significant threat to the water environment and human health. However, mining activities play a critical role in releasing various heavy metals into the environment. The present study aimed to evaluate the distribution characteristics, source identification, and health risk assessment of heavy metals in surface water and groundwater of Pingquan City (Hebei, China), which is a typical industrial city. Nineteen water quality indicators include pH, strontium (Sr), arsenic (As), lithium (Li), zinc (Zn), barium (Ba), lead (Pb), aluminum (Al), copper (Cu), manganese (Mn), nickel (Ni), cadmium (Cd), chromium (Cr), ferrum (Fe), cobalt (Co), selenium (Se), argentum (Ag), vanadium (V), and molybdenum (Mo), were selected; a total of 336 water samples from monitoring sites in Pingquan City were monitored, and the water quality was assessed; then the human health risks that residents possibly faced through ingestion and dermal pathways were assessed. The results showed that surface water in the Bao River Basin exhibited higher concentrations of Fe (107.71 μg/L) and As (1.37 μg/L) compared to those in other river basins. In contrast, groundwater in the Bao River Basin had significantly higher concentrations of Fe and Mn than those in other river basins, reaching 149.62 μg/L and 53.45 μg/L, respectively. According to the Water Quality Index (WQI) results, each river basin exhibits a WQI value below 50. Additionally, from a health risk assessment perspective, As in the study area does not pose health hazards that exceed acceptable risk levels in most exposure scenarios.
1 Introduction
Water is widely recognized as the most important of all our natural resources. Water resources and water quality are crucial for human survival, the ecological environment, and the sustainable development of the economy and regions (Long and Luo, 2020; Uddin et al., 2023; Xiao H. et al., 2019). Due to the toxicity, persistence, and bioaccumulation, heavy metals pose a significant threat to the water environment. Studies have confirmed that heavy metals can be adsorbed by organisms and plants, then enter the human body through the food chain (Ayyamperumal et al., 2024; Celis-Hernandez et al., 2025; Wu et al., 2025). When these elements bioaccumulate in the human body to a critical extent, they can pose risks to human health by inducing skin lesions, cancer risk, and neurological damage (Badeenezhad et al., 2023). The natural sources of heavy metals are determined by geology and lithology, such as weathering and erosion of bedrock, volcanic activity, and atmospheric precipitation (Abdo et al., 2024; Etikala et al., 2024). Besides, anthropogenic activities, especially mining, metal smelting, and refining, also have a significant impact on the biogeochemical cycling of heavy metals (Sudharshan Reddy and Sunitha, 2023; Zhou et al., 2023). During the mining process, the extensive use of water has led to a shortage of water resources (Northey et al., 2016). Moreover, dust particles in tailings ponds can affect the concentration of heavy metals in rivers and groundwater, as dust can be transported into rivers or infiltrate into groundwater via rainwater. Given the significant impact of mining on water quality, the sources and health risk assessment of heavy metals require urgent study. Therefore, in terms of water quality assessment, it is crucial to study the distribution characteristics and sources of heavy metals. Extensive research has been conducted on the water quality, source identification, and health risk assessment of river water, well water, and groundwater (Chai et al., 2021; Meng et al., 2024; Tong et al., 2021). However, there is a lack of research on the industrial city impacted by mining activities and abandoned mines.
Pingquan City is an industrial city with water scarcity issues. The total water resources in Pingquan City amount to 309 million cubic meters, with a forest area of nearly 3 million acres and a forest coverage rate of 60.4%. Notably, it serves as the source of five major rivers, whereas it exhibits no inflow from external water systems. Furthermore, most tributaries are seasonal rivers characterized by minimal flow volumes. Pingquan City is also a resource-based city endowed with abundant mineral resources. A total of 46 types of minerals have been identified, of which 19 types possess certain resource reserves. Additionally, the city encompasses over 100 metal and non-metal mines, as well as numerous tailings ponds. Pingquan City is an industrial city deeply affected by mining activities; thus, investigating the local water quality and distribution characteristics of heavy metals is extremely urgent and important. In 2020, the water quality of the main stream of the Bao River Basin was categorized as Class II according to the Environmental Quality Standards for Surface Water, indicating that it requires a complete treatment process to serve as a usable water source. Although previous researchers have carried out basic geological surveys and specialized surveys, such as those on geological hazards and geological relics in Pingquan City, the majority of hydrogeological surveys have primarily focused on mineral water and geothermal resources. Moreover, these surveys were conducted relatively early, and there is a lack of research on identifying heavy metal sources and assessing health risks in the regional water environment. The distribution and sources, as well as the water quality and health risk assessment of heavy metals in Pingquan City, are unclear. Therefore, a comprehensive and systematic evaluation of the effects of heavy metals and potential health risks in Pingquan City remains to be assessed.
Based on the above considerations, surface water and groundwater samples were systematically collected in Pingquan City. The principal objectives were to analyze the heavy metal content in surface water and groundwater of Pingquan City, evaluate the spatial distribution of the heavy metals in different river basins, assess the water quality and the potential human health risks, and then calculate the hazard quotient (HQ) and the hazard index (HI) of the heavy metals through the ingestion and dermal absorption pathways. The results of this study provide a scientific basis for improving water quality in Pingquan City, inform potential human health risks, and serve as a reference for other, similar areas.
2 Materials and methods
2.1 Overview of the survey region
Pingquan City is located in northern China, with a longitude of 118°21′-119°15′ E and a latitude of 40°40′-41°24′ N. It is an inland city in northwestern Hebei Province, as shown in Figure 1. It is 77.4 km long, running east to west, and stretches 74 km from south to north. The land area covers 3,294.1 km2. Pingquan City exhibits a continental monsoon climate with distinct seasonal variations, characterized by a prolonged cold period and significant diurnal temperature variations. The rainfall is concentrated at approximately 320–480 mm during the summer months, primarily influenced by the warm and humid Pacific monsoon. Typically, summer rainfall constitutes 76%−86% of the annual total. The study area is a typical shallow mountain region, where bedrock fissure water is the predominant type of groundwater. However, the fissures generally develop to a shallow depth and have poor water yield, making the mountainous area primarily a water-scarce region. Meanwhile, river valleys are dominated by narrow valleys with underdeveloped river terraces. The Quaternary pore water aquifer is thin and has poor water yield. There are five rivers in Pingquan City: Laoniu River, Bao River, Qinglong River, Daling River, and Laoha River. These rivers are primarily supplied by atmospheric precipitation, which exhibits distinct seasonal patterns, with rainfall mainly concentrated in summer and autumn. Flowing through 18 towns and townships across the county, these five rivers have low average water resources. Additionally, due to steep slopes and rapid water flow, combined with poor water storage conditions, the water easily flows out of the area, resulting in water scarcity in the study area. The main mineral resources in Pingquan City include iron, copper, molybdenum, coal, gold, fluorite, and cement-grade limestone, which are widely distributed across the region.
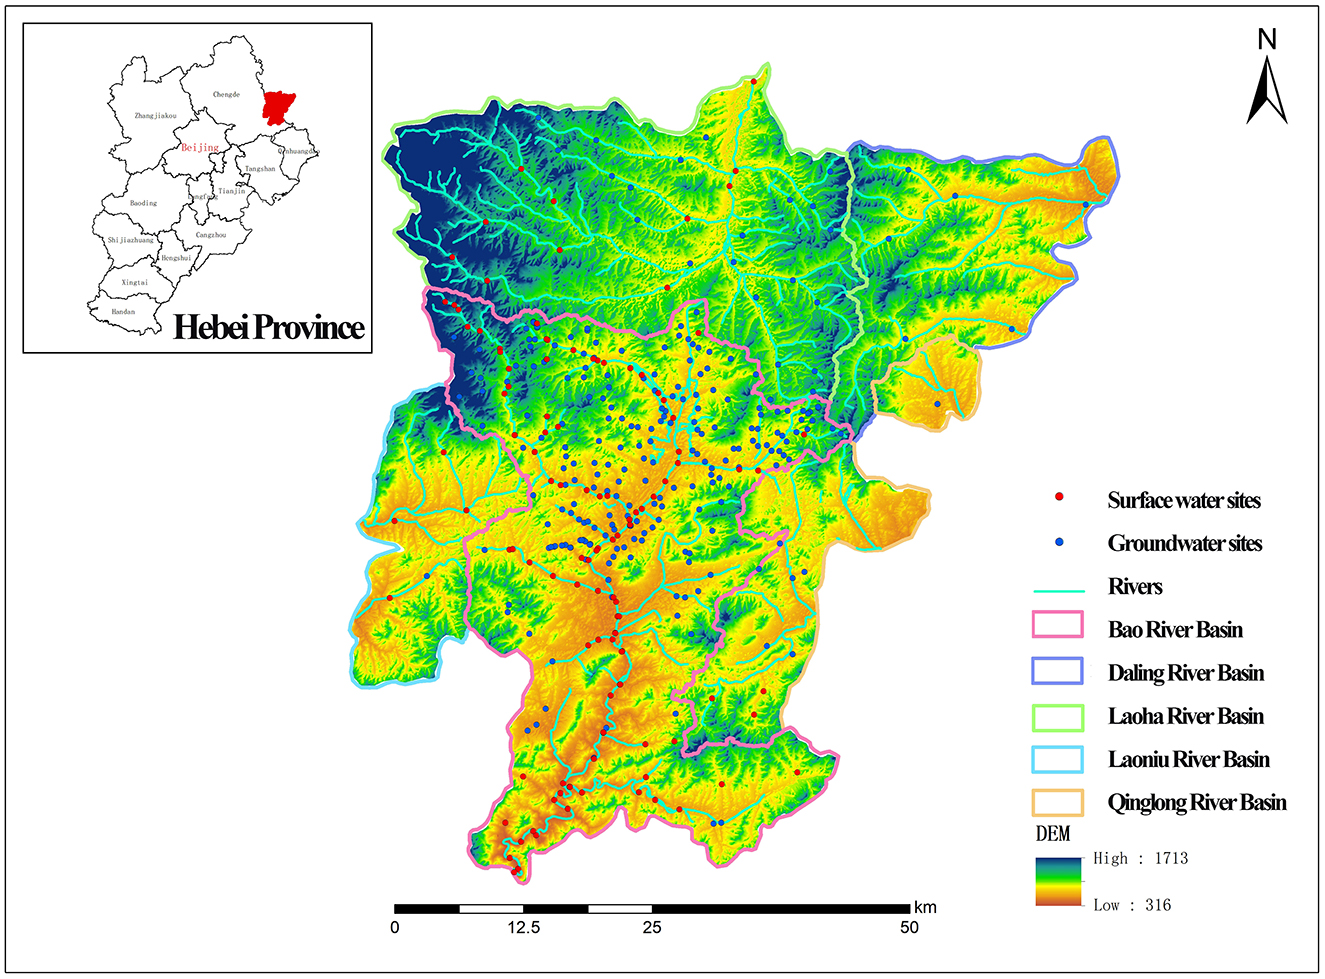
Figure 1. Geographical locations of the study area and sampling sites.
2.2 Sample collection
For this study, a total of 336 water samples were collected from monitoring sites in Pingquan City, including 100 surface water samples and 236 groundwater samples. Surface water samples were taken from various rivers, while groundwater samples were collected from wells in Pingquan City. It should be emphasized that surface water in the study area is mainly recharged by groundwater and rainfall during the flood season, with 80% of the available water resources originating from groundwater, thereby rendering the exploitable quantity extremely limited. All samples were collected over a time interval of 3 months from June to August 2024. Considering that geological and ecological issues stemming from the widespread distribution of mineral resources and numerous unmanaged tailings ponds in the study area exert a significant impact on element concentrations in the surrounding aquatic environment, and that ongoing geothermal resource development locally necessitates updated hydrological data for the surrounding area, 18 elements were therefore selected for monitoring. The monitored water quality indicators include pH, Sr, As, Li, Zn, Ba, Pb, Al, Cu, Mn, Ni, Cd, Cr, Fe, Co, Se, Ag, V, and Mo. To ensure the representativeness of surface water in the study area, samples were systematically collected from both the mainstream and each tributary. Additionally, two or more samples were collected from different locations within longer tributaries. Furthermore, relatively few sampling points were selected in the Laoniu River and Daling River basins due to water scarcity and limited well availability. Water samples were collected from different locations across the upstream, midstream, and downstream of the rivers. All surface water samples were collected at a depth of 0.5 m below the water surface in the middle of the river. The water was then filtered through Whatman® filter membranes with a 0.45 μm pore size. Aliquots of 60 mL filtered water were stored in cleaned, acidified Nalgene® bottles for subsequent trace element analysis. The groundwater samples were collected from wells or hand pumps after flushing water for a few minutes. The samples were collected in 2.5 L plastic containers that were pre-washed before use. Afterwards, the water samples were sent to the laboratory for further testing within 24 h at 4 °C. All measurement and analysis procedures were conducted in accordance with the guidelines of the American Public Health Association (APHA). Water temperature and pH were measured using a pH meter (pHS-25, INESA). The concentration of elements was analyzed by the inductively coupled plasma mass spectrometer (ICP-MS Qc, Thermo Fisher). The main ions were analyzed using an atomic fluorescence spectrophotometer (AFS-2202E, Haiguang Instrument). To ensure data precision and accuracy, all chemical reagents used in the analysis were of guaranteed reagent grade, and the experimental water was of ultrapure quality. For every 20 samples, a blank sample and a standard sample were tested. The relative standard deviation (RSD) values were all less than 10%. Each sample was tested twice, and the relative error between the two measurements was less than 5%. All constant indicators of water samples passed the charge balance test with an error of less than 5%.
2.3 Water quality assessment
The Water Quality Index (WQI) was used to assess the water quality level, and the specific explanation and calculation method are as follows (Meng et al., 2016; Şener et al., 2017):
Where Wi — The relative weight;
wi — The weight attributed to the target element based on its relative impact on human health and its importance in terms of suitability for drinking water;
Σwi — The sum of the weightings of all parameters, in this study, Σwi was 42;
Ci — The measured concentration;
Si —The standard for drinking water in China.
Exposure to Mn can lead to disorders of the human central nervous system, and in severe cases, may trigger neurological diseases. High concentrations of As can lead to chronic arsenic poisoning, which can cause neurological damage, digestive system disorders, loss of appetite, and hair loss. Excessive Cd exposure can cause kidney damage, osteoporosis, and respiratory problems, whereas Pb exposure impairs the nervous system, hinders the intellectual development of children, causes anemia, and induces damage to the kidneys, liver, and skeletal damage. Cr is a known carcinogen that poses risks to the lungs, kidneys, and skeletal system. Due to the particularly harmful effects on water quality and human health, As, Cd, Cr, Mn, and Pb were given the highest weight of 5. Considering their important impact on water quality, the pH value and Fe were assigned a weight of 4. Al, Ba, and Cu were assigned a weight of 2. Co, Ni, and Zn were assigned a weight of 1, due to a relatively lower impact on water quality (Gao et al., 2019). The number 100 is a constant. According to the WQI value, water quality can be divided into the following five categories (Xiao J. et al., 2019): <50, excellent; 50–100, good; 100–200, poor; 200–300, very poor; >300, undrinkable.
2.4 Human health risk assessment
Relying solely on the WQI would underestimate the health risks associated with heavy metal elements, such as As. Therefore, this study further analyzed the non-carcinogenic risks of heavy metals and the carcinogenic risk associated with As. For drinking water, direct ingestion and dermal pathways (such as showering, bathing, and swimming) are generally considered common exposure pathways for humans. Hazard quotient (HQ) and hazard index (HI) were calculated to evaluate the toxicity caused by heavy metals in aquatic ecosystems. The exposure doses through ingestion and dermal pathways are determined by Equations 3, 4 (EPA, 2004; Ezugwu et al., 2019; Wang et al., 2018).
Where ADDingestion — The mean daily dose (μg/kg/day) absorbed by ingestion;
ADDdermal — The mean daily dose (μg/kg/day) absorbed by dermal;
Cw — The average concentration of heavy metals in each water sample (μg/L);
IR — The ingestion rate, which is 2.0 (L/day) for adults and 0.64 (L/day) for children;
EF — The exposure frequency (350 days/year);
ED —The exposure duration, which is 30 years for adults and 6 years for children;
BW — The average weight, 70 kg for adults and 15 kg for children;
AT — The average time (days), for non-carcinogens, AT = ED × 365 days/year, for carcinogens, AT = 365 days/year×70 years;
SA — The exposed skin area, 18,000 cm2 for adults and 6,600 cm2 for children;
ET — The exposure time, which is 0.58 h/day for adults and 1 h/day for children;
Kp — The dermal permeability coefficient in water (cm/h), 0.001 for Al, As, Ba, Cd, Mn, Fe, and Cu, 0.0001 for Pb, 0.0002 for Ni, 0.0004 for Co, 0.002 for Cr, and 0.0006 for Zn (He et al., 2023; Moradnia et al., 2024).
The potential non-carcinogenic risk and carcinogenic risk were evaluated as follows (Bhutiani et al., 2015):
Where HQ — The potential non-carcinogenic risks which were calculated by Equations 5, 6;
RfD —The corresponding reference dose, as shown in Table 1;
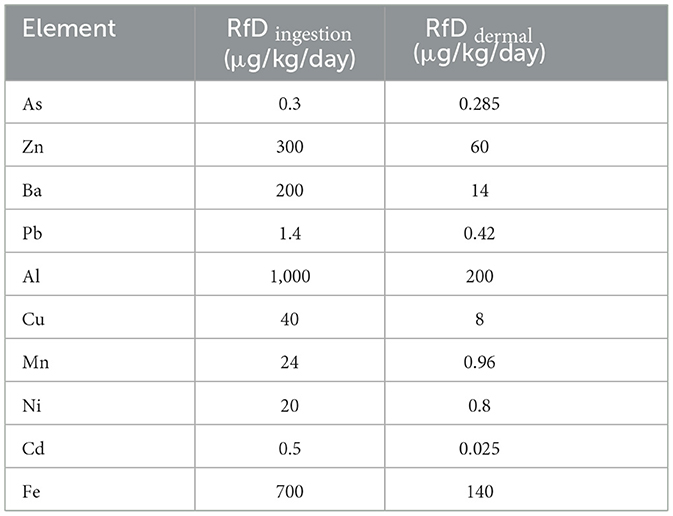
Table 1. Reference dose (RfD) of selected elements (μg/kg/day).
ABSg — The gastrointestinal absorption factor (dimensionless);
CR — The cancer risk;
SF — The oral cancer slope factor (mg/kg/day)−1, the SFingestion of As is 1.5, and the SFdermal of As is 3.66;
TCR — all carcinogenic risks caused by heavy metals.
If the HQ exceeds 1, there is a possible non-carcinogenic risk. Furthermore, HI is the sum of the HQs of all applicable pathways (Equation 7), which is used to evaluate the potential total non-carcinogenic risk via all pathways. If the HQ or HI > 1, it indicates potential adverse health effects on human health, and further research is necessary. However, when HQ or HI < 1, it indicates that there are no adverse effects on human health. The specific classification of HI is as follows: If HI < 0.1, a non-carcinogenic risk; 0.1 ≤ HI < 1, low non-carcinogenic risk; 1 ≤ HI < 4, moderate non-carcinogenic risk; HI ≥ 4, high non-carcinogenic risk.
When the CR or TCR < 10−6, the carcinogenic risk is negligible. When CR or TCR >10−4, this indicates a high risk of cancer to humans. When 10−6 < CR or TCR < 10−4, there is an acceptable risk for humans. Notably, due to variations in exposed populations across regions, actual risk levels may differ geographically. In some cases, the carcinogenic risk could be higher and unacceptable.
Basic statistical analyses such as standard deviation (SD), WQI, HQ, and HI are calculated using Excel. All statistical programs were completed using Microsoft Office 2021 for Windows. The spatial distribution maps of sampling points were drawn using ArcGIS 10.5 (Environmental Systems Research Institute, Inc.). One-way ANOVA and Tukey's HSD were used to analyze the significant differences in element concentrations between surface water and groundwater (p < 0.05). The variation, spatial distribution, statistical analysis, principal component analysis (PCA), WQI, HI, and health risk analysis of heavy metals were conducted using Origin 2025 (OriginLab, USA).
3 Results and discussion
3.1 Characteristics of the surface water and groundwater
The general characteristics of selected water quality parameters in surface water are shown in Table 2. The pH range of surface water was 7.02 to 8.86, with an average of 7.94. Groundwater exhibited a pH range of 6.89 to 8.40, with an average value of 7.60. Most of the water samples exhibited alkaline characteristics, and surface water pH values were slightly higher than those of groundwater.
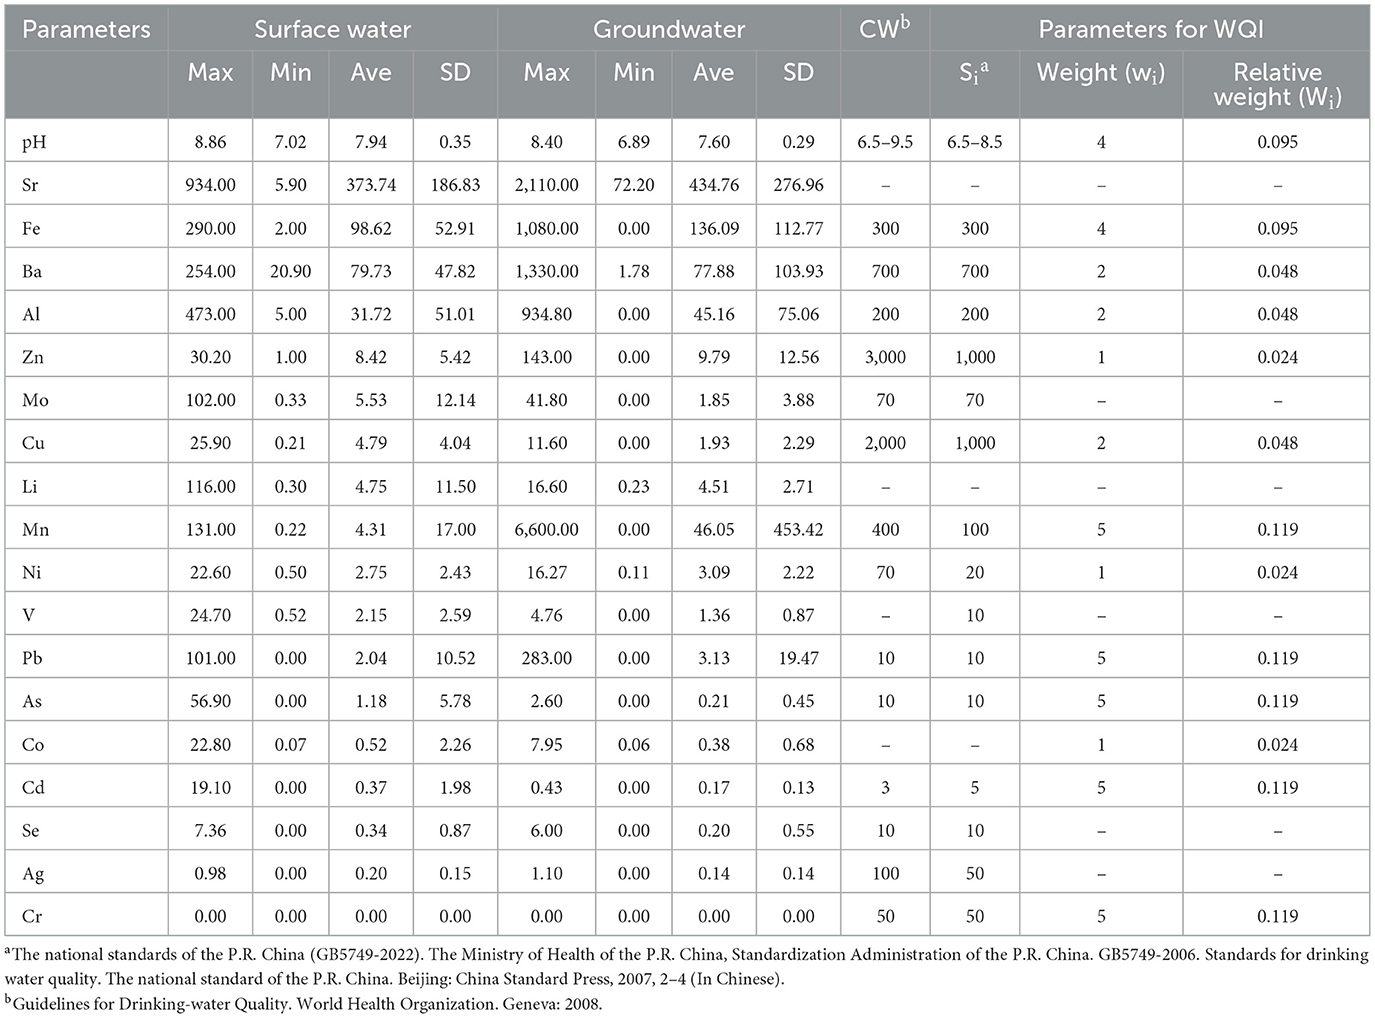
Table 2. Statistics of chemical parameters and parameters for WQI calculation in surface water, the units of concentrations are given in micrograms per liter (μg/L).
According to the mean values, trace elements in water can be divided into three categories: low content (<1 μg/L), moderate content (1–100 μg/L), and high content (>100 μg/L) (Li et al., 2022). As shown in Table 2, the average concentrations of As, Li, Zn, Ba, Pb, Al, Cu, Mn, Ni, Cd, V, Mo, and Fe in surface water ranged from 1 to 100 μg/L, indicating moderate concentrations of these elements. Cr was detected in all samples, but the concentration was below the detection limit, indicating extremely low concentrations. Sr exhibited the highest concentration, exceeding 100 μg/L. In groundwater, the concentrations of Ba, Al, Zn, Mo, Li, Mn, Ni, V, and Pb were in the range of 1–100 μg/L, which were classified as moderately abundant elements. The mean concentrations of Sr and Fe were greater than 100 μg/L, which were classified as the most abundant elements. The high concentrations of Sr are attributed to the geochemical environment in the schist fissure water system (Alqahtani et al., 2020; Liu et al., 2024; Wang et al., 2021). The enrichment of Fe primarily originates from geological sources, as well as water movements between surface and deeper lithological layers and hyporheic exchange flows (Ntona et al., 2022). The mean values of trace elements in surface water are ranked in descending order as follows: Sr > Fe > Ba > Al > Zn > Mo > Cu > Li > Mn > Ni > V > Pb > As > Co > Cd > Se > Ag. For groundwater, the mean values of trace elements follow the trend: Sr > Fe > Ba > Mn > Al > Zn > Li > Pb > Ni > Cu > Mo > V > Co > As > Se > Cd > Ag. Furthermore, the mean values of Fe and Sr in groundwater were higher than those in surface water, whereas the mean values of Mo, Cu, and As in surface water were higher than those in groundwater, and there were minor variations in Ag and V concentrations. For other element samples, no statistical differences have been observed between surface water and groundwater. In the study area, several open-pit Fe mines and tailings from the processing and beneficiation of Fe ore result in high Fe content in groundwater. The excess Mn was attributed to the release of Mn from the aquifer matrix, resulting from changes in the groundwater environment and fluctuations in redox conditions induced by mining activities. In surface water and groundwater, the SD values of Sr and Mn were relatively higher than those of other elements, indicating that Sr and Mn were significantly influenced by human activities.
There were significant differences in the mean values of heavy metals among different river basins, as shown in Figure 2. For surface water, Fe (107.71 μg/L) and As (1.37 μg/L) in the Bao River Basin presented higher concentrations than those in other river basins. The concentrations of Ba in the Qinglong River Basin and the Bao River Basin were relatively higher, with mean values of 97.06 μg/L and 85.63 μg/L, respectively. For groundwater, the concentrations of Fe and Mn in the Bao River Basin were significantly higher than those in other river basins, reaching 149.62 μg/L and 53.45 μg/L, respectively. The Al concentrations in the Qinglong River Basin and the Bao River Basin were relatively higher, with mean values of 72.38 μg/L and 81.21 μg/L, respectively.
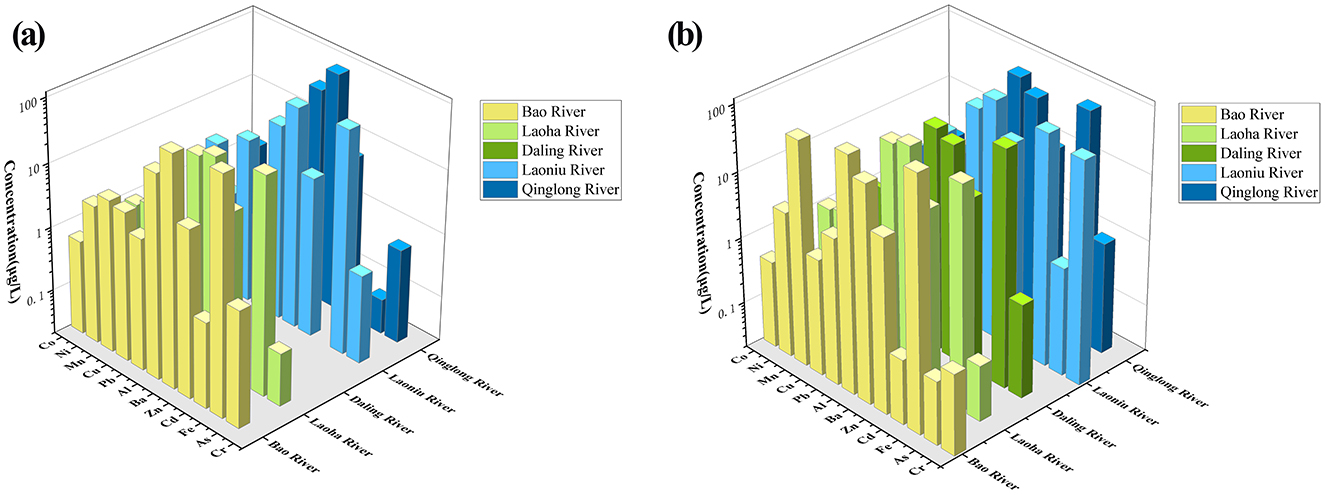
Figure 2. Three-dimensional histogram of mean concentration of heavy metals in (a) surface water and (b) groundwater in different river basins.
3.2 Source-oriented of the heavy metals
The PCA data are shown in Table 3 and Figure 3, which reveal the relationship between parameters and sampling points. For surface water, the PC1-PC2 combination explained 45.5% of the total variance in the data (Table 3, Figure 3a). Based on these percentages, the processes controlling the chemical development of water quality in the region were essentially contained within these two principal components. PC1 accounted for 29.2% of the total variance and exhibited strong loadings for Cu, Li, Ni, V, Co, and Cd. Most of these elements were heavy metals or rare metals, primarily associated with industrial activities and metal mining and smelting, or geological sources. PC2 explained 16.3 of the variance; it exhibited higher loadings for Mo, As, and Se. The sources of these elements were more inclined toward energy, chemical, and mining activities. PC3 captured 11.15 % of the variance; it exhibited higher loadings for Ag. The high loadings of Ag primarily indicate the presence of precious metal processing and the electronics industry. The PC1-PC2 combination of groundwater represented more than 40.2% of the data (Table 3, Figure 3b). These percentages indicated that the chemical evolution of water bodies in the region was primarily controlled by these two components. PC1 explained 17.6% of the variance, with Se, Fe, Li, Mn, Ni, Co, and Cd exhibiting strong loadings. These elements were primarily composed of heavy metals and transition metals, mainly associated with mining, smelting, or contributions from natural geological weathering. Similar to the situation in surface water, PC1 was also fundamentally strongly influenced by these major ions. PC2 explained 12.6% of the variance, primarily dominated by Cu and Ag. The high loadings of Cu and Ag primarily indicated local inputs from metal processing and the electronics industry. PC3 explained 8.81% of the variance; it was influenced by pH, Ba, V, and As. This principal component integrated pH and multiple elements, potentially related to energy-related activities and geological background. Therefore, within the study area, it was necessary to further standardize the management of mining areas, repair tailings ponds and waste rock piles, reduce the impact of leachate seepage on groundwater, optimize the production processes of energy (e.g., coal-fired) and chemical enterprises to reduce wastewater discharge of elements such as As and Mo, and prevent the infiltration of acidic wastewater. Meanwhile, centralized treatment of waste materials should be implemented for precious metal processing enterprises (e.g., silver jewelry processing) to avoid direct seepage into surface or underground environments. Since this study only analyzed water samples (surface water and groundwater) and did not involve geochemical analysis of sediments or direct tracing of specific sources, further research on these aspects in the future will provide more useful information for analyzing local metal sources.
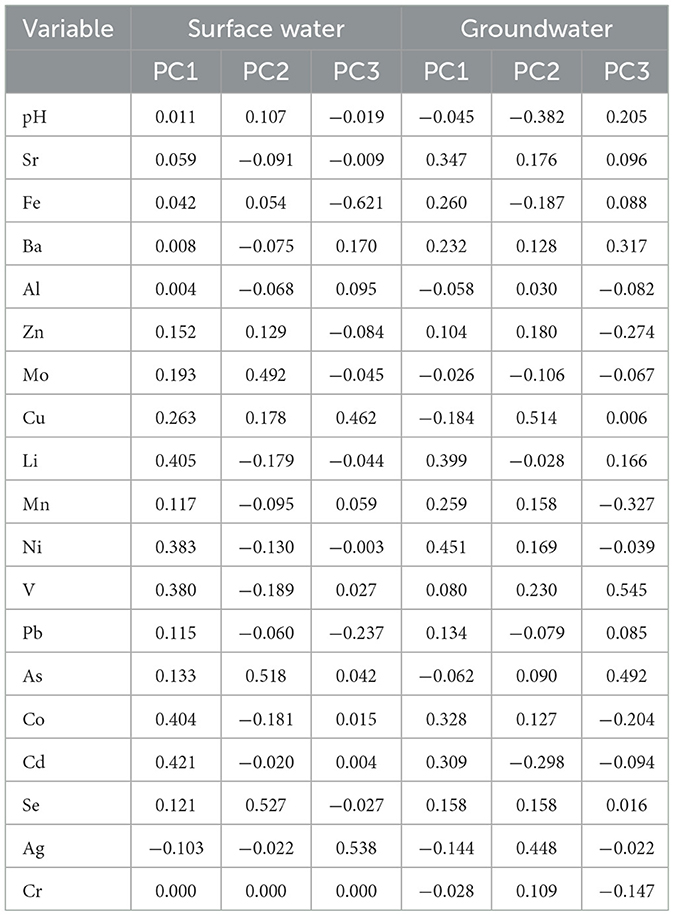
Table 3. Rotated factor loadings of principal components on pH and heavy metal parameters in surface water and groundwater (unitless).
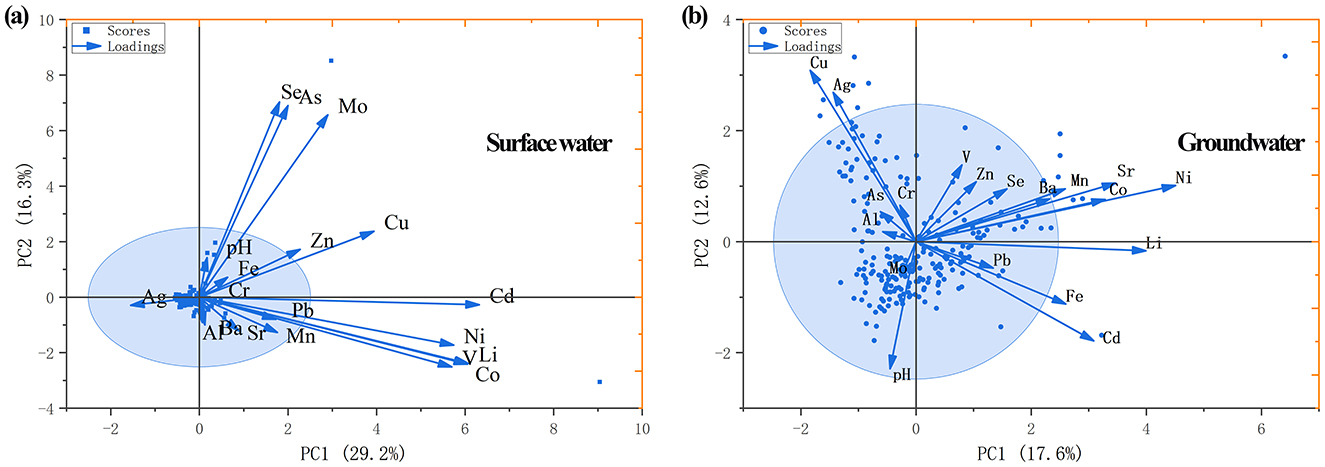
Figure 3. Biplot of (a) surface water and (b) groundwater quality based on the principal component analysis in the study area.
Although the average concentrations of various elements in surface water and groundwater are lower than the health-based guideline values proposed by the WHO Guidelines (Table 2), there are still some sampling sites where detected concentrations exceed the required values, including Al, Mo, Pb, As, and Cd in surface water, as well as Fe, Ba, Al, Mn, and Pb in groundwater. Compared with the prescribed values in China's national standards (as shown in Table 2), more elements exceed the required values at some monitoring sites. The variation and spatial distribution of heavy metals with higher concentrations in surface water and groundwater are shown in Figure 4. As shown in Figure 5, the distribution of areas with higher concentrations of heavy metals in surface water is as follows: Al, Mn, As, Pb, Ni, and V in the Bao River basin. Overall, the higher concentrations of Al, Ni, and V in the upper reaches of the Bao River may be caused by tailings ponds, abandoned quarries, and iron mines, while the excessive concentration of Pb was caused by limestone mines, iron mines, and abandoned quarries. In the lower reaches of the Bao River, the higher concentration of As was attributed to the copper mines and abandoned quarries. Furthermore, the higher concentration of Mn was due to tailings ponds, iron mines, and abandoned quarries. Additionally, the site with a higher concentration of As was located in a highly ecologically and geologically fragile mining area. The mineral resources in this region are primarily non-metallic minerals. Due to unregulated mining activities in the early years, numerous abandoned mining pits have been formed. The high and steep rocky slopes are located near roads and water systems, causing severe damage to the topographic and geomorphic features.
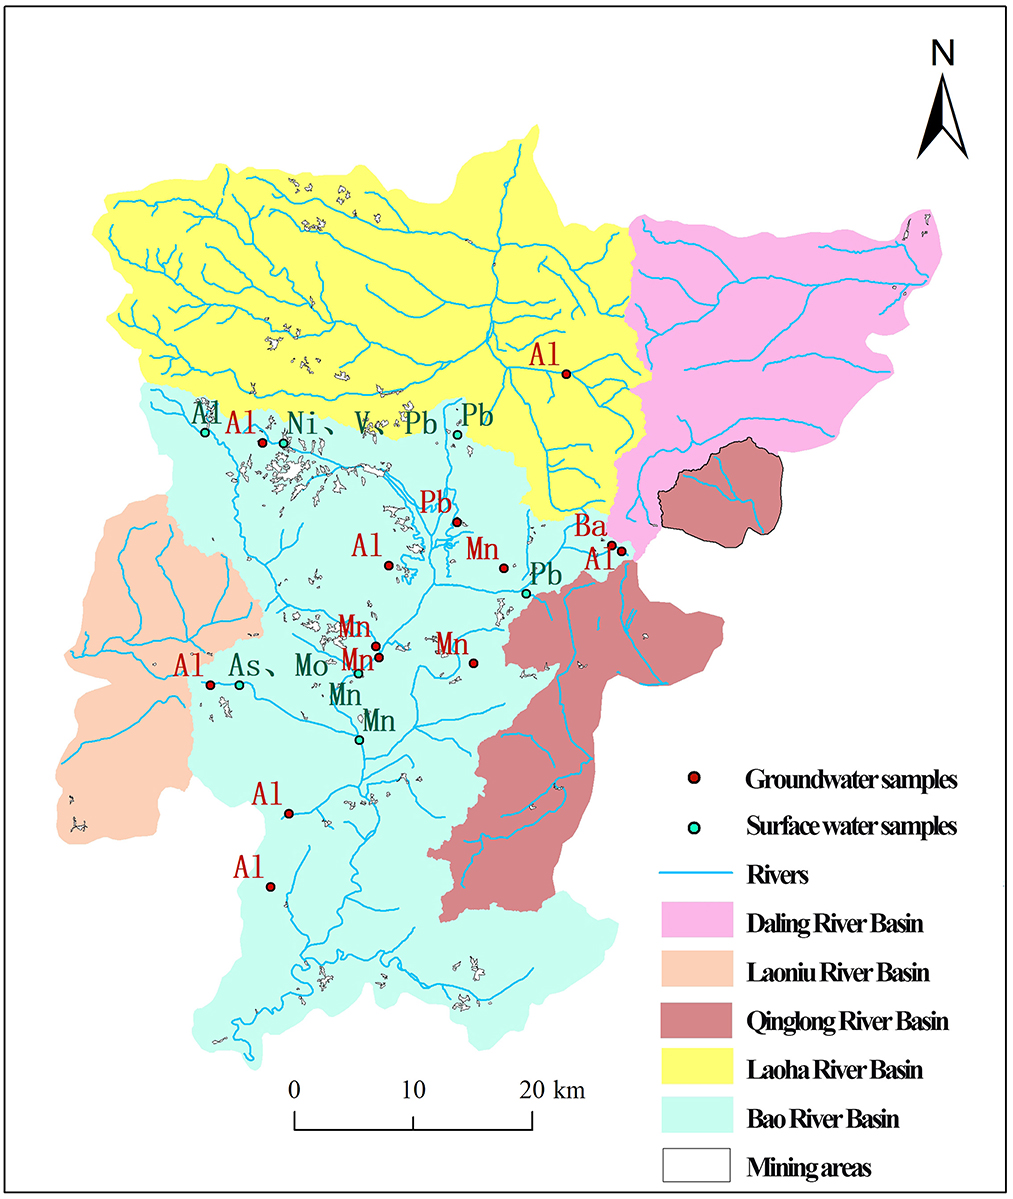
Figure 4. Variation and spatial distribution of heavy metals with higher concentrations in surface water and groundwater.
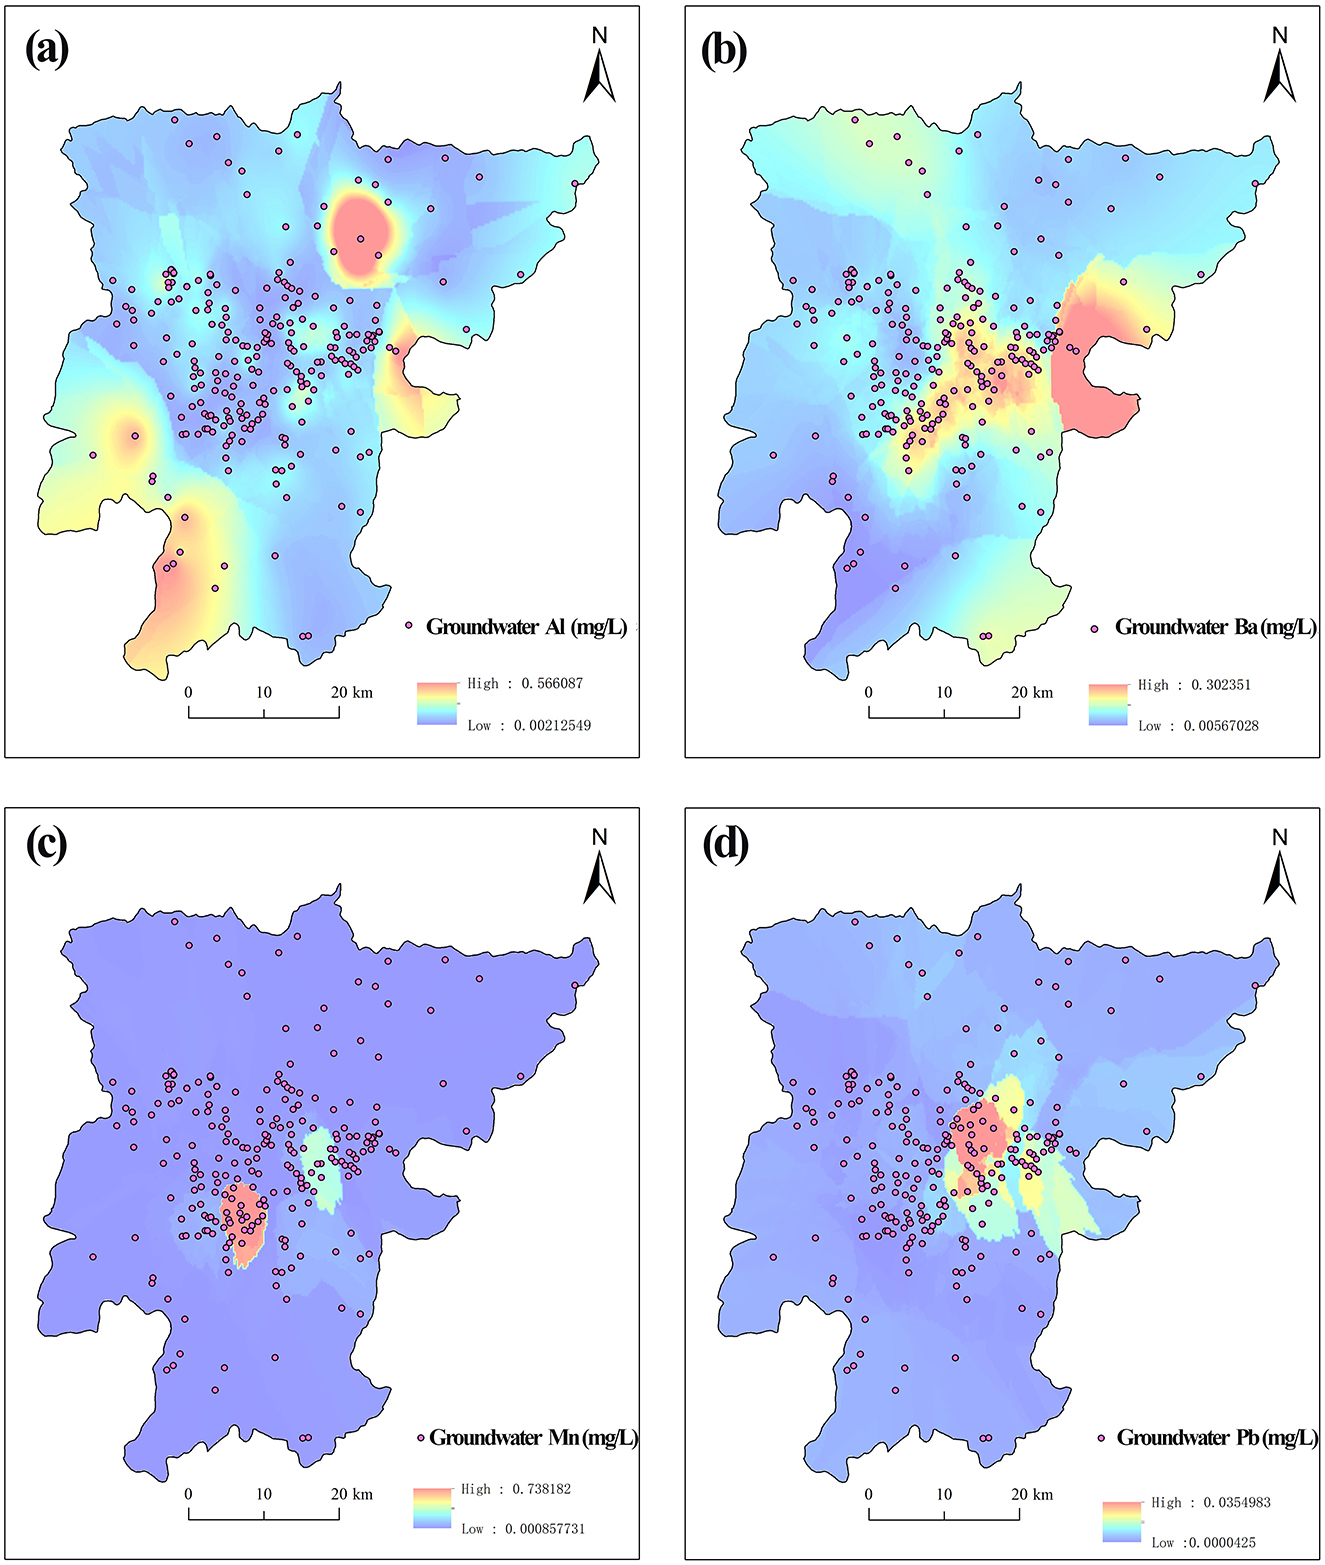
Figure 5. Spatial distribution of heavy metals with higher concentrations in groundwater, (a) Al, (b) Ba, (c) Mn, and (d) Pb.
For groundwater, the higher concentrations of heavy metals were distributed as follows: Al in the Bao River, and at a site in the Laoha River, Ba, Pb, and Mn in the Bao River, as shown in Figure 6. In general, the large number of tailings ponds and abandoned quarries, as well as different types of mines, might be the reasons for the higher concentration of heavy metals (Wang et al., 2019). Furthermore, the higher concentration of Al in the lower reaches of the Laoha River Basin can be attributed to urban development in the area. Moreover, the hotspots of high concentrations of heavy metals in groundwater were mainly distributed in the Bao River basin, which exhibited a certain overlap with high concentrations of heavy metals in surface water due to the release of heavy metals from surface sediment and the settling processes through rainfall (Canpolat et al., 2020; Labonté-Raymond et al., 2020).
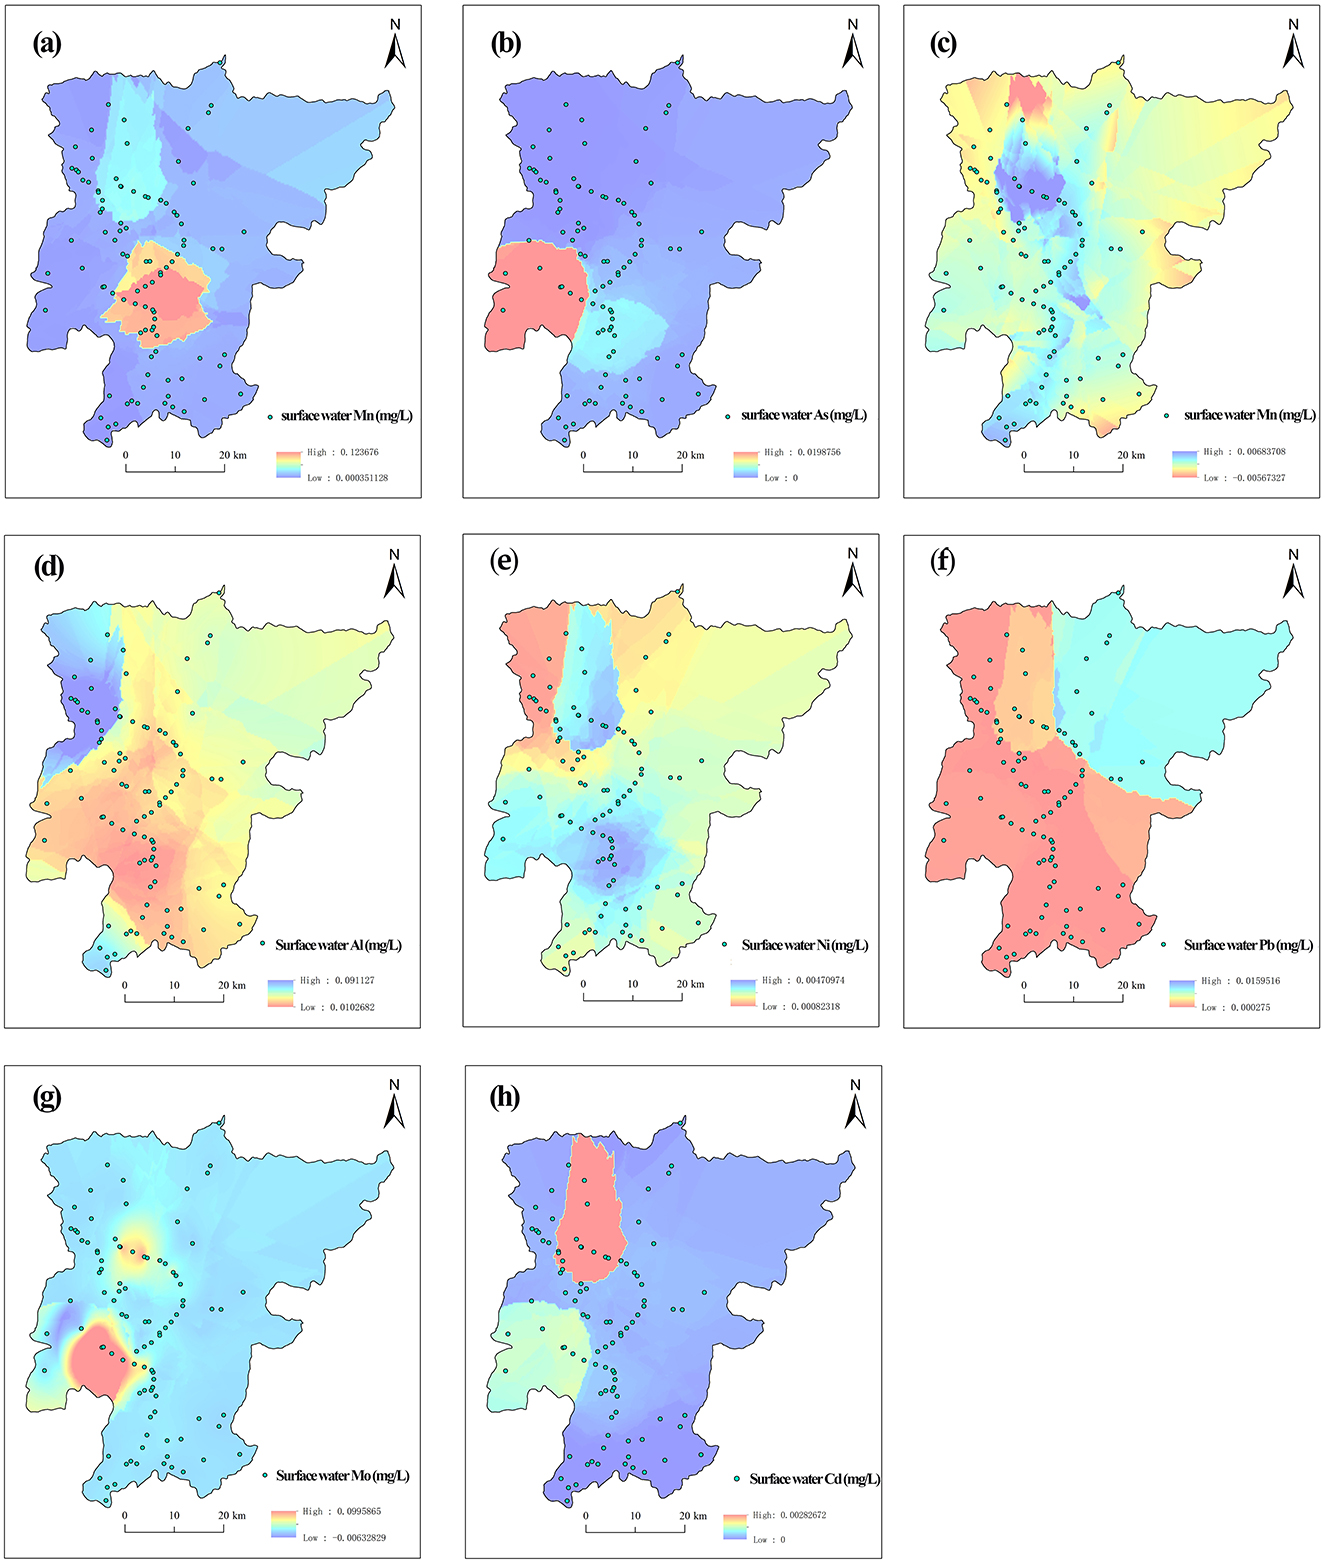
Figure 6. Spatial distribution of heavy metals with higher concentrations in surface water: (a) Mn, (b) As, (c) V, (d) Al, (e) Ni, (f) Pb, (g) Mo, and (h) Cd.
Therefore, from a river basin perspective, the Bao River Basin manifested a more serious situation compared to the other basins in Pingquan City, due to the widespread distribution of mines in the river basin, as shown in Figure 4. A large number of chemical enterprises and residents were concentrated along the Bao River basin, posing a serious potential threat to surface water. The mining of metals and the resulting tailings ponds, combined with industrial production, agricultural production, and urban development, have collectively contributed to surface water issues in the Bao River Basin.
3.3 Water quality assessment
According to the drinking water guidelines of the Chinese State Standards (GB5749-2006) (Table 2), the mean pH values of all selected surface waters fell within the range of 6.5–8.5 specified in the standard, indicating that the pH values in this study area were suitable for human drinking.
The concentrations of heavy metals are all within the permissible limits for drinking water specified by national standards. Furthermore, the WQI was used to further assess the drinking water quality as outlined in Equation 1. The relevant parameters of WQI are listed in Table 2. Figure 6 shows the water quality classification of surface water in this study. According to the WQI classification standards, the WQI of surface water ranged from 13.35 to 22.08, with a mean value of 17.46. These results suggest that the water quality of surface water can be classified as excellent. For groundwater, the WQI values ranged from 15.56 to 29.09, with a mean value of 21.21, indicating excellent water quality based on the WQI classification standards. Figure 4 indicates that the higher WQI of the Bao River Basin is significantly associated with the widespread distribution of mines within the basin.
While the WQI provides a useful method for assessing water quality based on the concentration of elements, its reliance on short-term data and neglect of bioaccumulation processes limit its ability to address long-term health impacts comprehensively. Although the mean WQI values of all river basins were under the limits for drinking water levels, several sites still needed further attention. The highest WQI value of surface water was located in the Bao River Basin (22.08), characterized by high concentrations of As (56.92 μg/L), Al (472.66 μg/L), and Pb (100.65 μg/L). These high concentrations may be attributed to anthropogenic activities and intensive mining areas distributed in the basin. In order to protect the health of local people and promote sustainable economic development, it is necessary to continuously monitor heavy metals in the water system of the Bao River basin.
3.4 Health risk assessment
3.4.1 Non-carcinogenic risk
For surface water, the mean values of HQingestion, HQdermal, and HI for the selected heavy metals for children and adults are presented in Table 4; all of them were less than 1. These results indicated that there were no adverse effects and potential non-carcinogenic risks to human health from the selected heavy metals. As shown in Figure 7a, the mean values of HQingestion and HI for As were in the range of 0.1 to 1, which indicated a low non-carcinogenic risk to human health. For groundwater, the mean values of the HQingestion, HQdermal, and HI for children and adults exposed to the selected elements were all below 1, indicating no adverse effects on human health, as shown in Figure 7b. Among these, the mean values of HI for Mn were close to 1, indicating a potential low non-carcinogenic risk of Mn in human beings in the future. As shown in Figure 8, all HQdermal of heavy metals investigated in this study were less than 1, which suggested that those elements posed fewer hazards through the dermal pathway. For both children and adults, the value of HQingestion was higher than that of HQdermal for both groups. This analysis indicated that ingestion was the main pathway contributing to non-carcinogenic adverse health effects in the water system, consistent with previous research findings.
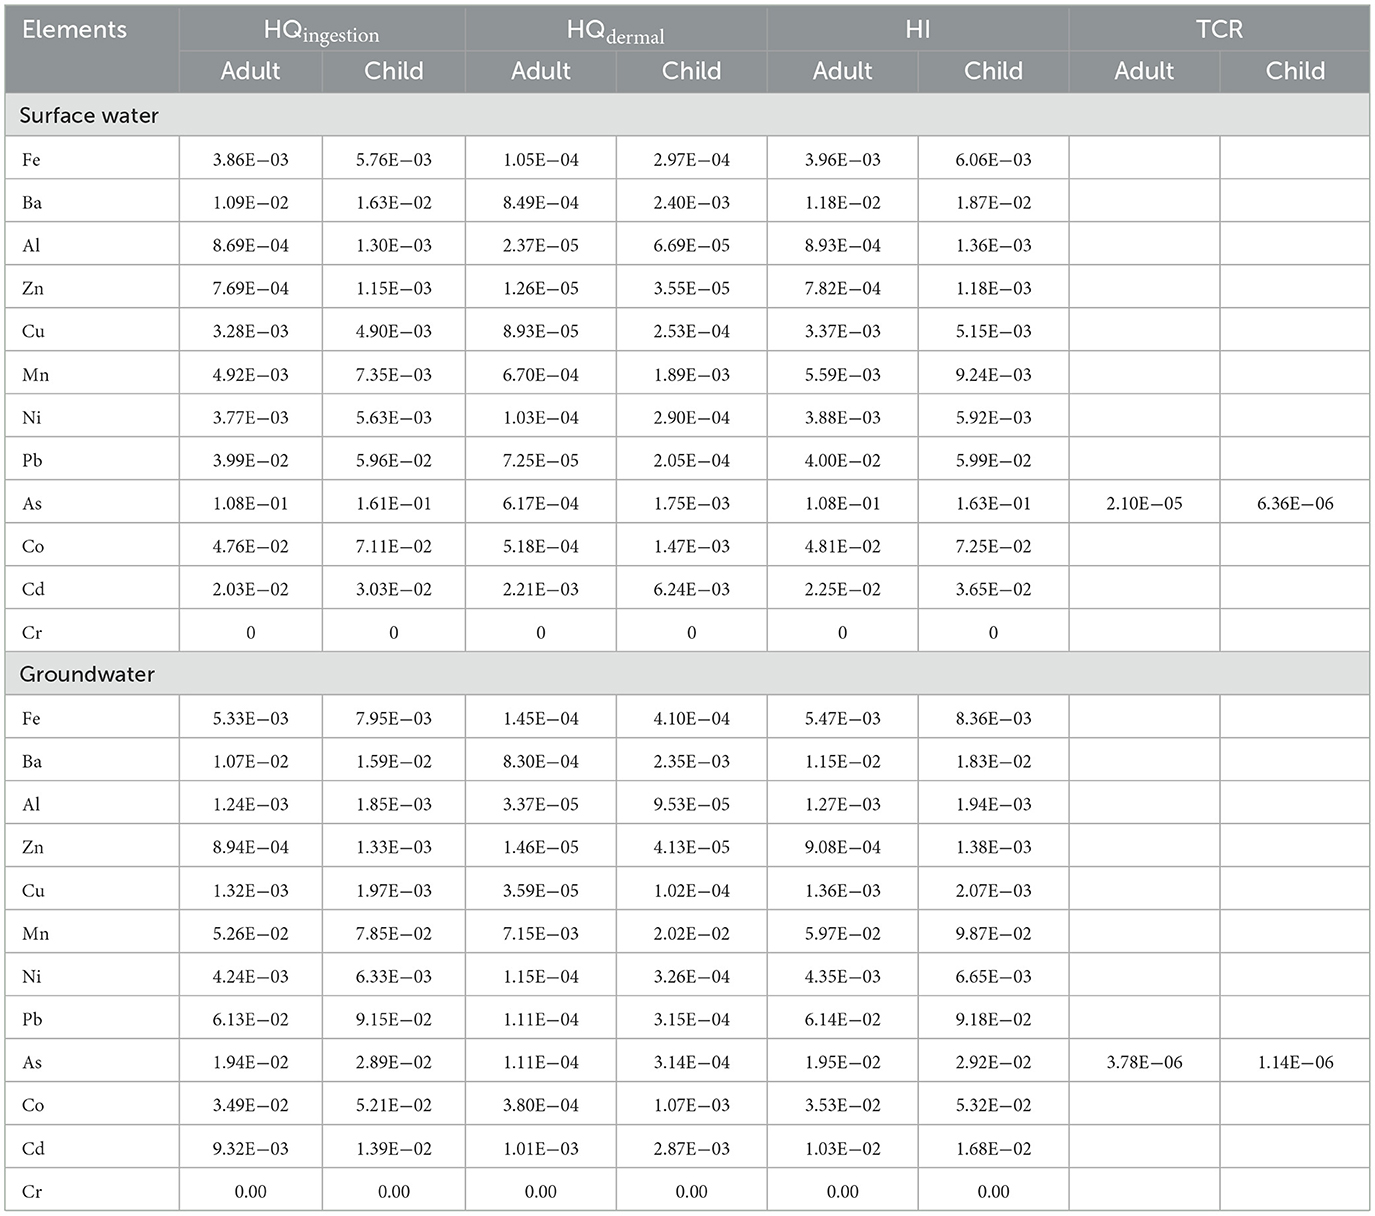
Table 4. Hazard quotient (HQ), hazard index (HI) for heavy metals, and TCR for As in surface water and groundwater (unitless).
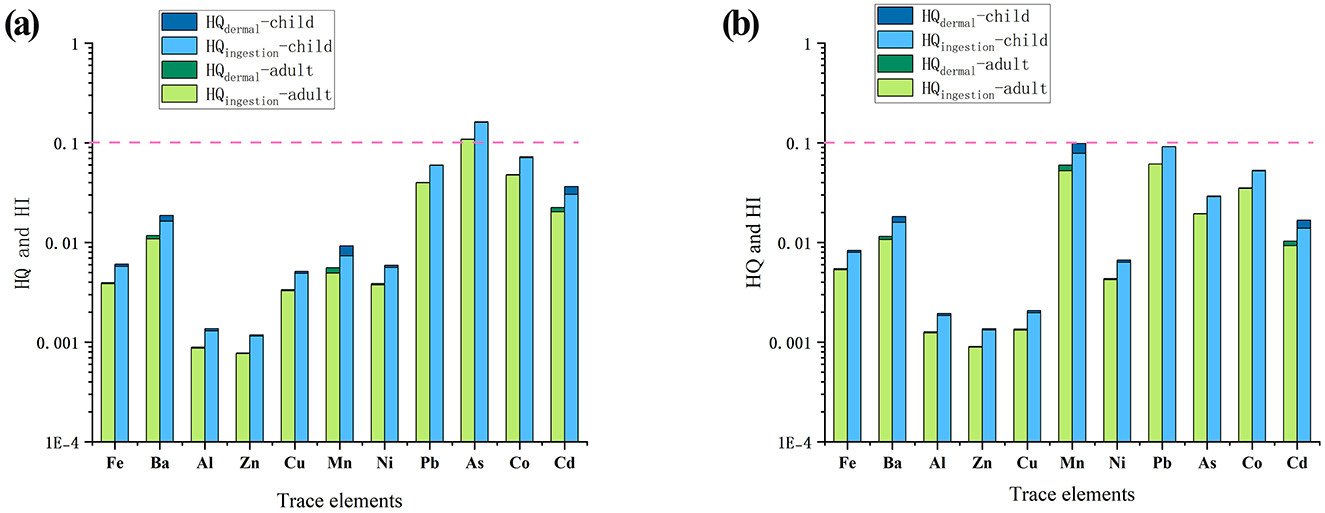
Figure 7. The HQingestion, HQdermal, and HI values for child and adult in surface water (a) and groundwater (b).
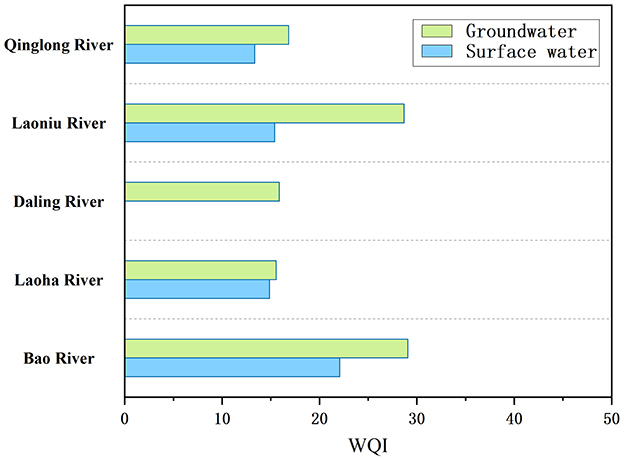
Figure 8. The water quality classification of surface water and groundwater.
As poses a low non-carcinogenic risk to humans in surface water. For both children and adults, the HQ values for ingestion of heavy metals were higher than those for dermal exposure, indicating that ingestion is the main pathway for adverse effects on the human body and non-carcinogenic risks. Furthermore, the mean values of HQingestion, HQdermal, and HI for children were higher than those for adults, which implied that children are more susceptible to the adverse effects of heavy metals than adults under the same aqueous medium, which was consistent with the literature (Meng et al., 2023). Moreover, the excess of Mn in groundwater requires sustained attention due to its high hazard potential through the dermal pathway.
3.4.2 Carcinogenic risk
The carcinogenic risk of As was calculated in this study due to its significant effect on the human body. Figure 9a illustrates the carcinogenic risk values of As for children and adults through ingestion and dermal pathways in surface water and groundwater, according to the CR classification recommended by the US EPA. The carcinogenic risk values of As in surface water and groundwater through the dermal pathway for adults and children were less than 1 × 10⁻⁶, indicating that the carcinogenic risk was negligible. The carcinogenic risk values of As in surface water through the ingestion pathway for adults and children were in the range of 1 × 10⁻⁶ to 1 × 10⁻⁴, indicating acceptable carcinogenic risks. Furthermore, for both adults and children, the risk caused by ingestion was higher than that caused by dermal exposure.
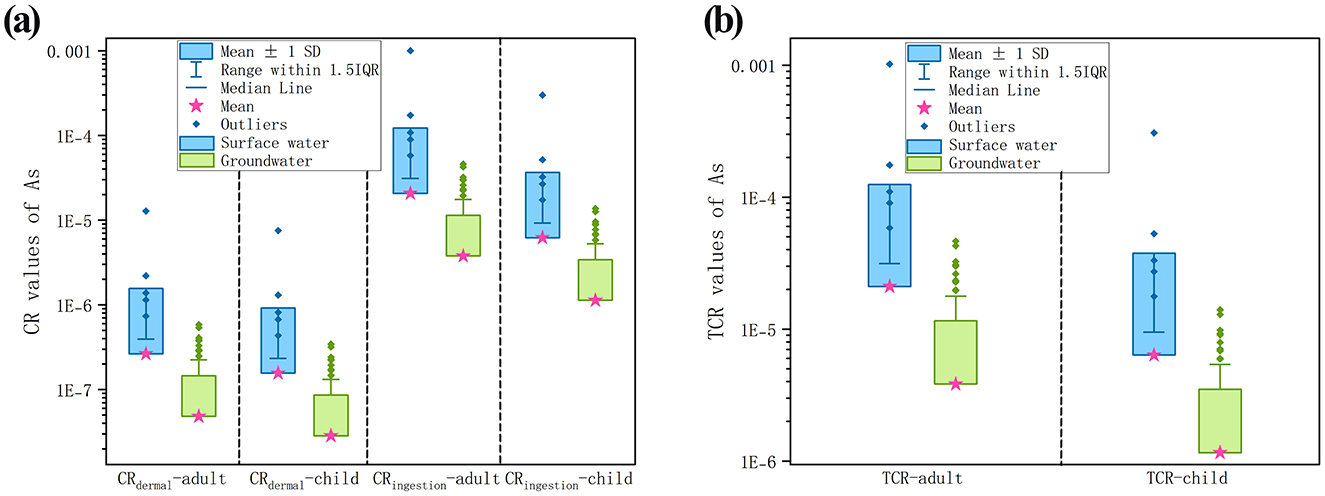
Figure 9. CRingestion, CRdermal values (a) and TCR values (b) of As for child and adult in surface water and groundwater.
The TCR values of As in surface water for children and adults ranged from 0 to 3.07 × 10⁻⁴ and 0 to 1.02 × 10⁻³, respectively, as shown in Figure 9b. For groundwater, the two value ranges are 0 to 1.40 × 10⁻⁵ and 0 to 4.64 × 10⁻⁵, respectively. The mean TCR values of As for adult and child in surface water were 2.10 × 10⁻⁵ and 6.36 × 10⁻⁶, respectively. The mean TCR values of As for adult and child in groundwater were 3.78 × 10⁻⁶ and 1.16 × 10⁻⁶, respectively. The results indicated that some sites in the study area require continuous monitoring of As concentrations in surface water and need to pay more attention to the As absorbed through ingestion by adults. Furthermore, the mean carcinogenic risk of As in surface water was higher than that in groundwater, which was consistent with the non-carcinogenic risks. However, adults faced a higher carcinogenic risk than children, which was contrary to the non-carcinogenic risk. Therefore, it is critically important to take targeted actions to protect surface water quality from the impact of As and ensure human health and safety, such as the formulation of public policies. The Chinese government has introduced technical policies for As pollution prevention and control. These policies manage As-related industries from various aspects, including clean production, pollution control, comprehensive utilization, and secondary pollution prevention, while encouraging the development of new technologies to promote green, low-carbon, and circular development. Meanwhile, the Pingquan City Government has proposed focusing on accelerating the implementation of river ecological restoration projects to ensure stable water quality meets standards. Simultaneously, in residential areas near mines and tailings ponds, educational campaigns should be conducted to enhance local residents' awareness of drinking water safety and encourage them to pay attention to water resource protection.
4 Conclusions
This study analyzed the contamination and health risks associated with heavy metals in a water system nearby metal mining areas in Pingquan City. Although the average concentrations of various elements in surface water and groundwater were lower than the health-based guideline values proposed by the WHO Guidelines and the national standards of China, some sampling sites still exhibited exceedances of the standards, which require ongoing attention. From the perspective of the watershed distribution, the higher concentrations of Mn, As, Pb, Ni, Al, and V were monitored at some sites in the Bao River basin due to the large number of tailings ponds, abandoned quarries, and mines in the area. The health risk assessment results in this study showed that As presented a low non-carcinogenic risk in surface water and groundwater, and ingestion was the main exposure pathway for adverse effects on the human body. While As in surface water posed an acceptable carcinogenic risk through ingestion for both adults and children, Mn in groundwater presented a low non-carcinogenic risk to human health.
Notably, the toxicity of heavy metals is also influenced by their valence states; therefore, considering only the total concentration may be inadequate. Additionally, parameters such as the average weight of residents, exposure duration, and daily intake exhibit regional variations, which may lead to uncertainty in calculating potential risks. Despite these limitations, our study still offers a scientific reference for assessing water quality and health impacts in industrial cities. Considering that this study only conducted monitoring during the wet season, future studies could collect water samples during the dry season to determine the spatiotemporal variations of heavy metals. Because most private wells do not adhere to drinking water standards and lack water purification facilities, long-term monitoring of the Bao River Basin, especially for As, should also be strengthened. Meanwhile, future research should utilize hydrological models to simulate the seepage paths of tailings ponds and detect the concentrations of heavy metals in the soil around mines, promoting ecological environment restoration and governance, as well as the comprehensive utilization of resources in areas near mines.
Data availability statement
The original contributions presented in the study are included in the article/supplementary material, further inquiries can be directed to the corresponding authors.
Author contributions
JW: Conceptualization, Methodology, Software, Writing – original draft. HZ: Data curation, Formal analysis, Visualization, Writing – original draft, Writing – review & editing. JL: Project administration, Writing – review & editing. SH: Resources, Writing – review & editing. JS: Investigation, Writing – review & editing. XL: Funding acquisition, Writing – review & editing. DS: Supervision, Writing – review & editing. XN: Validation, Writing – review & editing.
Funding
The author(s) declare that financial support was received for the research and/or publication of this article. This research was funded by National Groundwater Monitoring Network Operation and Maintenance (Langfang Center, China), with grant number DD20251300106; Langfang Normal University Doctoral Research Startup Project, with grant number XBQ202412; the project of China Geological Survey, with grant number DD20230701103; the Yan-Zhao Shanshui Science and Technology Innovation Fund, with grant number YZSSJJ202401-001; the Open Fund Project of Key Laboratory of Groundwater Science and Engineering, Ministry of Natural Resources, with grant number SK202301-4, the project of Key Laboratory of Coupled Processes and Effects of Natural Resource Elements, Ministry of Natural Resources, with grant number 2022KFKTC009.
Conflict of interest
The authors declare that the research was conducted in the absence of any commercial or financial relationships that could be construed as a potential conflict of interest.
Generative AI statement
The author(s) declare that no Gen AI was used in the creation of this manuscript.
Any alternative text (alt text) provided alongside figures in this article has been generated by Frontiers with the support of artificial intelligence and reasonable efforts have been made to ensure accuracy, including review by the authors wherever possible. If you identify any issues, please contact us.
Publisher's note
All claims expressed in this article are solely those of the authors and do not necessarily represent those of their affiliated organizations, or those of the publisher, the editors and the reviewers. Any product that may be evaluated in this article, or claim that may be made by its manufacturer, is not guaranteed or endorsed by the publisher.
References
Abdo, N., Alhamid, A., Abu-Dalo, M., Graboski-Bauer, A., and Al Harahsheh, M. (2024). Potential health risk assessment of mixtures of heavy metals in drinking water. Groundw. Sustain. Dev. 25:101147. doi: 10.1016/j.gsd.2024.101147
Alqahtani, F. Z., DaifAllah, S. Y., Alaryan, Y. F., Elkhaleefa, A. M., and Brima, E. I. (2020). Assessment of major and trace elements in drinking groundwater in Bisha Area, Saudi Arabia. J. Chem. 2020, 1–10. doi: 10.1155/2020/5265634
Ayyamperumal, R., Muthusamy, B., Huang, X., Chengjun, Z., Nazir, N., and Li, F. (2024). Spatial distribution and seasonal variation of trace hazardous elements contamination in the coastal environment. Environ. Res. 243:117780. doi: 10.1016/j.envres.2023.117780
Badeenezhad, A., Soleimani, H., Shahsavani, S., Parseh, I., Mohammadpour, A., Azadbakht, O., et al. (2023). Comprehensive health risk analysis of heavy metal pollution using water quality indices and monte carlo simulation in R software. Sci. Rep. 13:15817. doi: 10.1038/s41598-023-43161-3
Bhutiani, R., Kulkarni, D. B., Khanna, D. R., and Gautam, A. (2015). Water quality, pollution source apportionment and health risk assessment of heavy metals in groundwater of an industrial area in North India. Expo. Health 8, 3–18. doi: 10.1007/s12403-015-0178-2
Canpolat, Ö., Varol, M., Okan, Ö. Ö., Eriş, K. K., and Çaglar, M. (2020). A comparison of trace element concentrations in surface and deep water of the Keban Dam Lake (Turkey) and associated health risk assessment. Environ. Res. 190:110012. doi: 10.1016/j.envres.2020.110012
Celis-Hernandez, O., Canales-Delgadillo, J. C., Girón-García, M. P., Ontiveros-Cuadras, J. F., Ward, R. D., Pérez-Ceballos, R. Y., et al. (2025). Land use effects in trace element concentrations and bird biodiversity in mangrove environments within a natural protected area. Chemosphere 378:144396. doi: 10.1016/j.chemosphere.2025.144396
Chai, N., Yi, X., Xiao, J., Liu, T., Liu, Y., Deng, L., et al. (2021). Spatiotemporal variations, sources, water quality and health risk assessment of trace elements in the Fen river. Sci. Total Environ. 757:143882. doi: 10.1016/j.scitotenv.2020.143882
EPA (2004). Risk Assessment Guidance for Superfund Volume I: Human Health Evaluation Manual (Part E, Supplemental Guidance for Dermal Risk Assessment) Final. Washington, DC: Office of Superfund Remediation and Technology Innovation U.S. Environmental Protection Agency.
Etikala, B., Vangala, S., and Madhav, S. (2024). Groundwater geochemistry using modified integrated water quality index (iwqi) and health indices with special emphasis on nitrates and heavy metals in southern parts of Tirupati, South India. Environ. Geochem. Health 46:465. doi: 10.1007/s10653-024-02229-3
Ezugwu, C. K., Onwuka, O. S., Egbueri, J. C., Unigwe, C. O., and Ayejoto, D. A. (2019). Multi-criteria approach to water quality and health risk assessments in a rural agricultural province, Southeast Nigeria. HydroResearch 2, 40–48. doi: 10.1016/j.hydres.2019.11.005
Gao, B., Gao, L., Gao, J., Xu, D., Wang, Q., and Sun, K. (2019). Simultaneous evaluations of occurrence and probabilistic human health risk associated with trace elements in typical drinking water sources from major river basins in China. Sci. Total Environ. 666, 139–146. doi: 10.1016/j.scitotenv.2019.02.148
He, M., Liu, G., Li, Y., Zhou, L., Arif, M., and Liu, Y. (2023). Spatial-temporal distribution, source identification, risk assessment and water quality assessment of trace elements in the surface water of typical tributary in Yangtze River Delta, China. Mar. Pollut. Bull. 192:115035. doi: 10.1016/j.marpolbul.2023.115035
Labonté-Raymond, P.-L., Pabst, T., Bussière, B., and Bresson, É. (2020). Impact of climate change on extreme rainfall events and surface water management at mine waste storage facilities. J. Hydrol. 590:125383. doi: 10.1016/j.jhydrol.2020.125383
Li, L., Wu, J., Lu, J., Li, K., Zhang, X., and Min, X. (2022). Water quality evaluation and ecological-health risk assessment on trace elements in surface water of the Northeastern Qinghai-Tibet Plateau. Ecotoxicol. Environ. Saf. 241:113775. doi: 10.1016/j.ecoenv.2022.113775
Liu, L., Yang, M., Li, Q., Tang, Y., Wen, H., Yuan, Y., et al. (2024). Mineralogy and geochemistry of turquoise from Tianhu East, Xinjiang, China. Gems Gemol. 60, 2–25. doi: 10.5741/GEMS.60.1.2
Long, J., and Luo, K. (2020). Elements in surface and well water from the Central North China plain: enrichment patterns, origins, and health risk assessment. Environ. Pollut. 258:113725. doi: 10.1016/j.envpol.2019.113725
Meng, F., Cao, R., Zhu, X., Zhang, Y., Liu, M., and Wang, J. (2024). A nationwide investigation on the characteristics and health risk of trace elements in surface water across China. Water Res. 250:121076. doi: 10.1016/j.watres.2023.121076
Meng, Q., Zhang, J., Zhang, Z., and Wu, T. (2016). Geochemistry of dissolved trace elements and heavy metals in the dan river drainage (China): distribution, sources, and water quality assessment. Environ. Sci. Pollut. Res. 23, 8091–8103. doi: 10.1007/s11356-016-6074-x
Meng, Y., Wu, J., Li, P., and Wang, Y. (2023). Distribution characteristics, source identification and health risk assessment of trace metals in the coastal groundwater of Taizhou City, China. Environ. Res. 238:117085. doi: 10.1016/j.envres.2023.117085
Moradnia, M., Broberg, K., Lozano, M., Chavoshani, A., Salari, M., Attar, H. M., et al. (2024). Assessing the carcinogenic and non-carcinogenic health risks of metals in the drinking water of Isfahan, Iran. Sci. Rep. 14:5029. 10.1038/s41598-024-55615-3. doi: 10.1038/s41598-024-55615-3
Northey, S. A., Mudd, G. M., Saarivuori, E., Wessman-Jääskeläinen, H., and Haque, N. (2016). Water footprinting and mining: where are the limitations and opportunities? J. Cleaner Prod. 135, 1098–1116. doi: 10.1016/j.jclepro.2016.07.024
Ntona, M. M., Busico, G., Mastrocicco, M., and Kazakis, N. (2022). Modeling groundwater and surface water interaction: an overview of current status and future challenges. Sci. Total Environ. 846:157355. doi: 10.1016/j.scitotenv.2022.157355
Şener, S., Şener, E., and Davraz, A. (2017). Evaluation of water quality using water quality index (Wqi) Method and Gis in Aksu River (Sw-Turkey). Sci. Total Environ. 584–585, 131–144. doi: 10.1016/j.scitotenv.2017.01.102
Sudharshan Reddy, Y., and Sunitha, V. (2023). Assessment of heavy metal pollution and its health implications in groundwater for drinking purpose around inactive mines, Sw region of Cuddapah Basin, South India. Total Environ. Res. Themes 8:100069. doi: 10.1016/j.totert.2023.100069
Tong, S., Li, H., Tudi, M., Yuan, X., and Yang, L. (2021). Comparison of characteristics, water quality and health risk assessment of trace elements in surface water and groundwater in China. Ecotoxicol. Environ. Saf. 219:112283. doi: 10.1016/j.ecoenv.2021.112283
Uddin, M. G., Nash, S., Rahman, A., and Olbert, A. I. (2023). Assessing optimization techniques for improving water quality model. J. Cleaner Prod. 385:135671. doi: 10.1016/j.jclepro.2022.135671
Wang, P., Sun, Z., Hu, Y., and Cheng, H. (2019). Leaching of heavy metals from abandoned mine tailings brought by precipitation and the associated environmental impact. Sci. Total Environ. 695:133893. doi: 10.1016/j.scitotenv.2019.133893
Wang, R., Wu, X., Zhai, Y., Su, Y., and Liu, C. (2021). An experimental study on the sources of strontium in mineral water and general rules of its dissolution—a case study of Chengde, Hebei. Water 13:699. doi: 10.3390/w13050699
Wang, X., Zhang, L., Zhao, Z., and Cai, Y. (2018). Heavy metal pollution in reservoirs in the hilly area of Southern China: distribution, source apportionment and health risk assessment. Sci. Total Environ. 634, 158–169. doi: 10.1016/j.scitotenv.2018.03.340
Wu, H., Zhi, Y., Xiao, Q., Yu, F., Cao, G., Xu, X., et al. (2025). Source-oriented health risk of heavy metals in sediments: a case study of an industrial city in China. Ecotoxicol. Environ. Saf. 292:117929. doi: 10.1016/j.ecoenv.2025.117929
Xiao, H., Shahab, A., Li, J., Xi, B., Sun, X., He, H., et al. (2019). Distribution, ecological risk assessment and source identification of heavy metals in surface sediments of Huixian Karst Wetland, China. Ecotoxicol. Environ. Saf. 185:109700. doi: 10.1016/j.ecoenv.2019.109700
Xiao, J., Wang, L., Deng, L., and Jin, Z. (2019). Characteristics, sources, water quality and health risk assessment of trace elements in river water and well water in the Chinese Loess Plateau. Sci. Total Environ. 650, 2004–2012. doi: 10.1016/j.scitotenv.2018.09.322
Zhou, J., Wu, Q., Gao, S., Zhang, X., Wang, Z., Wu, P., et al. (2023). Coupled controls of the infiltration of rivers, urban activities and carbonate on trace elements in a karst groundwater system from Guiyang, Southwest China. Ecotoxicol. Environ. Saf. 249:114424. doi: 10.1016/j.ecoenv.2022.114424
Keywords: heavy metals, water quality, surface water, groundwater, health risk assessment, mining areas
Citation: Wang J, Zhang H, Liu J, Hu S, Shi J, Li X, Song D and Niu X (2025) Distribution characteristics, source identification, and health risk assessment of heavy metals in surface water and groundwater: a case study in mining-affected areas. Front. Water 7:1639009. doi: 10.3389/frwa.2025.1639009
Received: 01 June 2025; Accepted: 19 September 2025;
Published: 17 October 2025.
Edited by:
Teddie O. Rahube, Botswana International University of Science and Technology, BotswanaReviewed by:
Suhail A. Lone, University of Kashmir, IndiaBalaji Etikala, Yogi Vemana University, India
Copyright © 2025 Wang, Zhang, Liu, Hu, Shi, Li, Song and Niu. This is an open-access article distributed under the terms of the Creative Commons Attribution License (CC BY). The use, distribution or reproduction in other forums is permitted, provided the original author(s) and the copyright owner(s) are credited and that the original publication in this journal is cited, in accordance with accepted academic practice. No use, distribution or reproduction is permitted which does not comply with these terms.
*Correspondence: He Zhang, emhhbmdoZUBsZm51LmVkdS5jbg==; Junjian Liu, bGl1anVuamlhbkBtYWlsLmNncy5nb3YuY24=