 Manoj Kumar
 D. K. Singh2
 Indra Mani
 Manoj Khanna
- 1ICAR-Indian Institute of Soil and Water Conservation, Chandigarh, India
- 2ICAR-Indian Agricultural Research Institute, New Delhi, India
- 3ICAR-Indian Institute of Water Management, Bhubaneswar, Odisha, India
- 4Vasantrao Naik Marathwada Krishi Vidyapeeth, Parbhani, Maharashtra, India
Declining groundwater table is a big sustainability challenge at Rasoolpur Jatan village of Shahpur block in Western U.P, India. This study was conducted in farmer’s fields to assess the impact of different water management technologies on water table fluctuations, aiming to develop a sustainable strategy for groundwater utilization. To simulate the future groundwater table behaviour, modeling was done. Sugarcane is a high water-demanding crop, and the maximum part of study area is under sugarcane crop, and irrigation is being done through earthen field channels. When irrigation is applied through earthen field channel with measured Application Efficiency (Ea) of 60% (baseline), the water table would decline by 0.59 meters per year (m/yr.) with respect to 2015 pre-monsoon water table of 223.31 m. When seepage loss (6%) in earthen field channel was saved (scenario 2), the water table decline would reduce to 0.46 m/yr. Laser land leveler was used and save 17% water (scenario 3), in this case water table would decline by 0.10 m/yr. If 50% sugarcane area replaced with Kharif maize (scenario 4), then water table would rise by 0.54 m/yr. Groundwater savings under scenario 2, 3, and 4 are calculated as 24.54 ha-m, 69.53 ha-m, and 159.56 ha-m, respectively, compared to the baseline. The projected groundwater table for the year 2030 under four scenarios are 213.84, 215.96, 221.67 and 232.05 m, respectively. Results suggested that to maintain the groundwater sustainability change the cropping pattern to avoid excess use of groundwater, grow other high value crops with the help of modern irrigation system which have low water demand.
1 Introduction
Groundwater is a critical natural resource that sustains agriculture, ecosystems, and human well-being. Meeting the irrigation and drinking water demands, groundwater also supports a wide range of ecosystem services, including water supply, food production, climate regulation, baseflow to rivers, supporting nutrient cycling and biodiversity as well as cultural services like livelihood security, traditional practices (Griebler and Avramov, 2015; Famiglietti, 2014; De Graaf et al., 2019). However, in many regions, unsustainable groundwater extraction threatens these services, making Water Management Technologies (WMTs) crucial for balancing human and ecosystem needs. Water management technologies can be broadly classified into conveyance and application efficiency technologies like lining of field channels, underground pipelines, drip and sprinkler irrigation, laser land levelling which reduce conveyance losses and improve uniform water distribution, thereby lowering groundwater abstraction (da Cunha et al., 2020; Chouhan et al., 2021). Other water management technology is recharge enhancement technologies such as check dams, percolation tanks, recharge wells, managed aquifer recharge which can enhance natural recharge, sustain baseflow to rivers, and buffer against seasonal variability. Similarly, cropping system and demand-side management technology like crop diversification (replacing paddy/sugarcane with millets/maize), deficit irrigation, and precision agriculture (Bhan et al., 2023; Chandrasekhar et al., 2023). It can reduce consumptive water demand and ensure sustainable aquifer balance. Policy and institutional innovations technologies like water pricing, groundwater energy–irrigation nexus reforms, participatory groundwater management can influence farmer behaviour, regulate extraction, and promote sustainable practices at community level (Shah, 2021; Scanlon et al., 2022; Roy et al., 2022).
Adoption of laser land leveling in Punjab and Haryana improved irrigation efficiency by 17–25%, reducing groundwater pumping, though aquifer decline continues where water-intensive crops dominate (Jat et al., 2009; Sharma B. R. et al., 2018; Sharma N. et al., 2018). Check dams in semi-arid Gujarat raised groundwater levels by 2–5 m and improved agricultural yields (Shah, 2014). Large-scale promotion of drip irrigation in arid Xinjiang significantly reduced groundwater abstraction for cotton cultivation, while managed aquifer recharge in North China Plain stabilized falling water tables (Shen et al., 2015; Liu et al., 2020). In the Segura River Basin, introduction of water-saving irrigation combined with groundwater recharge ponds enhanced aquifer resilience and secured ecosystem services such as wetland preservation (Custodio et al., 2016). Managed aquifer recharge (MAR) in California’s Central Valley, through floodwater spreading and recharge basins, has been effective in replenishing aquifers stressed by irrigation, while also maintaining baseflow for aquatic ecosystems (Scanlon et al., 2016). The Murray–Darling Basin implemented water allocation reforms and on-farm efficiency measures, which not only reduced extraction but also safeguarded ecosystem services like river flows and wetland health (Grafton et al., 2018). Global groundwater abstraction has been steadily rising over recent decades due to increasing agricultural, industrial, and domestic demands (Wada and Bierkens, 2014; Jasechko and Perrone, 2021).
In India, agriculture sector remains the dominant water consumer, accounting for 89–90% of total freshwater use (NITI Aayog, 2019; FAO, 2021), with about 63% of irrigated areas relying on groundwater (World Bank, 2022; CGWB, 2021). This growing dependence has led to a severe imbalance between natural recharge and extraction, triggering widespread groundwater depletion, particularly in water-stressed and agriculturally intensive regions (Rodell et al., 2018; Mishra et al., 2022; Mishra et al., 2021). Groundwater over-extraction threatens both local water and food security and has global ramifications due to embedded water in food exports (Richey et al., 2015; Jasechko et al., 2017; Dalin et al., 2020). In Northern India, particularly in the alluvial aquifers, excessive groundwater extraction driven by agricultural and domestic demands is causing significant stress (CGWB, 2022; Jain et al., 2022). Understanding aquifer responses to changing recharge and extraction patterns is critical for sustainable groundwater management. Groundwater modeling serves as a valuable tool to analyze aquifer behaviour under various management scenarios (Jain et al., 2019; Sophocleous, 2020; Li et al., 2021). Simulation models like MODFLOW (McDonald and Harbaugh, 1988) are widely used to assess impacts of water management strategies, land-use changes, and climate variability on groundwater systems (Jha et al., 2019; Singh et al., 2020; Gupta and Kumar, 2021). A groundwater flow model integrated with a compaction module has also been used to propose strategies such as optimizing recharge, reducing export of high-water demanding crops, relocating pumping stations, and managing local consumption to combat land subsidence and groundwater depletion (Chaussard et al., 2017; Kim et al., 2021).
Technologies that improve water use efficiency such as drip and sprinkler irrigation, laser land leveling, zero tillage, direct seeded rice, System of Rice Intensification (SRI), conservation agriculture, crop diversification, site-specific water conservation structures, and rainwater harvesting have shown potential to reduce groundwater extraction while maintaining or increasing agricultural productivity (Kabat et al., 2003; Fishman et al., 2015 Jain et al., 2021). However, their regional impacts need to be thoroughly evaluated. Integrating such efficient water management technologies into groundwater governance can help curb further depletion and ensure long-term sustainability (Kumar M. D. et al., 2020; Kumar R. et al., 2020; Jain et al., 2021; FAO, 2022). These strategies reduce groundwater withdrawals by enhancing irrigation efficiency, promoting sustainable crop choices, and improving recharge.
The present study focuses in Shahpur block of Western Uttar Pradesh, a region characterized by high water-intensive crops such as sugarcane, rice, and wheat. Groundwater levels in the region have been rapidly declining due to over-extraction. As groundwater levels decline, farmers are forced to invest in more powerful submersible pumps, increasing both energy and financial costs (Kumar M. D. et al., 2020a; Kumar R. et al., 2020a; Singh et al., 2021). Several pockets in the district are categorized as over-exploited, semi-critical, or fall under the dark zone classification. Given ongoing population growth and agricultural intensification, groundwater withdrawals are expected to rise further. It is crucial to assess the effectiveness of water-saving technologies and practices in maintaining regional groundwater balance.
2 Materials and methods
The study area, Rasoolpur Jatan in Muzaffarnagar district (Figure 1), is located between latitudes 29°20′N to 29°23′N and longitudes 77°33′E to 77°36′E. The elevation ranges from 237 to 245 meters above mean sea level1 (Figure 2). The meteorological data was obtained from the India Meteorological Department (IMD). This data was analysed and found that the region experiences a hot, dry sub-humid climate with an average annual rainfall of 873 mm, the majority of which occurs between July and October. During winter, the average minimum temperature varies from 7.3 °C to 13.5 °C, while the maximum temperature ranges from 18.5 °C to 28.6 °C. In the summer months, the minimum and maximum temperatures range from 13.5 °C to 24.6 °C and 30 °C to 41 °C, respectively. The highest temperatures are typically observed in June and the lowest in January. The area has an average annual relative humidity of 72%. The soils in the region are primarily medium-textured alluvial soils. Sugarcane is the dominant crop (Table 1), and irrigation is predominantly dependent on groundwater. However, the overexploitation of groundwater has led to a rapid decline in water levels. Piezometers were installed to monitor groundwater level data for the year 2012 and 2015. Different maps were developed using ArcGIS 10.2.2. The crop water requirements were estimated using the FAO CROPWAT 8.0 model. Aquifer modeling was conducted to evaluate groundwater recharge and fluctuations in water levels.
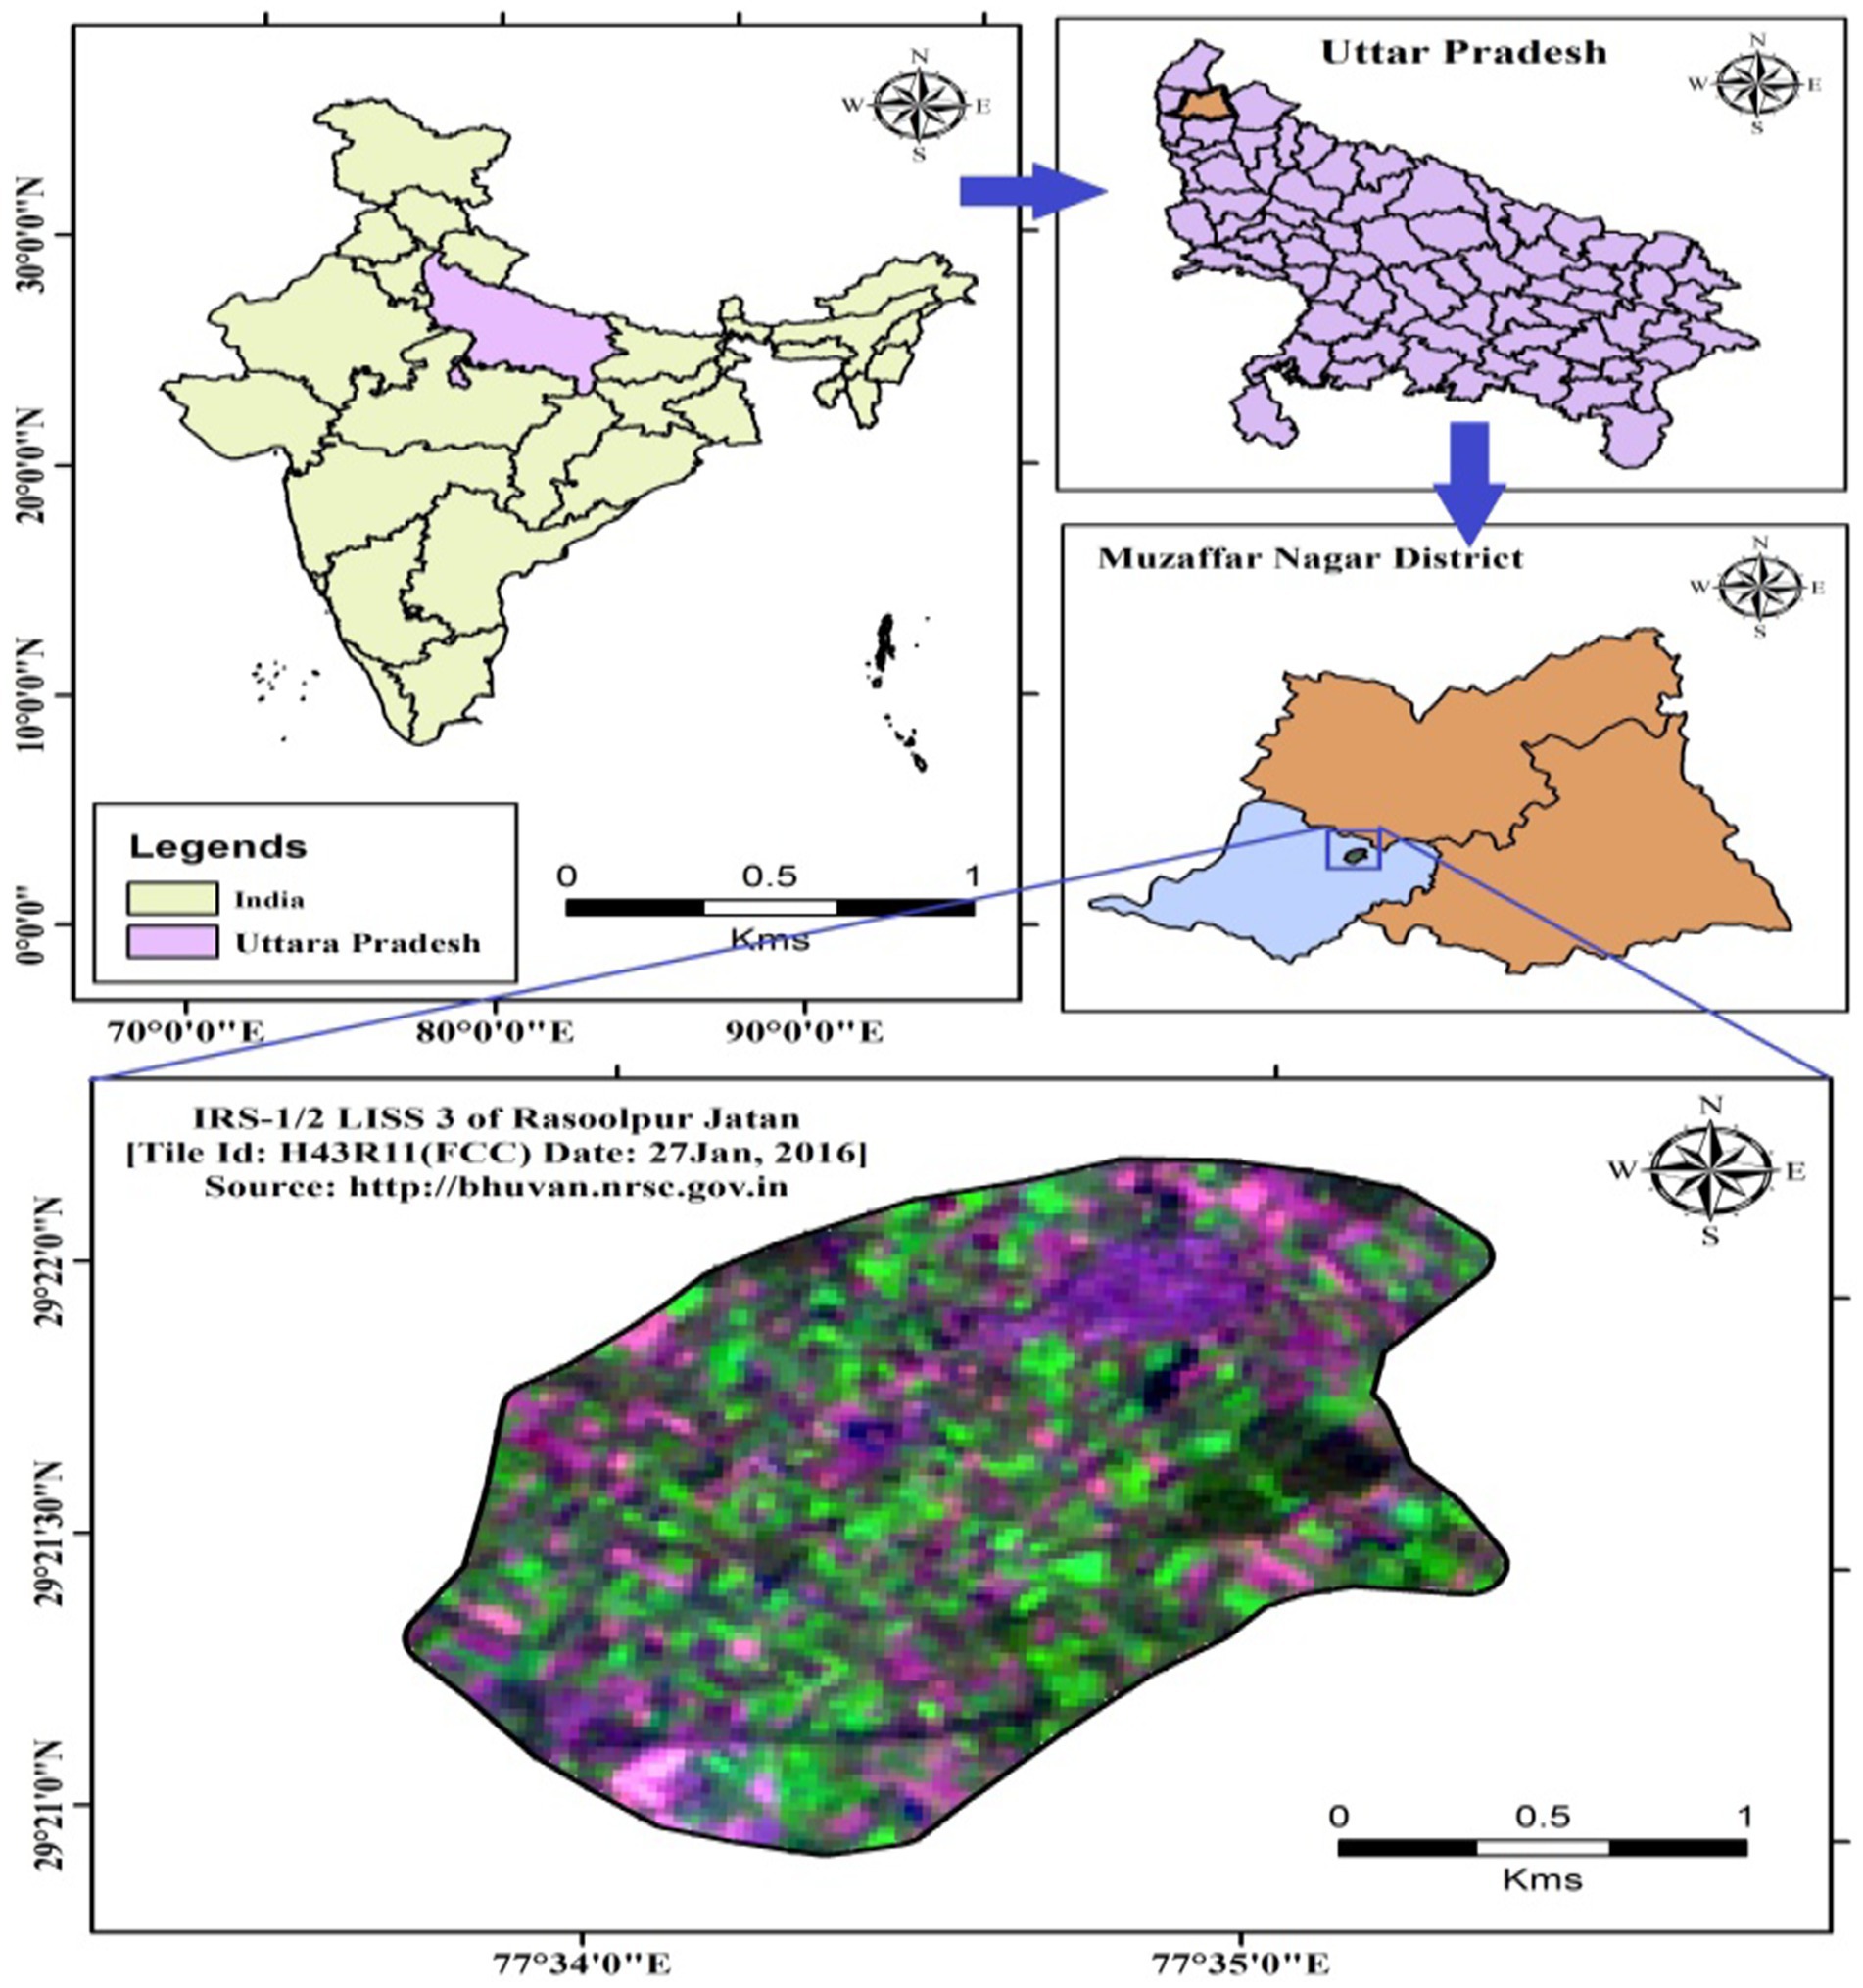
Figure 1. Location map of study area.
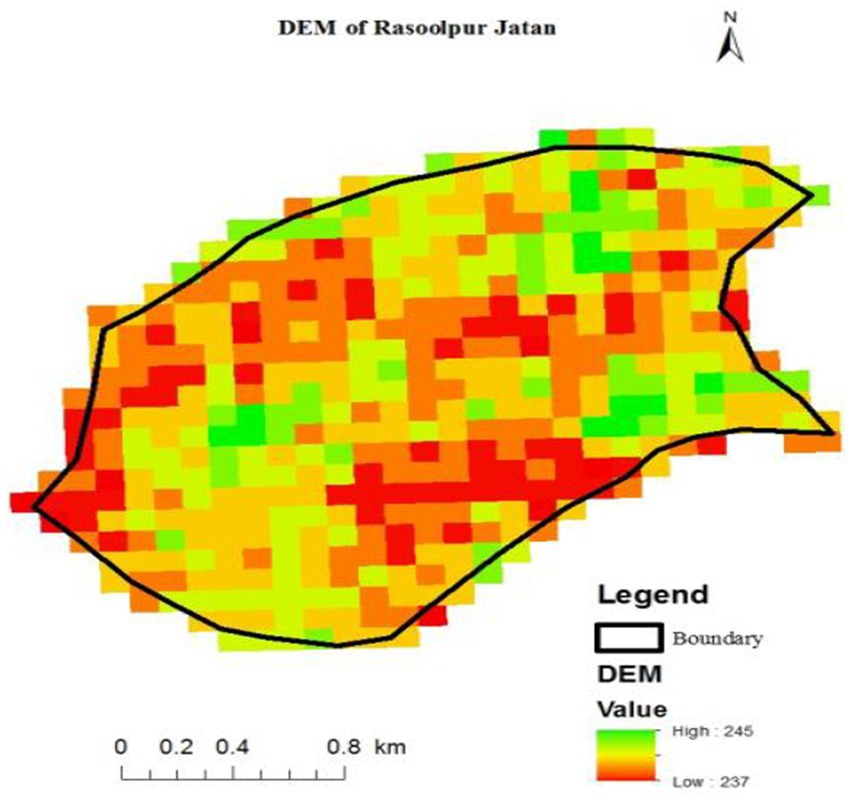
Figure 2. Digital elevation model of study area.
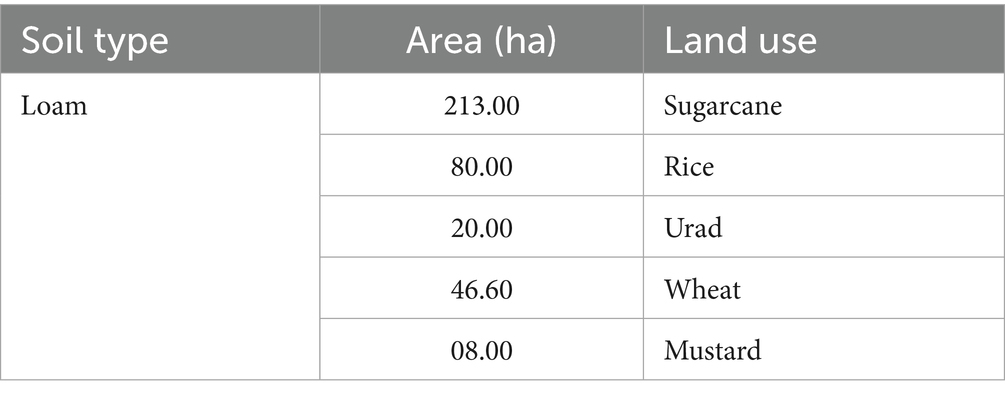
Table 1. Soil type and area under various land use.
MODFLOW is a widely used numerical model for simulating saturated groundwater flow, originally developed by the United States Geological Survey (USGS) (McDonald and Harbaugh, 1988), and has since undergone several advancements, with the most recent versions like MODFLOW 6 offering improved modular structure and capabilities for simulating complex groundwater systems (Langevin et al., 2017; Hughes et al., 2021) was employed to simulate three-dimensional groundwater flow dynamics in the Rasoolpur Jatan aquifer system. MODFLOW was chosen for this study due to its widespread acceptance and reliability in simulating groundwater systems. It is extensively used and supported by both public institutions and private sectors worldwide for groundwater flow modeling, owing to its user-friendly interface, and capability to handle complex hydrogeological conditions (Harbaugh, 2005; Langevin et al., 2017; Ranjan et al., 2023). MODFLOW is a computer-based modeling program that numerically solves the three-dimensional groundwater flow equation for porous media using the finite-difference method (McDonald and Harbaugh, 1988). MODFLOW is a physically-based simulation model that represents groundwater flow dynamics by applying the principles of mass conservation in conjunction with Darcy’s law (Harbaugh, 2005; Langevin et al., 2017). MODFLOW provides flexibility by allowing the selection of various mixed-type boundary conditions, making it suitable for simulating confined, unconfined, or combined aquifer systems. To input data into the model and visualize the model outputs, Processing MODFLOW for Windows (PMWIN) version 5.3 is employed (Chiang and Kinzelbach, 1998). MODFLOW is capable of simulating the impacts of groundwater pumping, recharge, and interactions with surface water bodies (Reilly et al., 2015). In MODFLOW, the governing flow equation used is given (Equation 1).
where Kxx, Kyy, Kzz are the hydraulic conductivities along x, y and z directions (LT−1), h is the total head (L), W is the volumetric flow of sources and sinks per unit volume (T−1), Ss stands for specific storage (L−1) and t stands for time (T). The sequence of activities and the modeling procedure are illustrated in Figure 3.
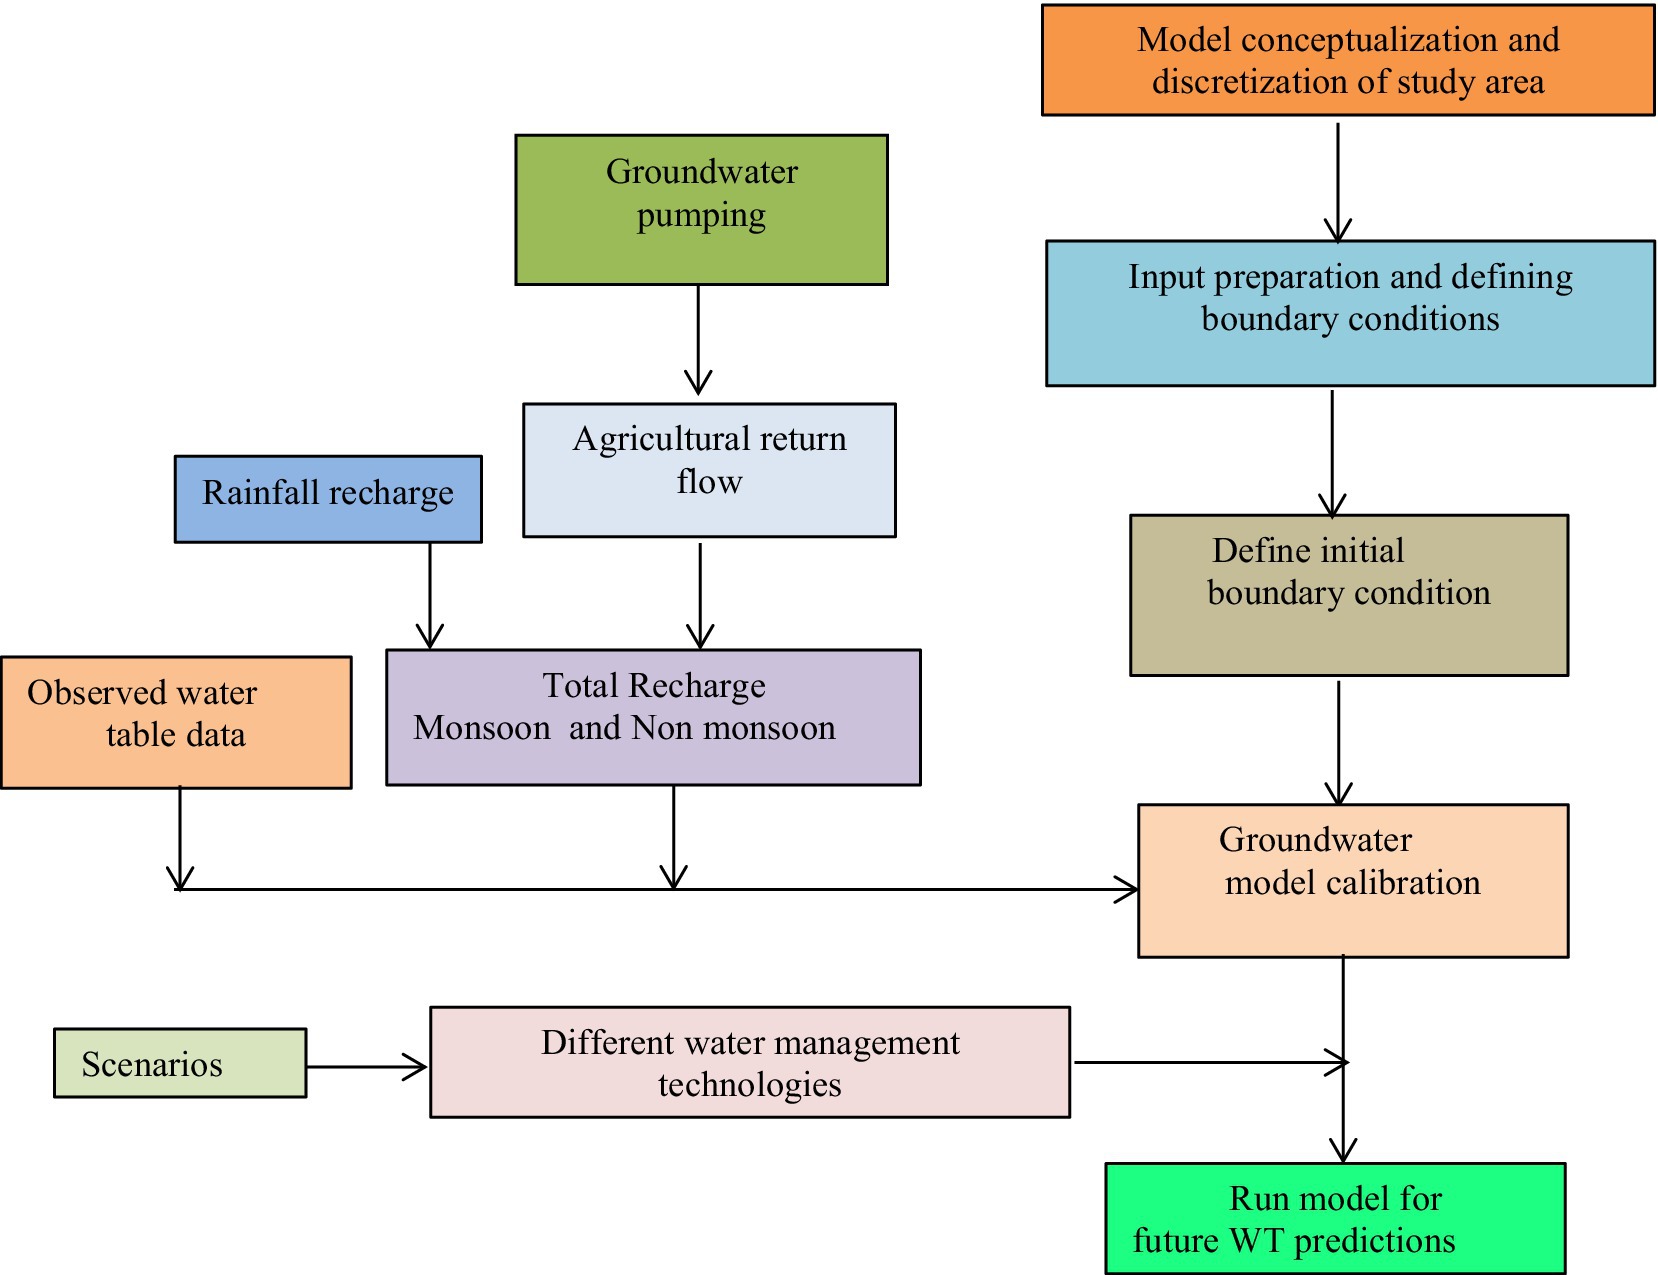
Figure 3. Modeling flow chart.
Developing a modeling concept is the foundational and most crucial step in any groundwater modeling study. It requires an in-depth understanding of the hydrogeological framework, hydrological processes, and groundwater flow dynamics within and around the study area (Anderson et al., 2015; Refsgaard et al., 2012). A detailed hydrologic and geologic characterization of the study area was done using the information of well logs. Analysis of well logs showed that there are three specific groups of aquifers occurring in the area down to 463.00 mbgl (CGWB, 2017). The first unconfined aquifer in the study area exhibits variable thickness, extending down to approximately 185 meters below ground level (mbgl) in certain locations. Rasoolpur Jatan predominantly overlies an alluvial aquifer system, where tube wells depths ranging from 82.30 m to 88.42 m and are primarily used to extract water from unconfined layer. Groundwater recharge mainly occurs through rainfall and return flow from irrigated fields. A Digital Elevation Model (DEM) shapefile was utilized to analyze surface elevation variability and assist in spatial discretization of the study area. The model grid was structured with 26 rows and 30 columns, each cell measuring 80 × 80 meters (Figure 4). Out of the total 780 grid cells, 250 cells fell outside the model boundary and were marked as inactive, leaving 530 active cells within the study domain. In present study temporal discretization in MODFLOW was structured using three transient stress periods to represent a full hydrological year: July to October (123 days), November to February (120 days), and March to June (122 days). In a MODFLOW groundwater model, a stress period refers to a defined interval of simulation time during which all model inputs such as pumping rates, recharge, stream stages, and boundary conditions are assumed to remain constant and one can configure multiple stress periods sequentially in a year, each reflecting a change in boundary conditions. Each stress period is subdivided into shorter computational intervals called time steps. These are the actual intervals at which the model calculates the groundwater head. The number and length of time steps can be customized to capture the dynamics of the flow accurately. Within each stress period, a daily time step was employed, enabling the model to simulate groundwater flow dynamics.
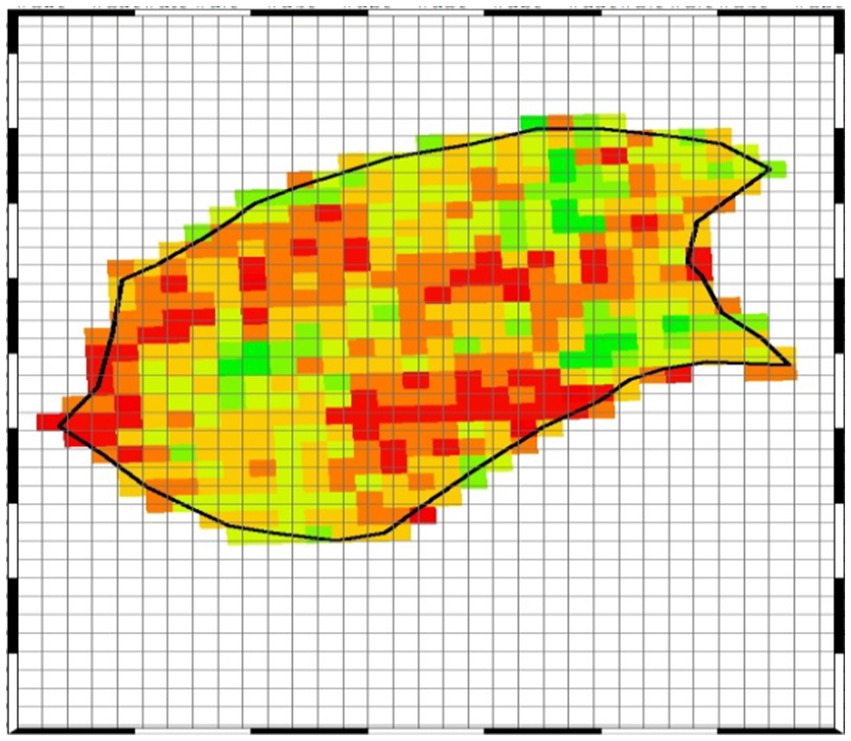
Figure 4. Study area discretization.
The observed hydraulic head data from May 2012 were used to define the initial conditions for the model (Table 2). Groundwater levels recorded during this period were used to create initial water table contours using the Kriging interpolation method within ArcGIS 10.2.2, which were then imported into MODFLOW. To account for subsurface inflow and outflow, selection of model boundary is important as it determines model accuracy and realism. For this flow boundaries were defined based on the selection criteria. Thus, the selection of model boundary in MODFLOW is the process of defining the limits of the model domain and specifying whether groundwater can flow in, flow out, or stay restricted at those edges. It is one of the most crucial steps in model setup, as it directly influences simulation reliability. The cells lying inside the boundary of the study area were taken as active cells whereas; cells lying outside the study area were taken as inactive cells. Hydraulic conductivity and specific yield values for the aquifers were derived from previous pumping test data from past work (CGWB, 2017). The specific yield within the study area was found to range between 0.16 and 0.22.
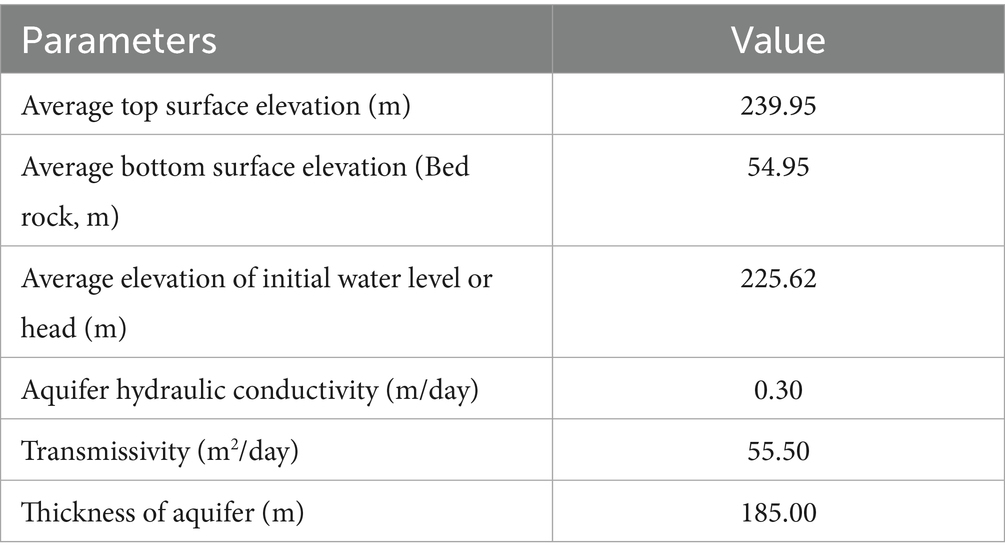
Table 2. Modflow input parameters.
Rainfall infiltration methods were employed to estimate natural groundwater recharge during the monsoon season, particularly in regions where spatial and temporal groundwater level monitoring is inadequate (GEC, 2009), also widely supported by recent studies for its effectiveness in estimating recharge under data-scarce conditions (Jha et al., 2022; Kumar and Singh, 2021; Mondal et al., 2023). The recharge in each of the four monsoon months was considered to be a given percentage of that month’s average rainfall in this study. However, it was ensured that the total recharge for the entire monsoon season did not surpass 20% of the monsoon rainfall for this region, as stated by the Central Groundwater Board (GEC, 2009).
To project future groundwater levels under various scenarios (from 2015 onward), recharge estimates were based on the 36-year average monthly rainfall. Analysis of long-term rainfall data indicated that, during the non-monsoon period, the intervals between rainfall events were lengthy and the individual rainfall amounts were minimal. Consequently, most of the rainfall during these months contributed to soil moisture storage or was lost through evaporation, with negligible percolation to the groundwater. Therefore, non-monsoon rainfall recharge was excluded from the present study. A comprehensive study analyzing data from over 5,800 groundwater wells across India (1996–2016) by IIT Gandhinagar found a strong link between rainfall intensity and groundwater recharge. In North-West and North-Central India, low-intensity rainfall (1–35 mm/day) during the monsoon contributes significantly to recharge, whereas non-monsoon or high-intensity rainfall events are less effective in generating deep percolation due to rapid runoff. GEC (2015) explicitely says to estimate non-monsoon rainfall recharge, it should be considered only when if non-monsoon rainfall exceeds 10% of the normal annual rainfall; otherwise, take it as zero. This is to avoid inflating recharge from small showers that typically do not percolate to the water table. Recharge from irrigated return flows was estimated based on the volume of groundwater extracted for crop irrigation, as guided by GEC (2009). In the study area, sugarcane and wheat fields typically receive 15 and 4 irrigations, respectively. There is a total of 220 tube wells in operation, each running approximately 8 h per day with an average discharge rate of 16.95 lit./sec. Based on the estimated recharge from return flows and groundwater abstraction, the net draft from agricultural areas was determined to be approximately 0.0033 m/day. The effect of plant transpiration through capillary rise from the saturated zone was simulated using the evapotranspiration (ET) component in the model. However, In Rasoolpur Jatan the water table is deep and the loss of groundwater due to evapotranspiration was deemed minimal in this study as the water table was much below the crop root zone depth.
The transient calibration was performed by adjusting model parameters (hydraulic conductivity, specific yield) within permissible limits, as recommended by recent studies (Zhang et al., 2020; Kumar M. D et al., 2020a) by comparing simulated and observed post-monsoon groundwater levels for the year 2012. To assess the reliability of the calibrated model, validation was performed by manual method using observed and simulated post-monsoon water table data for the year 2015. The model’s performance and predictive accuracy were evaluated using statistical indicators such as Mean Square Error (MSE), Root Mean Square Error (RMSE), and the Coefficient of Determination (R2). These metrics were calculated using the following equations (Equations 2–4).
Where,
hO = observed head,
hS = simulated head,
= mean observed head,
= mean simulated head, and.
n = the total number of observations.
Four management scenarios were considered under the present study. Each of the scenarios had different levels of groundwater pumping and water saving is increasing. The five sizes of pumps used by farmers in the study area were 15 HP, 12.5 HP, 10 HP 7.5 HP and 5 HP, respectively. The 5 HP pumps are rarely used by the farmers due to deep water table. The discharge measured at farmers field through these pumps were 22.84, 17.92, 13.75 and 13.32 L/s; respectively. Taking into account of 220 tube wells at 16.95 L/s average discharge rate for 8 h per day and major area under sugarcane (213.3 ha), Rice (46.6 ha) and Wheat (80 ha) total annual groundwater pumping was 409 hectare-meter (ha-m). The total area of the village is 336 ha. Thus, per day groundwater draft was found to be 0.0033 meter/day (m/day). Rainfall infiltration method was used to estimate natural recharge during monsoon season in places where groundwater level monitoring is insufficient in space and time (GEC, 2009). In this study, rainfall factor for groundwater recharge during monsoon season for this area was taken as 22% of rainfall in each of the four monsoon months (CGWB, 2009) and return seepage from paddy, sugarcane and wheat fields were taken as 52%, 34%, and 23%, respectively, from applied irrigation (CGWB, 2009). Thus, recharge from rice, sugarcane and wheat field were taken as 0.0013, 0.0006 and 0.00013 m/day; respectively. The groundwater recharge from rainfall in each stress period were calculated as 0.0009, 0.00008 and 0.0005 m/day; respectively. Thus, total groundwater recharge (recharge from rainfall and return seepage from irrigation field) in each stress period were found to be 0.00293, 0.00211 and 0.00253 m/day; respectively. Net groundwater recharge in each stress period was calculated by subtracting total groundwater draft from total groundwater recharge. Thus, net groundwater recharge in each stress period were found to be −0.00037, −0.00119 and −0.00077 m/day; respectively. Negative sign indicates groundwater withdrawal was more as compared to groundwater recharge in all stress period. The same procedure was followed to calculate net groundwater recharge for rest of the scenarios. The net groundwater draft from agricultural areas was found to be 0.0033 m/day when water was applied through earthen field channel with 60% application efficiency and it was considered as reference scenario for rest of the scenarios. Groundwater saving, when 6% water was saved as seepage loss, laser land lever used and saved 17% water and when change the cropping pattern by replacing 50% sugarcane area with kharif maize are 24.54, 69.53 and 159.56 ha-m thus groundwater pumping reduced to 0.0031, 0.0028 and 0.00203 m/day, respectively. In Rasoolpur Jatan, water demand is expected to rise in the future due to the expansion of population and residential buildings. This may lead to further decline in water table.
Recent studies have identified several effective strategies for enhancing groundwater recharge to mitigate the continuous decline of water tables (Sufyan et al., 2024). Artificial recharge or efficient water management technologies can be a viable option to minimize the declining trend of water table. The influence of irrigation efficiencies through various water management technologies on the Rasoolpur Jatan aquifer system was assessed in this study. The scenarios considered for simulations are described in Table 3.
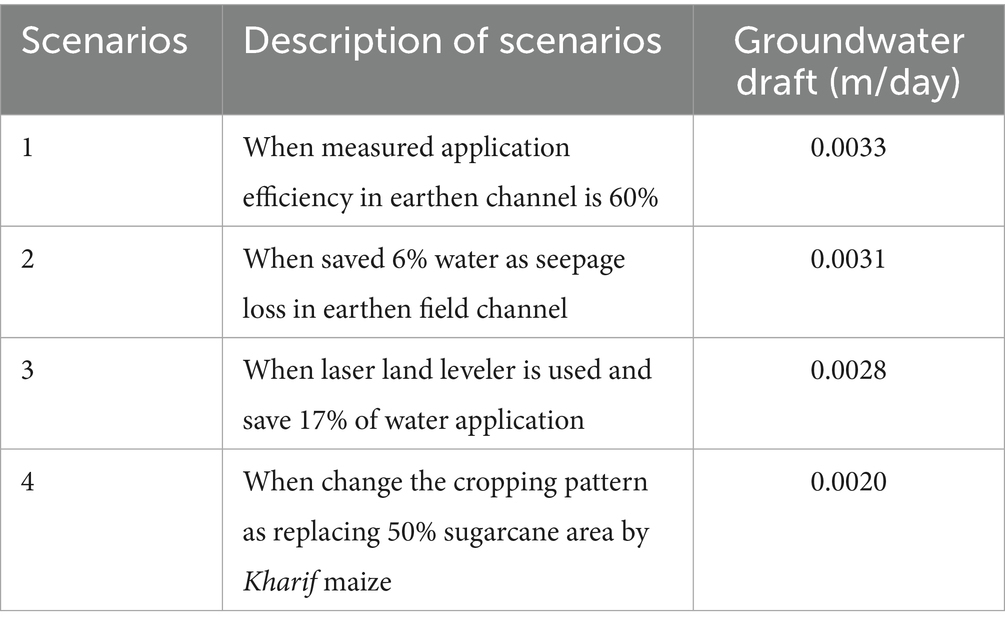
Table 3. Description of modeling scenarios considered under study.
3 Results
The groundwater flow model was subjected to a rigorous calibration and validation process to ensure its reliability for scenario analysis. During calibration (Figure 5), the coefficient of determination (R2) between observed and simulated water table elevations was 0.94, indicating a strong linear correlation (Figure 6). The mean squared error (MSE = 0.10) and root mean square error (RMSE = 0.27) confirmed a close fit. Similarly, the validation period (Figure 8), yielded an R2 of 0.93 (Figure 8), with MSE = 0.16 and RMSE = 0.40, also within satisfactory thresholds (Table 4). These findings suggest that the model successfully captured temporal dynamics of groundwater fluctuations in the study region. Model performance was benchmarked against criteria proposed by Moriasi et al. (2007) and Ritter and Muñoz-Carpena (2013), which consider Nash–Sutcliffe Efficiency (NSE) values > 0.75, RSR values < 0.50, and R2 values > 0.50 as indicators of “good to very good” model performance. In this study, the Nash–Sutcliffe Efficiency (NSE) values of 0.88 (calibration) and 0.76 (validation) fall within the “very good” (0.75–1.00) and “good” (0.65–0.75) performance categories, respectively, as suggested by Moriasi et al. (2007) (Table 4).
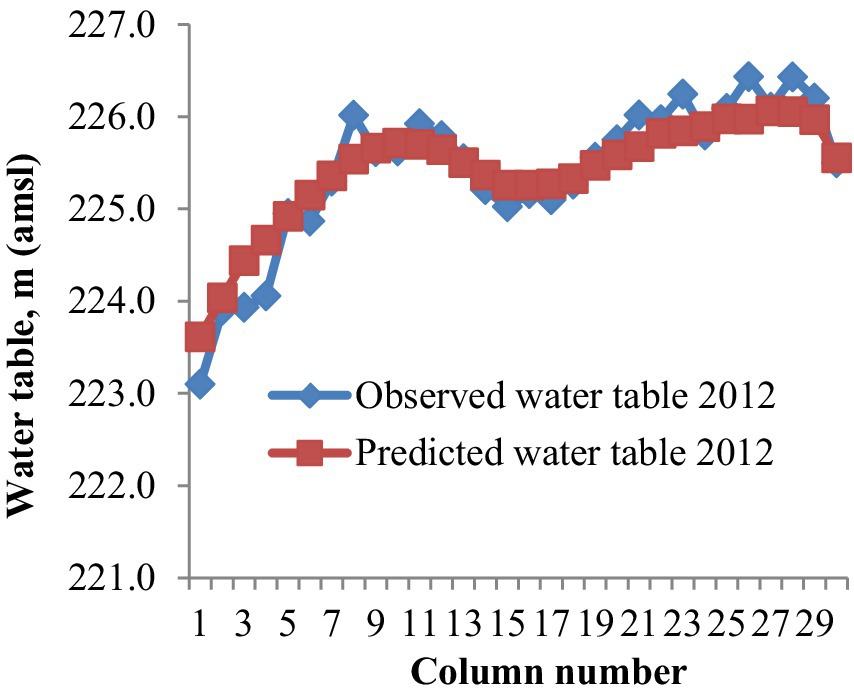
Figure 5. Comparison of observed and predicted GWT for the calibration period.
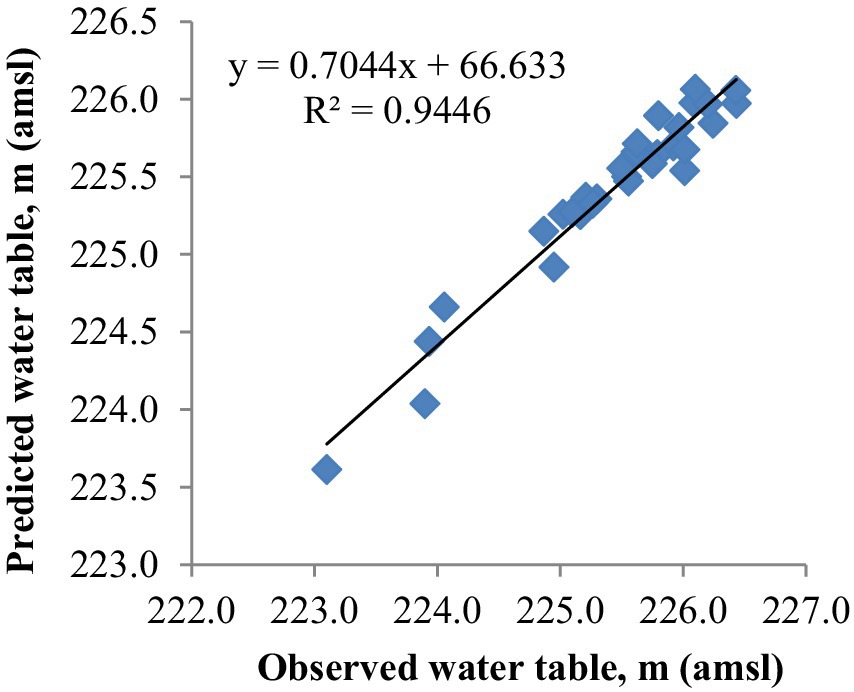
Figure 6. Scatter plot of observed and predicted GWT for the calibration period.
Table 4. Comparative statistics of calibration and validation performance.
While the calibration phase produced slightly better accuracy than validation (e.g., lower RMSE of 0.27 vs. 0.40), the decline was marginal and reflects natural variability in hydrological systems. Explicitly, the RMSE increased by 0.13 m (48%), while MSE rose by 0.06 (m2) (60%) in validation compared to calibration. This suggests a modest loss of predictive accuracy when applied beyond the calibration dataset but still within acceptable scientific limits. Scatter plots (Figures 6, 7) demonstrated that the model reliably captured observed patterns across multiple tube wells distributed in different hydrogeological zones. Although minor deviations were observed in areas with shallow water tables or intensive pumping, overall trends across space were well-represented, indicating that the model was not biased toward a particular zone within the study area (see Figure 8).
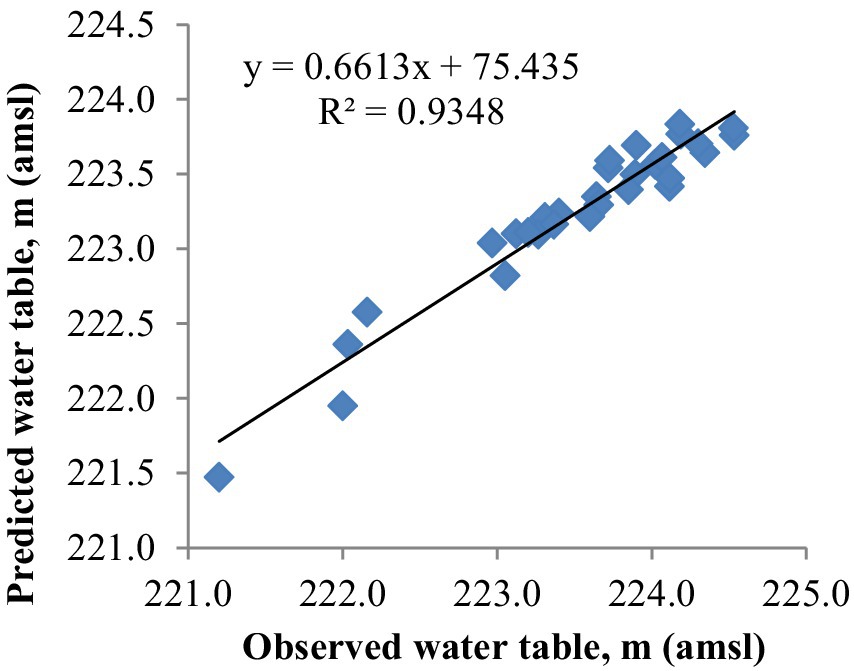
Figure 7. Scatter plot of observed and predicted GWT for the validation period.
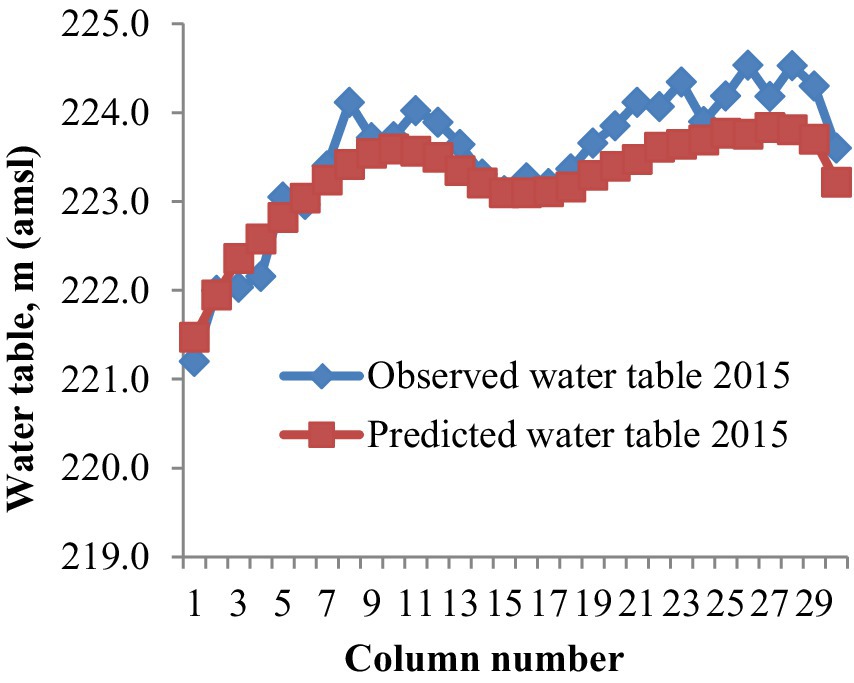
Figure 8. Comparison of observed and predicted GWT for the validation period.
Despite strong performance, uncertainties remain inherent in groundwater modeling. Potential sources include measurement errors in field water levels, simplification of hydrogeological heterogeneity, and assumptions in boundary conditions. As illustrated in Figure 9, ±RMSE confidence bands show that while most simulated values fall within acceptable deviation from observations, a few outliers exist. These deviations may reflect localized heterogeneity in aquifer properties (hydraulic conductivity variations) not fully captured by the model. The sensitivity of the model to hydraulic conductivity (0.30 m/day) and specific yield (0.22) further indicates that deviations in these parameters could influence outcomes. Confidence in the modeling results is therefore high for regional-scale assessments but should be interpreted with caution for localized predictions. Future studies could employ Monte Carlo simulations or ensemble modeling to quantify parameter uncertainty more explicitly (Beven, 2006; Gupta et al., 2009).
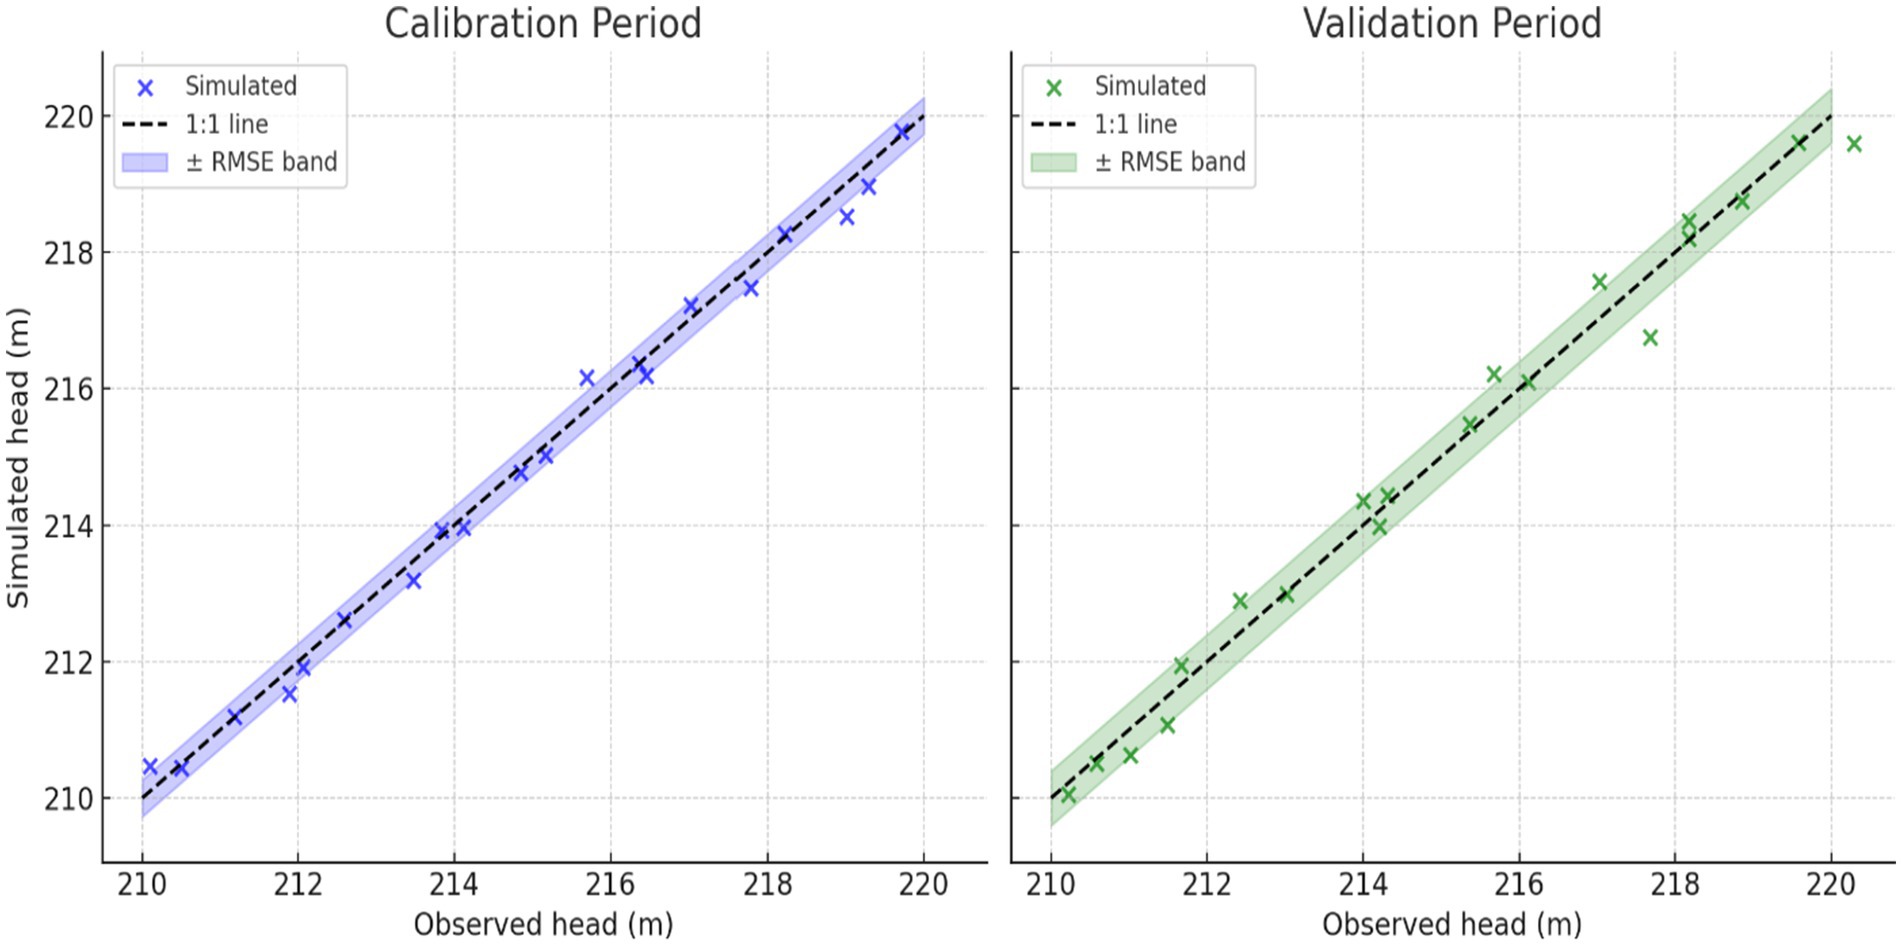
Figure 9. Observed vs simulated groundwater heads with uncertainty bands.
Spatially, model performance may vary across sub-regions of the aquifer, with better agreement in areas of dense monitoring and higher uncertainty in data-scarce zones. Future calibration should integrate spatial error mapping to highlight such zones of higher uncertainty. Overall, the model provides reliable predictions for long-term groundwater dynamics, but results should be interpreted with caution when applied for fine-scale or site-specific management decisions. Incorporating uncertainty analysis and sensitivity testing (Monte Carlo or GLUE approaches) would further strengthen confidence in scenario assessments.
The earthen field channels are used by the farmers in the study area, which are poorly maintained. Lowest irrigation efficiency of earthen field channel measured at farmer’s field was (60%) which has been selected as baseline (scenario 1). In baseline scenario the predicted water table elevation is 213.84 m (Figure 10). This scenario is inadequate to offset the rate of groundwater extraction and fail to halt the falling water table. Due to saving of seepage loss (6%), there is less groundwater pumping under scenario 2. Compared to the baseline scenario, the pre-monsoon water table under scenario 2 is projected to rise by 2.12 meters, reaching an elevation of 215.96 m (Figure 11). This increase in water table is due to saving of seepage losses (6%) and, consequently, lower the groundwater extraction. However, the negative sign of water table fluctuations observed under both scenarios 1 and 2 indicate a continued decline in groundwater levels. This suggests that even with seepage savings from earthen field channels, is not adequate to fully offset groundwater withdrawals and halt the ongoing depletion of the water table. To compare the expected water table elevations within the various scenarios the water table elevation of the pre-monsoon season of 2015 was used as reference level. Table 5 shows the change in water table by 2030 and comparison of water table fluctuations between 2015 to 2030 and impact of water management technologies under various scenarios compared to the baseline.
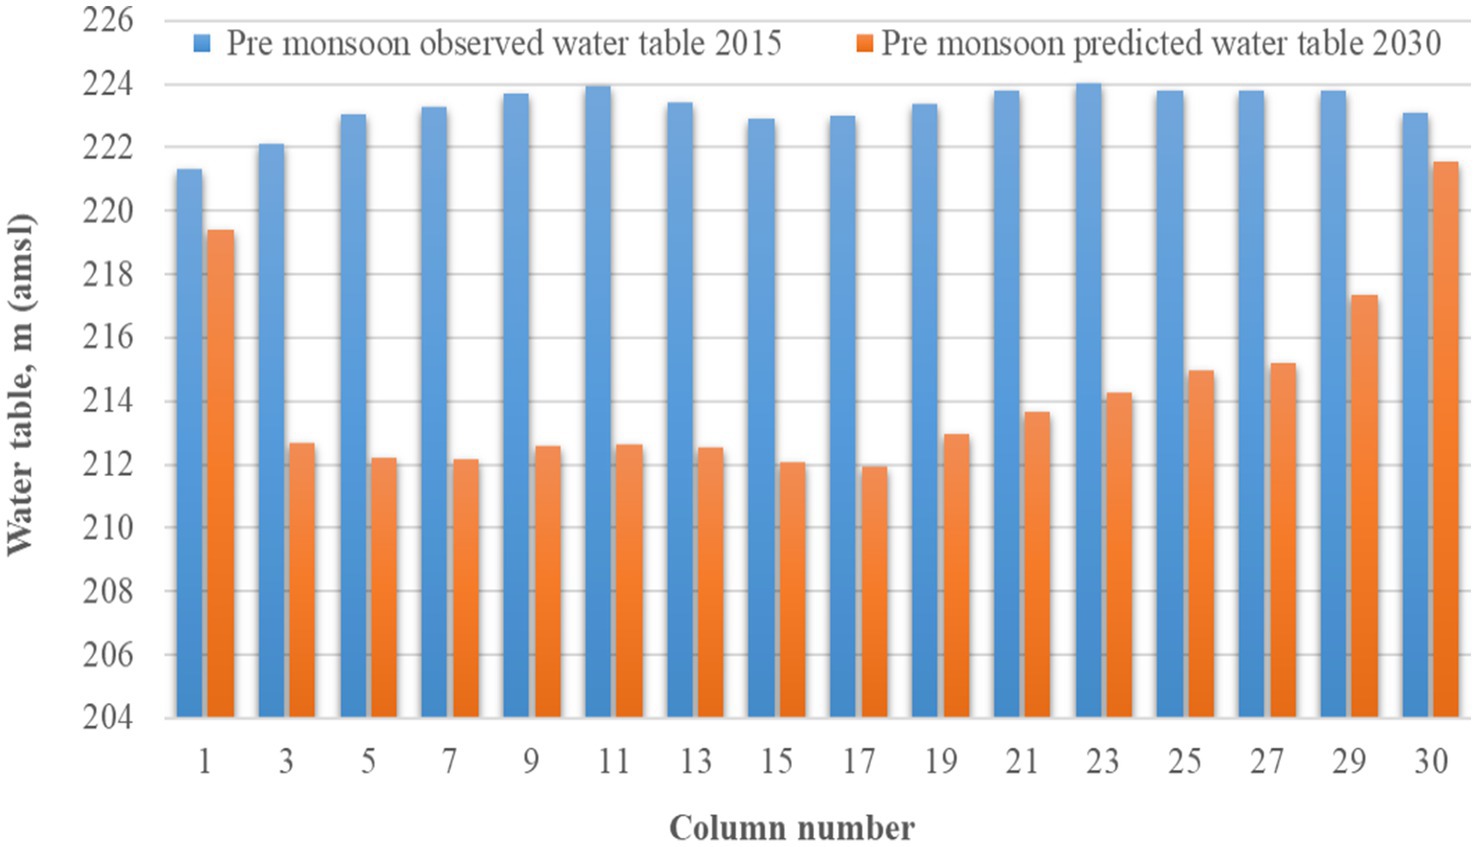
Figure 10. Simulated water table elevation when Ea = 60% earthen field channel.
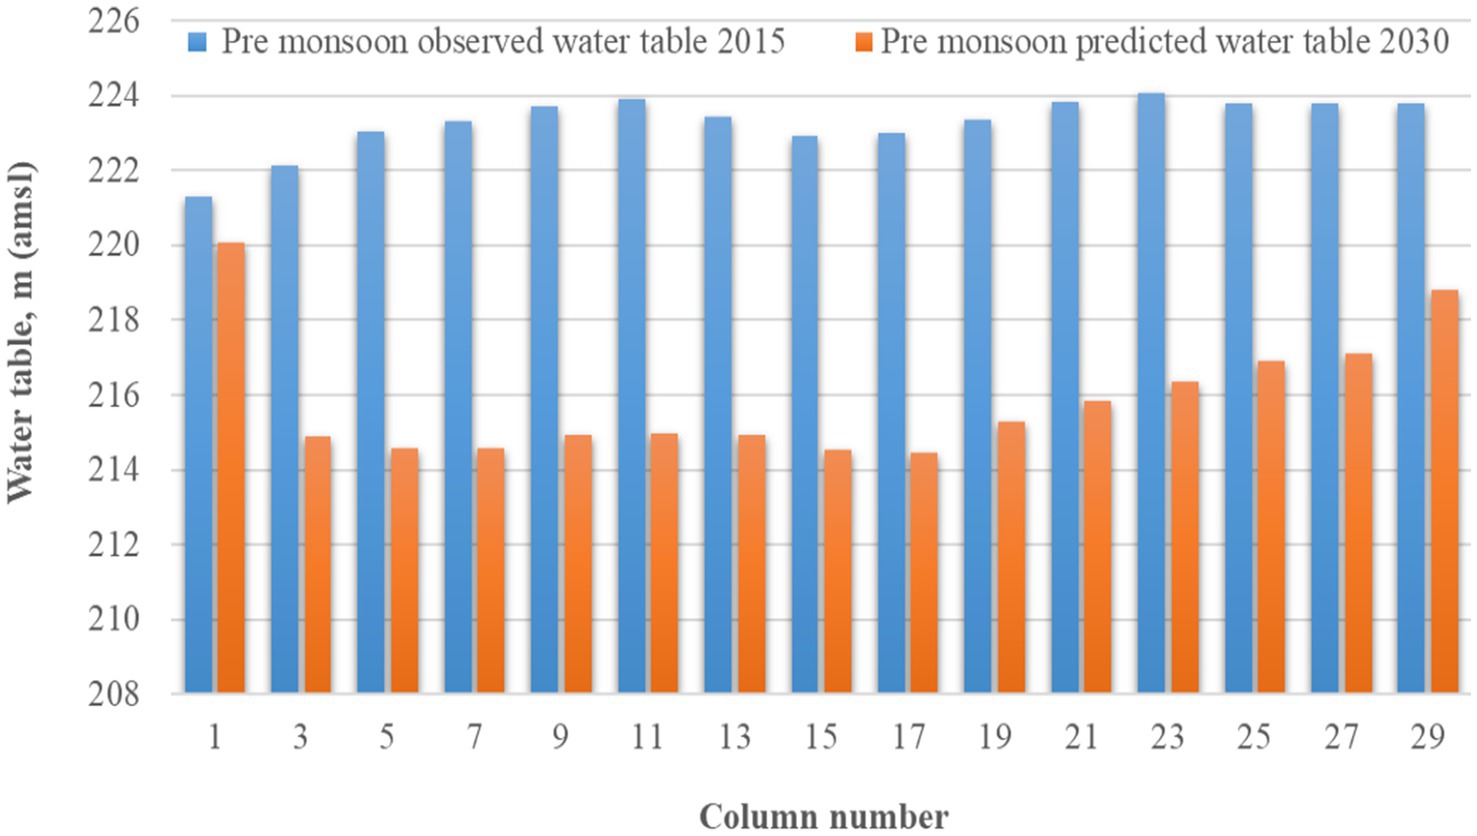
Figure 11. Simulated water table elevation with 6% water saving in earthen field channel.
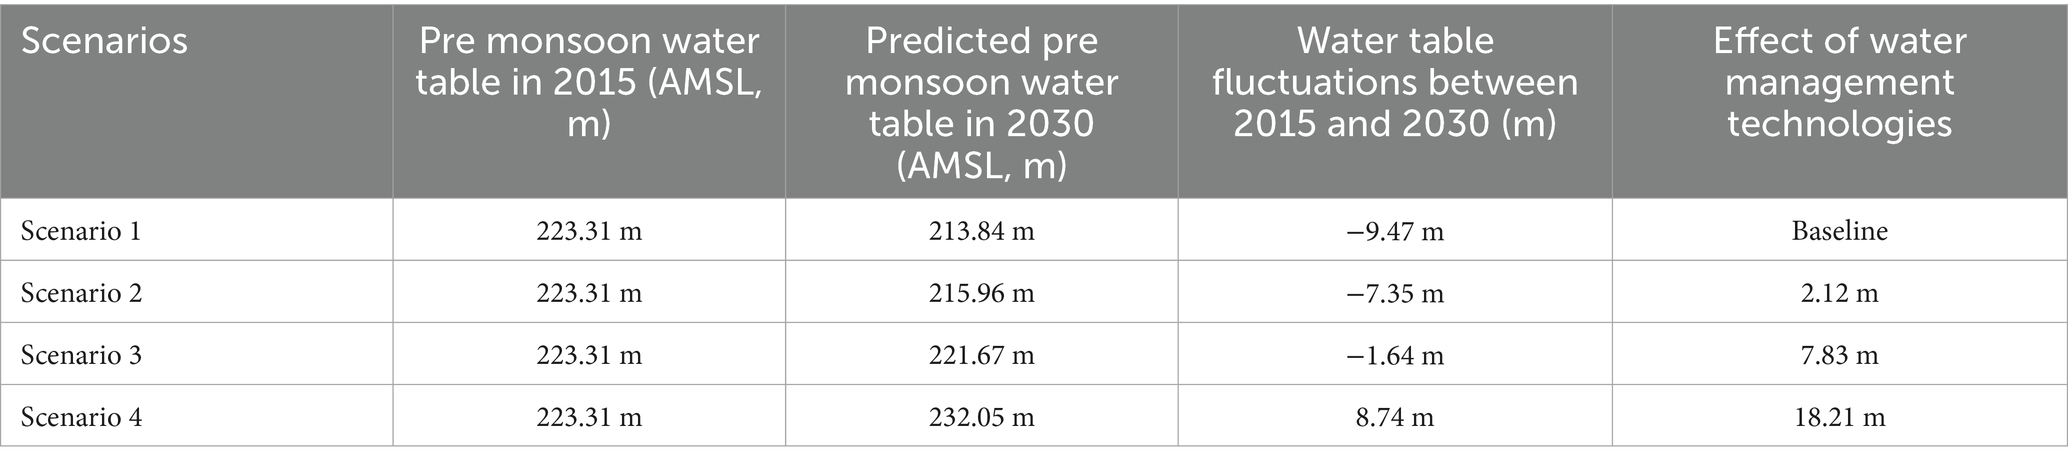
Table 5. Comparative summary of different scenarios.
Under Scenario 3, the predicted groundwater table was estimated to be 221.67 m (Figure 12). Pre-monsoon groundwater levels (hydraulic heads) in scenario 3 are 7.83 meters higher as compared to the reference scenario. In comparison to the baseline scenario, groundwater levels during the pre-monsoon season are projected to rise by 18.21 meters under Scenario 4, with a predicted water table elevation of 232.05 meters (Figure 13). This significant increase can be attributed to the shift in cropping pattern, specifically the reduction of sugarcane cultivation by 50% and a corresponding increase in kharif maize cultivation by 50%. The positive sign of water table fluctuations during the pre-monsoon period under Scenario 4 clearly indicate a rise in groundwater levels. This suggests that sugarcane cultivation is a major contributor to groundwater depletion in the region. The findings demonstrate that substituting half of the sugarcane area with maize can effectively halt the downward trend of groundwater levels. Notably, among all the scenarios, only Scenario 4 shows a rise in groundwater levels substantial enough to offset the impacts of groundwater extraction. Nevertheless, Scenarios 2, 3, and 4 all exhibited higher water table elevations compared to the reference scenario due to reduced groundwater pumping.
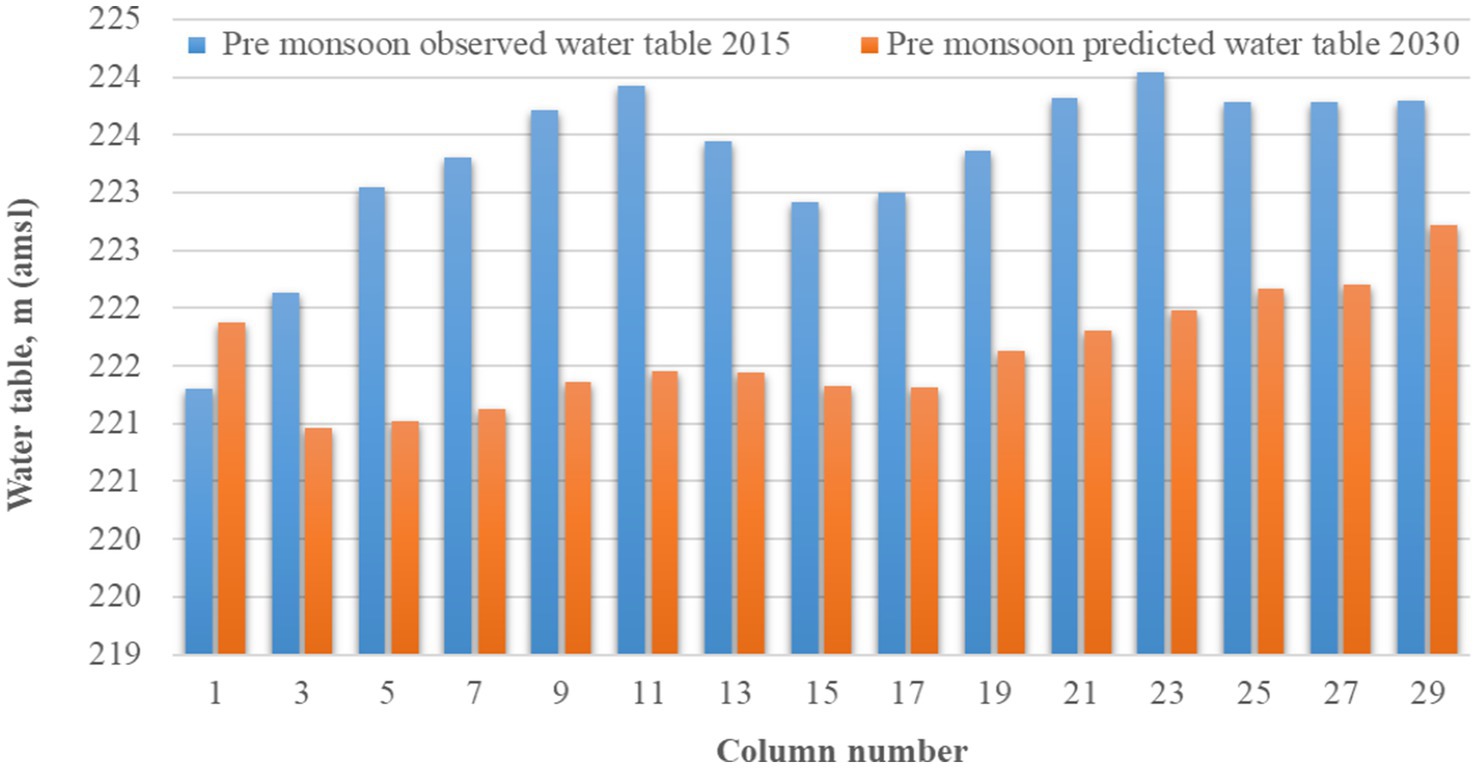
Figure 12. Simulated water table elevation with 17% water saving under laser leveling.
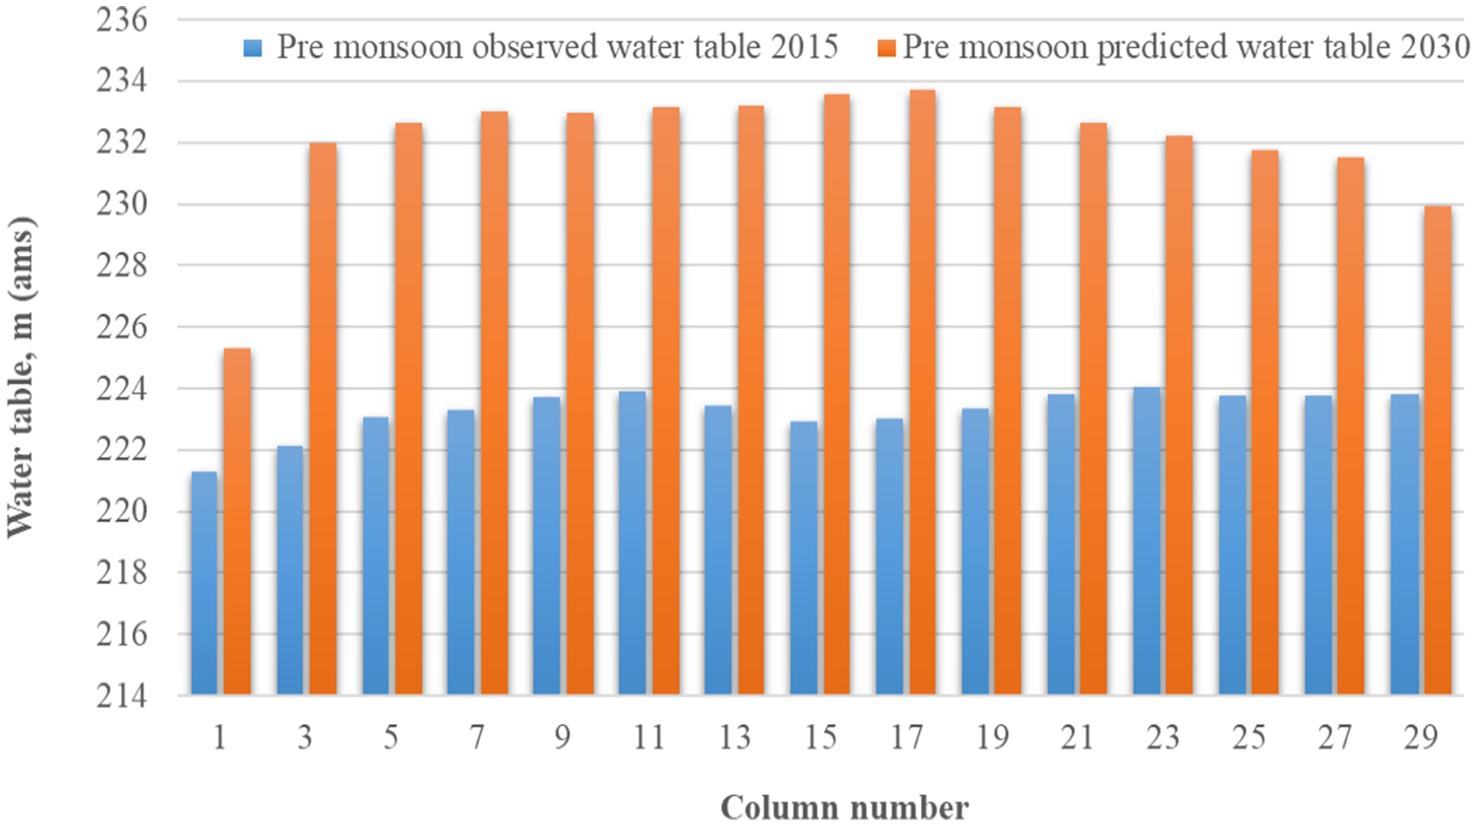
Figure 13. Simulated water table elevation when 50% area under sugarcane was replaced by Kharif maize.
4 Discussion
It is evident from the field that when irrigation is applied through earthen field channels with a measured application efficiency of 60% (Scenario 1) and groundwater draft of 0.0033 m/day the predicted water table elevation is 213.84 m. The corresponding water table contour map of scenario 1 is shown in Figure 14. This scenario is unable to offset the prevailing rate of groundwater extraction and thus fails to halt the declining water table. This finding is consistent with field evidence across India, where earthen field channels (EFCs) suffer from seepage, evaporation, and operational losses, resulting in application efficiencies between 50–65% (Dhawan, 2017; Kumar M. D. et al., 2020; Kumar R. et al., 2020). This implies that inefficient water conveyance significantly increases groundwater abstraction to meet crop water demands, thereby aggravating aquifer depletion.
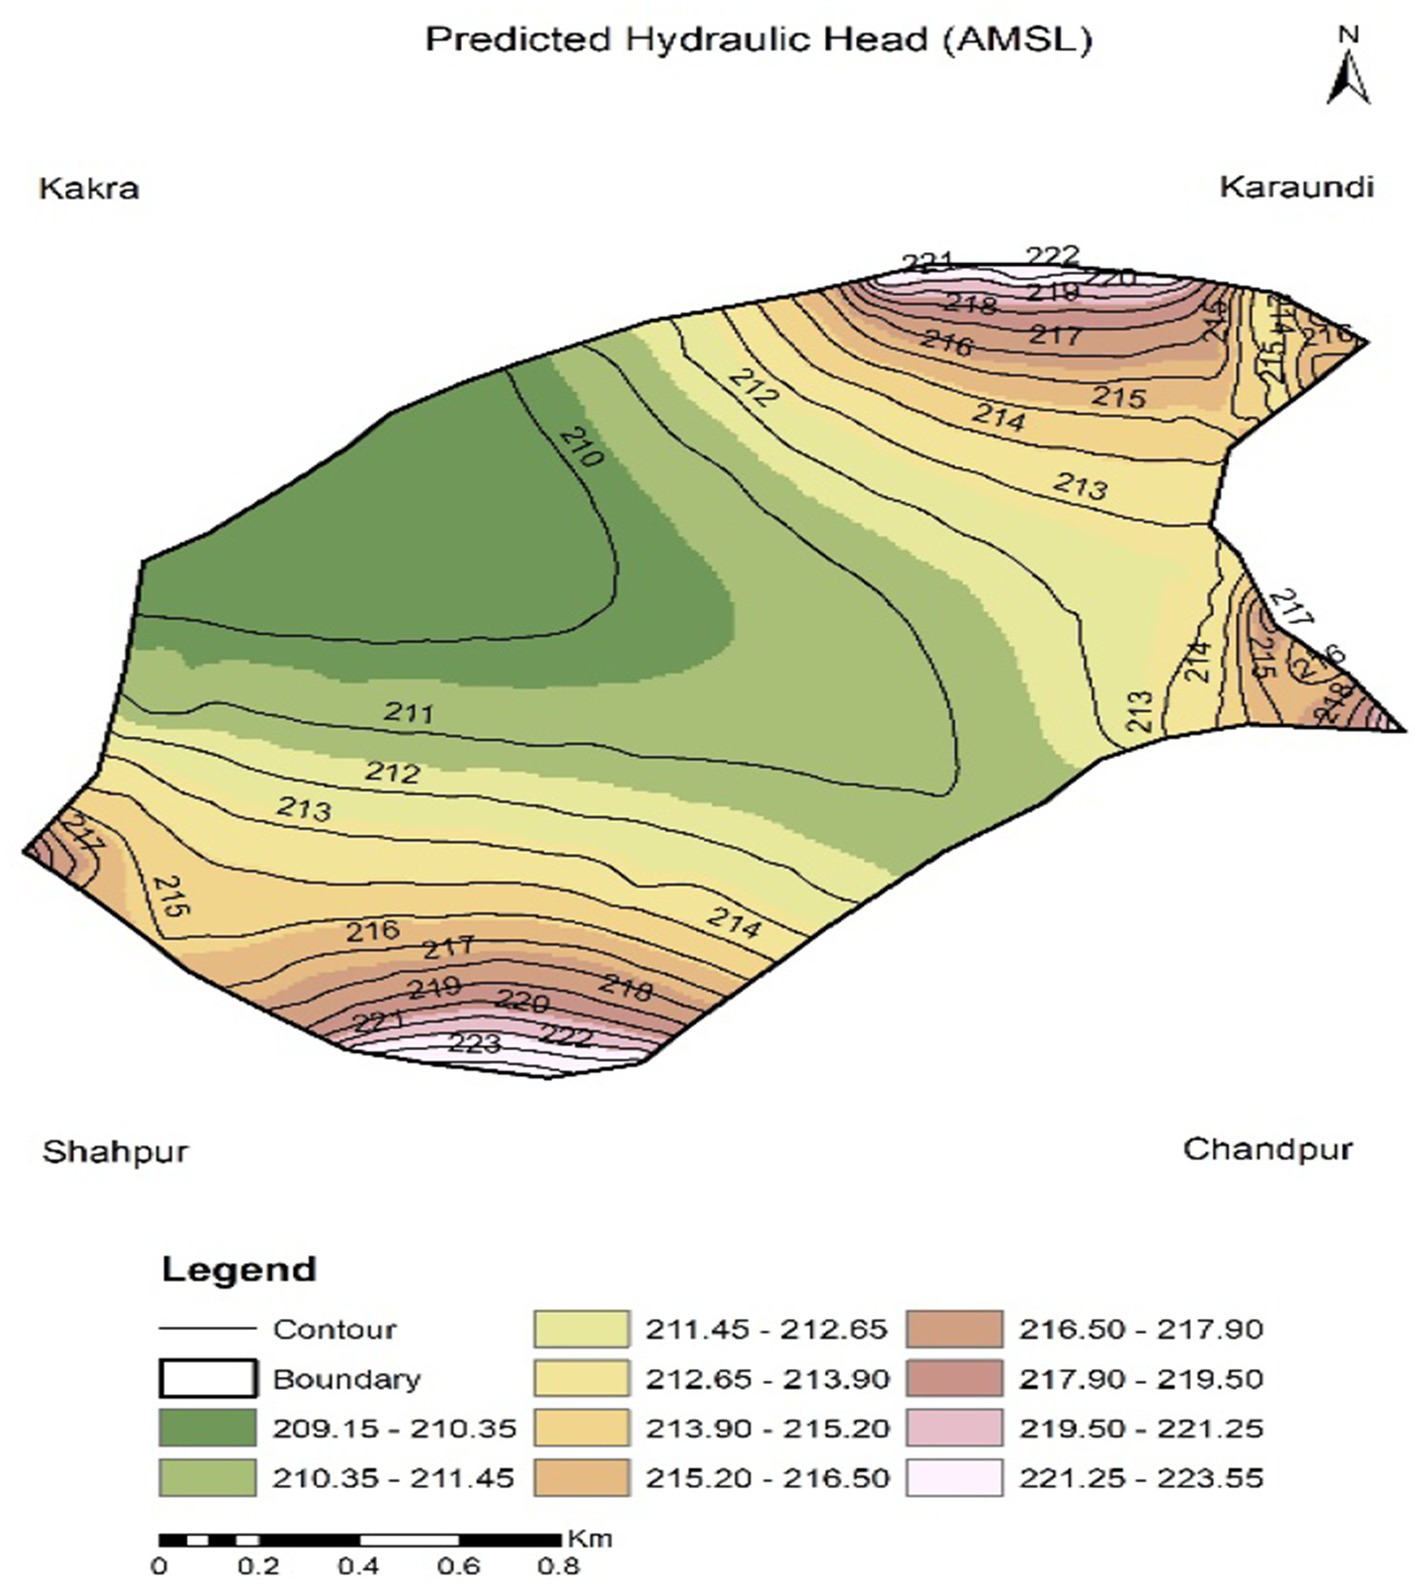
Figure 14. Simulated water table contours when Ea = 60% in earthen field channel.
Sharma B. R. et al. (2018), Sharma N. et al. (2018), and IWMI (2021) observed that conveyance losses in unlined channels contributed to as much as 30–40% additional pumping requirements, accelerating groundwater decline. Similarly, Rodell et al. (2009), reported groundwater depletion in north-west India is due to inefficient irrigation practices combined with water-intensive cropping patterns. From a groundwater modeling perspective, the groundwater draft (0.0033 m/day) in Scenario 1 indicates that the recharge component is insufficient to balance extraction. Central Ground Water Board (CGWB, 2022) found that current irrigation efficiencies in India exacerbate stage-of-exploitation levels beyond 100% in critical blocks. In such contexts, maintaining irrigation through earthen channels is hydrologically unsustainable.
The simulation results under Scenario 2 demonstrate that saving seepage losses of approximately 6% in earthen field channels leads to a reduction in groundwater pumping. As a result, the pre-monsoon water table rises by 2.12 m, reaching water table elevation of 215.96 m compared to the baseline (213.84 m). This improvement highlights the role of enhancing conveyance efficiency in traditional irrigation systems as a water-saving measure. The corresponding water table contour map of scenario 2 is shown in Figure 15.
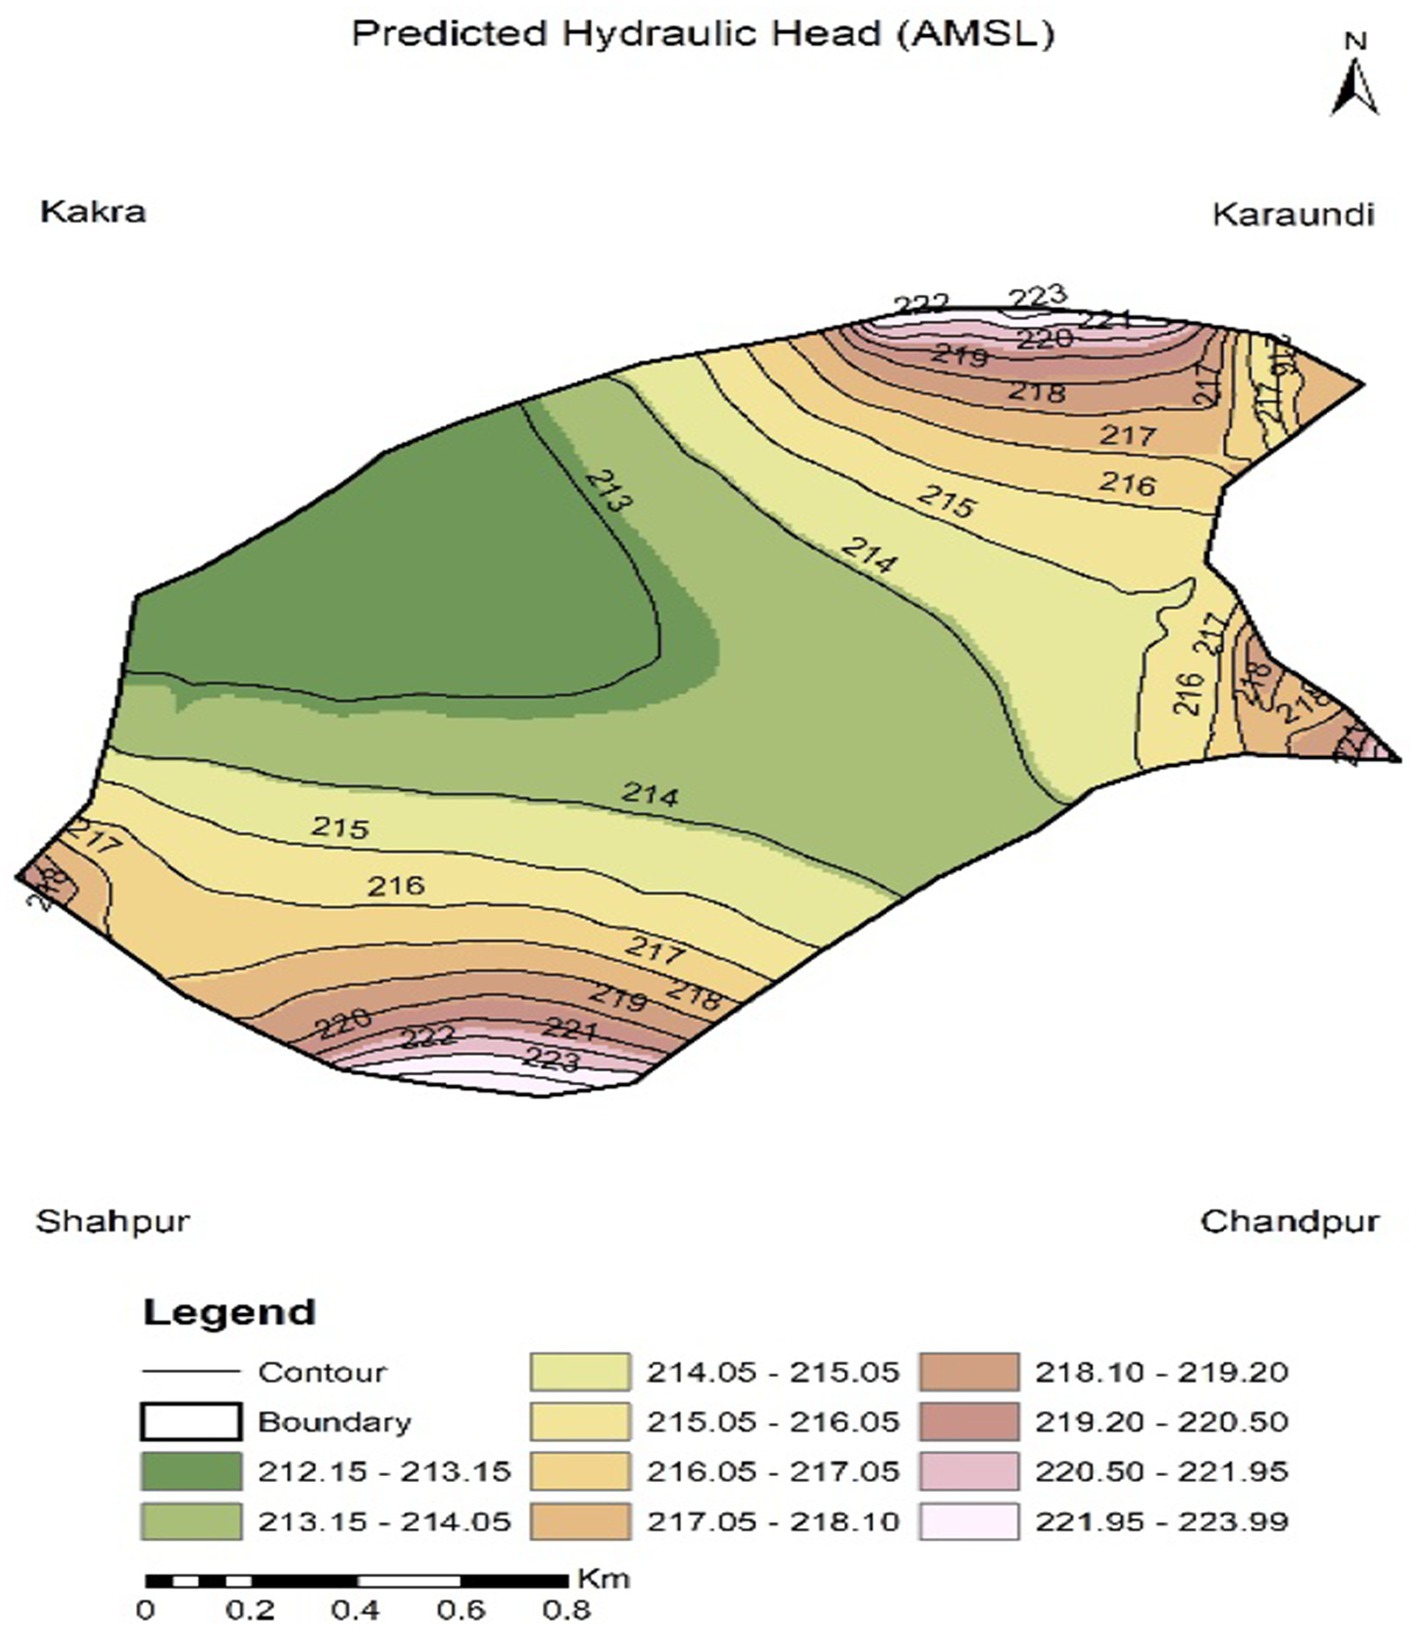
Figure 15. Simulated water table contours with 6% water saving in earthen field channel.
In Scenario 2, where improved management of earthen field channels led to a 6% water saving due to seepage loss reduction, the decline in the water table was reduced to 7.35 meters. Studies across India have consistently shown that minimizing seepage in earthen channels can lead to modest reductions in groundwater abstraction and improvements in local water availability (Shah, 2009; Singh et al., 2018a; Singh et al., 2018b; Kumar M. D. et al., 2020b; Kumar R. et al., 2020). However, despite this positive trend, the negative water table fluctuations observed under Scenario 2 indicates that the rise is insufficient to completely reverse groundwater decline. The continued depletion reflects the imbalance between recharge and abstraction, which has been widely reported in over-exploited regions of northwestern India (Rodell et al., 2009; CGWB, 2022). Even with seepage savings, demand from high water-consuming crops (sugarcane and paddy) drives extraction rates beyond the capacity of the aquifer to recover.
The results of Scenario 3 reveal that the application of Laser Land Leveling (LLL) significantly improves irrigation efficiency, leading to a projected rise in the pre-monsoon water table by 7.83 m, reaching water table elevation of 221.67 m compared to the baseline scenario (213.84 m). The corresponding water table contour map of scenario 3 is shown in Figure 16. The observed improvement is attributed to the ability of laser land leveling to ensure uniform water application across the field, reducing waterlogging, and tail-end losses (Jat et al., 2009). Empirical studies in the Indo-Gangetic Plains (IGP) demonstrate that laser land leveling reduces irrigation water application by 15–25%, while simultaneously improving crop yields by 7–10% (Naresh et al., 2014; Aryal et al., 2015; Kumar et al., 2017). Despite this substantial gain in groundwater status, the negative sign of water table fluctuations observed under Scenario 3 indicates that depletion persists, although at a reduced rate compared to Scenarios 1 and 2. This outcome highlights that technology-driven efficiency improvements, but not sufficient to fully balance groundwater abstraction and recharge in over-exploited aquifers. Similar findings were reported by Rodell et al. (2009) and CGWB (2022), where continued extraction for high-water-demand crops like rice and sugarcane outpaces natural recharge, even with water-saving interventions.
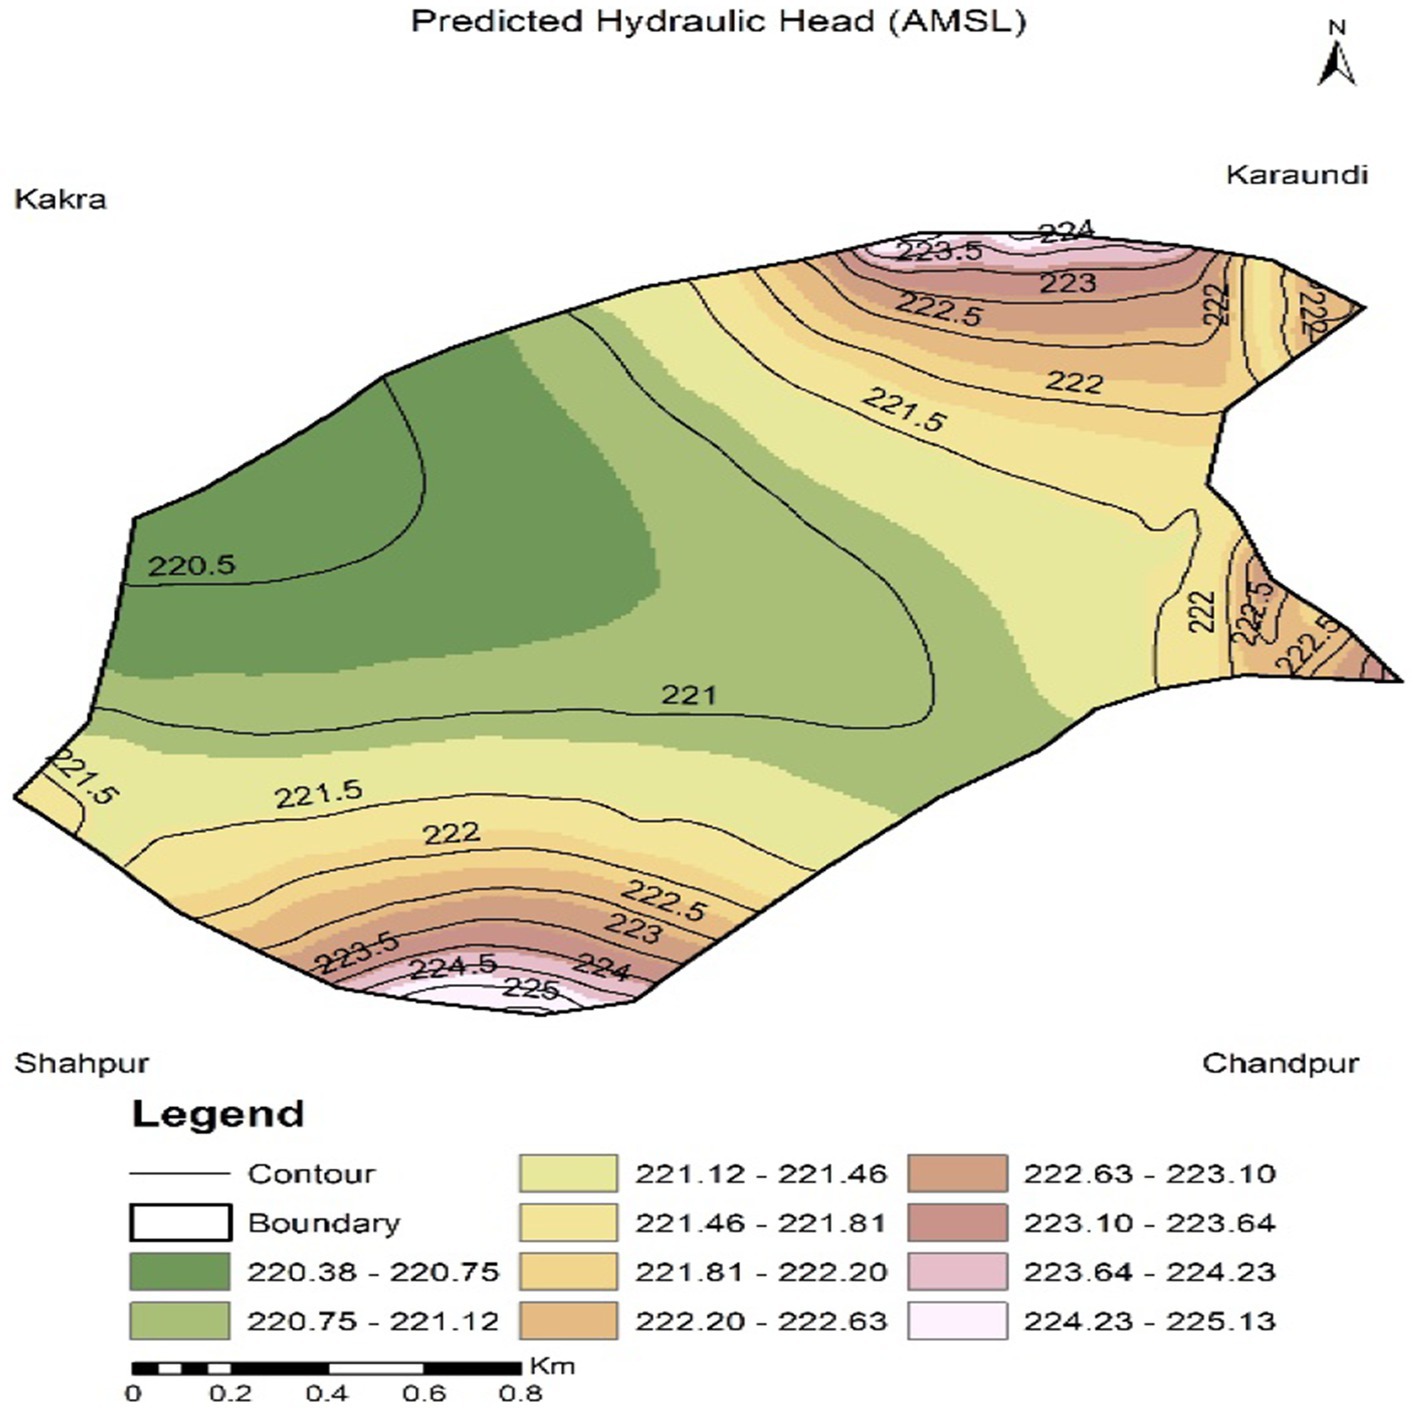
Figure 16. Simulated water table contours with 17% water saving under laser leveling.
The results of Scenario 4 reveal that a cropping pattern shift-reducing sugarcane cultivation by 50% and replacing it with kharif maize-leads to a remarkable rise in groundwater levels by 18.21 m reaching water table elevation of 232.05 m compared to the baseline scenario (213.84 m). The corresponding water table contour map of scenario 4 is shown in Figure 17. Unlike Scenarios 2 and 3, which slowed depletion, Scenario 4 is the only case that exhibits a positive water table fluctuation, indicating a reversal of groundwater decline. This underscores the critical role of crop choice in regulating groundwater demand in intensively cultivated regions. The significant improvement can be attributed to the stark contrast in crop water requirements. Sugarcane is a water-intensive crop, requiring 1800–2,200 mm of irrigation water per growing season, much of which is extracted from groundwater (Singh et al., 2018a; Singh et al., 2018b; Gulati and Pahuja, 2019; Kumar M. et al., 2020). In contrast, kharif maize requires approximately 500–600 mm of irrigation, depending on rainfall, which translates into nearly 70–75% water savings compared to sugarcane (NAAS, 2013; Chauhan et al., 2020). The substitution of half the sugarcane area with maize therefore reduces irrigation demand and groundwater pumping, reflected in the lowered draft rate of 0.0020 m/day in Scenario 4.
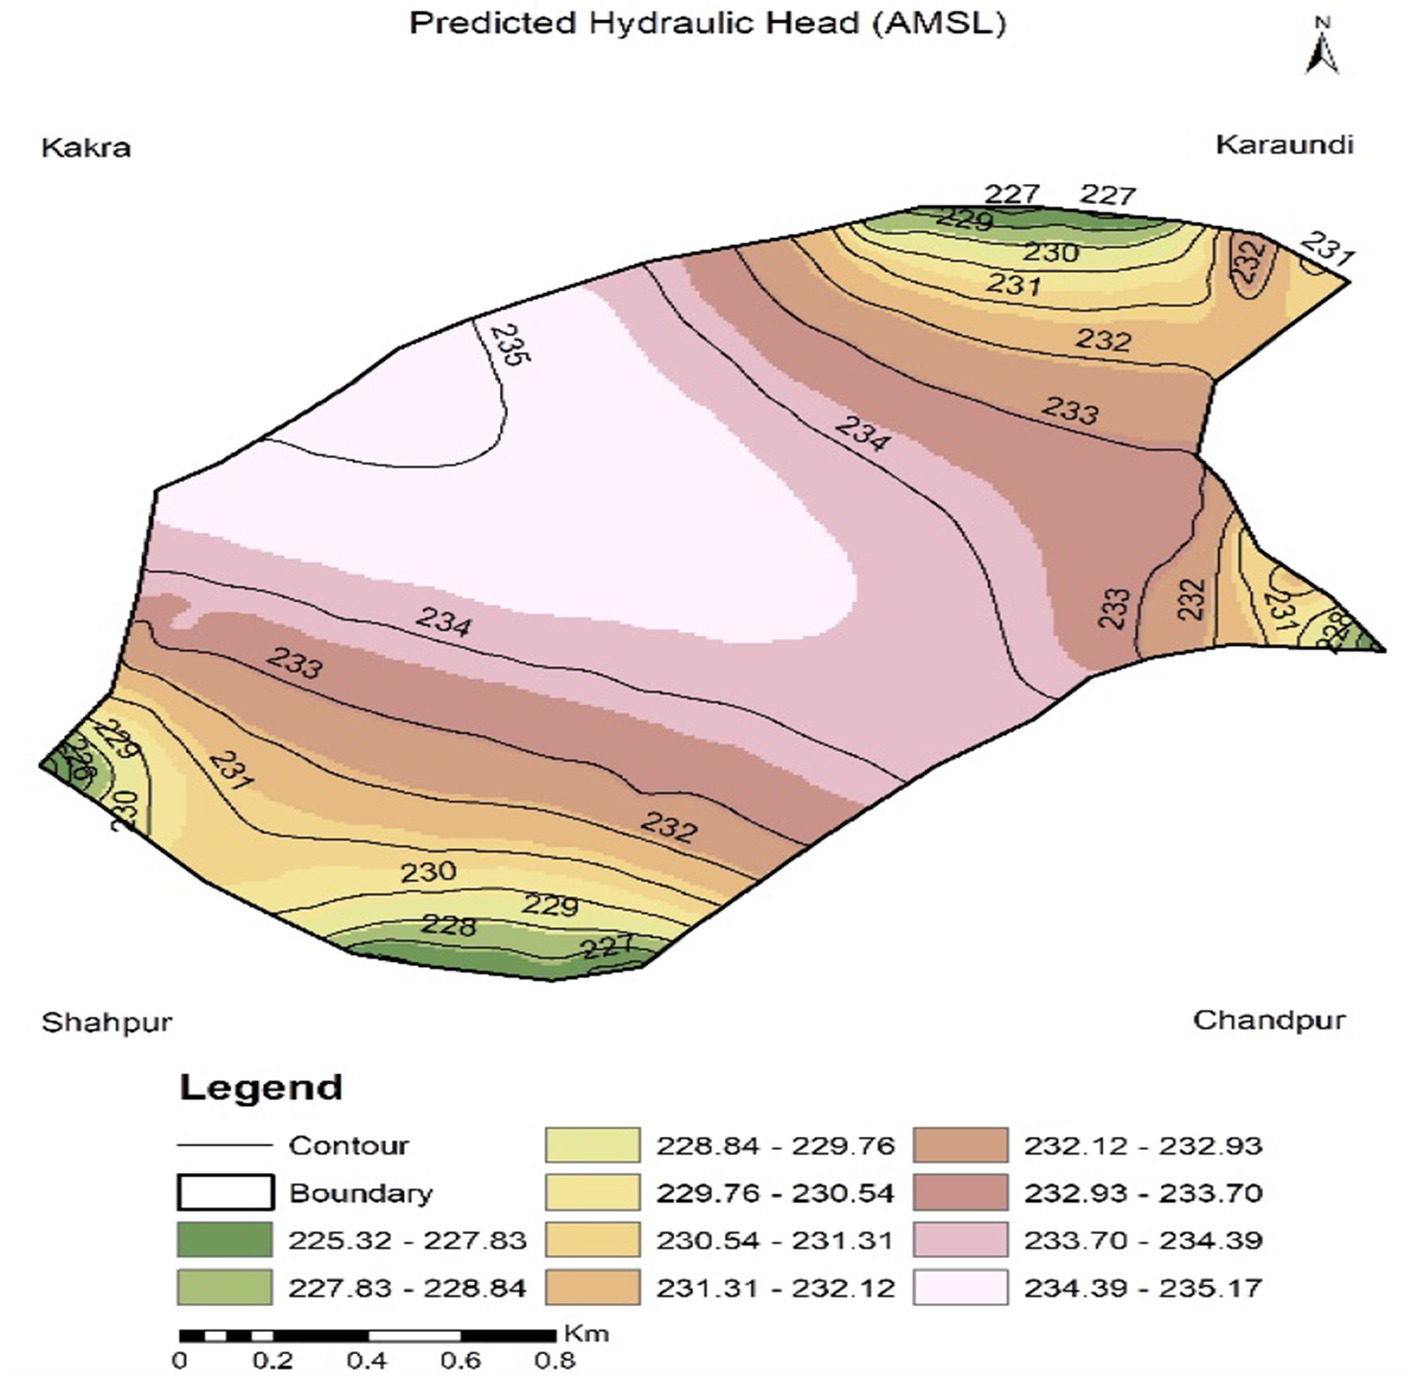
Figure 17. Simulated water table contours when 50% area of sugarcane was replaced by kharif maize.
The findings correlate with earlier simulation and field studies in northern India. Rodell et al. (2009) found that sugarcane belts in Uttar Pradesh and Haryana are hotspots of groundwater depletion. Similarly, Sharma et al. (2021) demonstrated through groundwater modeling that replacing high-water-demand crops with maize, pulses, or oilseeds could significantly improve aquifer sustainability in the Indo-Gangetic Plains (IGP). Our results align with this body of evidence, highlighting that cropping pattern change is more impactful than other technologies alone (channel lining, laser land leveling, etc.), since it addresses the root cause of excessive demand.
The environmental and ecological implications are equally significant. Multiple impacts under Scenario 1 are reduction in baseflow to streams and rivers, harming riparian habitats and downstream users (Jagermeyr et al., 2021; Randhir and Klosterman, 2024); soil salinization and deterioration of shallow root-zone (FAO, 2017); land subsidence and reduced groundwater storage resilience in heavily pumped terrains (Wada et al., 2016). These processes reduce ecosystem services like habitat provision and increase vulnerability to droughts and between groundwater decline and agro-ecosystem health (Rodell et al., 2009; Wada et al., 2010). Persistent groundwater decline, even after modest efficiency gains in Scenario 2, can lead to reduced baseflow in rivers, wetland degradation, and biodiversity losses (Scanlon et al., 2012). In semi-arid regions like Haryana, falling groundwater tables have already resulted in soil salinity risks and reduced ecosystem services (Kumar M. D. et al., 2020). The environmental implications of laser land leveling adoption are noteworthy. Improved irrigation efficiency reduces groundwater pumping, nutrient leaching and waterlogging risks, thereby lowering the incidence of soil salinity and nitrous oxide (N₂O) emissions (Humphreys et al., 2010; Bijarniya et al., 2021). However, a continued groundwater decline, even under Scenario 3, suggests potential long-term ecological risks, including reduced groundwater–surface water interactions, decline in wetland ecosystems, and loss of biodiversity (Scanlon et al., 2012). Scenario 4 provides multiple co-benefits. Reduced groundwater abstraction improves the resilience of aquifer-dependent ecosystems such as wetlands, river baseflows, and soil microbiota (Scanlon et al., 2012). Moreover, maize cultivation emits fewer methane (CH₄) emissions compared to sugarcane or paddy, thereby lowering the agricultural greenhouse gas footprint (Pathak et al., 2013; Bijarniya et al., 2021). This makes crop diversification not only a groundwater management strategy but also a climate mitigation pathway.
Economic feasibility and social acceptance are the key factor to accept any technology. Scenario 1 reinforces the evidence that earthen channels, though socially embedded and low-cost, are incompatible with sustainable groundwater management. Unless irrigation efficiency is enhanced beyond the baseline (60%), groundwater depletion will continue at current or accelerated rates, threatening agricultural viability and rural livelihoods in the study area. Additionally, trade-offs for farmers must be considered. Seepage savings do not directly increase farmers’ income; hence, adoption of measures such as lining of channels or laser land leveling often depends on economic incentives and subsidies (Narayanamoorthy, 2017). Moreover, if coupled with a shift from sugarcane to less water-intensive crops such as maize, there can be both economic challenges and opportunities. While maize requires less irrigation (30–40% lower water demand), its market price volatility and lack of assured procurement in Bihar and UP reduce its attractiveness (Chauhan et al., 2020; ICAR, 2021). This creates a social acceptance barrier for water-saving interventions unless complemented with institutional support and price assurance mechanisms. With respect to farmers’ behaviour and economic feasibility, laser land lever has been found to be economically viable in intensive rice–wheat systems of Punjab, Haryana, and western Uttar Pradesh, where water savings translate into reduced pumping costs and higher crop productivity (Jat et al., 2009; Aryal et al., 2015). However, its adoption in regions with low-value crops (pulses, millets) is less attractive due to lower immediate economic returns, which creates a barrier to widespread social acceptance (Kumar R. et al., 2018). The upfront investment (₹1.5–2 lakh per machine) and dependence on service providers further restrict adoption among smallholders unless custom hiring centers and subsidy programs are implemented (Naresh et al., 2014; GOI, 2021). The trade-offs associated with laser land leveler adoption also extend to cropping pattern choices. If farmers shift from sugarcane to maize or pulses, water savings may be reinforced, but the economic outcomes are mixed. While maize requires ~40% less irrigation water, it faces market uncertainties and limited procurement support, making it less profitable compared to sugarcane under current policy regimes (Chauhan et al., 2020; ICAR, 2021). This suggests that for laser land leveling to achieve socio-economic acceptance, parallel reforms in crop procurement policies and value chains are essential. Social acceptance is also influenced by traditional cropping practices and risk perceptions. Sugarcane provides year-round income and fodder security, while maize is seasonal and more dependent on monsoon variability (Kumar R. et al., 2018; Kumar M. et al., 2020; Kumar M. D. et al., 2020). Sugarcane is often perceived as a “cash crop” because of assured procurement through sugar mills, price support mechanisms, and by-products (jaggery, ethanol, fodder) (Gulati and Pahuja, 2019). Conversely, maize faces market price volatility, limited procurement, and weaker value chains, which reduce farmer incentives to shift voluntarily (Chauhan et al., 2020). Therefore, large-scale adoption of Scenario 4 would require institutional support, including crop insurance, strengthening maize processing industries, market linkages, and incentives for sustainable water use (ICAR, 2021; GOI, 2022).
The baseline (Ea = 60%) inefficiency has implications for water policy. Lining channels, piped delivery, and metered electricity for groundwater pumping reduce unaccounted losses and signal scarcity (IWMI, 2021; IWMI, 2023). Subsidies for micro-irrigation (drip/sprinkler) or laser leveling should be coupled with basin-level allocation rules (Kumar et al., 2015; Kumar et al., 2019; Shah et al., 2021). Recent policy needs to be revised by Central and State Government by giving paired subsidy programs through different schemes to reduce groundwater pumping and increase recharge. Scenario 1 underscores the need for district/aquifer-level water budgets, monitoring and enforceable withdrawal rules (CGWB, 2022; Rodell et al., 2018). For Scenarios 2 and 3, upfront investment costs, limited technical knowledge and maintenance requirements may also deter adoption. Combining crop diversification, pricing reform, and community institutions (Pani Panchayats, WUAs) is essential to convert plot-level efficiency into basin-level sustainability (IWMI, 2021). For marginal and fragmented holdings, the per-farm capital burden is high unless provided via custom hiring centers, FPO aggregation, or targeted financing. Shifting from sugarcane (high water use, high revenue, assured mill procurement) to kharif maize (lower water use, lower revenue but shorter cycle) is a big challenge for farmers as sugarcane yields higher gross income and benefits but maize profitability depends on without reliable off-take and price support, farmers face income risk (Gulati and Pahuja, 2019). Transition affects labour demand and local economies; social protections and alternative livelihood support must accompany diversification policies. This study is helpful in planning of groundwater pumping strategies in study area and results may useful in development of sustainable groundwater management strategy.
5 Conclusion
Rasoolpur Jatan is experiencing a rapid decline in groundwater level. To analyze groundwater table behaviour under various water management technologies, a three-dimensional groundwater model (MODFLOW) was calibrated, and validated. Simulation results indicated that groundwater irrigation in the study area is not sustainable because it is not only a hydrological challenge but also an agricultural and economic policy issue. Policymakers must recognize that continuing sugarcane-dominated systems will exacerbate aquifer stress, threatening long-term water security, irrigation reliability, and farmer livelihoods. Resource managers should prioritize crop diversification, incentive-based policies, and integrated demand–supply interventions rather than focusing solely on efficiency technologies. For farmers, the results indicate that shifting towards less water-intensive crops can secure water availability for future generations, though market assurance and income stabilization remain limitations for adoption. Future research should integrate climate change projections and its impacts on groundwater behaviour, groundwater quality, land use change and economic modeling of crop profitability and its impacts to provide a more holistic assessment. Comparative studies across different agro-climatic regions would also help to refine the scalability of these interventions.
Data availability statement
The original contributions presented in the study are included in the article/supplementary material, further inquiries can be directed to the corresponding author.
Author contributions
MKu: Investigation, Conceptualization, Writing – original draft, Data curation. DS: Supervision, Writing – review & editing. AS: Data curation, Writing – review & editing, Methodology. IM: Data curation, Writing – review & editing. MKh: Data curation, Writing – review & editing, Investigation.
Funding
The author(s) declare that no financial support was received for the research and/or publication of this article.
Acknowledgments
This study is a part of Ph.D. research work. The authors are highly thankful to the Division of Agricultural Engineering of ICAR-IARI, New Delhi and Department of Science and Technology, New Delhi. We also thanks to KVK Baghra for providing facilities and support for this research work. Authors are also thankful to the Principal Investigator of the project “Efficient groundwater management for enhancing adaptive capacity to climate change in sugarcane based farming system in Muzaffarnagar” for providing necessary facilities for conducting this experiment.
Conflict of interest
The authors declare that the research was conducted in the absence of any commercial or financial relationships that could be construed as a potential conflict of interest.
Generative AI statement
The author(s) declare that no Gen AI was used in the creation of this manuscript.
Any alternative text (alt text) provided alongside figures in this article has been generated by Frontiers with the support of artificial intelligence and reasonable efforts have been made to ensure accuracy, including review by the authors wherever possible. If you identify any issues, please contact us.
Publisher’s note
All claims expressed in this article are solely those of the authors and do not necessarily represent those of their affiliated organizations, or those of the publisher, the editors and the reviewers. Any product that may be evaluated in this article, or claim that may be made by its manufacturer, is not guaranteed or endorsed by the publisher.
Footnotes
References
Anderson, M. P., Woessner, W. W., and Hunt, R. J. (2015). Applied groundwater modeling: Simulation of flow and Advective transport. 2nd Edition, Academic Press. Available online at: https://pubs.usgs.gov/publication/70160331
Aryal, J. P., Mehrotra, M. B., Jat, M. L., and Sidhu, H. S. (2015). Impacts of laser land leveling in rice–wheat systems of the north-western indo-Gangetic Plains of India. Food Secur. 7, 725–738. doi: 10.1007/s12571-015-0460-y
Beven, K. J. (2006). Streamflow generation processes, selection, introduction and commentary. UK: IAHS Press, International Association of Hydrological Sciences.
Bhan, S., Patel, D. P., and Jat, M. L. (2023). Resource-conserving cropping systems for sustainable groundwater use. Field Crop Res. 296:108924. doi: 10.1016/j.fcr.2023.108924
Bijarniya, D., Jat, H. S., Choudhary, M., Jat, R., Sharma, A., Gupta, A., et al. (2021). Energy, water and GHG footprints of conservation agriculture-based sustainable intensification in cereal systems of indo-Gangetic Plains. J. Clean. Prod. 308:127282. doi: 10.1016/j.jclepro.2021.127282
CGWB. (2009). Groundwater scenario of India. Central Groundwater Board, Ministry of Water Resources, Government of India, Faridabad. Available online at: http://www.cgwb.gov.in
CGWB (2017). Aquifer mapping and ground water management plan, pp: 16–19, Central Groundwater Board Northern Region, Lucknow, Ministry of Water Resources, River Development and Ganga Rejuvenation Government of India, Delhi, India. Available online at: https://cgwb.gov.in/cgwbpnm/public/uploads/documents/16848264981594829421file.pdf
CGWB. (2021). Dynamic ground water resources of India (as on 2020). Ministry of Jal Shakti, Government of India. Available online at: http://cgwb.gov.in/Documents/2021-11-30_GWRE-2020-report.pdf
CGWB (2022). Dynamic ground water resources of India. Ministry of Jal Shakti, Department of Water Resources, River Development and Ganga Rejuvenation, Government of India. Available online at: https://cgwb.gov.in
Chandrasekhar, S., Sharma, A., and Mehta, A. Impact of crop diversification on groundwater sustainability in semi-arid India Environ. Res. Lett. (2023) 18:025007. Available online at: https://iopscience.iop.org/journal/1748-9326
Chauhan, B. S., Mahajan, G., Sardana, V., Timsina, J., and Jat, M. L. (2020). Productivity and sustainability of the rice–wheat cropping system in the indo-Gangetic Plains of India: a review Agric. Syst. 178:102761. Available online at: https://www.journals.elsevier.com/agricultural-systems
Chaussard, E., Wdowinski, S., Cabral-Cano, E., and Amelung, F. (2017). Land subsidence in Central Mexico detected by ALOS InSAR time-series. Remote Sens. Environ. 117, 152–161. doi: 10.1016/j.rse.2011.04.005
Chiang, W. H., and Kinzelbach, W. (1998). Processing MODFLOW a simulation system for modelling groundwater flow and pollution. Hamburg-Zurich: Software Instruction Book, 342.
Chouhan, S. S., Jain, M. P., and Soni, P. (2021) Drip irrigation adoption and its impact on groundwater conservation in arid regions of India Irrig. Sci. 39:57–66. Available online at: https://link.springer.com/journal/271
Custodio, E., Andreu-Rodes, J. M., Aragón, R., Estrela, T., Ferrer, J., García-Aróstegui, J. L., et al. (2016). Groundwater intensive use and mining in south-eastern peninsular Spain: hydrogeological, economic and social aspects. Sci. Total Environ. 559, 302–316. doi: 10.1016/j.scitotenv.2016.02.107
da Cunha, F. F., Oliveira, R. A., and Nogueira, M. C. J. A. (2020). Water management through precision irrigation in semi-arid Brazil. Agric. Water Manag. 238:106199. doi: 10.1016/j.agwat.2020.106199
Dalin, C., Wada, Y., Kastner, T., and Puma, M. J. (2020). Groundwater depletion embedded in international food trade. Nature 543, 700–704. doi: 10.1038/nature21403
De Graaf, I. E. M., Gleeson, T., van Beek, L. P. H., Sutanudjaja, E. H., and Bierkens, M. F. P. (2019). Environmental flow limits to global groundwater pumping. Nature 574, 90–94. doi: 10.1038/s41586-019-1594-4
Famiglietti, J. S. (2014). The global groundwater crisis. Nat. Clim. Chang. 4, 945–948. doi: 10.1038/nclimate2425
FAO. (2017). The future of food and agriculture – Trends and challenges. Rome: Food and Agriculture Organization of the United Nations.
FAO (2021). FAO Aquastat Database – India Country Profile. Available online at: http://www.fao.org/aquastat/en/
FAO. (2022). The state of the world's land and water resources for food and agriculture – Systems at breaking point. Food and Agriculture Organization of the United Nations. Available online at: https://www.fao.org/documents/card/en/c/cc3196en
Fishman, R., Devineni, N., Raman, S., and Lall, U. (2015). Can improved agricultural water use efficiency save India's groundwater? Environ. Res. Lett. 10:084022. doi: 10.1088/1748-9326/10/8/084022
GEC (2009). Report of the groundwater resource estimation committee, groundwater resource estimation methodology. 107, Ministry of Water Resources, Govt. of India, New Delhi. Available online at: https://cgwb.gov.in/cgwbpnm/public/uploads/documents/17357999681888729364file.pdf
GEC. (2015). India: Ground Water Resource Estimation Methodology. Ministry of Water Resources, River Development and Ganga Rejuvenation, Government of India.
GOI (2021). Sub-Mission on agricultural mechanization (SMAM): Operational Guidelines. New Delhi: Ministry of Agriculture and Farmers Welfare, Department of Agriculture, Cooperation & Farmers Welfare. Available online at: https://agrimachinery.nic.in/Files/Guidelines/smam.pdf
GOI (2022). Comprehensive policy for crop diversification in India. Government of India, Ministry of Agriculture and Farmers’ Welfare. Available online at: https://agricoop.gov.in
Grafton, R. Q., Pittock, J., Williams, J., Jiang, Q., Possingham, H. P., and Quiggin, J. (2018). Water planning and hydro-climate uncertainty in the Murray–Darling basin, Australia. Water Policy 20, 67–90. doi: 10.2166/wp.2018.000
Griebler, C., and Avramov, M. (2015). Groundwater ecosystem services: a review. Freshw. Sci. New Delhi, India. 34, 355–367. doi: 10.1086/679903
Gulati, A., and Pahuja, S. (2019). Sugarcane economics and diversification options. New Delhi, India: ICRIER/Policy brief.
Gupta, H. V., Kling, H., Yilmaz, K. K., and Martinez, G. F. (2009). Decomposition of the mean squared error and NSE performance criteria: implications for improving hydrological modelling. J. Hydrol. 377, 80–91. doi: 10.1016/j.jhydrol.2009.08.003
Gupta, A., and Kumar, S. (2021). Impact of land use change on groundwater dynamics: a modeling approach. Hydrol. Sci. J. 66, 459–474. doi: 10.1080/02626667.2020.1774078
Harbaugh, A. W. (2005). MODFLOW-2005, the U.S. Geological Survey modular ground-water model—The ground-water flow process. U.S. Geological Survey Techniques and Methods 6–A16. Available online at: https://pubs.usgs.gov/tm/2005/tm6A16/
Hughes, J. D., Langevin, C. D., and Banta, E. R. (2021). Advances in MODFLOW 6 for groundwater modeling: flexible simulation of flow and transport. Groundwater 59, 659–668. doi: 10.1111/gwat.13108
Humphreys, E., Kukal, S. S., Christen, E. W., Hira, G. S., Balwinder-Singh,, Sudhir-Yadav,, et al. (2010). Halting the groundwater decline in north-West India — which crop technologies will be winners? Adv. Agron. 109, 155–217. doi: 10.1016/B978-0-12-385040-9.00005-0
ICAR. (2021). Vision 2050: Indian Council of Agricultural Research. New Delhi. Available online at: https://icar.org.in/sites/default/files/2022-06/Gandhi-Ji-Book-16-10-2020-m.pdf
IWMI. (2021). IWMI annual report 2020. Colombo, Sri Lanka: International Water Management Institute. Available online at: https://2020.annual-report.iwmi.org/
IWMI. (2023). IWMI annual report 2022. Colombo, Sri Lanka: International Water Management Institute. Available online at: https://2022.annual-report.iwmi.org/
Jagermeyr, J., Pastor, A., Biemans, H., and Gerten, D. (2021). Reconciling irrigated food production with environmental flows for sustainable development goals implementation Nat. Commun. 12 1–9. Available online at: https://www.nature.com/articles/ncomms15900
Jain, S., Chaurasia, S., and Sharma, A. (2019). Simulation of groundwater flow and its response to management practices using MODFLOW: a case study. Environ. Earth Sci. 78:248. doi: 10.1007/s12665-019-8415-5
Jain, S. K., Kumar, V., and Panda, S. N. (2022). Groundwater scenario and challenges in India. Curr. Sci. 122, 723–730. doi: 10.18520/cs/v122/i6/723-730
Jain, M., Singh, B., Srivastava, A., and Mukherjee, A. (2021) Water-saving technologies for sustainable groundwater use in Indian agriculture Curr. Sci. 120:43–50. Available online at: https://www.currentscience.ac.in/Volumes/120/01/0043.pdf
Jasechko, S., and Perrone, D. (2021). Global groundwater wells at risk of running dry. Science 372, 418–421. doi: 10.1126/science.abc2755
Jasechko, S., Perrone, D., and Shams, M. (2017). Global groundwater depletion and the impact of international trade. Sci. Adv. 3:e1601186. doi: 10.1126/sciadv.1601186
Jat, M. L., Sharma, S. K., Sharma, S. N., Gupta, R. K., Gill, M. A., and Gupta, R. (2009). “Laser land leveling: A precursor technology for resource conservation. Rice-wheat consortium technical bulletin, Rice-wheat consortium for the indo-Gangetic Plains (RWC), New Delhi, India” in Laser Land Leveling: A Precursor Technology for Resource Conservation. New Delhi, India: Rice-Wheat Consortium for the Indo-Gangetic Plains.
Jha, M., Agarwal, S., and Singh, R. (2019). Application of groundwater simulation models to assess the impact of recharge enhancement techniques in a semi-arid region. J. Hydrol. 571, 306–318. doi: 10.1016/j.jhydrol.2019.02.001
Jha, M. K., Chowdary, V. M., and Nema, R. K. (2022). Groundwater recharge estimation using infiltration models and geospatial tools: a case study from monsoon-dominated regions in India. J. Hydrol. 605:127301. doi: 10.1016/j.jhydrol.2021.127301
Kim, J., Lee, S. Y., Park, E., and Lee, J. Y. (2021). Modeling the impact of groundwater pumping on land subsidence in an agricultural area using MODFLOW and SUB-WT. Water 13:449.
Kabat, P., Claussen, M., Dirmeyer, P. A., Gash, J. H. C., Guenni, L. B., de Pielke, R. A., et al. (2003). Vegetation, Water, Humans and the Climate. A new Perspective of an Interactive System. IGBP Series, Springer Verlag.
Kumar, M., Kumar, R., Kanannavar, P. S., Ravindra, Y., and Rudragouda, C. (2017). Resources conservation through laser guided land leveller for paddy cultivation in Raichur, Karnataka. Indian J. Soil Conserv. 45, 296–301.
Kumar, M., Kumar, R., Singh, P. K., Singh, M., Yadav, K. K., and Mittal, H. K. (2015). Catchment delineation and morphometric analysis using geographical information system. Water Sci. Technol. 72, 1168–1175. doi: 10.2166/wst.2015.303
Kumar, C. P., and Singh, R. D. (2021) Assessment of groundwater recharge using water table fluctuation and soil moisture balance methods: a comparative study in India Curr. Sci. 121:245–252. Available online at: https://www.currentscience.ac.in/volumes/121/02/0245.pdf
Kumar, M., Singh, P. K., Kumar, R., Mittal, H. K., Yadav, K. K., and Ghag, K. S. (2019). Planning of conservation measures using remote sensing and geographical information system in micro-watershed Indian J. Soil Conserv. 47:37–44. Available online at: https://ijsc.iaswc.com/index.php/ijsc/article/view/283
Kumar, R., Singh, S., and Meena, S. (2020). Impact of declining groundwater levels on agricultural pumping efficiency and energy use in India. Water Resour. Manag. 34, 2153–2166. doi: 10.1007/s11269-020-02626-x
Kumar, M., Singh, D. K., Sarangi, A., Mani, I., Khanna, M., Sahoo, R. N., et al. (2020). Crop water requirement and irrigation schedule for major crops of indo–Gangetic plain using CROPWAT model Indian J. Soil Conserv. 48:228–235. Available online at: https://ijsc.iaswc.com/index.php/ijsc/article/view/210
Kumar, R., Singh, R., and Sharma, S. (2018). Barriers to adoption of resource conservation technologies in India: a case of laser land leveling. Int. J. Agric. Sustain. 16, 474–489. doi: 10.1080/14735903.2018.1495724
Kumar, M. D., Singh, O.P., and Sharma, S. Enhancing irrigation efficiency in canal commands with micro irrigation: economic and policy implications Irrig. Drain. (2020) 69: 232–243. Available online at: https://onlinelibrary.wiley.com/doi/abs/10.1002/ird.2487
Langevin, C. D., Thorne, D. T., Dausman, A. M., Sukop, M. C., and Guo, W. (2017). MODFLOW–USG version 1.4.00: an unstructured grid version of MODFLOW for simulating groundwater flow. U.S. Geological Survey Software Release. Available online at: https://water.usgs.gov/ogw/mfusg/
Li, X., Wang, L., and Zhan, H. (2021). Advances in aquifer modeling and sustainable groundwater management. J. Hydrol. 596:126064. doi: 10.1016/j.jhydrol.2020.126064
Liu, J., Zheng, C., and Yan, W. Managed aquifer recharge in China Water (2020) 12:425. Available online at: https://www.mdpi.com/2073-4441/12/2/425
McDonald, M. G., and Harbaugh, A. W. (1988). A modular three dimensional finite-difference ground-water flow model. USA: USGS Techniques of Water-Resources Investigations, United States Geological Survey, 586.
Mishra, V., Mukherjee, S., Kumar, R., and Daly, E. (2022). Groundwater depletion and sustainability of irrigation in the Indian subcontinent. Nature Sustainability 5, 346–356. doi: 10.1038/s41893-021-00827-6
Mishra, V., Conrad, C., and Famiglietti, J. S. (2021). Warming temperatures exacerbate groundwater depletion rates in India. Science Advances, 10, eadi1401. doi: 10.1126/sciadv.adi1401
Mondal, S., Ghosh, A., and Paul, B. K. (2023). Application of remote sensing and GIS in estimating groundwater recharge using water balance and infiltration approaches. Environ. Monit. Assess. 195:387. doi: 10.1007/s10661-023-11234-9
Moriasi, D. N., Arnold, J. G., Van Liew, M. W., Bingner, R. L., Harmel, R. D., and Veith, T. L. (2007). Model evaluation guidelines for systematic quantification of accuracy in watershed simulations. Trans. Am. Soc. Agric. Biol. Eng. 50, 885–900. doi: 10.13031/2013.23153
NAAS (2013). Water Management in Agriculture: Scope and Strategies. National Academy of Agricultural Sciences, Policy Paper No. 63. Available online at: https://naas.org.in/Policy%20Papers/Summary.pdf
Narayanamoorthy, A. (2017). Can drip method of irrigation be used to achieve the goal of doubling farmers’ income? Indian J. Agric. Econ. 72, 1–19.
Naresh, R. K., Singh, S. P., Misra, A. K., Tomar, S. S., Kumar, P., Kumar, V., et al. (2014). Evaluation of the laser leveled land levelling technology on crop yield and water use productivity in western Uttar Pradesh. Afr. J. Agric. Res. 9, 473–478. doi: 10.5897/AJAR12.1741
NITI Aayog. (2019). Composite water management index: A tool for water management. Government of India. Available online at: https://niti.gov.in/writereaddata/files/document_publication/Updated%20CWMI%202019%20Report.pdf
Pathak, H., Jain, N., Bhatia, A., Patel, J., and Aggarwal, P. K. (2013). Carbon footprints of Indian food items. Agric. Ecosyst. Environ. 169, 148–157. doi: 10.1016/j.agee.2010.07.002
Randhir, T. O., and Klosterman, K. B. (2024). Modeling landscape influence on stream baseflows for watershed conservation. Land 13:324. doi: 10.3390/land13030324
Ranjan, S., Bhattacharya, P., and Choudhury, P. (2023). Application of MODFLOW model for groundwater simulation and management: a comprehensive review. Groundw. Sustain. Dev. 22:100875. doi: 10.1016/j.gsd.2023.100875
Refsgaard, J. C., Højberg, A. L., Troldborg, L., and Sonnenborg, T. O. (2012). Groundwater modeling in integrated water resources management: handling uncertainty, data gaps and bias. Adv. Water Resour. 36, 36–50. doi: 10.1016/j.advwatres.2011.04.006
Reilly, T. E., Laczniak, R. J., and Williams, J. R. (2015). The use of MODFLOW in groundwater studies. Water Resour. Res. 51, 7102–7118. doi: 10.1002/2015WR017287
Richey, A. S., Voss, K. A., and Thomas, B. F. (2015). Quantifying renewable groundwater stress with GRACE. Geophys. Res. Lett. 42, 2179–2187. doi: 10.1002/2015GL063308
Ritter, A., and Muñoz-Carpena, R. (2013). Performance evaluation of hydrological models: statistical significance for reducing subjectivity in goodness-of-fit assessments. J. Hydrol. 480, 33–45. doi: 10.1016/j.jhydrol.2012.12.004
Rodell, M., Famiglietti, J. S., Wiese, D. N., Reager, J. T., Beaudoing, H. K., Landerer, F. W., et al. (2018). Emerging trends in global freshwater availability. Nature 557, 651–659. doi: 10.1038/s41586-018-0123-1
Rodell, M., Velicogna, I., and Famiglietti, J. S. (2009). Satellite-based estimates of groundwater depletion in India. Nature 460, 999–1002. doi: 10.1038/nature08238
Roy, R., Choudhury, A., and Jain, S. (2022). Cost-benefit analysis of submersible pumps and centrifugal pumps for irrigation under depleting groundwater conditions. Agric. Water Manag. 256:107050. doi: 10.1016/j.agwat.2021.107050
Scanlon, B. R., Faunt, C. C., Longuevergne, L., Reedy, R. C., Alley, W. M., McGuire, V. L., et al. (2012). Groundwater depletion and sustainability of irrigation in the US High Plains and Central Valley. Proc. Natl. Acad. Sci. 109, 9320–9325. doi: 10.1073/pnas.1200311109
Scanlon, B. R., Reedy, R. C., Faunt, C. C., Pool, D. R., and Uhlman, K. (2016). Enhancing drought resilience with conjunctive use and managed aquifer recharge in California and Arizona. Environ. Res. Lett. 11:035013. doi: 10.1088/1748-9326/11/3/035013
Scanlon, B. R., Ruddell, B. L., Reed, P. M., Hook, R. I., Zheng, C., Tidwell, V. C., et al. (2022). The food-energy-water nexus: transforming science for society. Water Resour. Res. 58:e2021WR030684. doi: 10.1029/2017WR020889
Shah, T. (2009). Taming the anarchy: Groundwater governance in South Asia. New York, USA: Routledge.
Shah, T. (2014). Groundwater and welfare: an agenda for research and action. Water Resour. Res. 50, 4559–4574.
Shah, T. (2021). Reforming India’s groundwater governance: a new era of management through local institutions and technologies. J. Hydrol. Reg. Stud. 34:100791. doi: 10.1016/j.ejrh.2021.100791
Shah, T., Rajan, A., and Kishore, A. (2021). Groundwater governance in India: stumbling, yet indispensable. Water Policy 23, 106–124. doi: 10.2166/wp.2021.001
Sharma, B. R., Amarasinghe, U. A., Xenarios, S., and Singh, R. (2021). Addressing water scarcity in South Asia: Lessons from adaptive management. IWMI Research Report.
Sharma, B. R., Gulati, A., Mohan, G., Manchanda, S., Ray, I., and Amarasinghe, U. (2018). Water productivity mapping of major Indian crops. ICRIER–NABARD, ICRIER–IWMI Report, Hyderabad. Available online at: https://www.nabard.org/auth/writereaddata/tender/1806181128Water%20Productivity%20Mapping_of_Major_Indian_Crops%2C%20Web%20Version%20%28Low%20Resolution%20PDF%29.pdf
Sharma, N., Soni, P., and Sharma, P. (2018). Groundwater modeling in hard rock regions: challenges and solutions. Hydrol. Sci. J. 63, 632–648. doi: 10.1080/02626667.2018.1431942
Shen, D., Wu, J., and Wang, Y. (2015). Water saving irrigation in China: current situation, problems, and countermeasures. Water Policy 17, 1084–1100. doi: 10.2166/wp.2015.170
Singh, R., Goyal, V. C., and Singh, A. (2018a). Water productivity of canal irrigation in indo-Gangetic Basin: constraints and opportunities. Irrig. Sci. 36, 293–310.
Singh, R., Kumar, R., and Jat, M. L. Water productivity in agriculture: Indian perspectives Curr. Sci. (2018b) 114: 919–930. Available online at: https://www.currentscience.ac.in/Volumes/114/05/0919.pdf
Singh, S., Lakhwani, P., and Sharma, R. K. (2021). Technological shifts in groundwater pumping systems in response to declining water tables. J. Hydrol. 595:125944. doi: 10.1016/j.jhydrol.2020.125944
Singh, D., Sharma, P., and Pandey, P. (2020). Groundwater quality and quantity assessment using integrated modeling: a case study in the northern Indian aquifers. Environ. Monit. Assess. 192:330. doi: 10.1007/s10661-020-8219-5
Sophocleous, M. (2020). Aquifer management and groundwater modeling: advances and challenges. Hydrogeol. J. 28, 55–71. doi: 10.1007/s10040-019-02123-9
Sufyan, M., Martelli, G., Teatini, P., Cherubini, C., and Goi, D. (2024). Managed aquifer recharge for sustainable groundwater management: new developments, challenges, and future prospects. Water 16:3216. doi: 10.3390/w16223216
Wada, Y., and Bierkens, M. F. P. (2014). Sustainability of global water use: past reconstruction and future projections. Environ. Res. Lett. 9:104003. doi: 10.1088/1748-9326/9/10/104003
Wada, Y., Gleeson, T., and Esnault, L. (2016). Wells and well-being in India: examining the socioeconomic drivers of groundwater depletion. Nat. Geosci. 9, 824–828. doi: 10.1038/ngeo2795
Wada, Y., Van Beek, L. P. H., Van Kempen, C. M., Reckman, J. W. T. M., Vasak, S., and Bierkens, M. F. P. (2010). Global depletion of groundwater resources. Geophys. Res. Lett., 37: 1–5.
World Bank (2022). India Groundwater: A Valuable but Diminishing Resource. Available online at: https://www.worldbank.org/en/news/feature/2022/03/21/india-groundwater-a-valuable-but-diminishing-resource
Keywords: groundwater sustainability, MODFLOW modeling, irrigation efficiency, laser land leveling, crop diversification
Citation: Kumar M, Singh DK, Sarangi A, Mani I and Khanna M (2025) Impact assessment of different water management technologies on regional groundwater ecosystem service. Front. Water. 7:1654541. doi: 10.3389/frwa.2025.1654541
Edited by:
Akhouri Pramod Krishna, Birla Institute of Technology, Mesra, IndiaReviewed by:
Umar Iqbal, University of Chinese Academy of Sciences, ChinaMuthanna Al-Shammari, University of Karbala, Iraq
Copyright © 2025 Kumar, Singh, Sarangi, Mani and Khanna. This is an open-access article distributed under the terms of the Creative Commons Attribution License (CC BY). The use, distribution or reproduction in other forums is permitted, provided the original author(s) and the copyright owner(s) are credited and that the original publication in this journal is cited, in accordance with accepted academic practice. No use, distribution or reproduction is permitted which does not comply with these terms.
*Correspondence: Manoj Kumar, a3VtYXJtYW5vajEwNjgwQGdtYWlsLmNvbQ==