 Ratheesh Moses
 Mahenthiran Sathiyamoorthy
- School of Civil Engineering, Vellore Institute of Technology, Vellore, Tamil Nadu, India
Coastal aquifers are facing significant threats from overexploitation, seawater intrusion, and reduced recharge. Effective groundwater management necessitates a precise spatial evaluation of groundwater potential. This research aims to identify Groundwater Potential Zones (GWPZ) of Tarangambadi Taluk in Mayiladuthurai district, Tamil Nadu, using integrated GIS, Remote sensing, and the Analytical Hierarchy Process (AHP) methods. The study included fourteen thematic layers selected based on hydrogeological relevance. Each layer's weight was calculated utilizing the AHP methods, facilitated through analysis of weighted overlay in GIS to produce the spatial distribution of the GWPZ. The study zone was classified into five potential categories. Analysis indicates that 52% of the area is classified within high to very high potential zones, predominantly located in the central and western taluk, characterized by favorable geological conditions. Conversely, approximately 19% of the area, primarily along the eastern coastline, is categorized as low to very-low potential zones due to factors such as impervious surfaces and saline intrusion risks. The resulting GWPZ map aligns well with borewell data, affirming its precision and utility. The outcomes serve as a valuable resource for sustainable planning and aquifer management in coastal areas.
1 Introduction
Water is a basic resource required for life, and groundwater has become a significant natural resource in providing the freshwater needs of various sectors in the world. Groundwater is integral to India's drinking water security and agriculture, accounting for approximately 62% of irrigation, 85% of rural water supply, and 50% of urban supply (Central Groundwater Board, 2024). Climate action and anthropogenic factors have a significant impact on groundwater resources. Increased population and urbanization have led to overutilization of groundwater resources, resulting in challenges related to water scarcity (Patidar et al., 2021). The excessive withdrawal of groundwater for agricultural and urban purposes generally lowers water levels, thereby increasing the susceptibility of aquifer saltwater intrusion, which compromises the quality of freshwater resources for potable and irrigation uses (Ramasubramanian et al., 2025). Because of extensive use and improper management, groundwater levels have decreased over the decades (Ostovari et al., 2015). Consequently, the investigation and sustainable management of groundwater resources crucially rely on the capacity of underlying aquifers, which requires the implementation of pioneering decision-making methodologies and sophisticated data amalgamation techniques to identify areas with significant groundwater potential accurately (Arabameri et al., 2019).
Groundwater potential advances Sustainable Development Goal 6 (SDG 6) by facilitating sustainable water access. It also fosters SDG 13 by bolstering resilience against climate-induced groundwater challenges. Furthermore, it aligns with SDG 15 by supporting terrestrial ecosystems and land productivity (Dange et al., 2025). Sustainable utilization of water resources requires groundwater management. Topographical, hydrological, geological, and climatic factors influence the availability and management of groundwater (Golkarian et al., 2018). Delineating the groundwater potential zones is crucial for effective planning, management, and sustainable development of any region because groundwater is an imperceptible natural resource (Dist and Mondal, 2017).
Hydrogeological, geological, and geophysical surveys are expensive and time-consuming in traditional groundwater mapping methods (Pandey et al., 2022). On the other hand, an alternative, quick, and less costly option is provided by geospatial technology such as GIS and RS (Arulbalaji et al., 2019). By combining more thematic layers, enabling quick and economic data collection, giving synoptic coverage, and leveraging the requirement for substantial fieldwork and specialized labor, remote sensing and GIS facilitate successful groundwater management (Narendra et al., 2013; Raj et al., 2024). Leveraging these benefits, various factual methods have been developed to integrate multiple parameters using the GIS technique, facilitating the effective and economically viable production of a comprehensive groundwater potential map (Selvam et al., 2016; Muthu and Sudalaimuthu, 2021). Many researchers have successfully identified groundwater potential areas for sustainable sources of planning and management in recent decades by using Remote sensing and GIS approaches (Kanagaraj et al., 2019; Abijith et al., 2020; Thirunavukkarasu and Ambujam, 2020).
Generally, expert judgment systems and machine learning algorithms are the two approaches for creating a groundwater potential map (Díaz-Alcaide and Martínez-Santos, 2019). GIS approaches have been integrated into expert judgment systems such as logistic regression (LR) (Zhang et al., 2018), certainty factor (CF), probability frequency ratio (FR), weighted evidence (WE), evidentiary belief function (EBF), Analytic hierarchy process (AHP), Fuzzy AHP, and Multi-influence factor techniques are based on human judgment (Boughariou et al., 2021; Kumar et al., 2021; Gandhi et al., 2024). On the other hand, machine learning models have become prominent for their efficacy in elucidating intricate linkages and forecasting groundwater resources, resulting in several investigations into the identification of groundwater potential zones (GWPZ) (Vafadar et al., 2023). There are numerous machine learning techniques are Artificial Neural Network (ANN), Logistic Regression (LR), Support Vector Machine (SVM), Random Forest (RF), Decision Trees (DT), K-Nearest Neighbor (KNN), Gradient Boosting, Predictive Neural Network (PNN), and Classification regression tree (CRT) used in many regions across the world (Berhanu and Hatiye, 2020; Prasad et al., 2020; Saha et al., 2021; Talukdar et al., 2022; Shandu and Atif, 2023; Khan et al., 2024).
Various methods used for groundwater potential studies require extensive data and resources, this is often limited in coastal regions. As a result, Previous studies sometimes overlooked expert-based thematic layer weighting, which can lead to biased outcomes (Berhanu and Hatiye, 2020). Moreover, the lack of systematic evaluation in GIS groundwater has led to an underestimate of the importance of key influencing factors (Doke et al., 2021). The Analytic Hierarchy Process (AHP) functions as a robust Multi-Criteria Decision-Making (MCDM) methodology, quantifying expert assessments and systematically integrating criteria (Elubid et al., 2020). Intensive agriculture and urbanization in the coastal deltas have caused groundwater over-exploitation, leading to seawater intrusion and groundwater quality degradation (Sridhar et al., 2014).
Tarangambadi taluk is a coastal agricultural region in Tamil Nadu. There is no previous research that has been conducted to identify the groundwater potential zone in this area. Determining the GWPZ is crucial for the area's sustainable management. The main objective of the research work is to delineate the groundwater potential zone for Tarangambadi taluk through the integration of remote sensing, GIS, and AHP techniques with locally calibrated thematic weights based on recent hydrogeological and remote sensing datasets for the sustainable management of groundwater resources. In a novel approach to GWPZ, the Proximity to sea is a thematic layer to directly examine the spatial influence of seawater intrusion, an essential factor in managing coastal aquifers. This study's innovation is a coastal focus, requiring dual planning for Tarangambadi: recharge enhancement and seawater intrusion prevention.
2 Study area
Tarangambadi, formerly Tranquebar, is a panchayat town in the Mayiladuthurai District of the Indian state of Tamil Nadu. It lies 15 km north of Karaikal, near the mouth of a distributary of the Cauvery River. Tarangambadi is the headquarters of Tarangambadi Taluk. The coordinates of the Tarangambadi taluk lie between 10°58′56.53″N to 11°09′1.86″N latitude and 79°40′7.60″E to 79°51′29.41″E longitude. It covers an area of 280.96 km2. The regional hydrogeological boundaries are delineated in Figure 1.
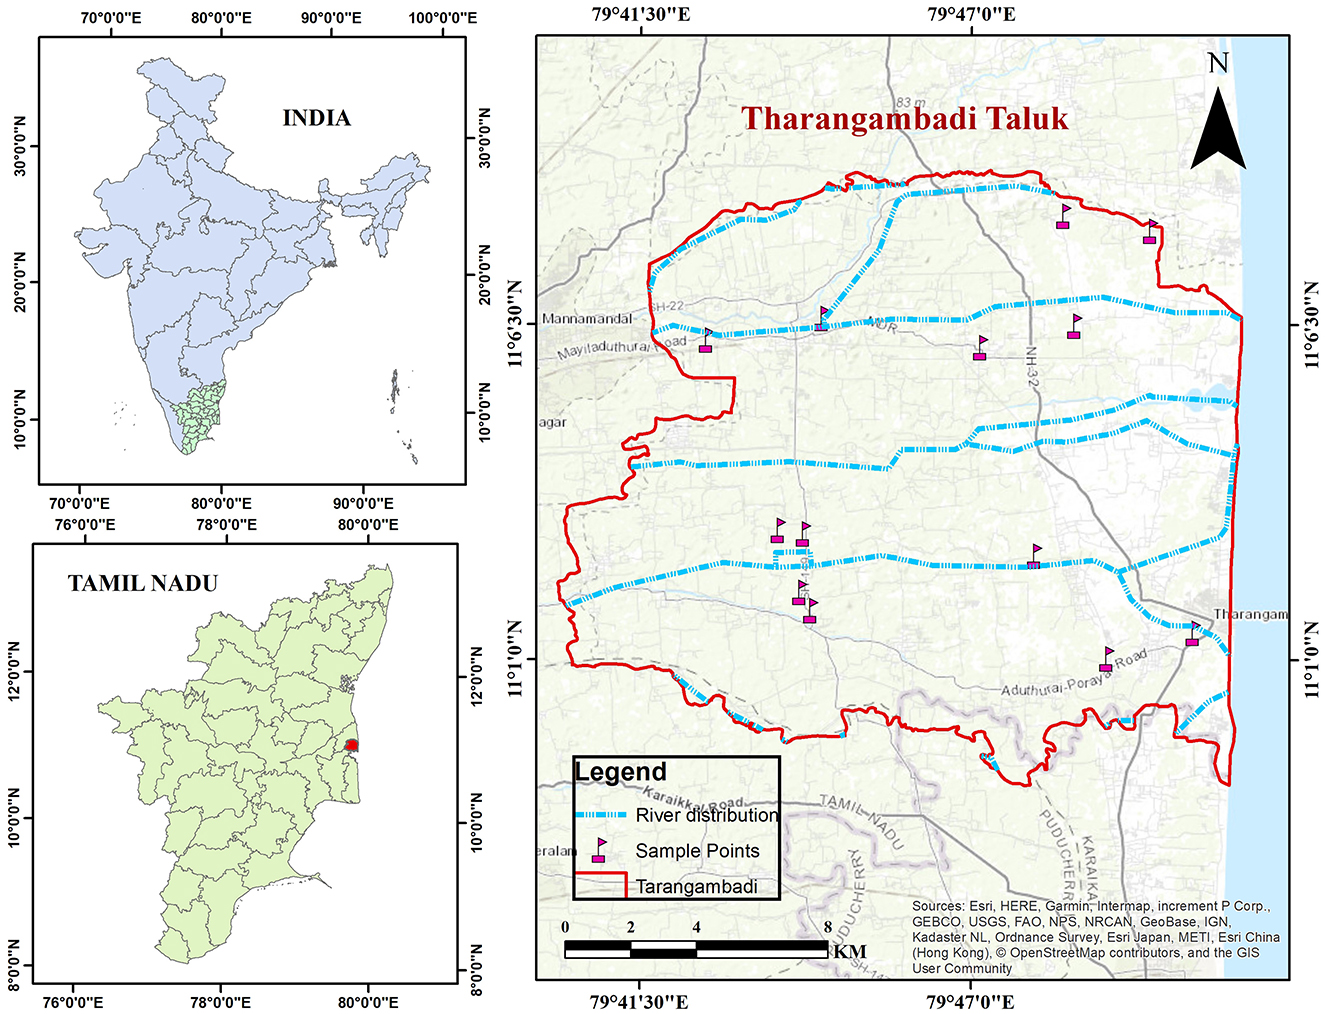
Figure 1. Location map of the study area: Tarangambadi Taluk.
Elevations vary from −1 to 13 m above sea level, and slope angles range from 0° to 12°. During the month of summer, March to May, the maximum temperature reaches, and the average annual minimum and maximum temperatures are 24°C and 37°C, respectively. The average yearly rainfall ranges from 886.6 mm to 1,398 mm. The maximum rain falls during the northeast monsoon from October to December. Its topography exhibits a diverse landscape comprising lowlands, alluvial plains, river deltas, and coastal plains. Geology formation majorly consists of active alluvial deposits, active marine deposits, and paleo marine and alluvial deposits. In terms of land cover and land use classification, it predominantly consists of agricultural land, built-up areas, water bodies, and coastal areas. Agriculture is the primary source of income for the rural population. Paddy is the major crop (97 % during the monsoon season), and 47 % of the area is covered under winter crops. Rainfall and groundwater are the main sources of irrigation. Due to the erratic behavior of the southwest monsoon, supplementary irrigation is also required during the Kharif (monsoon) season.
3 Materials and methods
3.1 Groundwater influencing factors
The accuracy of groundwater potential assessment depended on the selection of influencing factors. The groundwater influencing factors are selected based on the nature of the study area, considering those with the most significant impact on groundwater recharge. In this process, several elements influencing the presence of groundwater are represented by thematic layers, which are geomorphology, Land use land cover (LULC), geology, soil, rainfall, drainage density, lineament density, proximity to stream, proximity to sea, topographic wetness index (TWI), topographic position index (TPI), slope, normalized difference vegetation index (NDVI), and normalized difference water index (NDWI).
The Geological Survey of India (GSI) contributed geomorphological and geological data. The National Bureau of Soil Survey and Land Use Planning (NBSS & LUP) offered Soil data. Specifically, geology, Geomorphology, and soil maps were used at a 1:50,000 scale. In the present investigation, the Land Use/Land Cover (LULC), Normalized Difference Vegetation Index (NDVI), and Normalized Difference Water Index (NDWI) were extracted from Sentinel-2B-2A imagery. Specifically, we utilized a dataset acquired on 16 September 2024 (late southwest monsoon/early northeast monsoon), chosen for minimal cloud cover and representative hydrological conditions was computed from Band 8 (NIR) and Band 4 (Red), while NDWI was derived from Band 8 (NIR) and Band 3 (Green), all of which have a 10 m spatial resolution. LULC mapping was performed using Supervised maximum likelihood algorithms, and accuracy assessment was conducted with reference samples (Google Earth and field verification). Rainfall and groundwater level data were sourced from the State Ground and Surface Water Resources Data Center, Tamil Nadu. Topographic and hydrological parameters, including lineament density, Drainage density, Slope, TWI, TPI, Proximity to stream, and Proximity to sea, were extracted from the Shuttle Radar Topography Mission (SRTM) Digital Elevation Model (DEM) at a 30-meter resolution. All the data are collected from various sources (Table 1) and processed in ArcGIS 10.8 software. Interpolation techniques were adopted to formulate continuous spatial surfaces from distinct point measurements, thus supporting the accurate estimation of parameter values in sites that had not been sampled. Among the various methods evaluated, Inverse Distance Weighted was chosen due to its exceptional statistical efficacy with the lowest RMSE and an excellent R2 accuracy. Figure 2 illustrates the comprehensive methodological framework utilized for calculating the Groundwater Potential Index (GWPI).
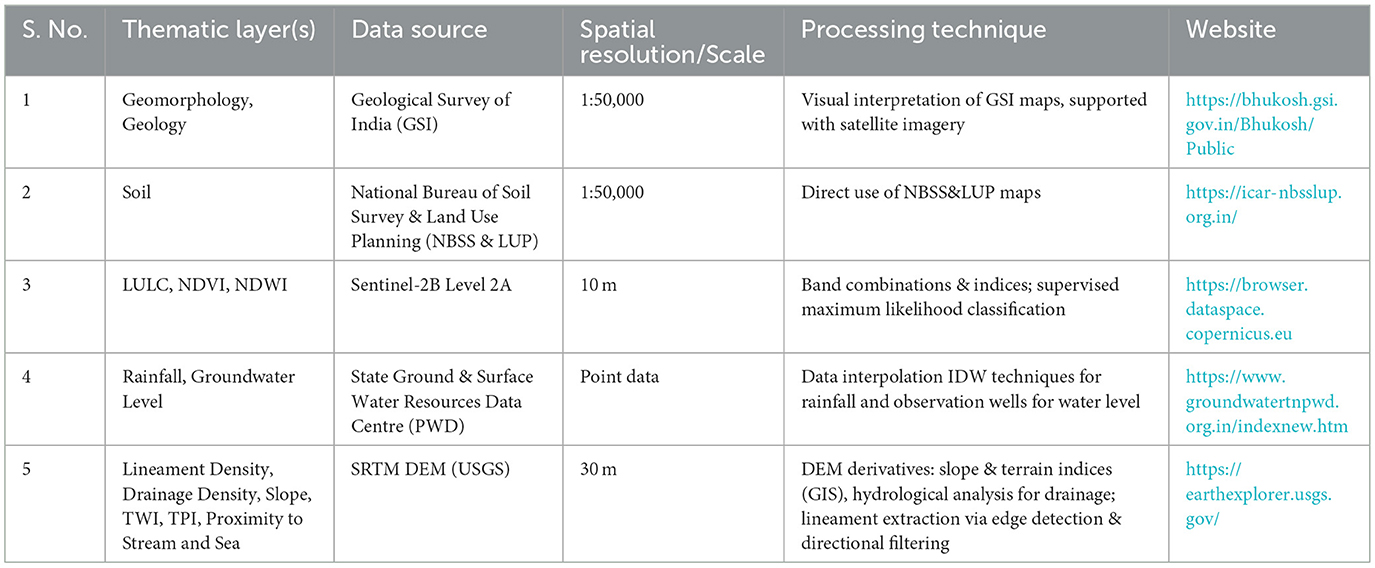
Table 1. Detailing sources, processing techniques, and seasonality of thematic layers.
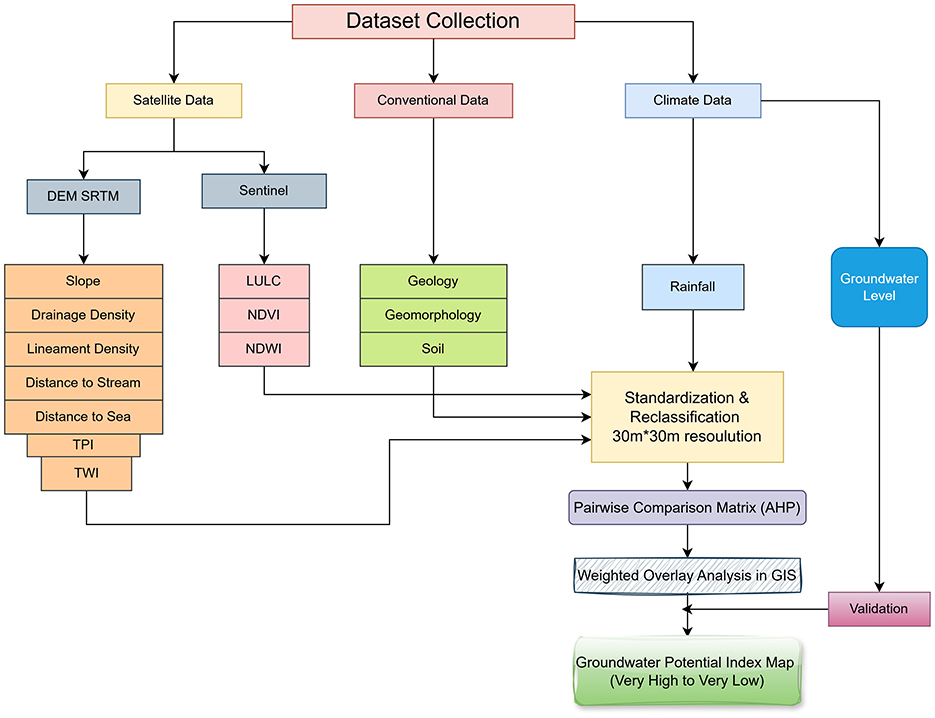
Figure 2. Procedural flow chart for Groundwater Potential Index.
3.2 Analytical hierarchy process
The Analytic Hierarchy Process (AHP), developed by Thomas L. Saaty (1980), is a decision-making framework that helps to solve complex problems in a clear hierarchical model. It applies pairwise comparison to quantify the relative importance of criteria using a standard scale. AHP also calculates consistency ratios to ensure the expert judgments remain logically sound and reliable (Saaty, 1987). AHP offers advantages such as transparency and simplicity, effectively integrating quantitative and qualitative criteria in water resources management (Cabrera et al., 2011). The Analytic Hierarchy Process (AHP) provides a versatile framework that facilitates the modification of expert assessment, affording individuals the most challenging and intricate issues (Galo, 2017).
3.3 Assignment of the weight by AHP
The Analytical Hierarchy Process (AHP) is a coherent approach utilized for the organization and scrutiny of complex decision-making environments, and it is broadly implemented in groundwater potential evaluation. The determination and ranking of parameters and sub-parameters in the AHP necessitate a coherent framework that incorporates expert evaluation, thematic layers, and geospatial analysis (Anteneh et al., 2022). The specification of parameters is commonly guided by specialist perspectives and extensive literature assessments, thereby affirming that the most relevant elements are acknowledged for the designated research area (Osinowo and Arowoogun, 2020). The AHP methodology utilizes Saaty's nine-point scale to allocate weights to each parameter according to its relative significance, as displayed in Table 2 (Hayer et al., 2023). This scale facilitates a pairwise comparison of parameters, thereby promoting a structured decision-making paradigm. Following the assignment of initial weights, the values undergo normalization to ensure that they collectively equal one (Ravindran et al., 2024). This procedure is instrumental in preserving consistency and comparability across various parameters. The weights are derived by averaging the normalized values corresponding to each row, yielding a priority vector that conveys the relative importance of each criterion (Jarrah et al., 2022). These weights equate to unity as they are extracted from a normalized matrix, thereby guaranteeing that cumulative importance is allocated across all criteria (Szabo et al., 2021). The final weights exemplify the relative importance of each criterion within the decision-making framework, thus enabling a clear prioritization of alternatives (Howari et al., 2023). Applied importance based on the Saaty scale in the pairwise matrix for the AHP is displayed in Table 3.
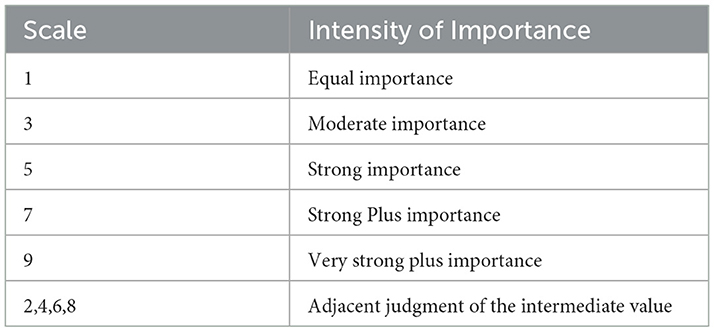
Table 2. The fundamental scale of AHP (Saaty, 1980).
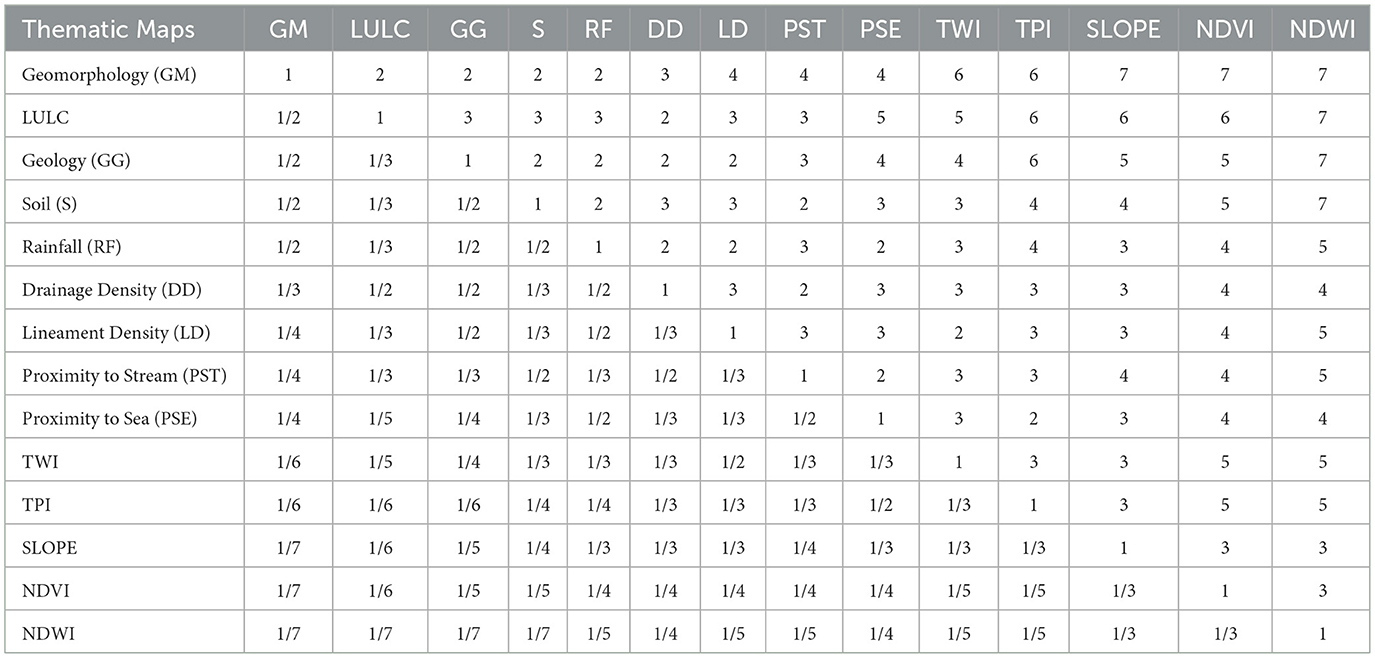
Table 3. Matrix for pairwise comparison in the Analytical Hierarchy Process (AHP).
The Consistency Ratio (CR), a construction first articulated by Saaty in 1980, serves as a metric for evaluating the coherence in the allocation of weight attributed to various parameters. This ratio facilitates a quantitative evaluation of weights derived from the normalized pairwise comparison matrix (NPCM) delineated in Table 4. If the CR fall below 0.10 (10%), it signifies a substantial degree of precision; in contrast, if the CR surpasses 0.10, it may necessitate a re-evaluation of the judgments to secure enhanced accuracy (Saaty, 1977).
Where CR = Consistency Ratio (CR)
CI = Consistency Index (CI), and RI = Random Consistency Index (RI)
λmax = largest eigenvalue and N = Number of parameters.
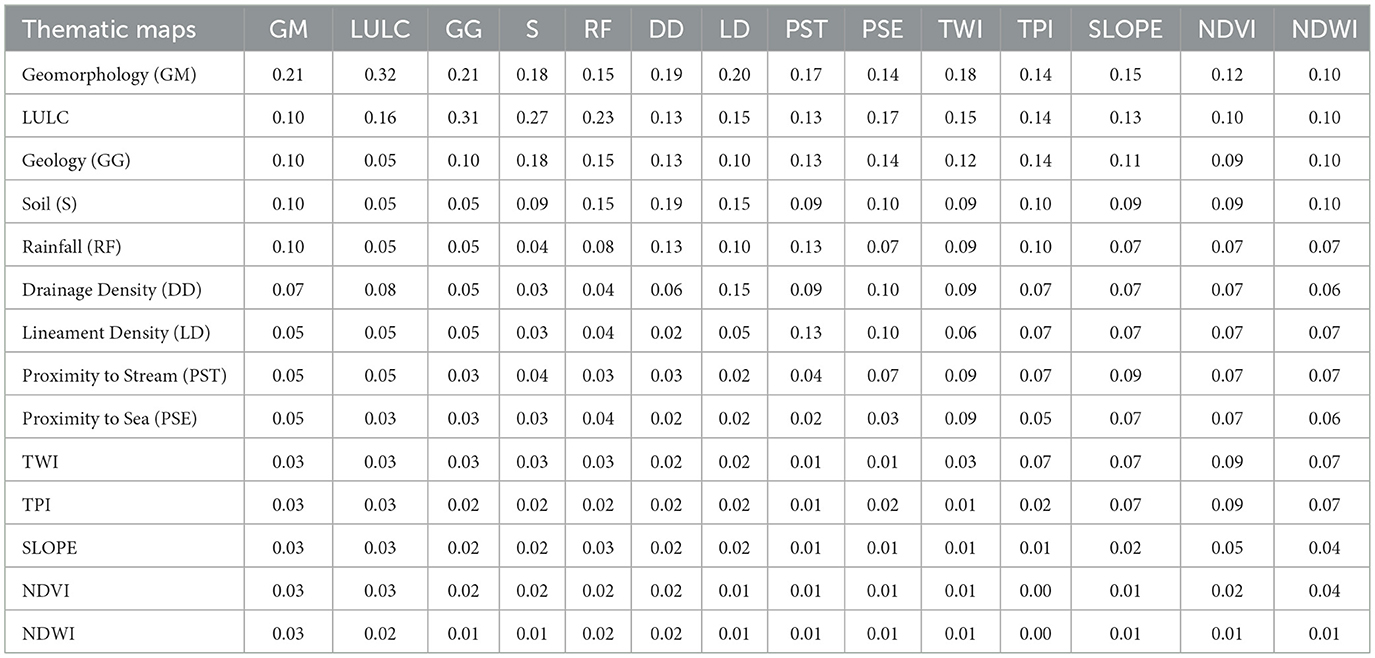
Table 4. Normalized Pairwise Comparison Matrix (NPCM).
3.4 Groundwater potential zone model
A commonly applied technique for identifying Groundwater Potential Zones (GWPZ) in the realm of Geographic Information Systems (GIS) is the Weighted Overlay Analysis (WOA) (Thanh et al., 2022; Jebaraj and Rajagopal, 2024). WOA represents a multi-criteria decision-making (MCDM) approach that synthesizes diverse thematic layers, each assigned weights that accurately represent their respective impacts on groundwater potential (Berhanu and Hatiye, 2020). This methodology facilitates spatial decision-making by systematically and transparently amalgamating standardized raster inputs.
Weights are allocated to each variable following their comparative significance to the prevalence of groundwater occurrence (Kandakoglu et al., 2019). Those weights can be allocated through expert assessments, comprehensive literature evaluations, or applied through a systematic AHP technique (Aladejana et al., 2016). The weights for fourteen criteria and their sub-criteria were incorporated into thematic layers in ArcGIS. The groundwater potential map was produced through weighted overlay analysis in GIS. This process involved computing the weighted sum of thematic layers as per Equation 3.
Where Wi is denoted as the weightage of each parameter, and Xi refers to the rank of each thematic layer. The raster output layer from the Weighted Overlay Analysis (WOA) is classified into five categories: very low, low, moderate, and very high. This classification is based on the identification of regions with varying groundwater potential yield in the research area.
4 Results and discussion
This study employed fourteen thematic maps to evaluate groundwater potential. The maps comprised Geomorphology, LULC, Geology, Soil, Rainfall, Drainage Density, Lineament Density, Proximity to Stream, Proximity to Sea, TWI, TPI, Slope, NDVI, and NDWI, all recognized for their impact on groundwater. The assessment of each thematic layer's weight was performed using the Analytic Hierarchy Process (AHP) (Twaha et al., 2024), which entails systematic pairwise comparisons based on the relative significance of each parameter (geomorphology, LULC, soil, Rainfall, etc.) concerning groundwater occurrence and recharge. The relative significance of those variables was ascertained through a comprehensive examination of extant peer-reviewed literature on groundwater potential mapping within analogous hydrogeological contexts, in conjunction with distinctive characteristics of the study area, encompassing hydrogeological conditions and field observations. In the lack of direct consultation with subject matter experts, we utilized the established weight range documented in credible academic research (Arulbalaji et al., 2019; Senthilkumar et al., 2019) and modified it by the regional characteristics identified in Tarangambadi Taluk. The resultant pairwise matrix attained a consistency ratio (CR) of less than 0.1, signifying a robust and dependable weighting framework. The study reported a consistency index (CI) of 0.155 and a consistency ratio (CR) of 0.094323, indicating satisfactory consistency. The thematic map category rankings were derived from previous studies and field expertise. Variables significantly affecting groundwater were assigned higher weights, while those with minimal influence received lower weights (Kadiri et al., 2023). The pairwise comparison matrix and normalized weights for parameters according to the AHP model are illustrated in Tables 3, 4. Table 5 displays the weightage assigned to the fourteen thematic maps and their respective subclasses.
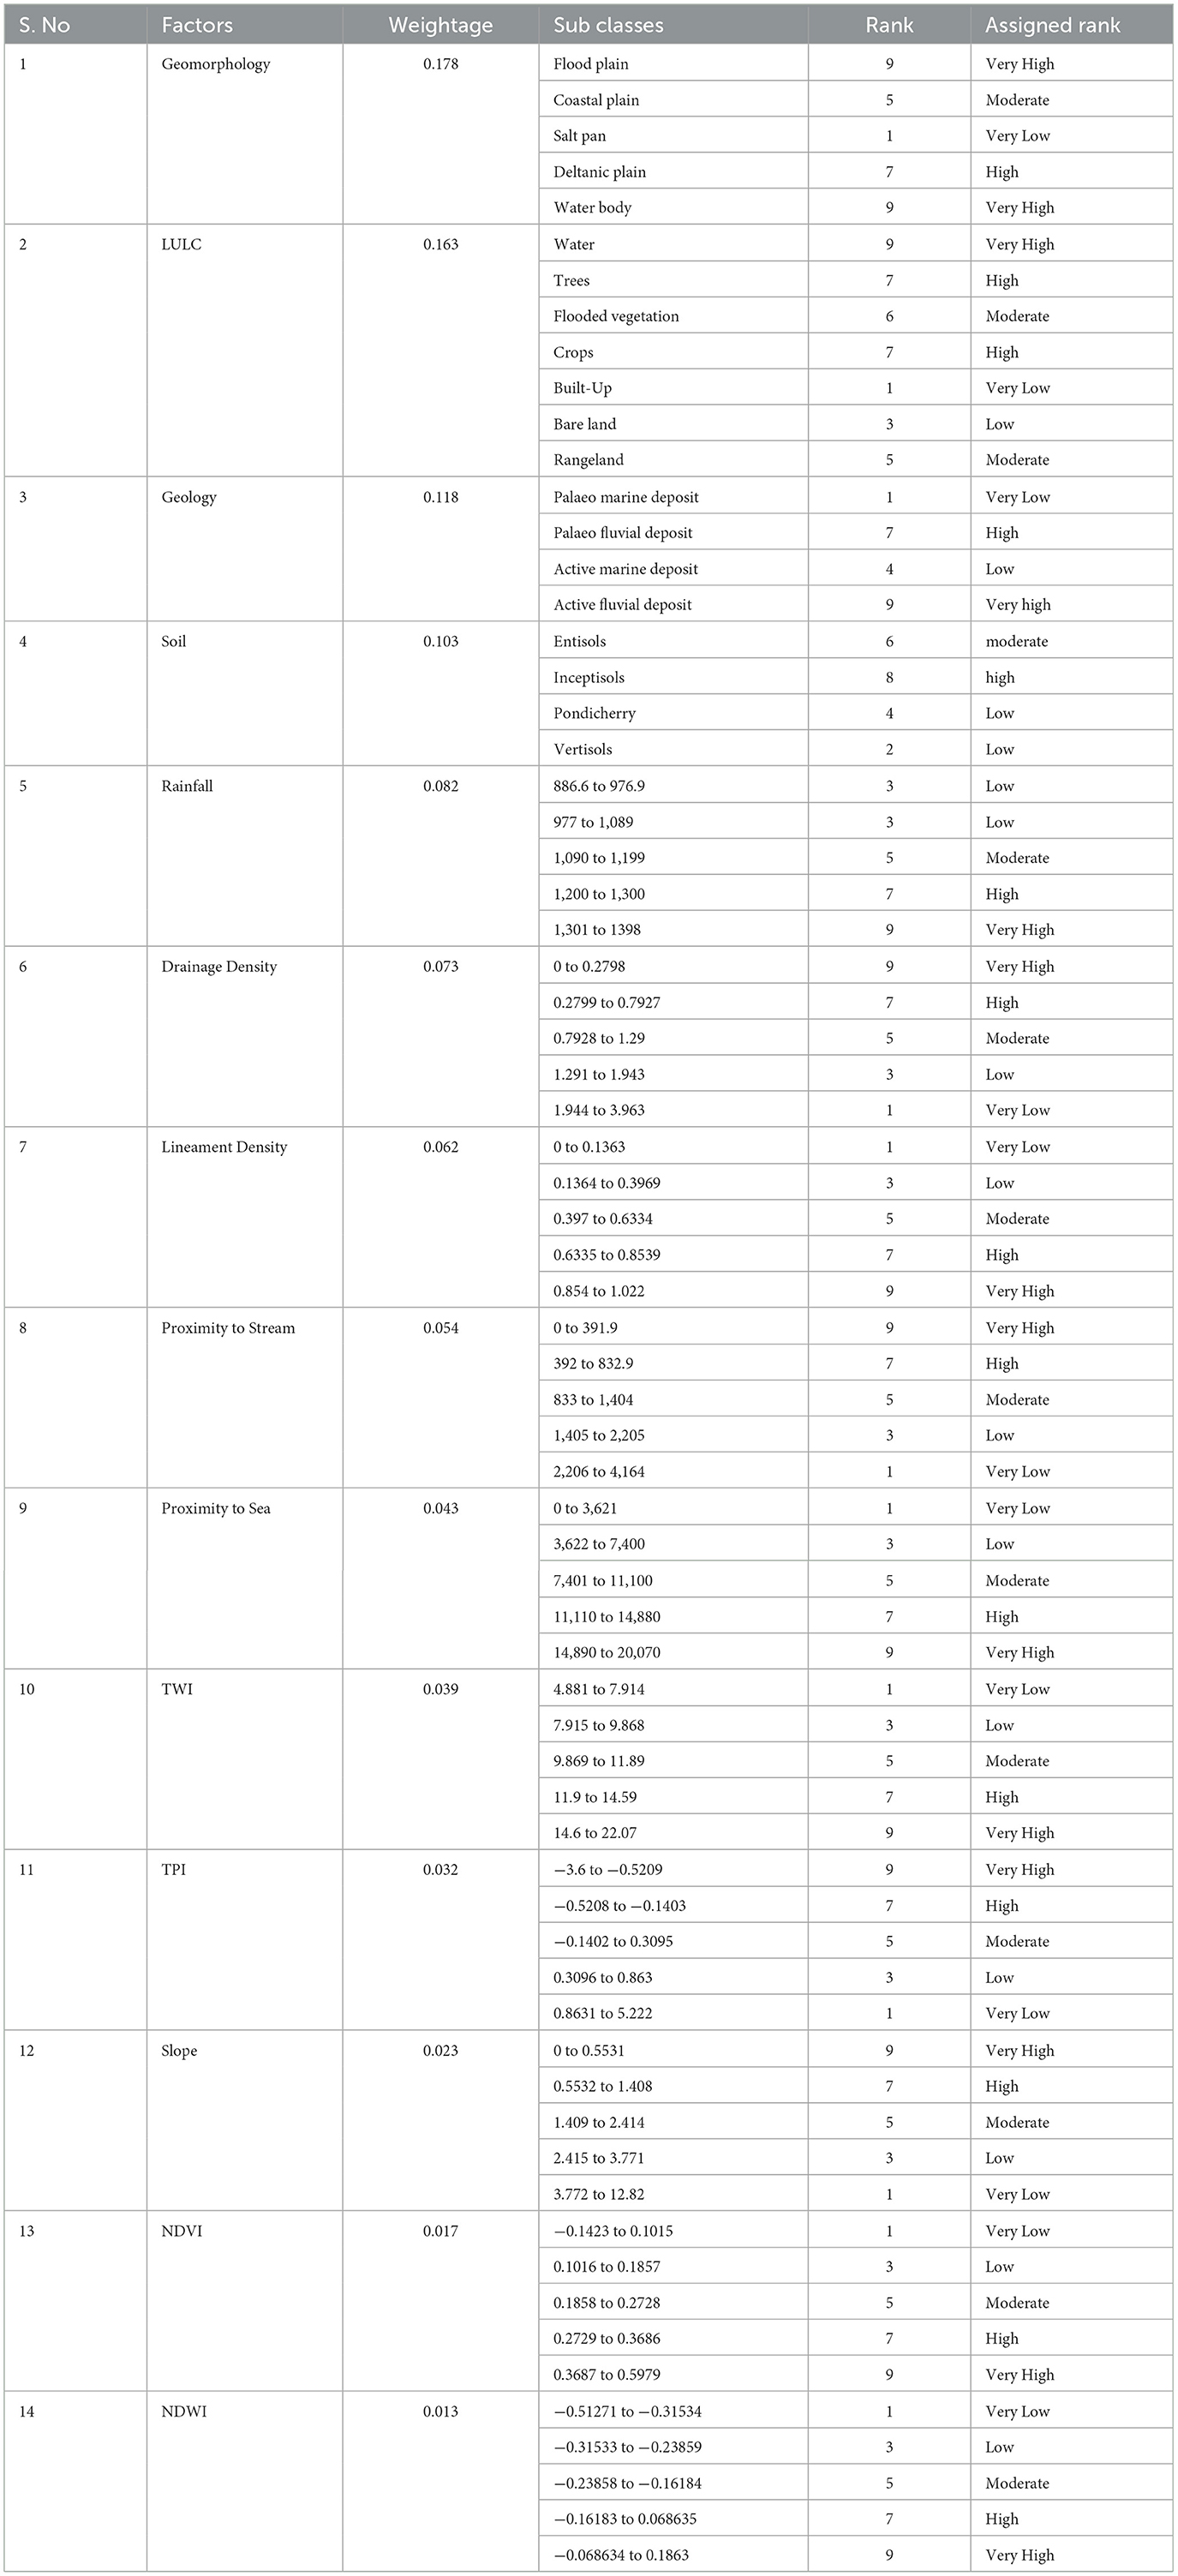
Table 5. Weightage and rank of subclasses of groundwater influencing factor.
4.1 Geomorphology
Assessment of geomorphology elucidates the genesis, distribution, and dynamics of groundwater (Letz et al., 2021). In geomorphological formations, the presence of groundwater is predominantly shaped by lithological characteristics, gradient, drainage configuration, infiltration capacity, and hydrological runoff (Arulbalaji et al., 2019; Pandey and Purohit, 2022). Based on the geomorphological attributes of the research area (Figure 3a) includes a deltaic plain, floodplains, a coastal plain, a salt pan, and water bodies. The deltaic plain, which constitutes the predominant portion of the region (77.66%), displays elevated groundwater potential. This phenomenon can be attributed to its fine-textured alluvial deposits and level topography that facilitate both infiltration and groundwater retention (Nazir et al., 2024). Floodplains, despite occupying a lesser area (6.10%), also manifest extremely high groundwater potential. The coastal plain comprises 14.17% of the area and is characterized by moderate groundwater potential. Salt pans represent only 0.53% of the area and demonstrate minimal groundwater potential due to saline soil and poor infiltration capacity. Conversely, water bodies, although they represent only 1.54% of the total area, are classified as exhibiting very high groundwater potential.
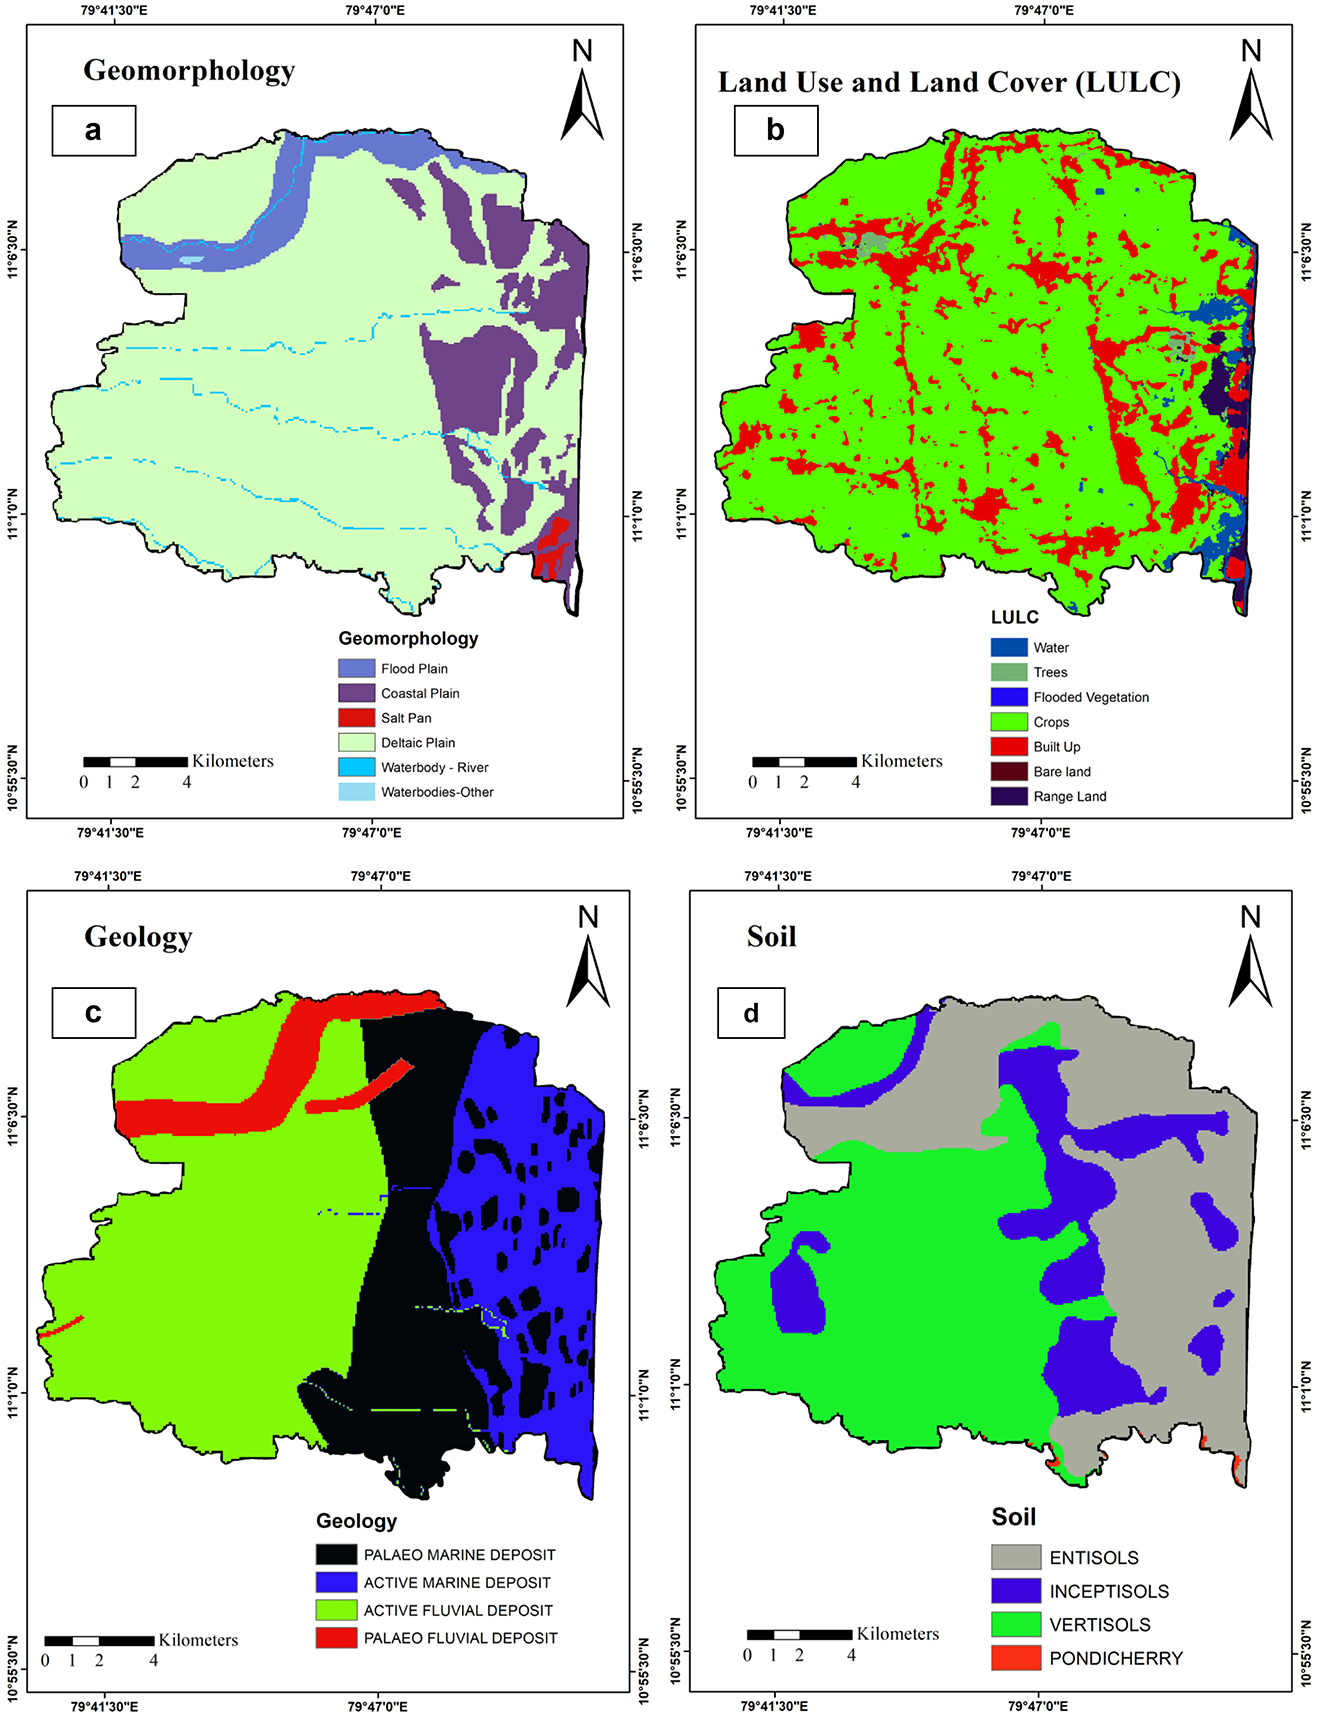
Figure 3. Thematic map of study area: (a) Geomorphology; (b) LULC; (c) Geology; (d) Soil.
4.2 LULC
Evaluating land use and land cover (LULC) is essential for understanding groundwater resources and sustainable management (Ramasubramanian et al., 2025). Land use and cover alterations significantly affect groundwater potential through their effect on recharge, groundwater levels, and water quality (Siddik et al., 2022; Salem et al., 2023). The LULC maps originate from Sentinel-2 Level-1C satellite imagery from 2023. The study area is characterized by cropland area (77.47%), built-up area (17.86%), water (2.27%), trees (0.64%), flooded vegetation (0.04%), Bare land (0.06%), and Range land (1.65%), as shown in Figure 3b. Cropland, water, trees, and flooded vegetation are optimal for recharge due to their facilitation of rainwater and irrigation water percolation, thus receiving greater weightage (Saravanan et al., 2020). In built-up areas, minimal weightage is observed due to increased runoff and reduced recharge (Kumar et al., 2024).
4.3 Geology
Geological factors critically influence groundwater potential by affecting its storage, flow, and replenishment (Pandey and Purohit, 2022). In the Tarangambadi Taluk study area, four prominent geological formations were delineated: palaeo marine deposits, palaeo fluvial deposits, active marine deposits, and active fluvial deposits, each possessing unique lithological and stratigraphic characteristics that influence groundwater behavior (Figure 3c). Palaeo marine deposits, comprising 27.58% of the region, consist of ancient sediments primarily formed from compacted clays and silts, exhibiting limited groundwater potential due to their fine-grained composition and low permeability (Faria et al., 2022). Conversely, Palaeo Fluvial deposits, which are 18.97%, are characterized by well-sorted sands and gravels that enhance porosity and permeability, thus facilitating significant groundwater recharge and functioning as crucial aquifer units (Sahoo et al., 2024). Active marine deposits, representing 46.69% of the area, consist of silty sands with moderate permeability, leading to a low to moderate groundwater potential, while active fluvial deposits, despite their smaller coverage of 6.76%, demonstrate exceptional groundwater resource potential due to their high recharge capacity from unconsolidated materials (Sud et al., 2023). Figure 3c presents the geological map of the research area.
4.4 Soil
Soil properties are critical for evaluating groundwater potential, as they affect infiltration and recharge rates (Arunbose et al., 2021). The interrelationship between soil and groundwater potential is governed by soil texture, structure, and hydraulic properties that affect groundwater infiltration and recharge (Muniraj et al., 2020; Vellaikannu et al., 2021). The soil group is classified into four categories: Entisols, Inceptisols, Vertisols, and Pondicherry soils, each uniquely influencing groundwater processes, as displayed in Figure 3d. Entisols, constituting approximately 37.60% of the study area, are relatively immature soil exhibiting minimal profile development, predominantly sandy to loamy in texture, which allows for moderate infiltration and drainage (Sathiyamoorthy et al., 2023). Inceptisols, representing 17.56%, are more developed than entisols, typically situated on alluvial plains, possessing superior structure and porosity that enhance vertical percolation and groundwater recharge (Loganathan and Sathiyamoorthy, 2024). Vertisols, the predominant soil type at 44.71%, are distinguished by their high clay content and shrink-swell characteristics (Raj et al., 2024; Loganathan and Sathiyamoorthy, 2024). Finally, a negligible 0.13% of the area consists of Pondicherry soil, which is coastal and often saline.
4.5 Rainfall
Precipitation significantly influences the assessment of groundwater potential, serving as the principal contributor to aquifer recharge (Thirunavukkarasu and Ambujam, 2020; Raj et al., 2024). The replenishment of groundwater through rainfall is contingent upon precipitation levels, soil moisture deficits, interception losses, and potential evaporation rates (Siddi Raju et al., 2019). The magnitude and temporal extent of precipitation significantly influence infiltration capacity and recharge potential (Muniraj et al., 2020). Prolonged low-intensity rainfall enhances infiltration and recharge, whereas short-duration, high-intensity precipitation leads to increased surface runoff and diminished recharge (Muniraj et al., 2020; Senapati and Das, 2022). In the study zone, average annual rainfall varying from 886.6 mm to 1398 mm is shown in Figure 4a. The rainfall map was classified into five categories: 886.6–976 mm (18.59%), 977–1,089 mm (16.03%), 1,090–1,199 mm (16.37%), 1,200–1,300 mm (20.42%), and 1,301–1,398 mm (28.59%).
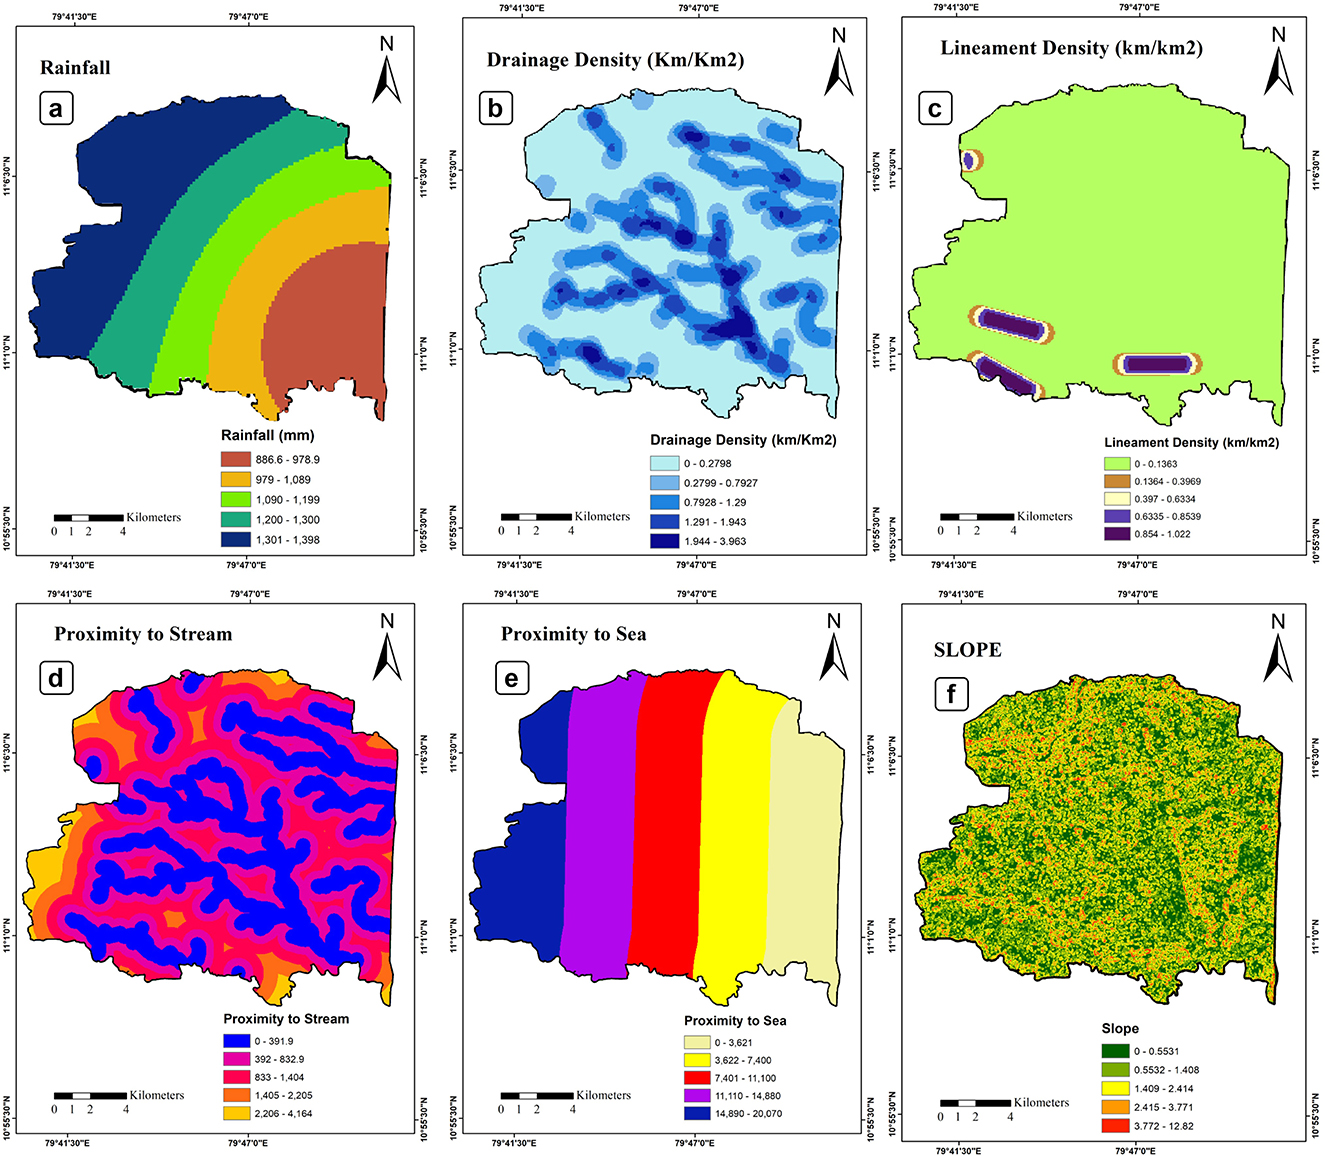
Figure 4. Thematic map of study area: (a) Rainfall; (b) Drainage Density (km/km2); (c) Lineament Density (km/km2); (d) Proximity to Stream; (e) Proximity to Sea; (f) Slope.
4.6 Drainage density
The drainage density is crucial for evaluating groundwater potential, indicating surface runoff relative to infiltration (Francis et al., 2024). In the studied region, drainage density is classified into five categories, each representing a unique correlation with groundwater recharge capability. Areas with high drainage density (1.994–3.963 km/km2) constitute 2.35% of the region. High drainage density suggests steep terrains and impermeable surfaces, which elevate surface runoff and diminish infiltration (Guduru and Jilo, 2022). Similarly, a zone with moderately high drainage density (1.292–1.943 km/km2) covers 8.65% and aligns with inadequate groundwater recharge due to increased runoff (Uc Castillo et al., 2022). Conversely, regions with very low drainage density (0–0.2798 km/km2), which comprise 54.05% of the area, are characterized by mild slopes and permeable materials that facilitate infiltration and aquifer recharge (Melese and Belay, 2022). Low drainage density zones (0.2799–0.7927 km/km2) cover 15.59% of the area, while moderate drainage density values (0.7928–1.29 km/km2) represent 19.36% of the study region. Figure 4b shows the spatial distribution of the drainage density map.
4.7 Lineament density
Various geological formations encompassing faults, fractures, joints, and dykes serve as fundamental elements for the quantification of lineaments (Kanagaraj et al., 2019). The geological configuration of the lithosphere profoundly affects hydrological flow in both surface and subsurface environments (Hussein et al., 2017). A distinct correlation exists between the lineament density and zones of groundwater potential, as the lineament density regulates the volume of surface water that infiltrates aquifers (Sathiyamoorthy et al., 2023). An area characterized by a heightened lineament length density signifies substantial groundwater potential, suggesting an augmentation in secondary porosity (Kumar et al., 2024). The majority (90%) of areas are viable locations associated with diminished lineament density values, as exemplified in Figure 4c.
4.8 Proximity to stream
Areas closer to the stream generally have higher recharge capacity because water infiltration is more extensive, and greater influence on groundwater levels (Popalzai et al., 2023). Flat terrain where the groundwater level is higher than in another region, especially if it's closer to a stream network (Faheem et al., 2023). Water near the stream spends less time traveling through the subsurface before reaching the water-bearing layers. In the research zone, the location near the stream, approximately 392 m away, is classified as a very high-potential area, accounting for 36%. The distance of 833 m is classified as high potential, with 32% of the area falling under this category. The remaining 21 and 8% of areas come under moderate and low potential, respectively. Figure 4d shows the proximity to stream of the study area.
4.9 Proximity to sea
The intrusion of the Sea can compromise the quality of groundwater and limit its availability in coastal zones (Prusty and Farooq, 2020). Due to the minimal inland topographical variation and the progressive rise in sea levels, low-lying coastal areas exhibit heightened susceptibility (Zamrsky et al., 2024). When evaluating groundwater potential, incorporating Proximity to Sea habitats as an essential factor significantly enhances the utility of GIS-oriented MCDA-AHP techniques (Alshehri et al., 2024). Distance to sea is a crucial factor for evaluating groundwater potential assessment in coastal areas (Bhawan Faridabad, 2014). The Distance from the Sea varies from 0 to 20,700 m, as shown in Figure 4e. It is classified into five categories: 0 to 3621 m is very close to the sea with the highest risk of seawater intrusion, followed by 3,622 m to 7,400 m, which has a moderate risk of seawater intrusion. Ranges that 41.45% of the area studied fall under the very high to high risk of seawater intrusion, which indirectly affects the potential areas.
4.10 Slope
The slope is one of the fundamental units of assessing groundwater potential because it directly affects the surface runoff and water level (Babu and Maury, 2025). A steep slope reduces water recharge, while a lower slope enhances recharge (Kumar et al., 2024). The slope has a positive correlation with surface runoff but a negative correlation with surface water infiltration and percolation (Ghosh, 2021). In areas that seep deeper into the earth, eventually raising groundwater levels. The slope ranges from 0 to 12.82 degrees, as shown in Figure 4f. In the study area, nearly 66% of the area contributes a high yield of groundwater potential, which is a more flat or plain surface. The remaining 21.52 and 12.48% have moderate and low yield capacity for groundwater potential, respectively.
4.11 TWI
The Topographic Wetness Index (TWI) is derived from the catchment area in conjunction with the terrain of slope, thereby yielding crucial insights into regions where water accumulation is probable (Hassaballa and Salih, 2024). TWI generally exhibits a gradient from minimal value in the areas characterized by adequate drainage (for instance, ridges and steep slopes) to elevated value in areas with inadequate drainage (such as valleys and flat plains) (Tripathi et al., 2025). The TWI values range from 4.881 to 22.07, as shown in Figure 5a, which is common in natural landscapes. The TWI values indicate that 65.9% of the area lies in a low potential area, and 16.39% of the area contributes to a high potential area. TWI is calculated using this Equation 4.
Where, As denoted as the area of boundary, and tan (β) represents a specific grid of local slope angle.
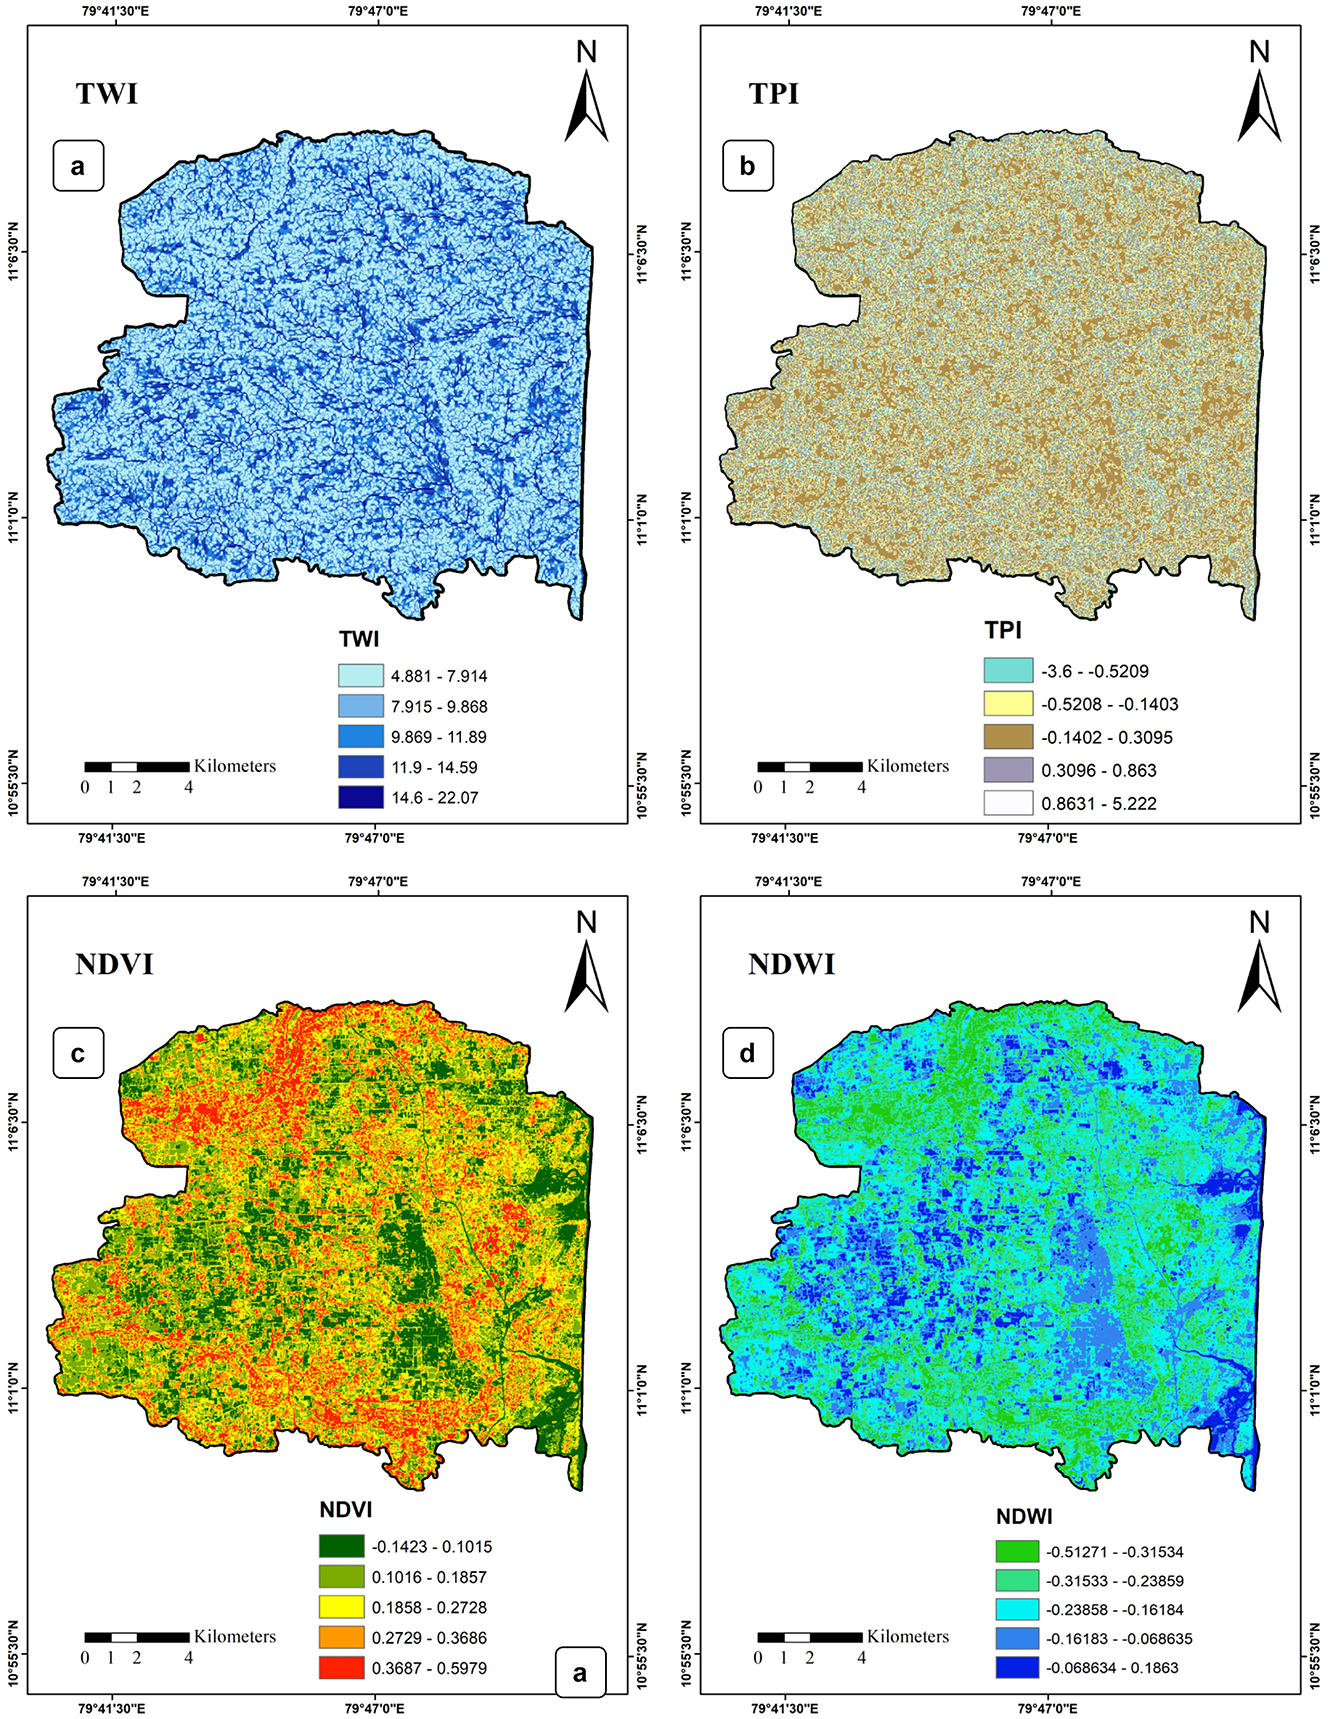
Figure 5. Thematic map of the study area: (a) TWI; (b) TPI; (c) NDVI; (d) NDWI.
4.12 TPI
The gradation of landforms at topographical slope sites is conventionally quantified and automated through the application of the Topographic Position Index (TPI) methodology (Fatema et al., 2023). Elevated TPI values characterize elevated terrains such as hilltops and ridges, whereas valleys and depressions exhibit diminished TPI values; conversely, flat or mid-slope areas are associated with values that approximate zero (Arulbalaji et al., 2019). Given their capacity to capture surface runoff and facilitate infiltration, thereby enhancing groundwater recharge, regions with low TPI values, such as valleys and flat terrains, are generally associated with increased groundwater potential (Pillai et al., 2023). The TPI value ranges from −3.6 to 5.222, shown in Figure 5b, with 35.82% of the area contributing high potential and 40% of the area being moderate, which has a near-zero value, representing a flat or plain terrain. Only 23.6% of the area has gentle ridges and peaks in the research area.
4.13 NDVI
The normalized difference vegetation index (NDVI) yields vital insights into the moisture levels in the soil and the coverage of vegetation, both of which greatly influence the areas marked as having potential groundwater resources (Ravindran et al., 2024). Furthermore, beyond groundwater availability, different factors that could influence vegetation robustness, including soil moisture levels and modifications in land use, might also affect the NDVI (Babu and Maury, 2025). The NDVI ranges from −0.1432 to 0.5979, as shown in Figure 5c. The NDVI classification shows that 46.7% of the areas contribute low potential yields, and 31.73% of the regions contribute high potential yields. NDVI was identified using Equation 5.
4.14 NDWI
Determining groundwater potential is contingent upon the Normalized Difference Water Index (NDWI), a calculation obtained through remote sensing technology that measures how much water is contained in terrestrial soil and vegetation (Borah and Bora, 2025). This approach proves particularly helpful in regions where the recharge of groundwater may be significantly influenced by the extent of vegetation cover (Sulle et al., 2023). To enhance the accuracy of groundwater potential, these factors have supplementary environmental and geographic variables. The NDWI ranges from −0.51 to 0.18 (Figure 5d), closer to the 0.186 value, and contributes directly to groundwater recharge, which contains more moisture content and 8.6% of the area. NDWI was determined by using Equation 6.
4.15 Coastal dynamics on groundwater potential
The incorporation of coastal dynamics provides a critical insight into the groundwater system of Tarangambadi Taluk. Regions situated in close proximity to sea environments and low-lying coastal geomorphic features were recognized as areas more susceptible to seawater intrusion and diminished recharge capacity. In contrast, inland coastal alluvial deposits and beach ridge formations demonstrate comparatively superior groundwater potential owing to conductive infiltration conditions. Through the integration of proximity to sea and coastal characteristics, the analysis underscores the extent to which the sea significantly influences and modifies the groundwater potential in coastal aquifers. This innovative focus on coastal dynamics serves to differentiate the current study from other inland groundwater potential studies and thereby augments the rigor of the identified zones.
4.16 Groundwater potential zones area
AHP methods assigned weights and ranks to fourteen thematic layers for the detection of the Groundwater Potential Zone (GWPZ). The layers were rasterised at a 30 * 30 m cell size and combined with weights and ranks using ArcGIS 10.8 (Abijith et al., 2020). The weighted overlay analysis's final output was generated by integrating all layers in the ArcGIS raster calculator, categorizing results into five very low, low, moderate, high, and very high) to create the GWPZ map. The delineated Groundwater Potential Zone (GWPZ) Map, displayed in Figure 6, offers a visual representation of the spatial heterogeneity concerning groundwater resources throughout the study region (Dar et al., 2021). Table 6 delineates the categorization of the research area according to groundwater potential and the associated spatial extent of each classification. Very high potential zones constitute 26.52% of the total area (74.51 km2), primarily dominating the western and southwestern regions of the study area, which exhibit advantageous hydrogeological conditions such as floodplains, active fluvial deposits, and low-gradient agricultural terrains. These regions are characterized by elevated infiltration rates and permeable soils, which are conducive to groundwater recharge. High potential zones encompass 25.30% (71.09 km2). This is particularly evident within the central corridor areas, which demonstrate moderate to high recharge potential. These zones may overlap with agricultural lands or geomorphological features such as coastal plains that possess sufficient permeability.
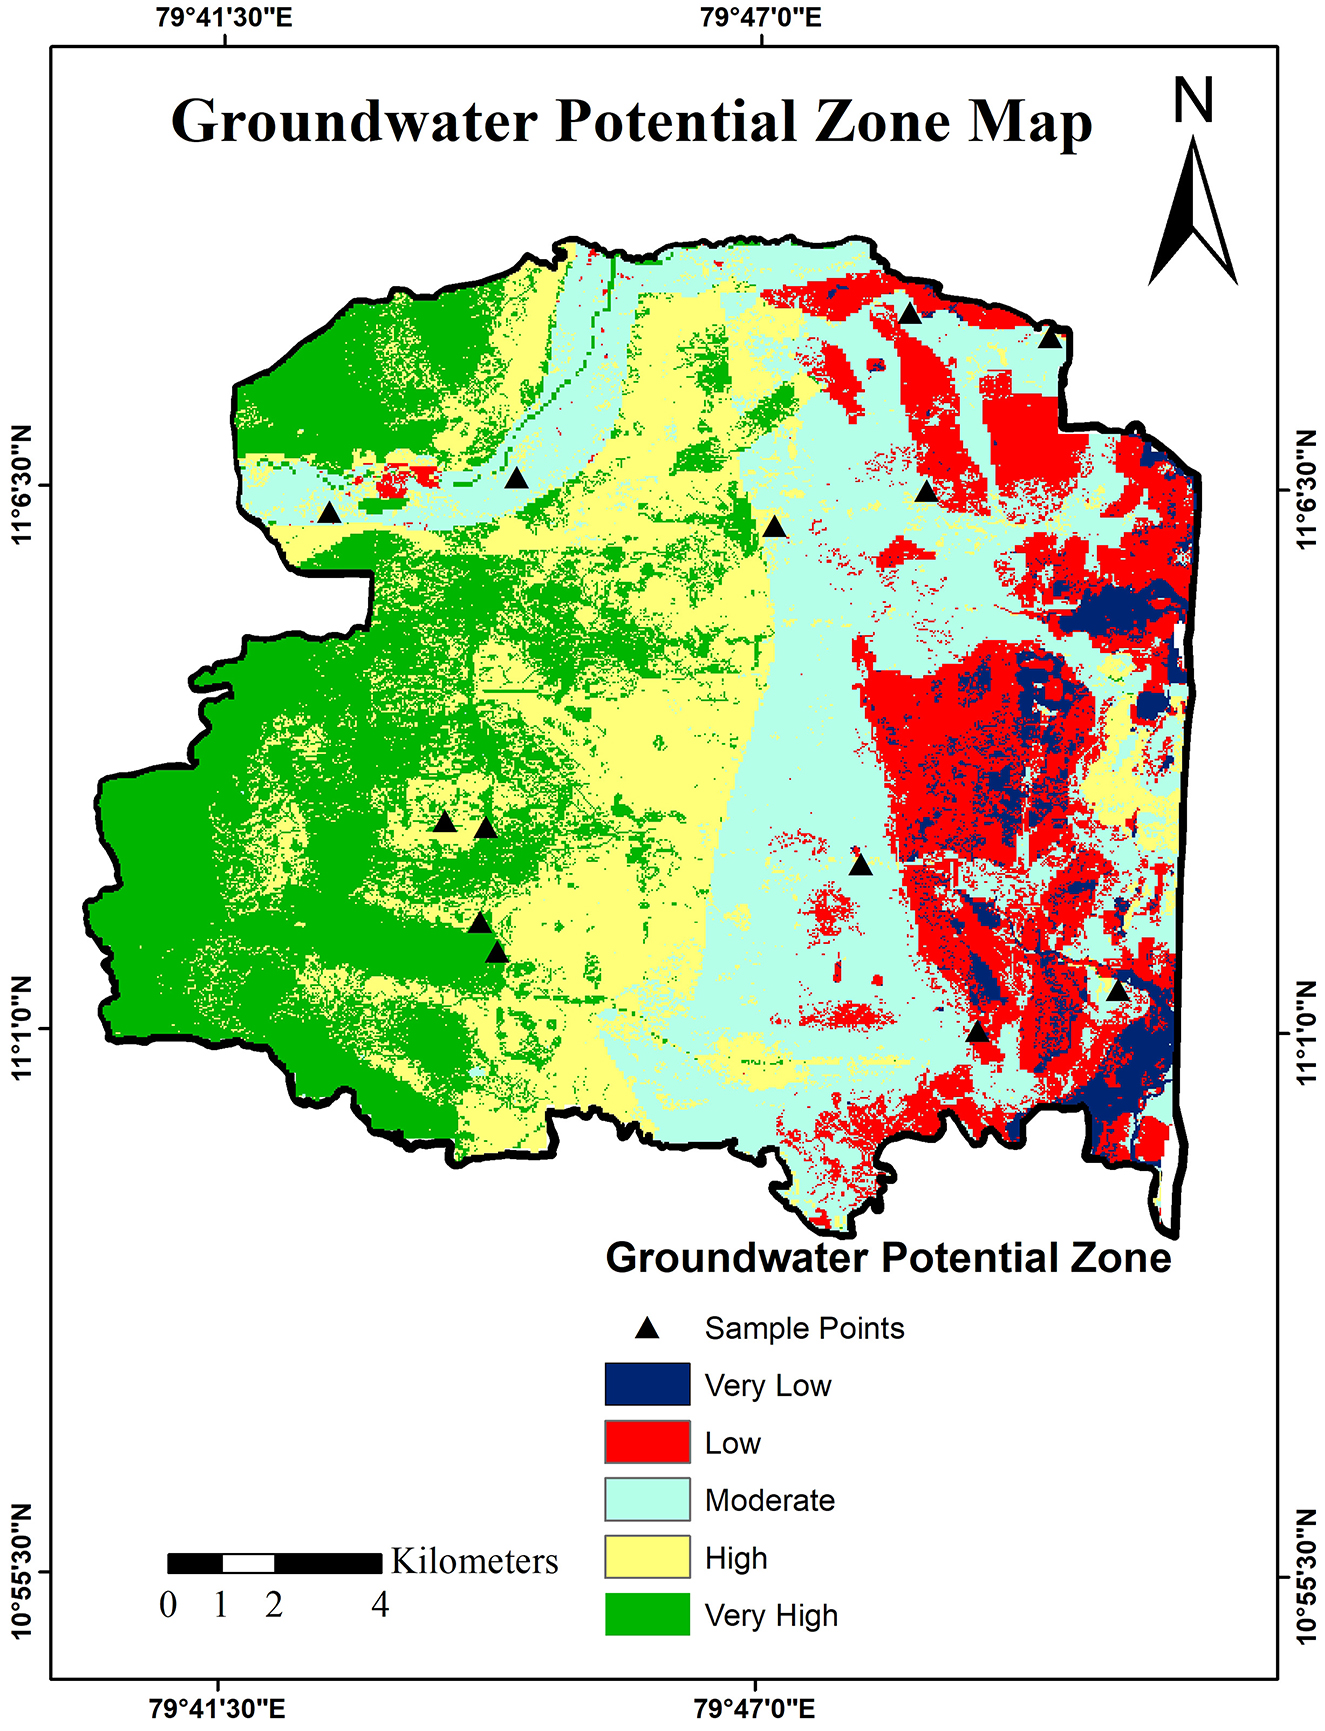
Figure 6. Groundwater Potential Zone Map of Tarangambadi Taluk.
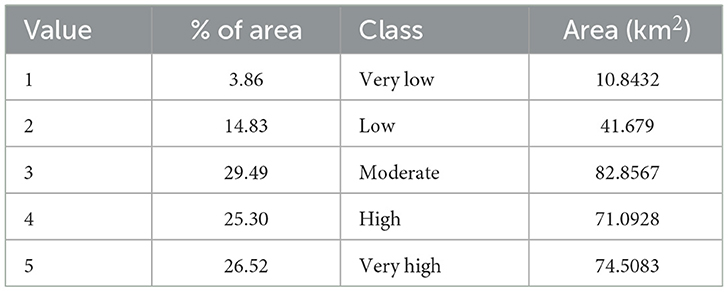
Table 6. Groundwater potential area.
Moderate Potential zones represent the most significant proportion, spanning 29.49% (82.86 km2). These zones constitute the central spine and portions of the northern area, typifying transitional regions with a blend of moderate infiltration capacities and drainage characteristics. These areas may include diverse geomorphic units such as coastal plains and soils with moderate drainage. Low and Very Low zones collectively account for 18.69% of the study area (52.52 km2), primarily concentrated in the eastern and southeastern regions, particularly in Proximity to the coastline. These zones are predominantly characterized by impervious formations, urbanized surfaces, or salt-affected soils (e.g., paleo-marine deposits), which hinder infiltration. Furthermore, the Proximity to Sea may pose a risk of saline intrusion, rendering these zones vulnerable and less appropriate for groundwater extraction without the implementation of desalination or recharge facilities.
This distribution indicates that over 50% of the study area demonstrates high to very high groundwater potential, presenting opportunities for sustainable groundwater development. However, areas with low and very low potential necessitate careful management for extraction, warranting the implementation of recharge strategies to enhance their viability.
4.17 Accuracy assessment of the model
Validation ascertains the GWPZ map's accurate representation of groundwater potential, which is imperative for sustainable resource management (Mihret and Wuletaw, 2025). A rigorously validated GWPZ map facilitates informed decision-making by supplying reliable data for conservation and utilization strategies (Duguma and Duguma, 2022). The validation datasets were procured from the State Ground and Surface Water Resources Data Centre, Tamil Nadu, covering the period from January 1991 to December 2024, with monthly records for each well. For validation purposes, we used the 34-year average annual water level for each well. This approach integrates both seasonal (pre-monsoon and post-monsoon) and interannual variability into a single representative value. By utilizing long-term averages, the validation outcomes are rendered less susceptible to the effects of anomalous wet or dry years, consequently providing a more robust foundation for comparison with the anticipated groundwater potential zones. To ensure GWPZ accuracy, data from 13 dug wells and Tube wells were cross-validated. Actual water levels from study area wells were compared to predicted groundwater potential index values for consistency (Loganathan and Sathiyamoorthy, 2024). To evaluate groundwater availability, long-term average water levels from the validated observation wells in Tarangambadi Taluk were categorized into High, Medium, and Low Potential. This classification utilized the equal interval method, based on water levels ranging from 2.36 to 14.21 mbgl (measured in meters below groundwater level, mbgl). High Groundwater Potential zones are categorized by shallow water levels (2.36–6.31 mbgl), signifying favorable groundwater access and enhanced recharge capacity. Medium Groundwater Potential areas range from 6.32–10.26 mbgl, indicating intermediate water table depths. Low Groundwater Potential zones, with depths of 10.27–14.21 mbgl, denote deeper water tables and possible limitations in recharge or risks of over-extraction. Most wells (10 out of 13) exhibited High Potential, reflecting prevalent shallow water levels and robust recharge conditions. The validation of the groundwater potential map accuracy was conducted through observed groundwater level data, with the findings encapsulated in Table 7. A strong correlation was observed in 10 out of 13 wells between actual groundwater conditions and predicted potential classes, with three wells showing discrepancies.
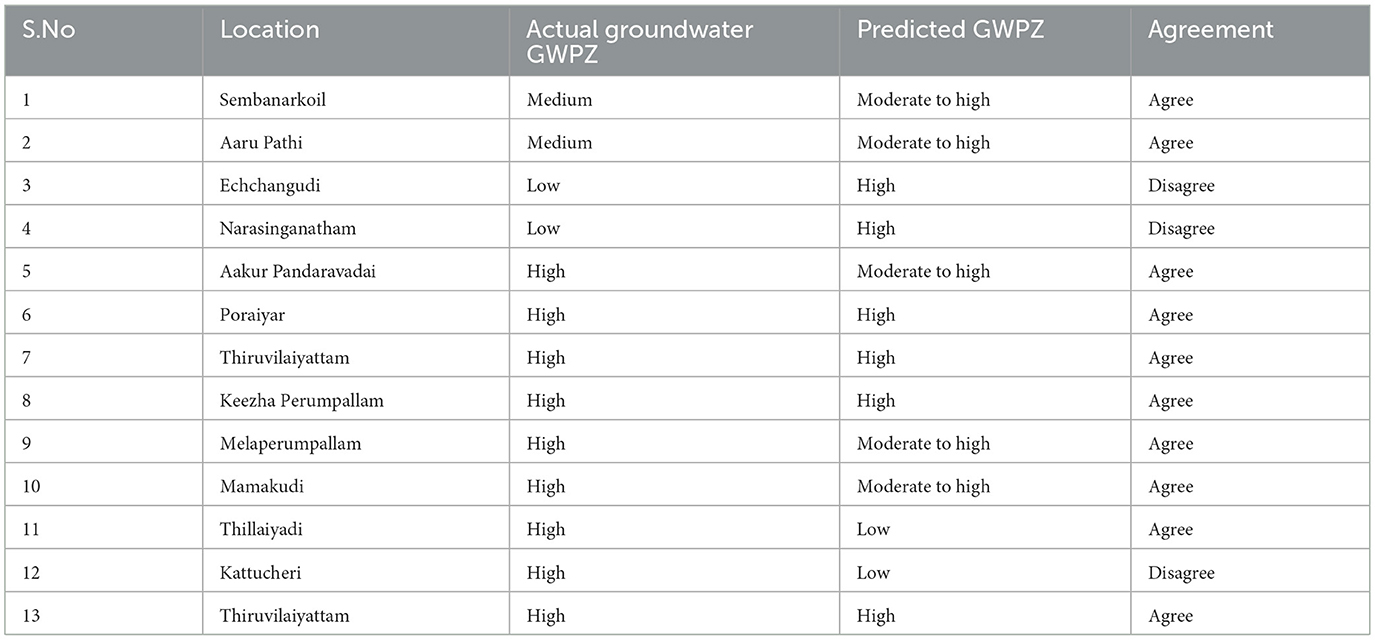
Table 7. Assessment of groundwater potential validation.
Total Wells count = 13
actual groundwater level data and predicted, same agreement, wells count = 10
actual groundwater level data and predicted, varying agreement, wells count = 3
groundwater potential accuracy = (10/13) * 100 = 76.9%.
The accuracy of the GWPZ map was determined to be 76.92%. The findings point out the effectiveness of integrating the Analytical Hierarchy Process (AHP), Remote Sensing (RS), and Geographic Information System (GIS) for accurately assessing groundwater prospects in coastal agricultural sectors, including Tarangambadi Taluk.
5 Conclusion
The delineation of Groundwater Potential Zones (GWPZ) in Tarangambadi Taluk using GIS, remote sensing, and AHP techniques has effectively assessed groundwater resources. The evaluation of hydrogeological and terrain parameters facilitated the creation of a reliable groundwater potential map through pairwise comparison and overlays. Using weighted overlay analysis, the GWPZ map classified the region into five zones, which are very low, low, moderate, high, and very high. The regions that are in the very low and low potential zones represent 3.86% and 14.83% of the area, respectively. The percentage of the total areas that are in the moderate, high, and very high potential zones are 29.49%, 25.30%, and 26.52%, respectively. About 51.82% (145.59 km2) of the land is categorized as having high to very high potential, particularly in regions with favorable conditions for aquifer storage. These zones are ideal for planning irrigation and groundwater supply systems. Conversely, 18.69% (62.52km2) of the area is identified as low to very low potential zones, primarily along coastal areas facing geological and urbanization challenges. The map of groundwater potential has a significant correlation with actual groundwater level, which shows that 76.92% accuracy of the model. To mitigate these issues, implementing artificial recharge structures is not only essential for improving groundwater recharge in these regions and site-specific interventions like tank rejuvenation and efficient irrigation methods can strengthen groundwater sustainability. This study's innovative aspect is its focus on coastal dynamics, necessitating a dual approach to enhance recharge and prevent seawater intrusion. The inclusion of Proximity to the sea as a criterion enhances the map's reliability, validated by field groundwater level data. The research outputs inform sustainable groundwater extraction and conservation, aiding hydrological modeling and climate resilience planning. Future research could integrate remote sensing trends, climate data, and machine learning to develop a dynamic groundwater risk and opportunity model.
Data availability statement
The raw data supporting the conclusions of this article will be made available by the authors, without undue reservation.
Author contributions
RM: Conceptualization, Data curation, Methodology, Software, Visualization, Writing – original draft. MS: Investigation, Supervision, Validation, Writing – review & editing.
Funding
The author(s) declare that no financial support was received for the research and/or publication of this article.
Conflict of interest
The authors declare that the research was conducted in the absence of any commercial or financial relationships that could be construed as a potential conflict of interest.
Generative AI statement
The author(s) declare that no Gen AI was used in the creation of this manuscript.
Any alternative text (alt text) provided alongside figures in this article has been generated by Frontiers with the support of artificial intelligence and reasonable efforts have been made to ensure accuracy, including review by the authors wherever possible. If you identify any issues, please contact us.
Publisher's note
All claims expressed in this article are solely those of the authors and do not necessarily represent those of their affiliated organizations, or those of the publisher, the editors and the reviewers. Any product that may be evaluated in this article, or claim that may be made by its manufacturer, is not guaranteed or endorsed by the publisher.
Abbreviations
AHP, Analytical Hierarchy Process; CI, Consistency Ratio; CR, Consistency Index; DEM, Digital Elevation Model; GIS, Geographic Information Systems; GSI, Geological Survey of India; GWPI, Groundwater Potential Index; GWPZ, Groundwater Potential Zone; LULC, Land Use Land Cover; MCDA, Multi-Criteria Decision-Making; NBSS & LUP, National Bureau of Soil Survey and Land Use Planning; NDVI, Normalized Difference Vegetation Index; NDWI, Normalized Difference Water Index; NPCM, Normalized Pairwise Comparison Matrix; RI, Random Consistency Index; RS, Remote Sensing; SDG, Sustainable Development Goal; SRTM, Shuttle Radar Topography Mission; TPI, Topographic Position Index; TWI, Topographic Wetness Index; WOA, Weighted Overlay Analysis.
References
Abijith, D., Saravanan, S., Singh, L., Jennifer, J. J., Saranya, T., and Parthasarathy, K. S. S. (2020). GIS-based multi-criteria analysis for identification of potential groundwater recharge zones - a case study from Ponnaniyaru watershed, Tamil Nadu, India. HydroResearch 3, 1–14. doi: 10.1016/j.hydres.2020.02.002
Aladejana, O. O., Anifowose, A. Y. B., and Fagbohun, B. J. (2016). Testing the ability of an empirical hydrological model to verify a knowledge-based groundwater potential zone mapping methodology. Model Earth Syst. Environ. 2, 1–17. doi: 10.1007/s40808-016-0234-3
Alshehri, F., Abd El-Hamid, H. T., and Mohamed, A. (2024). Mapping coastal groundwater potential zones using remote sensing based AHP model in Al Qunfudhah region along Red Sea, Saudi Arabia. Heliyon 10:e28186. doi: 10.1016/j.heliyon.2024.e28186
Anteneh, Z. L., Alemu, M. M., Bawoke, G. T., Kehali, A. T., Fenta, M. C., and Desta, M. T. (2022). Appraising groundwater potential zones using geospatial and multi-criteria decision analysis (MCDA) techniques in Andasa-Tul watershed, Upper Blue Nile basin, Ethiopia. Environ. Earth Sci. 81:14. doi: 10.1007/s12665-021-10083-0
Arabameri, A., Rezaei, K., Cerda, A., Lombardo, L., and Rodrigo-Comino, J. (2019). GIS-based groundwater potential mapping in Shahroud plain, Iran. A comparison among statistical (bivariate and multivariate), data mining and MCDM approaches. Sci. Total Environ. 658, 160–177. doi: 10.1016/j.scitotenv.2018.12.115
Arulbalaji, P., Padmalal, D., and Sreelash, K. (2019). GIS and AHP techniques based delineation of groundwater potential zones: a case study from Southern Western Ghats, India. Sci Rep 9:2082. doi: 10.1038/s41598-019-38567-x
Arunbose, S., Srinivas, Y., Rajkumar, S., Nair, N. C., and Kaliraj, S. (2021). Remote sensing, GIS and AHP techniques based investigation of groundwater potential zones in the Karumeniyar river basin, Tamil Nadu, southern India. Groundw. Sustain. Dev. 14:100586. doi: 10.1016/j.gsd.2021.100586
Babu, P., and Maury, S. C. (2025). Comparative analysis of groundwater potential assessment in Dharmapuri District, Tamil Nadu, India. Appl. Water Sci. 15, 1–21. doi: 10.1007/s13201-025-02402-8
Berhanu, K. G., and Hatiye, S. D. (2020). Identification of groundwater potential zones using proxy data: case study of Megech Watershed, Ethiopia. J. Hydrol. Reg. Stud. 28:100676. doi: 10.1016/j.ejrh.2020.100676
Bhawan Faridabad, B. (2014). Government of India, Ministry of Water Resources, Central Ground Water Board Report on the Status of Groundwater Quality in Coastal Aquifers of India.
Borah, D., and Bora, A. K. (2025). Unleashing the untapped potential: groundwater exploration in a watershed environment of North-East India using MCDA and AHP Techniques. Hydrol. Process 39. doi: 10.1002/hyp.70040
Boughariou, E., Allouche, N., Ben Brahim, F., Nasri, G., and Bouri, S. (2021). Delineation of groundwater potentials of Sfax region, Tunisia, using fuzzy analytical hierarchy process, frequency ratio, and weights of evidence models. Environ. Dev. Sustain. 23, 14749–14774. doi: 10.1007/s10668-021-01270-x
Cabrera, E. Jr, Cobacho, R., Estruch, V., and Aznar, J. (2011). Analytical hierarchical process (AHP) as a decision support tool in water resources management. J. Water Supply Res. Tech. Aqua. 60, 343–351. doi: 10.2166/aqua.2011.016
Central Groundwater Board (2024). Government of India, Department of Water Resources, River Development and Ganga Rejuvenation.
Dange, S., Arumugam, K., and Vijayaraghavalu, S. S. (2025). Unlocking Vellore's water future: Integrated hydrogeochemical research aligns with SDGs 6, 12, and 13. Results Eng 25:103852. doi: 10.1016/j.rineng.2024.103852
Dar, T., Rai, N., and Bhat, A. (2021). Delineation of potential groundwater recharge zones using analytical hierarchy process (AHP). Geol. Ecol. Lands. 5, 292–307. doi: 10.1080/24749508.2020.1726562
Díaz-Alcaide, S., and Martínez-Santos, P. (2019). Review: advances in groundwater potential mapping. Hydrogeol. J. 27, 2307–2324. doi: 10.1007/s10040-019-02001-3
Dist, M., and Mondal, B. (2017). Mapping of groundwater recharge-zones for coastal aquifers using remote sensing and GIS: an exemplar from the saline belt of Contai subdivision of Purba. Available online at: https://www.researchgate.net/publication/344884966 (Accessed November, 2017).
Doke, A. B., Zolekar, R. B., Patel, H., and Das, S. (2021). Geospatial mapping of groundwater potential zones using multi-criteria decision-making AHP approach in a hardrock basaltic terrain in India. Ecol. Indic. 127:107685. doi: 10.1016/j.ecolind.2021.107685
Duguma, T. A., and Duguma, G. A. (2022). Assessment of groundwater potential zones of Upper Blue Nile River Basin using multi-influencing factors under gis and rs environment: a case study on guder Watersheds, Abay Basin, Oromia Region, Ethiopia. Geofluids 2022, 1–26. doi: 10.1155/2022/1172039
Elubid, B. A., Huang, T., Peng, D.-P., Ahmed, E. H., and Babiker, M. M. (2020). Delineation of groundwater potential zones using integrated remote sensing, GIS and multi-criteria decision making (MCDM). Desalination Water Treat 192, 248–258. doi: 10.5004/dwt.2020.25761
Faheem, H., Khattak, Z., Islam, F., Ali, R., Khan, R., Khan, I., et al. (2023). Groundwater potential zone mapping using geographic information systems and multi-influencing factors: A case study of the Kohat District, Khyber Pakhtunkhwa. Front. Earth Sci. 11. doi: 10.3389/feart.2023.1097484
Faria, M. J., Ximenes, M., da C. Amaral, J. S., and da Silva, A. (2022). An Overview of the Geological Control on Groundwater Potential in Lacamutu River, Alaua Kraik Area, Baucau Municipality, Timor-Leste. J. Water Resour. Prot. 14, 680–697. doi: 10.4236/jwarp.2022.1410036
Fatema, K., Joy, M. A. R., Amin, F. M. R., and Sarkar, S. K. (2023). Groundwater potential mapping in Jashore, Bangladesh. Heliyon 9:e13966. doi: 10.1016/j.heliyon.2023.e13966
Francis, V., Krishnaraj, S., Kumar, S., Andiyappan, R. K., and Govindan, P. (2024). GIS-based groundwater potential zonation and assessment of groundwater quality and suitability for drinking and irrigation purposes in the Shanmughanadhi river basin, south India. Kuwait J. Sci. 51:100243. doi: 10.1016/j.kjs.2024.100243
Galo, A. (2017). Analytical hierarchy process as a decision-making model. Eur. J. Multidisc. Stud. 4:106. doi: 10.26417/ejms.v4i2.p106-112
Gandhi, F., Songara, J., Prakash, I., and Altuwaijri, H. A. (2024). Comparative Assessment of Analytical Hierarchy Process (AHP) and Fuzzy Overlay Analysis (FOA) Models in Groundwater Potential Zone Mapping Using Sensitive Analysis: A GIS-RS Integrated Approach. doi: 10.21203/rs.3.rs-4368423/v1
Ghosh, B. (2021). Spatial mapping of groundwater potential using data-driven evidential belief function, knowledge-based analytic hierarchy process and an ensemble approach. Environ. Earth Sci. 80:625. doi: 10.1007/s12665-021-09921-y
Golkarian, A., Naghibi, S. A., Kalantar, B., and Pradhan, B. (2018). Groundwater potential mapping using C5.0, random forest, and multivariate adaptive regression spline models in GIS. Environ. Monit. Assess 190:140. doi: 10.1007/s10661-018-6507-8
Guduru, J. U., and Jilo, N. B. (2022). Groundwater potential zone assessment using integrated analytical hierarchy process-geospatial driven in a GIS environment in Gobele watershed, Wabe Shebele river basin, Ethiopia. J. Hydrol. Reg. Stud. 44:101218. doi: 10.1016/j.ejrh.2022.101218
Hassaballa, A., and Salih, A. (2024). Mapping Groundwater Potential (GWP) in the Al-Ahsa Oasis, Eastern Saudi Arabia using data-driven GIS techniques. Water 16:194. doi: 10.3390/w16020194
Hayer, Y. V., Nama, A. N., and Fallo, D. A. (2023). Mapping Groundwater Potential Zone Based On Remote Sensing And GIS Using Analytical Hierarchy Process (AHP) In Tana Righu, West Sumba, Indonesia. JUTEKS - Jurnal Teknik Sipil 8:80. doi: 10.32511/juteks.v8i2.1017
Howari, H., Parvez, M., Khan, O., Alhodaib, A., Mallah, A., and Yahya, Z. (2023). Multi-objective optimization for ranking waste biomass materials based on performance and emission parameters in a pyrolysis process—An AHP–TOPSIS approach. Sustainability 15:3690. doi: 10.3390/su15043690
Hussein, A.-A., Govindu, V., and Nigusse, A. G. M. (2017). Evaluation of groundwater potential using geospatial techniques. Appl. Water Sci 7, 2447–2461. doi: 10.1007/s13201-016-0433-0
Jarrah, R., Chen, C.-R., and Kassem, M. (2022). Ranking structural analysis software applications using AHP and Shannon's entropy. J. Asian Architect. Build. Eng. 21, 900–907. doi: 10.1080/13467581.2021.1900858
Jebaraj, S. P., and Rajagopal, V. (2024). MIF and AHP methods for delineation of groundwater potential zones using remote sensing and GIS techniques in Tirunelveli, Tenkasi District, India. Open Geosci. 16. doi: 10.1515/geo-2022-0619
Kadiri, M., Zarhloule, Y., Barkaoui, A., and Ourarhi, S. (2023). Identification of potential artificial groundwater recharge sites using GIS and the analytical hierarchy process: case study of Tamellalt plain, Morocco. Hydrogeol. J. 31, 1813–1828. doi: 10.1007/s10040-023-02701-x
Kanagaraj, G., Suganthi, S., Elango, L., and Magesh, N. S. (2019). Assessment of groundwater potential zones in Vellore district, Tamil Nadu, India using geospatial techniques. Earth Sci. Inform 12, 211–223. doi: 10.1007/s12145-018-0363-5
Kandakoglu, A., Frini, A., and Ben Amor, S. (2019). Multicriteria decision making for sustainable development: a systematic review. J. Multi-Criteria Decision Anal. 26, 202–251. doi: 10.1002/mcda.1682
Khan, Z., Mohsin, M., Ali, S. A., Vashishtha, D., Husain, M., Parveen, A., et al. (2024). Comparing the performance of machine learning algorithms for groundwater mapping in Delhi. J. Indian Soc. Remote Sens. 52, 17–39. doi: 10.1007/s12524-023-01789-8
Kumar, M., Singh, P., and Singh, P. (2024). Analytical hierarchy process and geospatial techniques for delineation of groundwater potential zones in Bundelkhand Craton Region, India. Appl. Geomat. 16, 973–986. doi: 10.1007/s12518-024-00592-5
Kumar, R., Dwivedi, S. B., and Gaur, S. (2021). A comparative study of machine learning and Fuzzy-AHP technique to groundwater potential mapping in the data-scarce region. Comput. Geosci. 155:104855. doi: 10.1016/j.cageo.2021.104855
Letz, O., Siebner, H., Avrahamov, N., Egozi, R., Eshel, G., and Dahan, O. (2021). The impact of geomorphology on groundwater recharge in a semi-arid mountainous area. J. Hydrol. 603:127029. doi: 10.1016/j.jhydrol.2021.127029
Loganathan, S., and Sathiyamoorthy, M. (2024). Demarcation of groundwater potential zones in Ponnai sub-basin, Southern India using remote sensing, GIS and fuzzy-AHP approaches. Water Supply 24, 1529–1545. doi: 10.2166/ws.2024.084
Melese, T., and Belay, T. (2022). Groundwater Potential Zone Mapping Using Analytical Hierarchy Process and GIS in Muga Watershed, Abay Basin, Ethiopia. Global Chall. 6:2100068. doi: 10.1002/gch2.202100068
Mihret, B., and Wuletaw, A. (2025). The impact of geological structures on groundwater potential assessment in volcanic rocks of the Northwestern Ethiopian Plateau: A Review. doi: 10.5194/egusphere-2024-4201
Muniraj, K., Jesudhas, C. J., and Chinnasamy, A. (2020). Delineating the Groundwater Potential Zone in Tirunelveli Taluk, South Tamil Nadu, India, Using Remote Sensing, Geographical Information System (GIS) and Analytic Hierarchy Process (AHP) Techniques. Proceed. Nat. Acad. Sci. India Sec. Phys. Sci. 90, 661–676. doi: 10.1007/s40010-019-00608-5
Muthu, K., and Sudalaimuthu, K. (2021). Integration of Remote sensing, GIS, and AHP in demarcating groundwater potential zones in Pattukottai Taluk, Tamilnadu, India. Arab. J. Geosci. 14:1748. doi: 10.1007/s12517-021-08110-2
Narendra, K., Rao, K. N., and Latha, P. S. (2013). Integrating remote sensing and GIS for identification of groundwater prospective zones in the Narava Basin, Visakhapatnam Region, Andhra Pradesh. J. Geol. Soc. India 81, 248–260. doi: 10.1007/s12594-013-0028-4
Nazir, J., Ali, M., Sarwar, A., Khan, S., Rehman, K., Fahim, B., et al. (2024). Delineation and validation of GIS-based groundwater potential zones under arid to semi-arid environment using multi-influence-factors approach. Geol. Ecol. Landsc. 1–17. doi: 10.1080/24749508.2024.2392382
Osinowo, O. O., and Arowoogun, K. I. (2020). A multi-criteria decision analysis for groundwater potential evaluation in parts of Ibadan, southwestern Nigeria. Appl. Water Sci. 10:228. doi: 10.1007/s13201-020-01311-2
Ostovari, Y., Beigi-Harchegani, H., and Asgari, K. (2015). A fuzzy logic approach for assessment and mapping of groundwater irrigation quality: a case study of Marvdasht aquifer, Iran. Arch. Agron. Soil Sci. 61, 711–723. doi: 10.1080/03650340.2014.946020
Pandey, A., and Purohit, R. (2022). Impact of geological controls on change in groundwater potential of recharge zones due to watershed development activities, using integrated approach of RS and GIS. J. Sci. Res. 66, 53–62. doi: 10.37398/JSR.2022.660106
Pandey, A., Purohit, R., and Sharma, D. (2022). Application of RS and GIS to capture the interplay of geological units and watershed development activities: implications on change in groundwater potential with reference to anjeni micro-watershed. J. Geo. Soc. India 98, 961–970. doi: 10.1007/s12594-022-2101-3
Patidar, R., Santosh, Pingale, M., and Khare, D. (2021). An integration of geospatial and machine learning techniques for mapping groundwater potential: a case study of the Shipra river basin, India. doi: 10.1007/s12517-021-07871-0/Published
Pillai, K. S., Sneha, M. L., Aiswarya, S., Anand, A. B., Prasad, G., and Jayadev, A. (2023). Unlocking hidden water resources: mapping groundwater potential zones using GIS and remote sensing in Kerala, India. E3S Web Conf. 405:04021. doi: 10.1051/e3sconf/202340504021
Popalzai, A., Ahmadi, H., Rahmani, A. B., and Pekkan, E. (2023). Delineation of groundwater potential zones using multi-criteria decision analysis: the case of Balkh Province, Northern Afghanistan. MDPI 87:41. doi: 10.3390/iecg2022-14817
Prasad, P., Loveson, V. J., Kotha, M., and Yadav, R. (2020). Application of machine learning techniques in groundwater potential mapping along the west coast of India. GIsci Remote Sens. 57, 735–752. doi: 10.1080/15481603.2020.1794104
Prusty, P., and Farooq, S. H. (2020). Seawater intrusion in the coastal aquifers of India - A review. HydroResearch 3, 61–74. doi: 10.1016/j.hydres.2020.06.001
Raj, S., Rawat, K. S., Singh, S. K., and Mishra, A. K. (2024). Groundwater potential zones identification and validation in Peninsular India. Geol. Ecol. Lands. 8, 86–100. doi: 10.1080/24749508.2022.2097375
Ramasubramanian, S., Ravindran, A., Abishek, S. R., Christinal, J., Kingston, J. V., Promilton, A. A. A., et al. (2025). An application of remote sensing and GIS used in groundwater potential zones for sustainable urban development in coastal areas between Chettikulam and Kolachal, southern India. Appl. Geomat. doi: 10.1007/s12518-024-00604-4
Ravindran, A. A., Promilton, A. A. A., Kingston, J. V., Abishek, S. R., Abinaya, R., and Sakthi Priya, R. (2024). Multicriteria analysis of groundwater potential in Valliyur region, Tamil Nadu: integrating remote sensing, GIS, and analytical hierarchy process. Water Cons. Sci. Eng. 9:53. doi: 10.1007/s41101-024-00285-5
Saaty, R. W. (1987). The analytic hierarchy process—what it is and how it is used. Mathemat. Model. 9, 161–176. doi: 10.1016/0270-0255(87)90473-8
Saaty, T. L. (1977). A scaling method for priorities in hierarchical structures. J. Math. Psychol. 15, 234–281. doi: 10.1016/0022-2496(77)90033-5
Saaty, T. L. (1980). Marketing applications of the analytic hierarchy process. Manage. Sci. 26, 641–658.
Saha, S., Gayen, A., Mukherjee, K., Pourghasemi, H. R., and Santosh, M. (2021). Spatial Prediction of Groundwater Potentiality Mapping Using Machine Learning Algorithms. doi: 10.21203/rs.3.rs-303246/v1
Sahoo, A., Subhadarshini, R., and Baliarsingh, F. (2024). Mapping of groundwater potential zones of Khordha District using GIS and AHP approaches. Clean. Water 1:100015. doi: 10.1016/j.clwat.2024.100015
Salem, A., Abduljaleel, Y., Dezso, J., and Lóczy, D. (2023). Integrated assessment of the impact of land use changes on groundwater recharge and groundwater level in the Drava floodplain, Hungary. Sci. Rep. 13:5061. doi: 10.1038/s41598-022-21259-4
Saravanan, S., Saranya, T., Jennifer, J. J., Singh, L., Selvaraj, A., and Abijith, D. (2020). Delineation of groundwater potential zone using analytical hierarchy process and GIS for Gundihalla watershed, Karnataka, India. Arab. J. Geosci. 13:695. doi: 10.1007/s12517-020-05712-0
Sathiyamoorthy, M., Masilamani, U. S., Chadee, A. A., Golla, S. D., Aldagheiri, M., Sihag, P., et al. (2023). Sustainability of groundwater potential zones in coastal areas of Cuddalore District, Tamil Nadu, South India Using Integrated Approach of Remote Sensing, GIS and AHP Techniques. Sustainability 15:5339. doi: 10.3390/su15065339
Selvam, S., Dar, F. A., Magesh, N. S., Singaraja, C., Venkatramanan, S., and Chung, S. Y. (2016). Application of remote sensing and GIS for delineating groundwater recharge potential zones of Kovilpatti Municipality, Tamil Nadu using IF technique. Earth Sci Inform 9, 137–150. doi: 10.1007/s12145-015-0242-2
Senapati, U., and Das, T. K. (2022). GIS-based comparative assessment of groundwater potential zone using MIF and AHP techniques in Cooch Behar district, West Bengal. Appl. Water Sci. 12:43. doi: 10.1007/s13201-021-01509-y
Senthilkumar, M., Gnanasundar, D., and Arumugam, R. (2019). Identifying groundwater recharge zones using remote sensing & GIS techniques in Amaravathi aquifer system, Tamil Nadu, South India. Sustain. Environ. Res. 29:15. doi: 10.1186/s42834-019-0014-7
Shandu, I. D., and Atif, I. (2023). An integration of geospatial modelling and machine learning techniques for mapping groundwater potential Zones in Nelson Mandela Bay, South Africa. Water 15:3447. doi: 10.3390/w15193447
Siddi Raju, R., Sudarsana Raju, G., and Rajasekhar, M. (2019). Identification of groundwater potential zones in Mandavi River basin, Andhra Pradesh, India using remote sensing, GIS and MIF techniques. HydroResearch 2, 1–11. doi: 10.1016/j.hydres.2019.09.001
Siddik, M. S., Tulip, S. S., Rahman, A., Islam, Md. N., Haghighi, A. T., and Mustafa, S. M. T. (2022). The impact of land use and land cover change on groundwater recharge in northwestern Bangladesh. J. Environ. Manage. 315:115130. doi: 10.1016/j.jenvman.2022.115130
Sridhar, N., Poongothai, S., and Ravisankar, N. (2014). Spatial Analysis of Groundwater Quality for Tarangabadi Taluk, Nagappatinam District, Tamilnadu using GIS. Available online at: https://api.semanticscholar.org/CorpusID:131616325 (Accessed September, 2014).
Sud, A., Kanga, R., Singh, S. K., Meraj, G., Kanga, S., Kumar, P., et al. (2023). Simulating groundwater potential zones in mountainous Indian Himalayas—a case study of Himachal Pradesh. Hydrology 10:65. doi: 10.3390/hydrology10030065
Sulle, B. A. C., Sunaryo, D. K., and Yulianandha, A. (2023). Identification of groundwater potential using geographic information systems and remote sensing (case study: Mojokerto regency). J. Marine-Earth Sci. Tech. 4, 33–38. doi: 10.12962/j27745449.v4i1.700
Szabo, Z. K., Szádoczki, Z., Bozóki, S., Stănciulescu, G. C., and Szabo, D. (2021). An analytic hierarchy process approach for prioritisation of strategic objectives of sustainable development. Sustainability 13:2254. doi: 10.3390/su13042254
Talukdar, S., Mallick, J., Sarkar, S. K., Roy, S. K., Islam, A. R. Md. T., Praveen, B., et al. (2022). Novel hybrid models to enhance the efficiency of groundwater potentiality model. Appl. Water Sci. 12:62. doi: 10.1007/s13201-022-01571-0
Thanh, N. N., Chotpantarat, S., Trung, N. H., Ngu, N. H., and Van, M. H. (2022). Mapping groundwater potential zones in Kanchanaburi Province, Thailand by integrating of analytic hierarchy process, frequency ratio, and random forest. Ecol. Indic. 145:109591. doi: 10.1016/j.ecolind.2022.109591
Thirunavukkarasu, P., and Ambujam, N. K. (2020). Zoning of groundwater potential in Amaravathy river basin, south India, by integrating remote sensing and GIS.
Tripathi, P., Pratap, B., Tiwari, S. K., Kumar, R., Maddheshiya, S., Shukla, P. S., et al. (2025). Delineation of groundwater potential zones using GIS and analytic hierarchy process in parts of Varanasi and Chandauli Districts. Nat. Environ.Pollut. Tech. 24, 159–173. doi: 10.46488/NEPT.2024.v24iS1.011
Twaha, R., Nobert, J., Alexander, A. C., Mulungu, D. M. M., and Senga, M. (2024). Delineating groundwater potential zones with GIS and analytic hierarchy process techniques: the case of Great Ruaha River catchment, Tanzania. Hydrogeol. J. 32, 785–799. doi: 10.1007/s10040-024-02769-z
Uc Castillo, J. L., Martínez Cruz, D. A., Ramos Leal, J. A., Tuxpan Vargas, J., Rodríguez Tapia, S. A., and Marín Celestino, A. E. (2022). Delineation of Groundwater Potential Zones (GWPZs) in a Semi-Arid Basin through remote sensing, GIS, and AHP approaches. Water 14:2138. doi: 10.3390/w14132138
Vafadar, S., Rahimzadegan, M., and Asadi, R. (2023). Evaluating the performance of machine learning methods and Geographic Information System (GIS) in identifying groundwater potential zones in Tehran-Karaj plain, Iran. J. Hydrol. 624:129952. doi: 10.1016/j.jhydrol.2023.129952
Vellaikannu, A., Palaniraj, U., Karthikeyan, S., Senapathi, V., Viswanathan, P. M., and Sekar, S. (2021). Identification of groundwater potential zones using geospatial approach in Sivagangai district, South India. Arab. J. Geosci. 14:8. doi: 10.1007/s12517-020-06316-4
Zamrsky, D., Oude Essink, G. H. P., and Bierkens, M. F. P. (2024). Global impact of sea level rise on coastal fresh groundwater resources. Earths Future 12. doi: 10.1029/2023EF003581
Keywords: groundwater potential zones, remote sensing, AHP, geographic information systems, coastal aquifers, seawater intrusion
Citation: Moses R and Sathiyamoorthy M (2025) Integration of GIS and AHP techniques for the sustainability of groundwater potential zones in the coastal environs. Front. Water 7:1668087. doi: 10.3389/frwa.2025.1668087
Received: 17 July 2025; Accepted: 18 September 2025;
Published: 10 October 2025.
Edited by:
John Rapaglia, University of Kiel, GermanyReviewed by:
Atar Singh, National Institute of Hydrology (Roorkee), IndiaMuniappan Nagarajan, MIT Academy of Engineering, India
Copyright © 2025 Moses and Sathiyamoorthy. This is an open-access article distributed under the terms of the Creative Commons Attribution License (CC BY). The use, distribution or reproduction in other forums is permitted, provided the original author(s) and the copyright owner(s) are credited and that the original publication in this journal is cited, in accordance with accepted academic practice. No use, distribution or reproduction is permitted which does not comply with these terms.
*Correspondence: Mahenthiran Sathiyamoorthy, bWFoZW50aGlyYW4uc0B2aXQuYWMuaW4=