 Paisley S. Samuel
 Jose V. Lopez
- Department of Biological Sciences, Nova Southeastern University, Guy Harvey Oceanographic Center, Dania Beach, FL, United States
Lake Okeechobee, an essential Floridian freshwater ecosystem, has experienced water quality decline due to nutrient pollution since the 19th century. In recent decades, harmful cyanobacterial blooms (cyanoHABs), primarily caused by Microcystis aeruginosa, have increased in frequency and intensity, threatening the lake’s ecosystem. This study investigates the impacts of annual cyanoHABs on the microbial communities in Lake Okeechobee over 3 years by highlighting patterns in the taxonomic dynamics and microbial diversity. From March 2019 to October 2021, 541 surface water samples and corresponding environmental variables were collected and analyzed from 21 routinely monitored sites within Lake Okeechobee using 16S V4 amplicon sequencing techniques. Dominant taxa remained consistent throughout the sampling period, with noticeable fluctuations occurring primarily in 2019 at the order and family levels. Significant spatial differences in microbial composition across all 3 years suggest stable biogeographical patterns across ecological zones within the lake. Microcystis relative abundance and microcystin had the strongest environmental influence on microbial diversity. Microcystis relative abundance was also found to negatively impact the microbial diversity of the lake while strongly correlating with several environmental factors, including temperature, total depth, and nitrate + nitrite concentrations. A co-occurrence network suggested that over 20 microbial genera may influence commensal, mutualistic, or antagonistic relationships with Microcystis. For example, predatory Bradymondales sp. and Bdellovibrio sp. as well as microcystin-degrading Cupriavidus sp. were detected. These findings highlight the importance of identifying and monitoring specific bacterial populations to aid in the monitoring of Microcystis cyanoHAB formation and ecosystem effects.
1 Introduction
Cyanobacteria are photoautotrophic, gram-negative, prokaryotic bacteria that are found globally within a variety of environments, including several species that inhabit extreme environments (Gaysina et al., 2019; Mataloni and Komarek, 2004; Whitton and Potts, 2000a, 2000b). Despite being known colloquially as blue-green algae, cyanobacteria are classified as true bacteria that perform photosynthesis using photosynthetic pigments like chlorophyll a. Cyanobacteria can rapidly proliferate to form dense accumulations of biomass known as blooms, and these blooms can be either harmless or harmful to their surrounding environment (Larkin and Adams, 2007; Smayda, 1997). Cyanobacteria are primarily responsible for causing harmful blooms (cyanoHABs) in freshwater environments (Rosen et al., 2017). CyanoHABs can result from water quality changes, such as increased nutrient levels of nitrogen (N) and phosphorus (P). Cyanobacteria utilize these elements along with carbon, potassium, and iron during photosynthesis. However, these nutrients must be present in certain quantities to promote cyanobacteria populations to bloom; therefore, if there is a deficiency in any of these nutrients, then a bloom cannot occur (Markou et al., 2014). Other environmental factors that produce favorable conditions for the development of cyanobacterial blooms include stagnant water and high temperatures (Paerl and Huisman, 2008).
CyanoHABs decrease water quality through the production of cyanotoxins—water-soluble chemical metabolites that are toxic to the environment. Cyanotoxins can threaten the health of an ecosystem and the organisms in and around those ecosystems. These toxins can affect organisms in various ways, from minor skin irritation to more serious effects such as multiple organ damage, gastroenteritis, and paralysis (Huisman et al., 2018; Williams et al., 2007; Wiegand and Pflugmacher, 2005). There have been numerous incidents where cyanotoxins from cyanoHABs have caused rapid animal and human deaths after a short exposure time (Huisman et al., 2018; Bláha et al., 2009). These blooms also produce thick, dense mats formed at the surface of the water, preventing sunlight from penetrating the water column, decreasing the light needed for photosynthetic organisms residing deeper in the water column. Additionally, when blooms decay, an anoxic environment develops in the water column (Anderson, 2009). Anoxic conditions negatively impact ecosystem functioning by disrupting essential cellular functions and prolonging the duration of anoxia through a positive feedback loop between the additional growth and decomposition of phytoplankton (Zamora-Barrios et al., 2019; McQuaid, 2019; Bláha et al., 2009). Despite immense research on cyanobacterial blooms and their associated factors, cyanoHABs remain difficult to predict and mitigate (Facey et al., 2019).
Lake Okeechobee (Lake O) is the largest lake in the southeastern United States. Lake O has a total shoreline of 220 km and an area of 14,000 sq. km, and it is located at the center of Florida’s Everglades ecosystem (Lecher, 2021). Lake O was once larger and deeper with a north-to-south flow, providing a constant water source for the Everglades ecosystem that dominated the southern region of Florida. However, beginning in the late 19th century, the size, depth, and direction of flow of the lake were permanently altered as a series of major drainage projects (the channelization of the Kissimmee River, dredging of numerous canals, and construction of Hoover Dike) transformed the land around the lake to become a foundation for urban communities and agriculture (Lecher, 2021; U.S. Army Corps of Engineers, J. D, 2021). Throughout the 1950s and 1960s, the water quality of Lake O began to decline rapidly as nutrient levels, primarily from phosphorus, continually increased due to nearby agricultural land use (Canfield and Hoyer, 1988). This continuous influx of nutrients worsened the nutrient levels of an already eutrophic environment, one that was initially limited in nitrogen rather than phosphorus (Missimer et al., 2021).
CyanoHABs are a common occurrence in Lake O, with the first bloom events recorded in the early 1980s (Havens et al., 1995a, 1995b). Over the past two decades, Cooper et al. (2024) found that the total phosphorus and total nitrogen input into the lake have remained elevated or increased, which is driven by nutrient pools from soil run-off and other nonpoint sources. These sustained high-nutrient levels have since recently been linked to the increase in the prevalence and severity of these cyanoHAB events in Lake O (Paerl et al., 2020; Rosen et al., 2017). The freshwater cyanoHABs that occur in Florida are primarily caused by the genus Microcystis, but these events can also be caused by other cyanobacterial genera such as Dolichospermum and Cylindrospermopsis (Rosen et al., 2017). The toxins produced during blooms caused by these genera include microcystins, anatoxin-a, saxitoxins, and cylindrospermopsin (Myer et al., 2020). In 2018, Metcalf et al. (2018) found that the dominant species of cyanobacteria causing cyanoHABs in Lake O was Microcystis aeruginosa, a prevailing bloom-forming and microcystin-producing cyanobacterium also producing cyanoHABs in freshwater ecosystems worldwide (Harke et al., 2016).
Traditionally, cyanoHABs are predominantly driven by abiotic factors (Rollwagen-Bollens et al., 2018; Visser et al., 2016; Paerl and Scott, 2010). However, Shen et al. (2011) documented that some heterotrophic bacterioplankton coexist with these bloom-forming cyanobacteria, which has led to speculation that the microbial community may also play a role during these cyanoHAB events (Croci et al., 2025; Wang et al., 2021; Van Wichelen et al., 2016). During in-vitro studies, Synechococcus (Zheng et al., 2018) and Microcystis (Tu et al., 2019; Van Wichelen et al., 2016) colonies frequently contained heterotrophic bacteria, and the colonies obtained from nature contained heterotrophic bacteria communities as well. The interactions between photoautotrophic and heterotrophic bacteria play a fundamental role in aquatic ecosystems as heterotrophs utilize fixed carbon and other nutrients supplied by photoautotrophs and, in turn, provide these photoautotrophs with essential vitamins and amino acids (Zheng et al., 2018).
Like other natural ecosystems, Lake O contains a diverse microbial community, yet few studies have begun to characterize this diversity until recently (Krausfeldt et al., 2024; Lefler et al., 2023). Shifts in microbial diversity could underlie or facilitate bloom formation by changing the microhabitats of cyanobacteria before, during, and after cyanoHAB events within Lake Okeechobee. Some studies investigated potential supportive roles that a microbial community may play in the development and maintenance of cyanoHABs and the overall growth and stability of cyanobacterial populations (Jackrel et al., 2021; Sigee, 2005; Eiler and Bertilsson, 2004). Heterotrophic microbes that compose the community can also aid in the degradation of the organic material produced by the bloom, which contributes to the anoxic conditions that follow bloom degradation (Cai et al., 2024; Zhang et al., 2020; Anderson, 2009). However, the knowledge of how these cyanoHABs is affecting microbial community structure or how these other microbes could potentially be influencing the blooms specifically in Lake O has yet to be studied. A better understanding of the interactions between the potential bloom-forming cyanobacterial species and the wider microbial community may provide scientists with the knowledge of key factors driving or sustaining blooms, serve as biological indicators for future cyanoHABs, and may aid in the ongoing efforts to reduce or mitigate the occurrences of these blooms within Lake Okeechobee.
In this study, we used 16S rRNA high throughput sequencing to investigate the structure of microbial communities within Lake O and how it is affected by recurring annual cyanoHABs over several years. A detailed taxonomic characterization of the microbial community of Lake O was conducted to investigate the dynamics of microbial taxa inhabiting the lake. Afterwards, diversity indices were used, along with Microcystis relative abundance, microcystin concentration, and chlorophyll a concentration, to give preliminary insight as to whether the cyanoHABs occurring in Lake O alter the microbial community composition of Lake O. Environmental data was also analyzed to discover any patterns that may further influence the microbial community composition of Lake O. We hypothesize that the microbial community of Lake O will remain consistent across the sampling years but vary between sampling stations. We also hypothesize that recurring cyanoHABs will lower the microbial community diversity of the lake.
2 Materials and methods
2.1 Environmental data and sample collection and processing
Beginning in March 2019, surface water samples were collected monthly by the South Florida Water Management District (SFWMD) at 21 routinely sampled stations, completely overlapping the collection sites mentioned in Krausfeldt et al. (2024). These stations included 19 stations dispersed within Lake Okeechobee (CLV10A, KISR0.0, L001, L004, L005, L006, L007, L008, LZ2, LZ25A, LZ30, LZ40, PALMOUT, PELBAY3, POLE3S, POLESOUT, RITTAE2, S308), one station located near the W. P. Franklin Lock along the Caloosahatchee River (S79), and another station located near the St. Lucie River lock along the St. Lucie River (S80) (Figure 1). After collection, water samples were kept on ice and shipped overnight to the USGS Water Science Center in Orlando, Florida, where each sample was filtered through two 0.22 μm Sterivex filters (Millipore, SVGP01050). The filters were then stored at −20 °C and transported on ice to the Molecular Microbiology and Genomics Lab (MMG) at Nova Southeastern University (NSU) for further sample processing. This workflow of sample collection and processing was repeated monthly until October 2021.
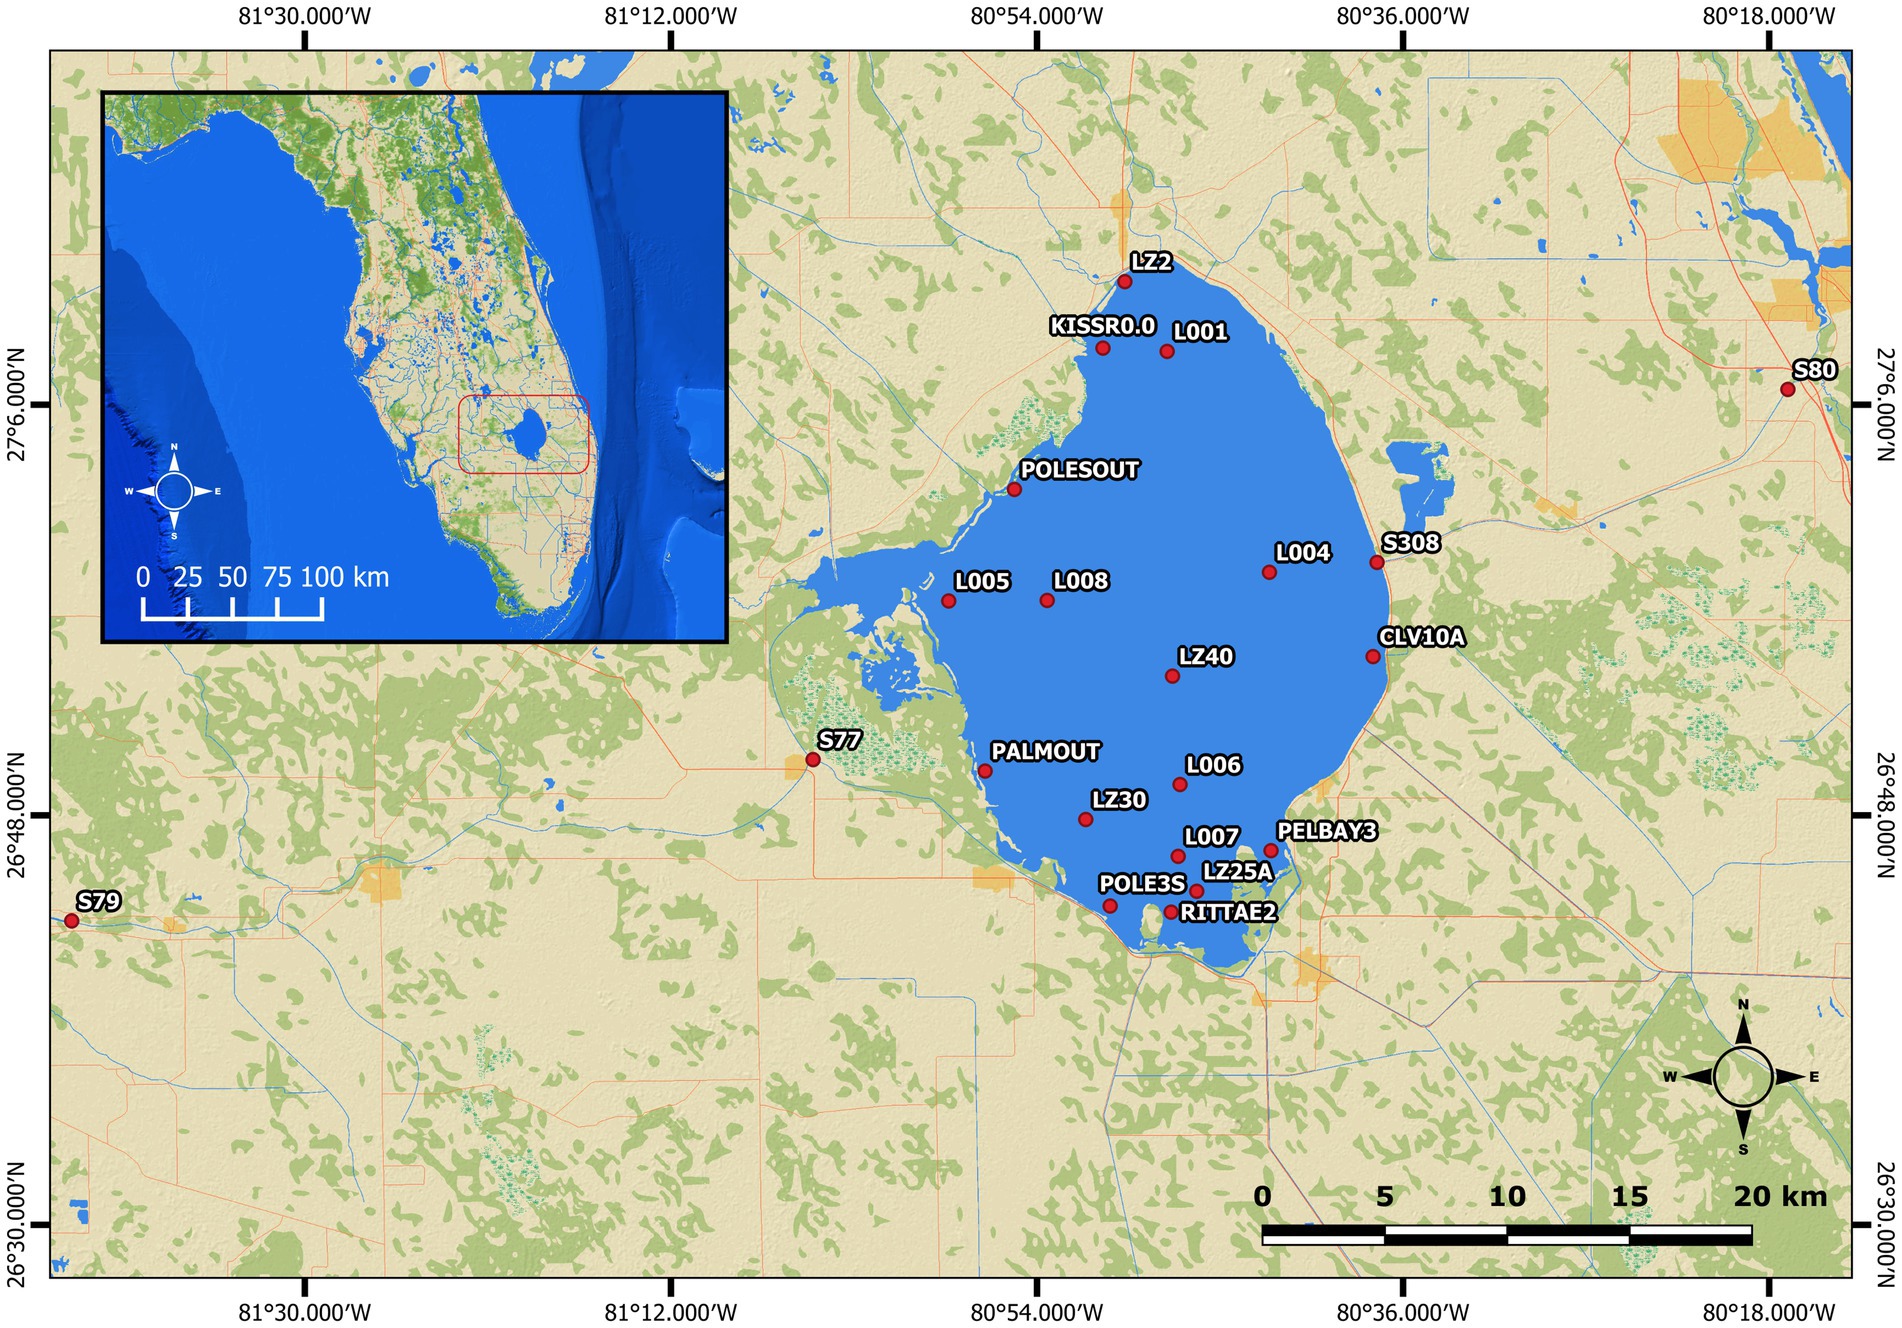
Figure 1. Map of sampling stations found within and connected to Lake Okeechobee. Nineteen stations are located within the lake while one station is located within the Caloosahatchee River (S79), and another station located within the St. Lucie River (S80).
Once the collected samples were received in the MMG lab, DNA was extracted from the filters using the Qiagen® DNeasy® PowerLyzer® PowerSoil® kit (Qiagen, 12,855-100) by following the manufacturer’s protocol. Negative controls in the form of blank ‘reagent-only’ extractions were also included to detect any DNA contamination within the reagents. Following successful DNA extractions, the samples underwent 1.5% agarose gel electrophoresis to confirm the presence of intact DNA in each sample.
Following the confirmation of intact DNA, a test polymerase chain reaction (PCR) was performed on each sample to confirm the successful amplification of PCR products using the desired primers. In short, a master mix was made using Invitrogen Platinum Hot Start PCR Master Mix (2X, ThermoFisher, 13000014), nuclease-free water, and universal primers 515F and 806R. DNA was then added and underwent amplification in a thermal cycler following a modified Earth Microbiome Project (EMP) 16S Illumina Amplicon protocol (Caporaso et al., 2018). The 515F and 806R primers were used to target and amplify the V4 region of the 16S rRNA gene. A 1.5% agarose gel electrophoresis was performed to confirm the production of successful PCR products. It is important to mention that if the test PCR was unsuccessful, which is evidence that the concentration of extracted DNA was low, the sample was concentrated using a CentriVap DNA Vacuum Concentrator (©Labconco, Cat. No. 7970010) and re-amplified with test PCR. With the successful production of PCR products, barcoded 515F and 806R primers were used, with each sample receiving identical barcoded 515F primer sequences and unique barcoded 806R primer sequences. A final 1.5% agarose gel was run to confirm the successful barcoding of the samples. The samples were then cleaned using a modified AMPure XP beads protocol (PCR Purification with Beckman Coulter AMPure XP Magnetic Beads and the VIAFLO 96, 2020), quantified using Qubit 3.0 and Qubit 4.0 Fluorometers (Life Technologies), and diluted to 4 nM using nuclease-free water. The now-diluted barcoded samples were pooled together, checked for quality and contamination using the Agilent TapeStation 4,150 (Product #G2992AA), and loaded into the Illumina MiSeq system (Product #SY-410-1003) using the MiSeq Reagent Kit v3 at 600 cycles (Product #MS-102-3003) following a custom protocol.
The following 20 environmental data variables were collected and analyzed throughout the 3 years sampling period from the SFWMD environmental database, DBHYDRO1: chlorophyll a (chl a, μg/L), pheophytin a (μg/L), secchi disk depth (m), silica (mg/L), turbidity (NTU), sulfate (mg/L), alkalinity (as total CaCO3, mg/L), ammonia (NH4, mg/L), total depth (m), pH, dissolved oxygen (mg/L), nitrate+nitrite (NO3 + NO2, mg/L), total phosphate (PO4, mg/L), temperature (°Celsius), total nitrogen (TN, mg/L), total phosphorus (TP, mg/L), TN and TP ratio, and three toxins associated with cyanoHABs, Anatoxin-a (μg/L), Cylindrospermopsin (μg/L), and Microcystin (μg/L). Additional variables were also considered for each sample, including station location, month (1–12), season (wet or dry), year (1–3), and ecological zone (inflow, nearshore, pelagic, or S79). After retrieval, the environmental data was then corresponded to the collected samples for DNA extraction and sequencing.
2.2 16S rRNA sequence analysis and statistics
Raw DNA sequence data generated from the Illumina MiSeq system underwent initial bioinformatic analyses within QIIME2 (Quantitative Insights into Microbial Ecology, version 2022.2) (Bolyen et al., 2019). Within the QIIME2 environment, the forward and reverse read sequence data were paired and demultiplexed to produce the sequence reads for each sample. Sample sequences were then trimmed, quality filtered (Q-scores > 29) and checked for chimeras using the DADA2 software package built into the QIIME2 program. There was a total of 11 sequencing runs conducted within this study, therefore the raw sequence data for each run underwent demultiplexing, trimming, and quality filtering separately before being merged into one dataset. Lastly, the merged sequencing dataset was assigned taxonomy using the SILVA database SILVA138 classifier (silva-138-99-515-806-nb-classifier.qza) (Quast et al., 2013). A rarefaction curve was created to determine the sequence read cut-off point for any samples that were not fully sequenced. The resulting dataset was then cleaned to ensure it did not contain any unwanted ASVs. Any ASVs that were found in the negative controls were removed, and the negative control samples were also removed from the sample pool. Any duplicate samples were removed by only retaining the replicate that obtained the most sequence reads. ASVs that represented chloroplast or mitochondrial DNA were also removed to ensure that the dataset contained no eukaryotic sequences. Final data cleaning and normalization were performed using the ‘vegan’ package (Oksanen et al., 2022) using R (version 4.2.0; R Core Team, 2022), where singletons, doubletons, and ASVs occurring less than 1% of total ASV abundance were removed.
2.3 Batch correction
Due to the large-scale nature of this study, the hundreds of samples that were sequenced could be affected by differences in sample preparation and data acquisition conditions, such as, different individuals working on the sample preparation, different reagent batches, and even changes in instrumentation (Cuklina et al., 2021). This is known as the “batch effect,” and it can introduce noise that would, in turn, reduce the statistical power of the analyses (Cuklina et al., 2021). Considering this, the data was assessed for any significant batch effects before moving on to further downstream analyses. Batch correction was performed using the ‘MMUPHin’ (Ma, 2023) and ‘vegan’ (Oksanen et al., 2022) packages in R. An ANOSIM was performed to determine if the variation in the data caused by batch was significant (p < 0.05). After conducting the ANOSIM, significant differences were found, and a batch correction was conducted on the entire dataset using the ‘MMUPHin’ package in R (Ma, 2023).
2.4 Bacterial taxonomy and visualization
Taxonomic and corresponding statistical analyses were performed on the cleaned, normalized, and batch-corrected dataset using R. The ‘phyloseq’ package (Mcmurdie and Holmes, 2013) determined the minimum, maximum, and average number of sequencing reads, as well as the total number of unique ASVs in the dataset. The top taxa were calculated using packages ‘phyloseq’ (Mcmurdie and Holmes, 2013) and ‘microbiome’ (Lahti and Shetty, 2012) and visualized using stacked bar charts made using the ‘ggplot2’ package (Wickham, 2016) for each year and station. Since chl a is a pigment found in both cyanoHAB-forming and non-cyanoHAB-forming cyanobacteria, additional stacked bar charts were created to visualize the top phyla, families, and genera present across increasing chl a concentration to visualize the changes in the cyanobacteria population during higher chl a concentration. Higher taxonomic resolutions, such as orders and families, were investigated across the entire sampling period between the ecological zones of the lake. QGIS (version 3.22.5), an analytical mapping software, visualized the microbial community taxonomic distributions and patterns within Lake Okeechobee across the entire sampling period at the various sampling stations. An aerial satellite image of Lake Okeechobee was retrieved from Google Earth via the QGIS software and utilized as the raster layer. Point layers were created using the latitude and longitude coordinates retrieved from DBHYDRO for each station. Pie charts of the top 10 phyla within each station were created for the entire sampling period.
2.5 Diversity, Venn diagram, and co-occurrence network analyses
Alpha and beta diversity were assessed using the ‘vegan’ package (Oksanen et al., 2022) and visualized using the ‘base’ (R Core Team, 2022) and ‘ggplot2’ (Wickham, 2016) packages in R. Alpha diversity was measured by calculating the total number of species (species richness), species evenness (also known as Pielou’s evenness index) (J), Shannon diversity index (H), and inverse Simpson’s diversity index (inv. D). Differences between these alpha diversity indices were analyzed between samples using a Kruskal-Wallis test. A pairwise Wilcoxon test was used as a post-hoc comparison test to determine where the differences lie. Additional analyses were conducted to investigate the changes in alpha diversity measures across various concentrations of chl a and microcystin. Beta diversity was measured by calculating Bray–Curtis dissimilarity between sites. These distance matrices were then used to produce non-metric multidimensional scaling (nMDS) plots in R to further visualize the distances between sites. To create the nMDS plots, the relative abundance data was transformed using the “total” method found within the ‘decostand’ function in ‘vegan’ (Oksanen et al., 2022). Functions ‘betadisper’ and ‘permutest’ in the ‘vegan’ package (Oksanen et al., 2022), were used to calculate variances within each group and to determine if the variances differ by group. If the variances between groups were not significant, a permutational multivariate ANOVA (PERMANOVA) with 999 permutations was performed using the ‘adonis2’ function in the vegan package (Oksanen et al., 2022). If the variances between groups were significant, an analysis of similarity (ANOSIM) with 999 permutations was performed using the ‘anosim’ function in the vegan package (Oksanen et al., 2022). Canonical correspondence analysis (CCA) was performed using the ‘cca’ function in the ‘vegan’ package (Oksanen et al., 2022) to detect the interactions between the selected environmental variables and ASV abundance. The function ‘envfit’ was then used to retrieve the p-value of the correlation of each variable with overall bacterial community composition and the p-value of each correlation between each ASV and all variables. Only significant (p < 0.05) environmental variables with R2 values higher than 0.3 were plotted as vectors overlaying the CCA plot.
A Venn diagram was made to identify and compare core taxa that appeared across the years (1, 2, and 3) using the ‘eulerr’ package in R (Larsson, 2022). We defined core taxa as any ASVs that were detected at a relative abundance of at least 1% and within at least 75% of the samples. This definition aligns with previous studies that focused on dominant, consistently detected taxa that likely played key roles in microbe interactions in the microbiome (Vestergaard et al., 2024; Xue et al., 2023; Mo et al., 2021; Xue et al., 2018; Magurran and Henderson, 2003). Afterwards, a co-occurrence network was created to further investigate what taxa could possibly be co-occurring with the genus Microcystis. Using the ‘Hmisc’ package in R (Harrell, 2023), a Pearson correlation matrix was created using the sample count data and making pairs of all 8,340 ASVs from the entire sampling period. The correlation matrix was then converted into a table that shows the individual R2 values and their associated p-values. Only significant interactions (p < 0.05) and strongest correlations (R2 > 0.7 OR R2 < −0.7) were extracted from the table to create a correlation network in Cytoscape (version 3.9.1) (Shannon et al., 2003). These thresholds align with the rationale Xue et al. (2018) used to ensure that the network only reflects the strongest and most likely meaningful associations between microbes. The network was filtered further to only include the network nodes and edges that interact with Microcystis.
3 Results
3.1 16S rRNA sequencing statistics
Across the sampling period (March 2019 to October 2021), there was a total of 59,862,979 sequencing reads and 70,605 ASVs generated across all samples. To determine the sequencing depth, the total number of usable sequencing reads, that best represented the microbial communities of Lake O, total sequence reads were calculated for each sample and a rarefaction curve (Supplementary Figure S1) was generated to aid in determining the minimum sequence read cut-off point. The resulting rarefaction curve reached an inflection point at relatively 10,000 reads, thus, any samples that were below this number of reads were removed. As a result, 65,294 ASVs and 541 samples, with an average of 44,535 reads per sample, were used for further analysis (Supplementary Table S1). Additional filtering for singletons, doubletons, and exceptionally low abundance ASVs (occurring less than 1%) was completed, resulting in 8,340 ASVs being utilized for further diversity analyses.
3.2 Dominant taxa
The top ten phyla found in Lake O over the entire sampling period were Proteobacteria, Bacteroidota, Cyanobacteria, Actinobacteriota, Verrucomicrobiota, Planctomycetota, Bdellovibrionota, Acidobacteriota, Chloroflexi, and Gemmatimonadota. However, these top ten phyla varied in abundance and presence within each year, with year 3 being the only year containing phylum Gemmatimonadota as one of the top phyla (Supplementary Figure S2). These phyla can also be seen within each station, with Proteobacteria, Bacteroidota, and Cyanobacteria being the top three phyla found at each station across the entire sampling period (Supplementary Figure S3). The top ten phyla also differed between the individual sampling stations across all 3 years (Supplementary Figure S4) and between each year (Supplementary Figure S5). Year 1 was the only year that included the phylum SAR324_ clade (marine group B) within the top ten phyla of only two stations, POLESOUT and S79 (Supplementary Figure S5A). Year 2 had 13 unique phyla appear within the top ten phyla of each station—one phylum short of years 1 and 3, both of which had 14 unique phyla each in their top ten phyla across each station. Furthermore, year 2 was the only year that included the phylum Armatimonadota within the top ten phyla occurring at only one station, KISSR0.0. Year 2 also was the only year that did not have the phylum Myxococcota within the top ten phyla of any station (Supplementary Figure S5B). Year 3 was the only year that included the phylum Patescibacteria within the top ten phyla of only two stations, L004 and L006 (Supplementary Figure S5C). The top 20 orders and families both appeared to vary in presence and abundance across all three years and across the four ecological zones (Figure 2). Compared to years 2 and 3, the order Cyanobacteriales was not present as one of the top 20 orders of year 1, but instead, the Silvanigrellales was present (Figure 2A). The other 19 orders remained present in the top 20 orders across the entire sampling period and ecological zones. Year 1 was the only year that did not include the family Microcystaceae in its top families (Figure 2B). Microcystaceae was of highest abundance in the Nearshore and Pelagic zones across years 2 and 3 (Figures 2D,F). As also seen in the orders, Silvanigrellaceae only appeared in the top families of Year 1 and no other year (Figure 2B). Between years 2 and 3, Year 2 did not include the OM190 in its top families while Year 3 did (Figures 2D,F).
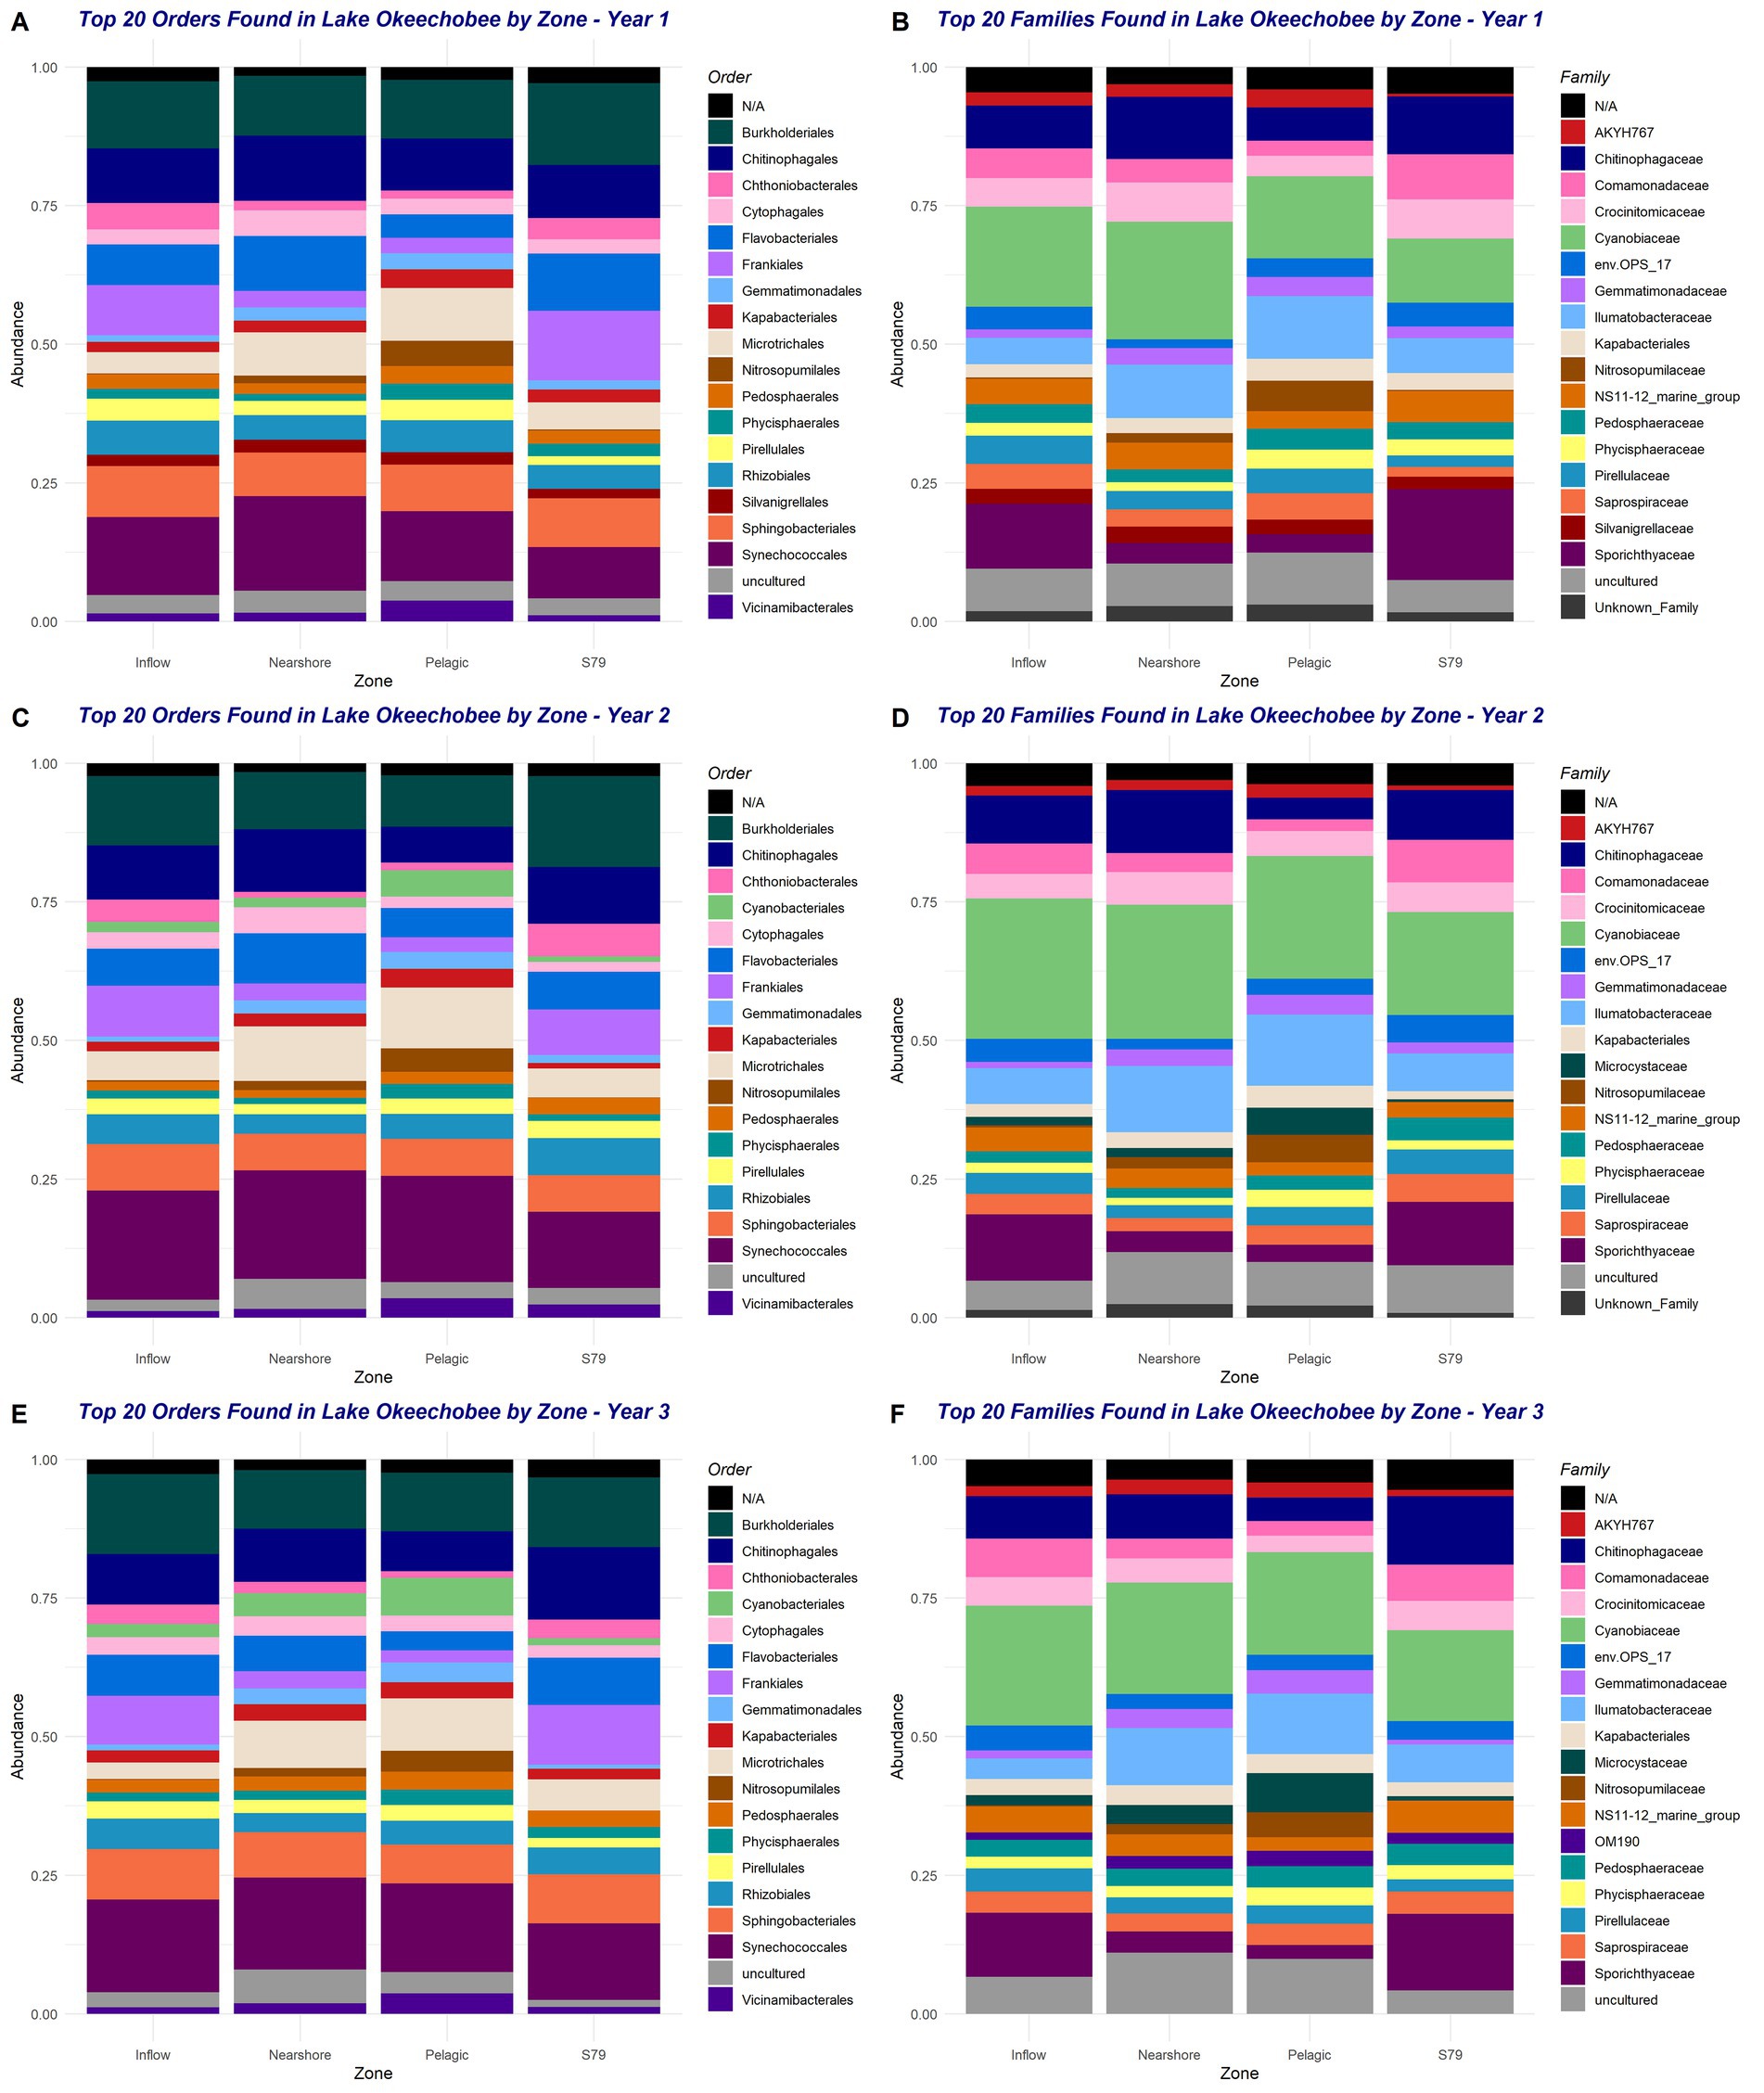
Figure 2. Top 15 orders (A,C,E) and top 15 families (B,D,F) across the four ecological zones during the entire sampling period (2019–2021). Plots A and B belong to year 1, C and D belong to year 2, and E and F belong to year 3. Taxa marked as “N/A” occur when taxonomic resolution was not achieved due to insufficient classification confidence or sequence data limitations.
In the analysis of relative taxonomic abundances between ranges of chl a concentration across the entire sampling period, only the top phyla, families, and genera were included (Figure 3). Within the top ten phyla, only Planctomycetota appeared to slightly increase in abundance with increasing chl a concentration (Figure 3A). Acidobacteriota, Actinobacteriota, Crenarchaeota, and Gemmatimonadota appeared to decrease in abundance as chl a concentration increases (Figure 3A). A similar trend was observed within the abundances of the families Gemmatimonadaceae, Ilumatobacteraceae, and Nitrosopumilaceae as they decrease in abundance with increasing chl a concentration (Figure 3B). The only genera that decreased with increasing chl a concentration was Candidatus_Nitrosotenuis (Figure 3C). There were also some patterns seen between the abundance of the cyanobacterial taxa (including the family Cyanobiaceae and genus Cyanobium_PCC-6307) and Microcystis. For both the cyanobacteria taxa and Microcystis, their abundance increased with increasing chl a concentration; however, the abundance of the cyanobacterial taxa appeared to fluctuate according to the abundance of Microcystis present (Figure 3C).
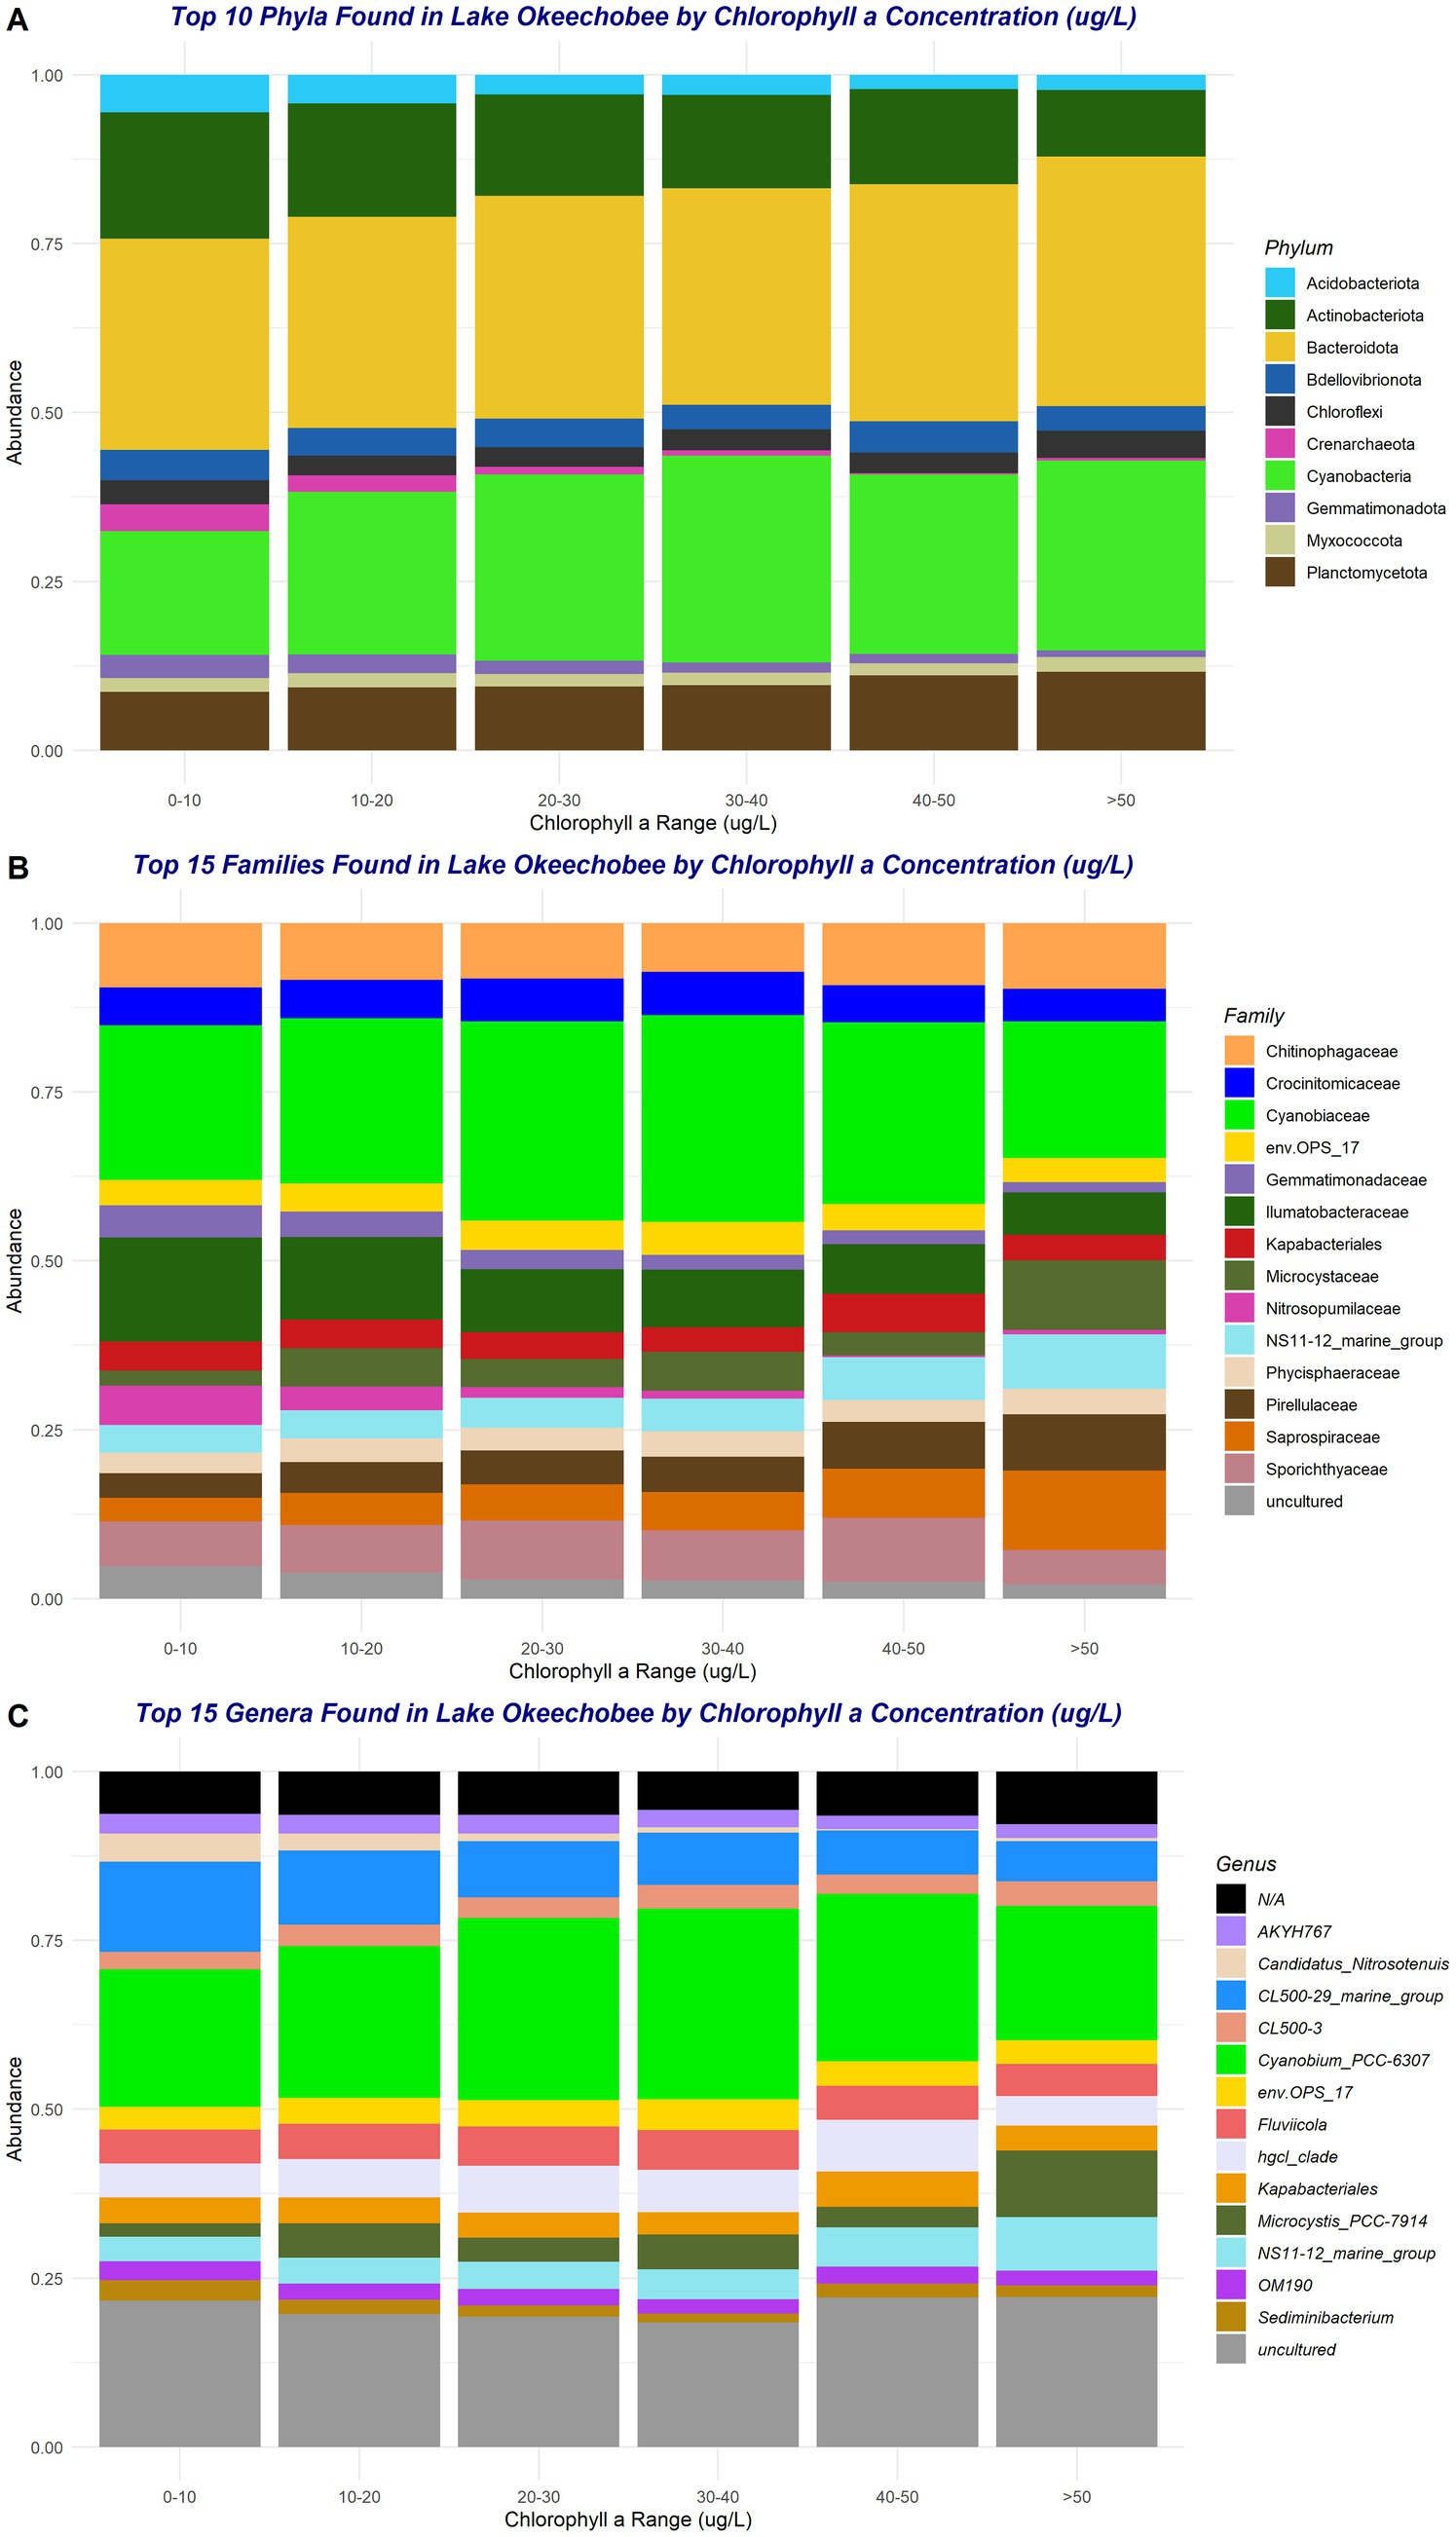
Figure 3. Top phyla (A), families (B), and genera (C) across chlorophyll a concentration range during the entire sampling period (2019–2021). Taxa marked as “N/A” occur when taxonomic resolution was not achieved due to insufficient classification confidence or sequence data limitations.
Each sampling year shared unique core taxa within the Lake O ecosystem. Core taxa are defined as any ASVs that were detected at a relative abundance of at least 0.1% and found in at least 75% of the samples. A Venn diagram was created between each year, and it showed that all years shared 12 core taxa (Supplementary Figure S8). Years 1 and 2 did not have any core taxa that was unique to them, nor did they share any core taxa. Year 3, however, had 14 unique core taxa, shared four core taxa with year 2, and two core taxa with year 1 (Supplementary Figure S8). The taxonomic information for each taxon placed in the Venn diagram can be found in Supplementary Table S4. The phylum Cyanobacteria was only found in the core taxa shared between years 2 and 3 and within the unique core taxa of year 3 (Supplementary Table S4). Verrucomicrobiota was the only phylum of heterotrophic bacteria found within the shared taxa between year 2 and year 3 (Supplementary Figure S8; Supplementary Table S4).
3.3 Co-occurrence network with Microcystis
A total of 22 bacterial genera appeared to co-occur with Microcystis (Figure 4). The network consisted of two clusters around Microcystis. Most of the bacteria fall under the phylum Proteobacteria with some occurring in other phyla such as Bacteroidota and Gemmatimonadota. The three strongest relationships shared with Microcystis were between uncultured bacteria belonging to the family Sutterallaceae (Pearson R = 0.836), the cyanobacterial genus Pseudanabaena_PCC-7429 (Pearson R = 0.811), and the genus Silanimonas (Pearson R = 0.807). Genus Microcystis co-occurs primarily with heterotrophic bacterial taxa, with only two relationships with other cyanobacterial taxa, Pseudanabaena_PCC-7429 and Snowella_OTU37S04 (Figure 4).
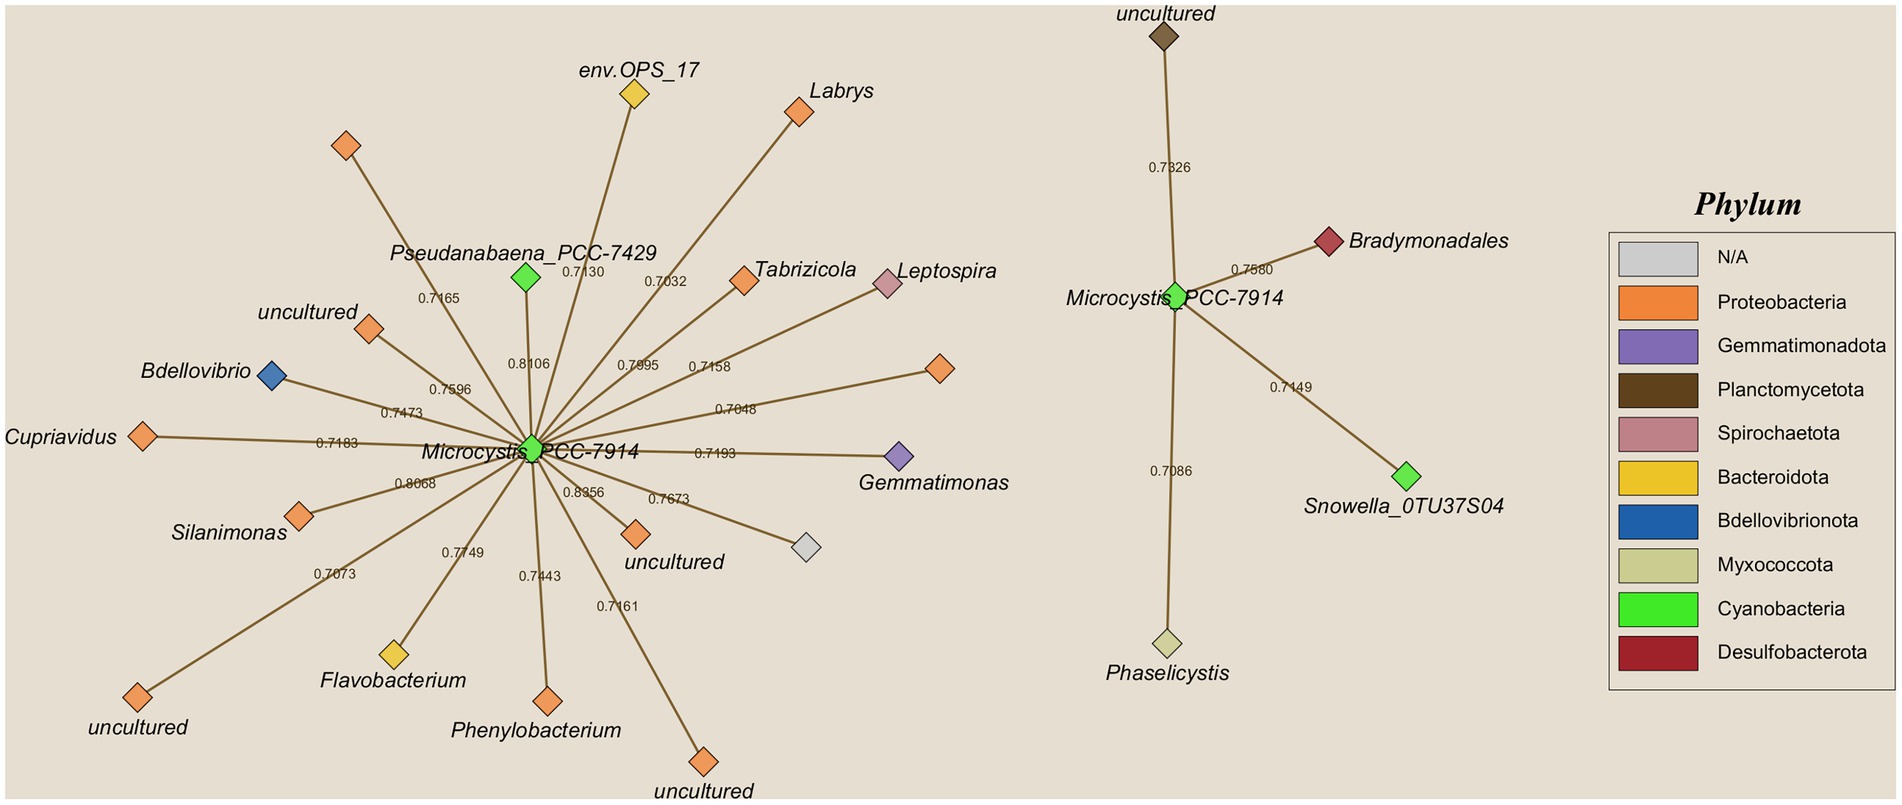
Figure 4. Cooccurrence networks of genera sharing a significantly strong positive correlation (p = 0.05; R2 > 0.7) with the genus Microcystis. Node color indicates the phylum corresponding to the genera shown. Numbers shown on the network edges signify the R2 values of the relationship. The separation between the two networks is a result of network creation and does not indicate biological or analytical distinction.
3.4 Alpha diversity analyses
Alpha diversity was calculated using the Shannon diversity index, species evenness, species richness, and inverse Simpson diversity index. Fluctuations in alpha diversity appeared to be affected both temporally and spatially. Year 3 (2021) exhibited significantly higher species richness than the previous 2 years (2019 and 2020, respectively) (year 1 vs. year 3, p = 0.0006; year 2 vs. year 3, p = 0.0098) (Supplementary Figure S6). Year 1 showed significantly higher species evenness throughout the microbial community compared to years 2 and 3, but year 2 was similar in species evenness compared to both years 1 and 3 (year 1 vs. year 2, p = 0.042; year 1 vs. year 3, p = 0.00013; year 2 vs. year 3, p = 0.028) (Supplementary Figure S6). Within each year, alpha diversity also differed by month (Supplementary Table S2). These trends appeared to be seasonal with the analysis comparing seasons within each year showing that species evenness specifically differed in year 2 (p = 0.00084) and year 3 (p = 0.037). Spatially, alpha diversity differed between zones across years 1 and 3, with year 2 showing no significant differences across all alpha diversity measures (Supplementary Figure S7). Alpha diversity differed by station within each year as well, with year 1 showing no significant differences in species evenness, year 2 only showing differences in species evenness, and year 3 showing differences in all the alpha diversity measures (Supplementary Table S3).
Few environmental variables strongly correlated (Pearson R2 > 0.5 or Pearson R2 < −0.5) to the alpha diversity in Lake O (Figure 5). Microcystis relative abundance showed the strongest correlation to species evenness out of all the environmental variables measured (Pearson R2 = −0.72), with microcystin concentration trailing behind (Pearson R2 = −0.49). Species evenness also showed significant differences across ranges of microcystin concentration (p = 0.0006) (Figure 6), with these differences found between samples with less than 0 μg/L microcystin and samples with more than 50 μg/L microcystin (p = 0.0062), and between samples with more than 50 μg/L microcystin and samples with microcystin concentrations between 0 and 20 μg/L (p = 0.015). Inverse Simpson diversity index also exhibited a similar trend (p = 4.74×10^-5), with differences found between samples with less than 0 μg/L microcystin and samples with more than 50 μg/L microcystin (p = 0.001), and between samples with more than 50 μg/L microcystin and samples with microcystin concentrations between 0 and 20 μg/L (p = 0.0005) (Figure 6). Other environmental variables that correlated to species evenness included ammonia (Pearson R2 = 0.11), nitrate + nitrite (Pearson R2 = −0.10), and total phosphate (Pearson R2 = −0.11) (Figure 5). Environmental variables that correlated to species richness include total nitrogen (Pearson R2 = 0.17), TN: TP ratio (Pearson R2 = −0.13), and total phosphorus (Pearson R2 = 0.18) (Figure 5). The environmental variables that correlated to the diversity indices, Shannon and inverse Simpson, included microcystin (Pearson R2, Shannon = −0.23; inv. Simpson = −0.20), nitrate + nitrite (Pearson R2, inv. Simpson = −0.10), total nitrogen (Pearson R2, Shannon = 0.13; inv. Simpson = 0.17), total phosphorus (Pearson R2, Shannon = 0.06; inv. Simpson = 0.10) and total phosphate (Pearson R2, inv. Simpson = −0.12). Microcystis relative abundance had a strong, negative correlation with species evenness (Pearson R2 = −0.72), with additional negative correlations with Shannon diversity index (Pearson R2 = −0.23), and inverse Simpson diversity index (Pearson R2 = −0.22). There were no correlations between any of the alpha diversity measures and chl a, temperature, nor pH (Figure 5). However, there were significant differences found in species evenness (p = 1.998×10^-6) and inverse Simpson diversity index (p = 0.0062) across range of chl a concentration (Figure 7). Differences in species evenness were found between samples with chl a concentration ranging between 0 to 10 μg/L and 10 to 20 μg/L (p = 0.006), 0 to 10 μg/L and 20 to 30 μg/L (p = 0.0003), and 0 to 10 μg/L and 30 to 40 μg/L (p = 0.003). Differences in inverse Simpson diversity index were found between samples with chl a concentration ranging between 0 to 10 μg/L and 20 to 30 μg/L (p = 0.003) (Figure 7).
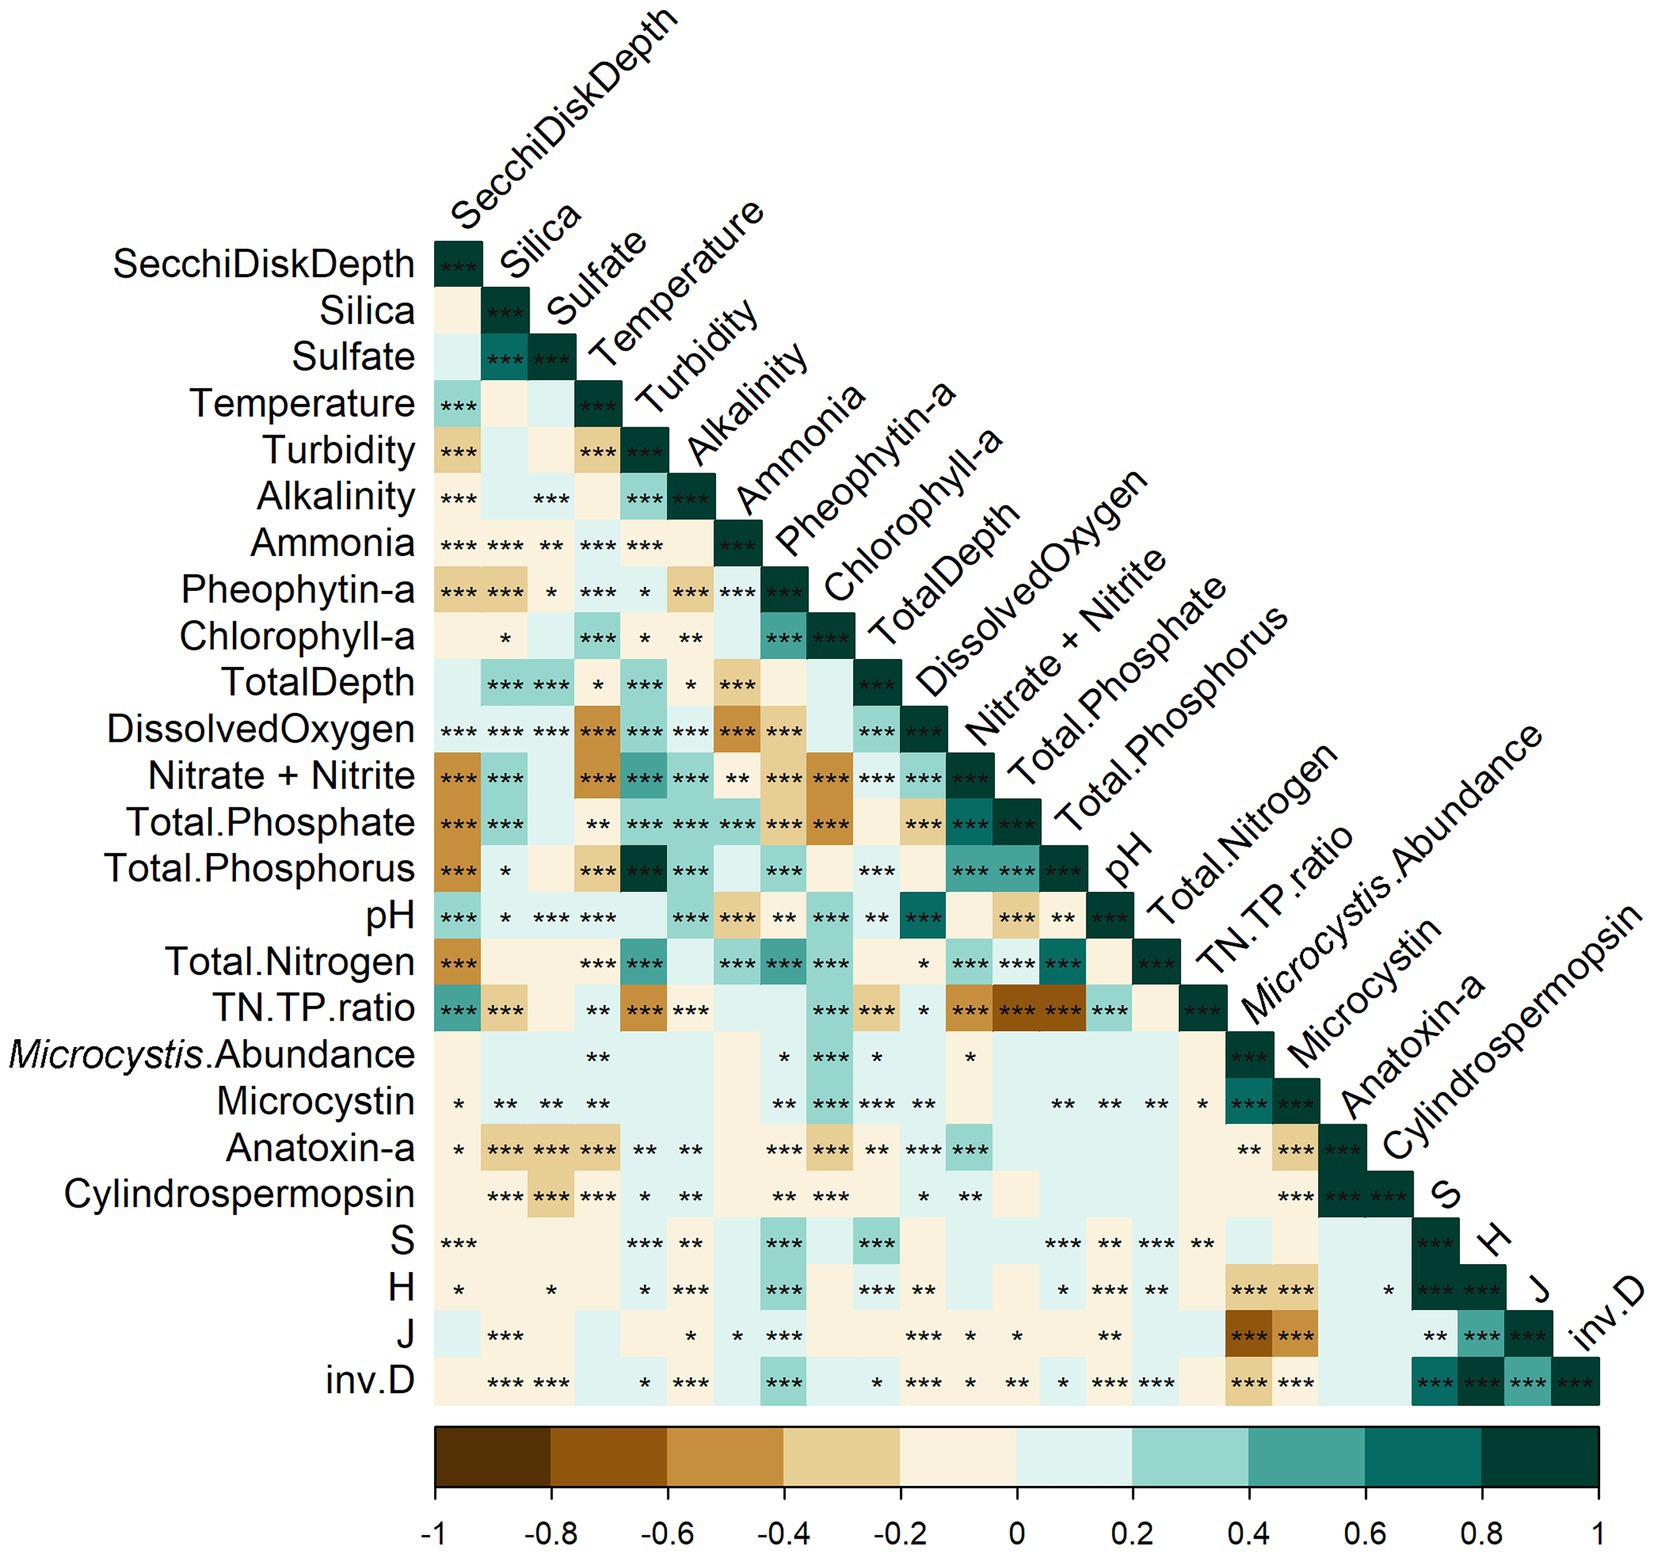
Figure 5. Correlation heat map between the environmental variables and the alpha diversity indices. Stars indicate the significance level; * = 0.05, ** = 0.01, *** = 0.001. No star indicates that the relationship is not significant. Colors indicate R2 values of the relationship between variables; deeper colors signify stronger relationships (brown = negative relationship, blue = positive relationship). Alpha diversity measures can be found at the bottom of the heatmap: S = species richness, H = Shannon diversity index, J = species evenness, inv.D = inverse Simpson diversity index. TN:TP ratio = ratio of total nitrogen and total phosphorus.
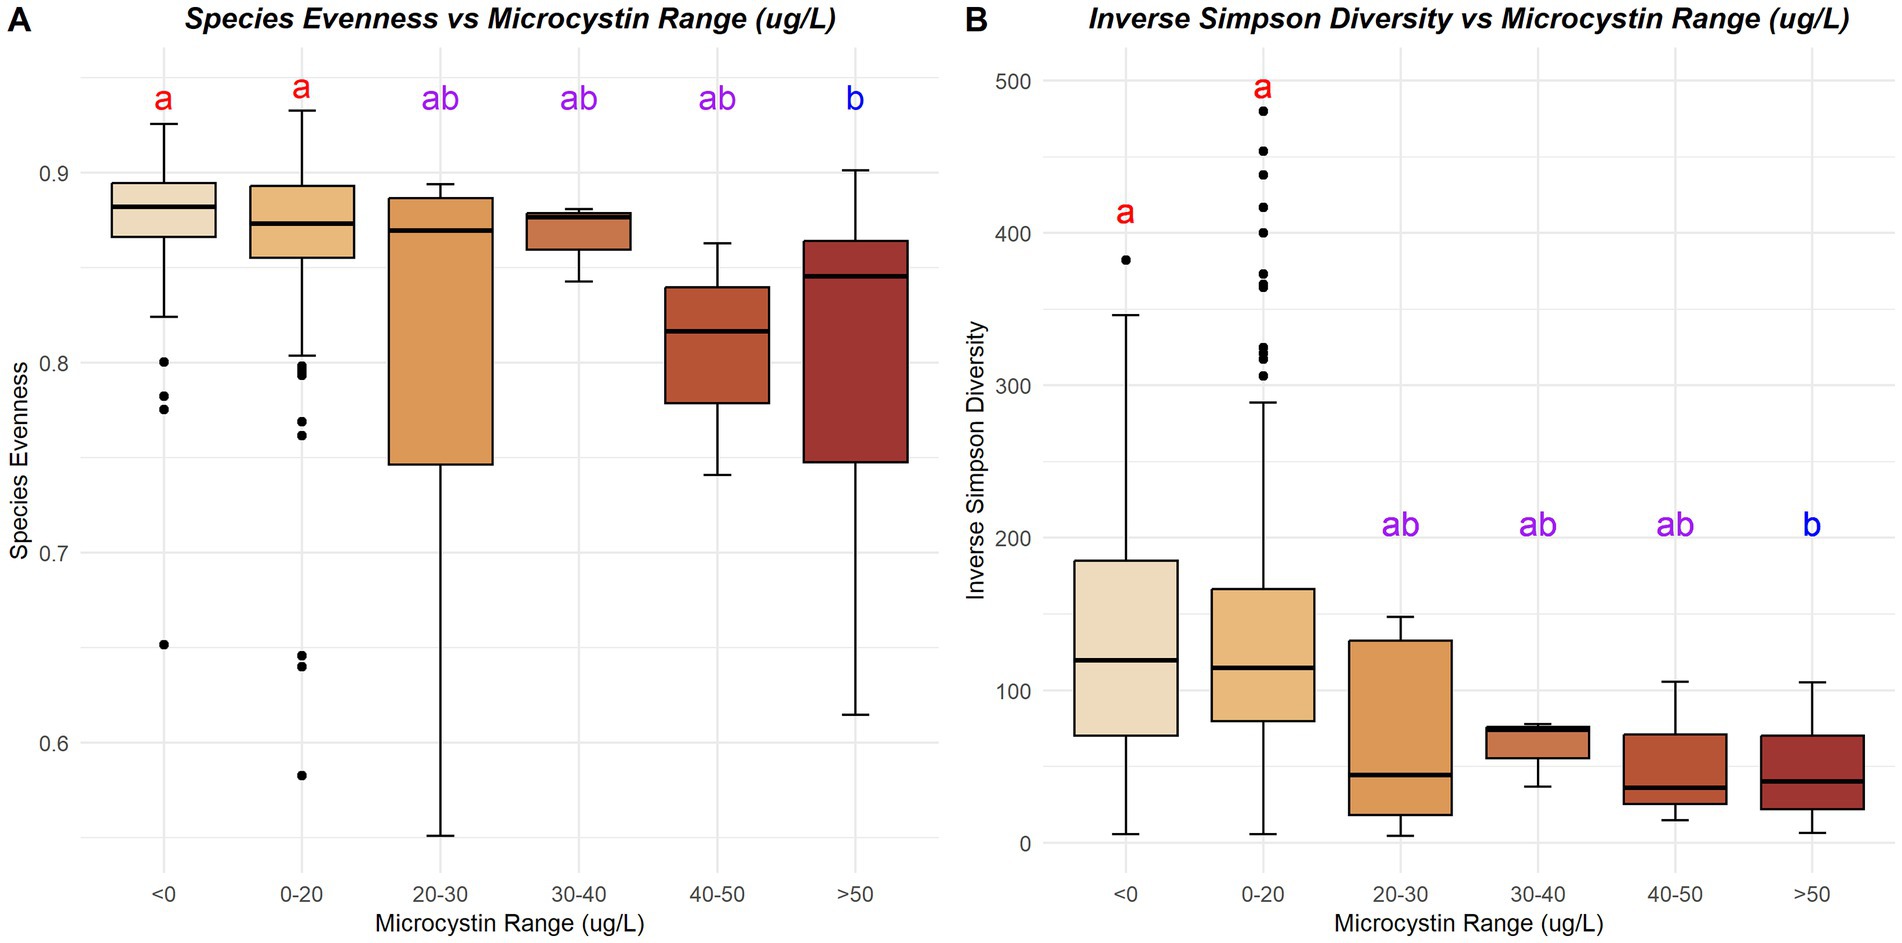
Figure 6. Species evenness (A) and inverse Simpson diversity index (B) across various ranges of microcystin concentrations (μg/L). Letters and colors represent the significant differences between microcystin concentration ranges; same letter and color indicate no differences and different letters and colors indicate significant differences are present (p < 0.05).
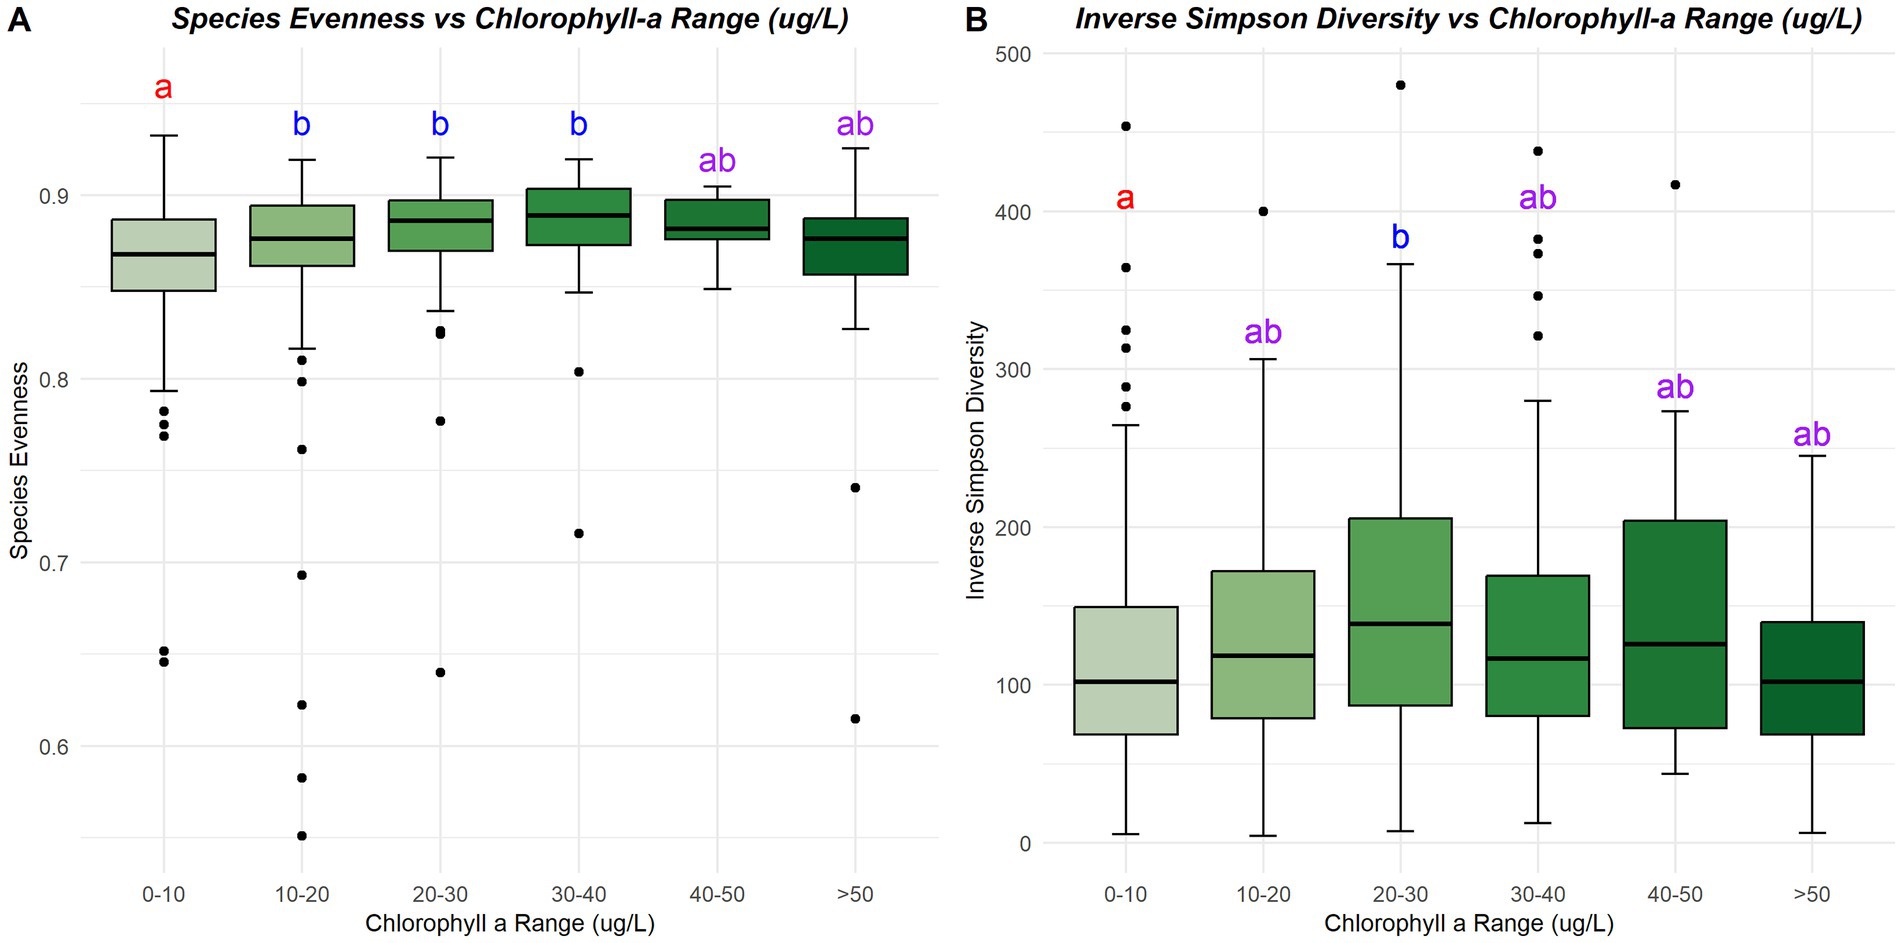
Figure 7. Species evenness (A) and inverse Simpson Diversity index (B) across various ranges of chlorophyll a concentrations (μg/L). Letters and colors represent the significant differences between chlorophyll a concentration ranges; same letter and color indicate no differences and different letters and colors indicate significant differences are present (p < 0.05).
3.5 Beta diversity analyses
Following ANOSIM and PERMANOVA analyses, significant differences in beta diversity appeared between stations (ANOSIM R = 0.1967; p = 0.01) across all sampling years. However, no significant differences were found for year (p = 0.75), season (p = 0.78), month (p = 0.91), or zone (p = 0.19) across the sampling years. Within each year, significant differences did appear by station across each year (year 1, p = 0.001; year 2, p = 0.001; year 3, p = 0.001) and there were significant differences by zone within year 1 (p = 0.001) and year 3 (p = 0.001).
Environmental variables were fitted onto a CCA plot through vectors to show which environmental variables may be driving the differences in the microbial community within the lake or across sampling times and within each year (Figure 8). Across all 3 years, the environmental variables accounted for about 14.47% (adjusted R2 = 0.1447) of the variation within the microbial communities in Lake O and these variables included TN:TP ratio (Pearson R2 = 0.57), pH (Pearson R2 = 0.34), nitrate + nitrite (Pearson R2 = 0.55), dissolved oxygen (Pearson R2 = 0.43), turbidity (Pearson R2 = 0.42), total phosphate (“phosphate.ortho”; Pearson R2 = 0.48), and ammonia (Pearson R2 = 0.34). In year 1, the environmental variables accounted for about 17.44% (adjusted R2 = 0.1744) of the variation within the microbial communities in Lake O and these variables included TN:TP ratio (Pearson R2 = 0.65), pH (Pearson R2 = 0.51), nitrate + nitrite (Pearson R2 = 0.46), dissolved oxygen (Pearson R2 = 0.49), turbidity (Pearson R2 = 0.31), secchi disk depth (Pearson R2 = 0.30), and ammonia (Pearson R2 = 0.60). In year 2, the environmental variables accounted for about 17.26% (adjusted R2 = 0.1726) of the variation within the microbial communities in Lake O and these variables included TN:TP ratio (Pearson R2 = 0.62), pH (Pearson R2 = 0.69), nitrate + nitrite (Pearson R2 = 0.55), dissolved oxygen (Pearson R2 = 0.51), turbidity (Pearson R2 = 0.52), total phosphate (“phosphate.ortho”; Pearson R2 = 0.35), ammonia (Pearson R2 = 0.35), and chl a (Pearson R2 = 0.35). In year 3, the environmental variables accounted for the most variation within the microbial communities in Lake O, about 20.69% (adjusted R2 = 0.2069), and these variables included TN:TP ratio (Pearson R2 = 0.36), nitrate + nitrite (Pearson R2 = 0.67), dissolved oxygen (Pearson R2 = 0.30), alkalinity (Pearson R2 = 0.31), temperature (Pearson R2 = 0.36), total phosphate (“phosphate.ortho”; Pearson R2 = 0.44), Microcystis relative abundance (Pearson R2 = 0.55), and chl a (Pearson R2 = 0.39). Year 1 was the only instance when secchi disk depth influenced microbial community composition (Figure 8B). Total phosphate concentration and chl a concentration were environmental variables shared between year 2 and year 3 that were not included in year 1 that drove microbial community composition (Figures 8C,D, respectively). The environmental variables unique to year 3 in driving the microbial community composition included alkalinity, temperature, and Microcystis abundance (Figure 8D).
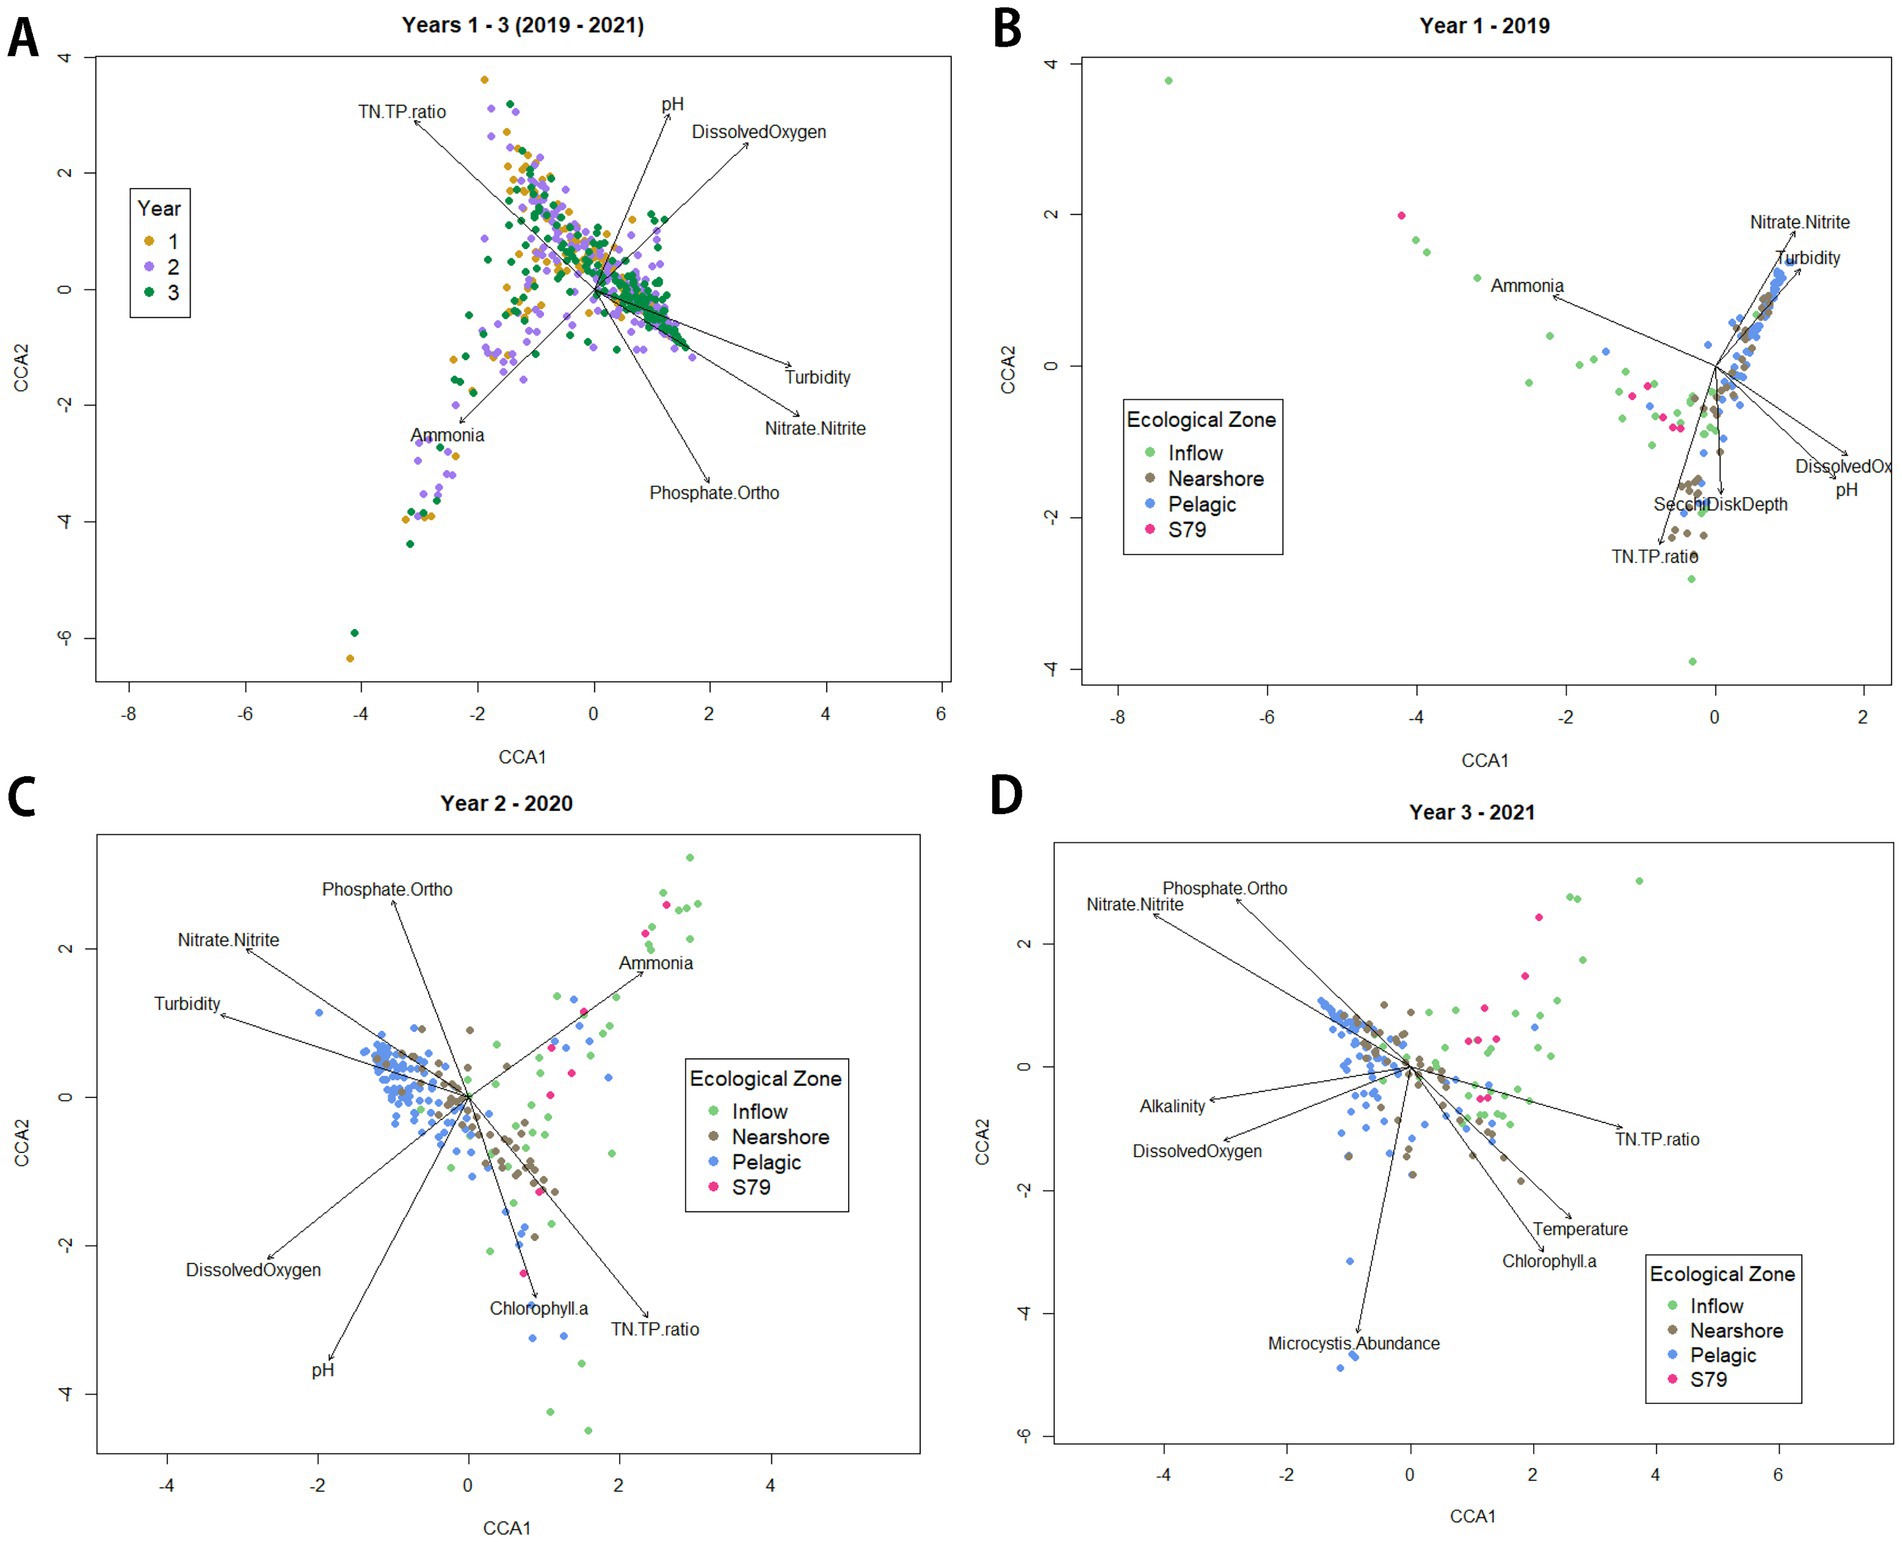
Figure 8. CCA plots based on species composition of each sample over the entire sampling period by year (A) and between each year by ecological zone (B–D). Arrows indicate the direction and magnitude of the environmental variables that showed a significant effect (p < 0.05) and correlation (R2 ≥ 0.3).
The microbial community composition of samples collected during year 3 was closely associated with total phosphate (“phosphate. Ortho”), nitrate + nitrite, and turbidity (Figure 8A). In year 1 and year 3, nearshore and pelagic zones were similar in microbial community composition while inflow and S79 zones were similar in microbial community composition (Figures 8B,D, respectively). In year 1, the microbial community composition of the nearshore and pelagic zones appears influenced mostly by nitrate + nitrite, turbidity, and TN:TP ratio, while the communities of the inflow and S79 zones were driven mostly by ammonia (Figure 8B). In year 3, the microbial community composition of the nearshore and pelagic zones was driven by nitrate + nitrite, total phosphate, Microcystis abundance, chl a, and temperature. The microbial community composition of the inflow and S79, however, does not seem to be driven primarily by any of the environmental factors shown in the plot (Figure 8D). Year 2 had significant differences between stations and no significant differences between zones. However, each station is located within a certain ecological zone in the lake. Thus, to better interpret the station plot, the zone plot will be used. The stations located in the nearshore and pelagic zones were clustered together and mostly driven by nitrate + nitrite concentrations, turbidity, with TN:TP ratio also driving microbial community within the nearshore zone (Figure 8C). Stations located in the inflow and S79 zones were also clustered together, but there were some stations from the pelagic and inflow zones that were driven by the same environmental variables (chl a, TN:TP ratio, and ammonia) (Figure 8C).
3.6 Environmental variables over the sampling period
To provide context for microbial community analyses, selected environmental variables were plotted against the sampling period by month (Figures 9–12). The only environmental variable that remained relatively constant with minor changes across the sampling period was pH (Figures 10A–C). However, several instances of lower pH occurred within year 2 and year 3 during the late summer to winter months (7–12) (Figures 10B,C). TN:TP ratio and nitrate + nitrite concentration showed some seasonal changes (Figures 11D–F, 12G–I, respectively). TN:TP ratio showed a decrease during spring months (3–5) and began to increase into the summer months (6–7) across all 3 years. Year 1 experienced instances of the highest TN: TP ratio compared to year 2 and year 3 (Figures 12G–I). Nitrate + nitrite concentrations showed an overall decrease in concentration during the summer months into early fall months (6–9) (Figures 11D–F). Year 2 experienced several instances of the highest concentration of nitrate + nitrite compared to year 1 and year 3 (Figure 11E).
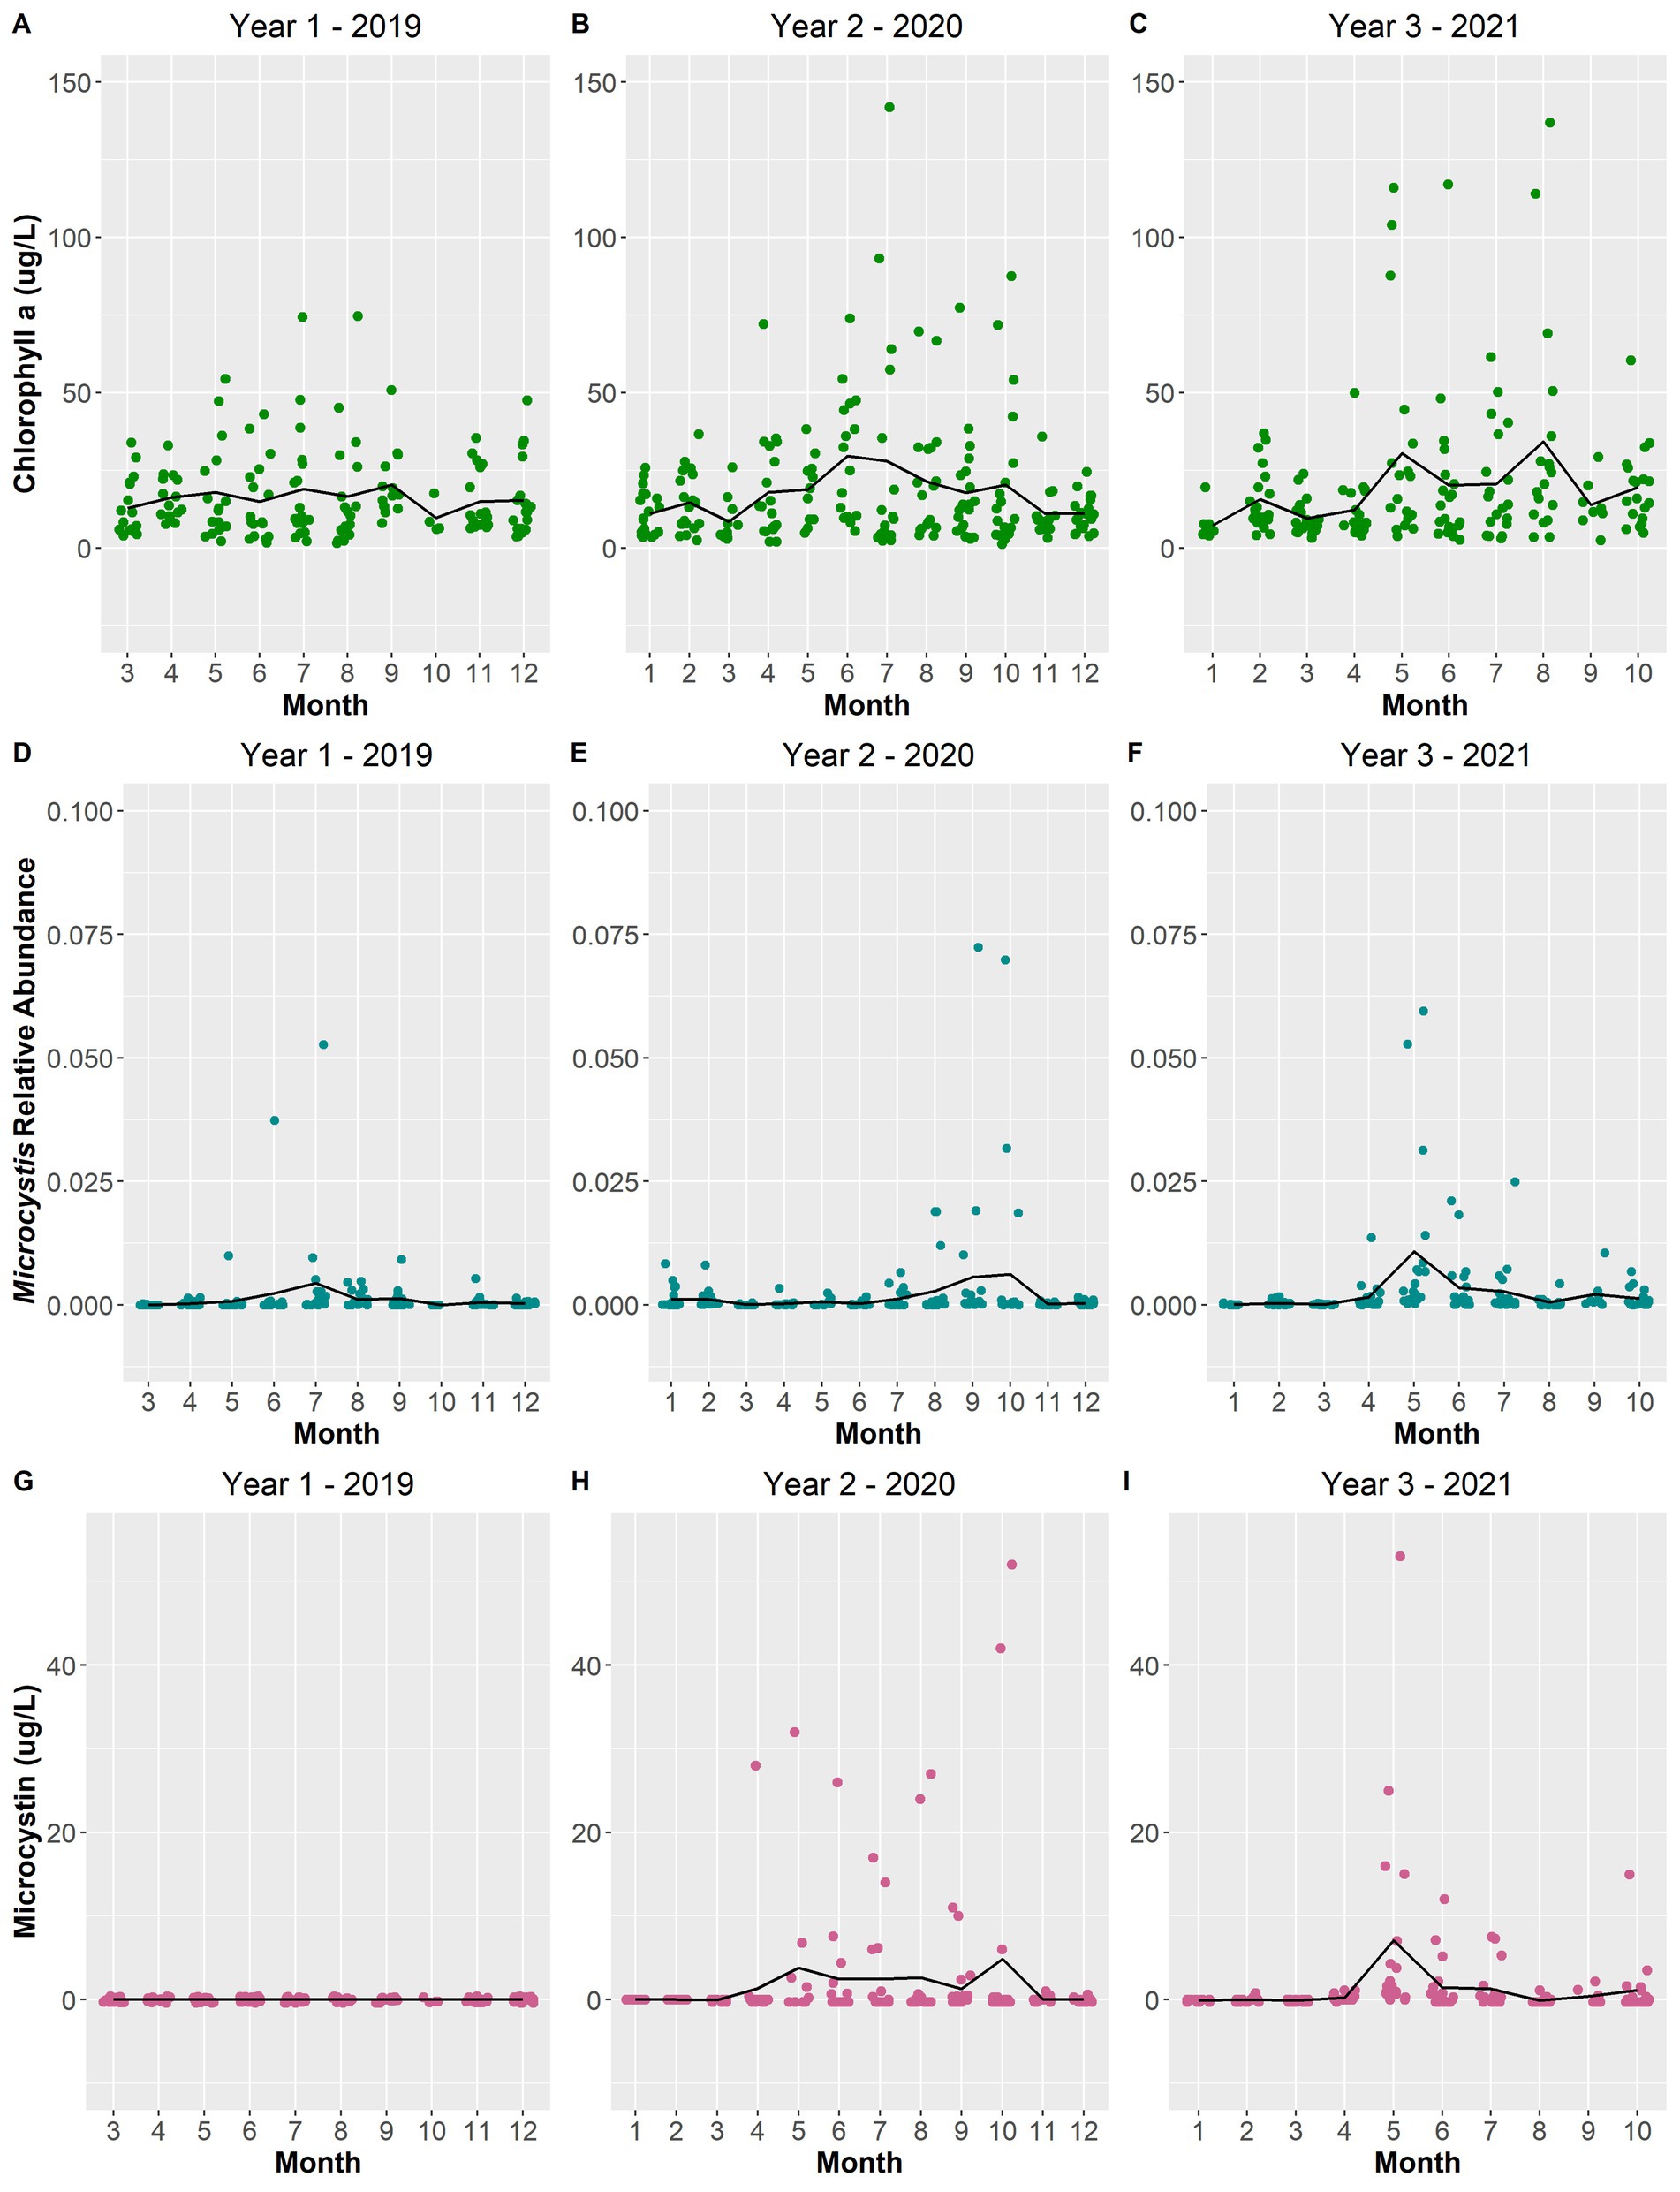
Figure 9. Scatterplot of total chlorophyll a concentration (μg/L) (A–C), Microcystis relative abundance (D–F), and microcystin concentration (μg/L) (G–I) over the sampling period. The black line depicts the averages per month across the years.
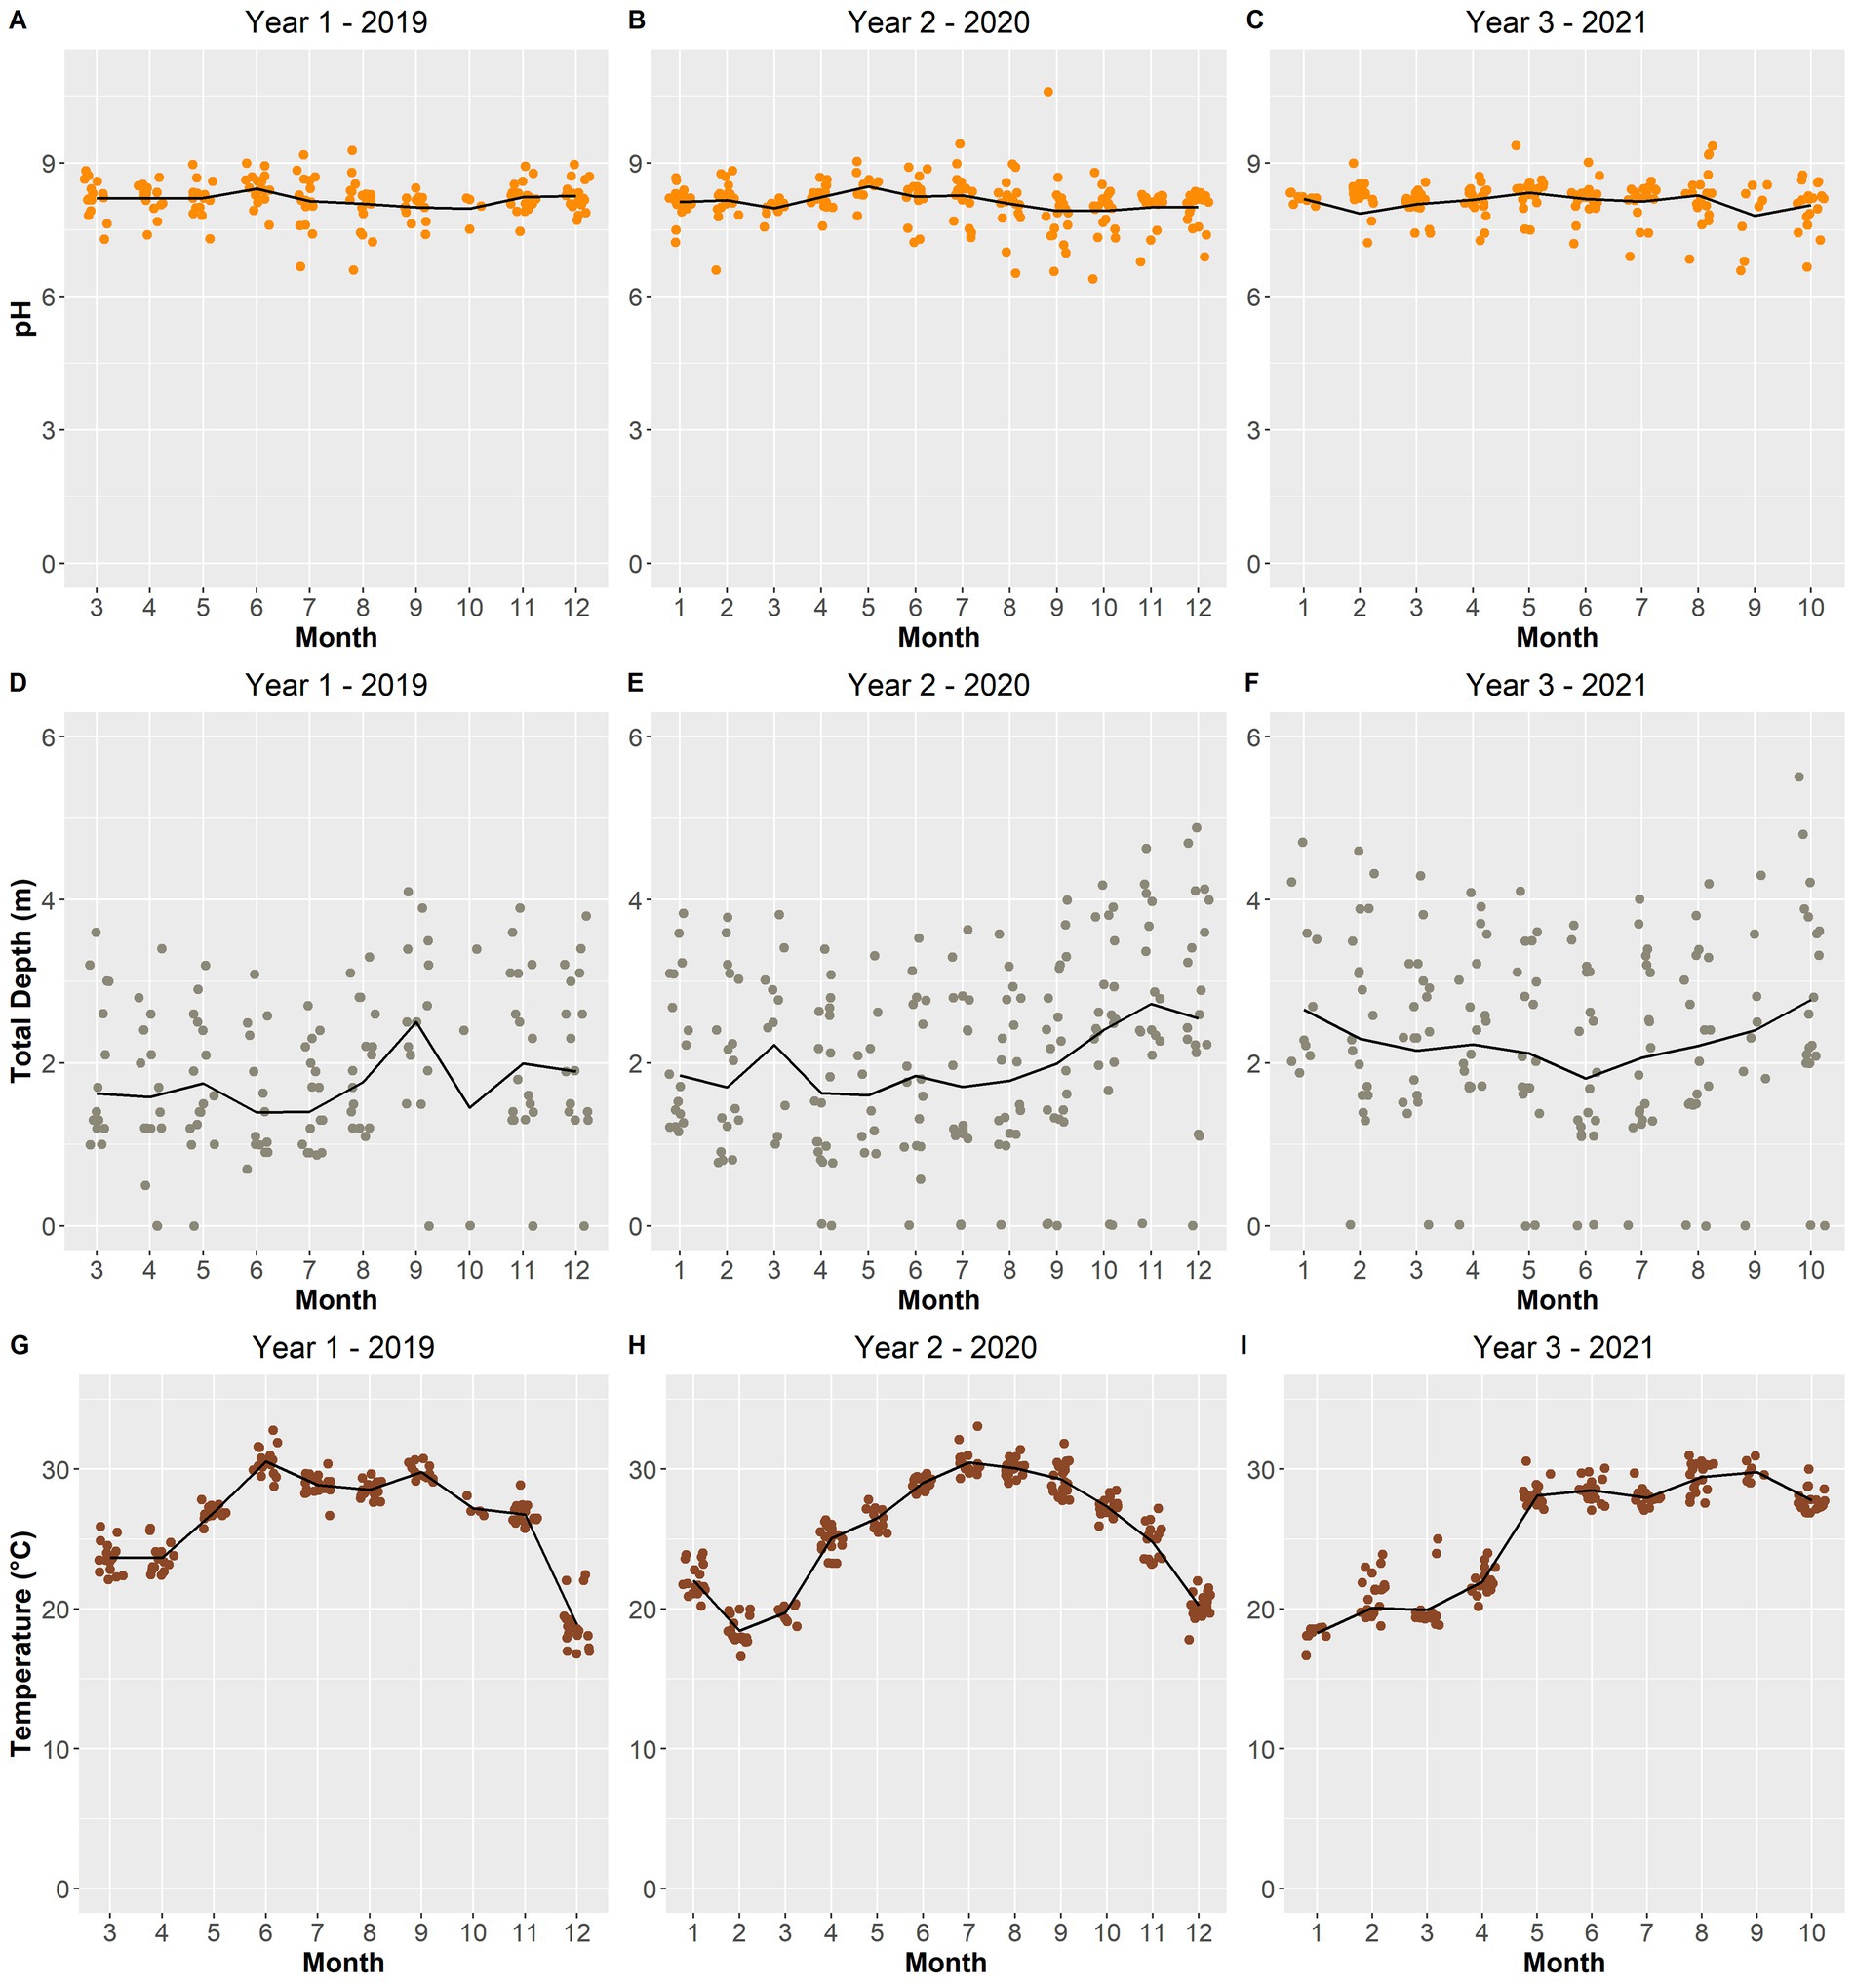
Figure 10. Scatterplot of surface water pH (A–C), total depth (m) (D–F), and surface water temperature (°C) (G–I) of the lake over the sampling period. The black line depicts the averages per month across the years.
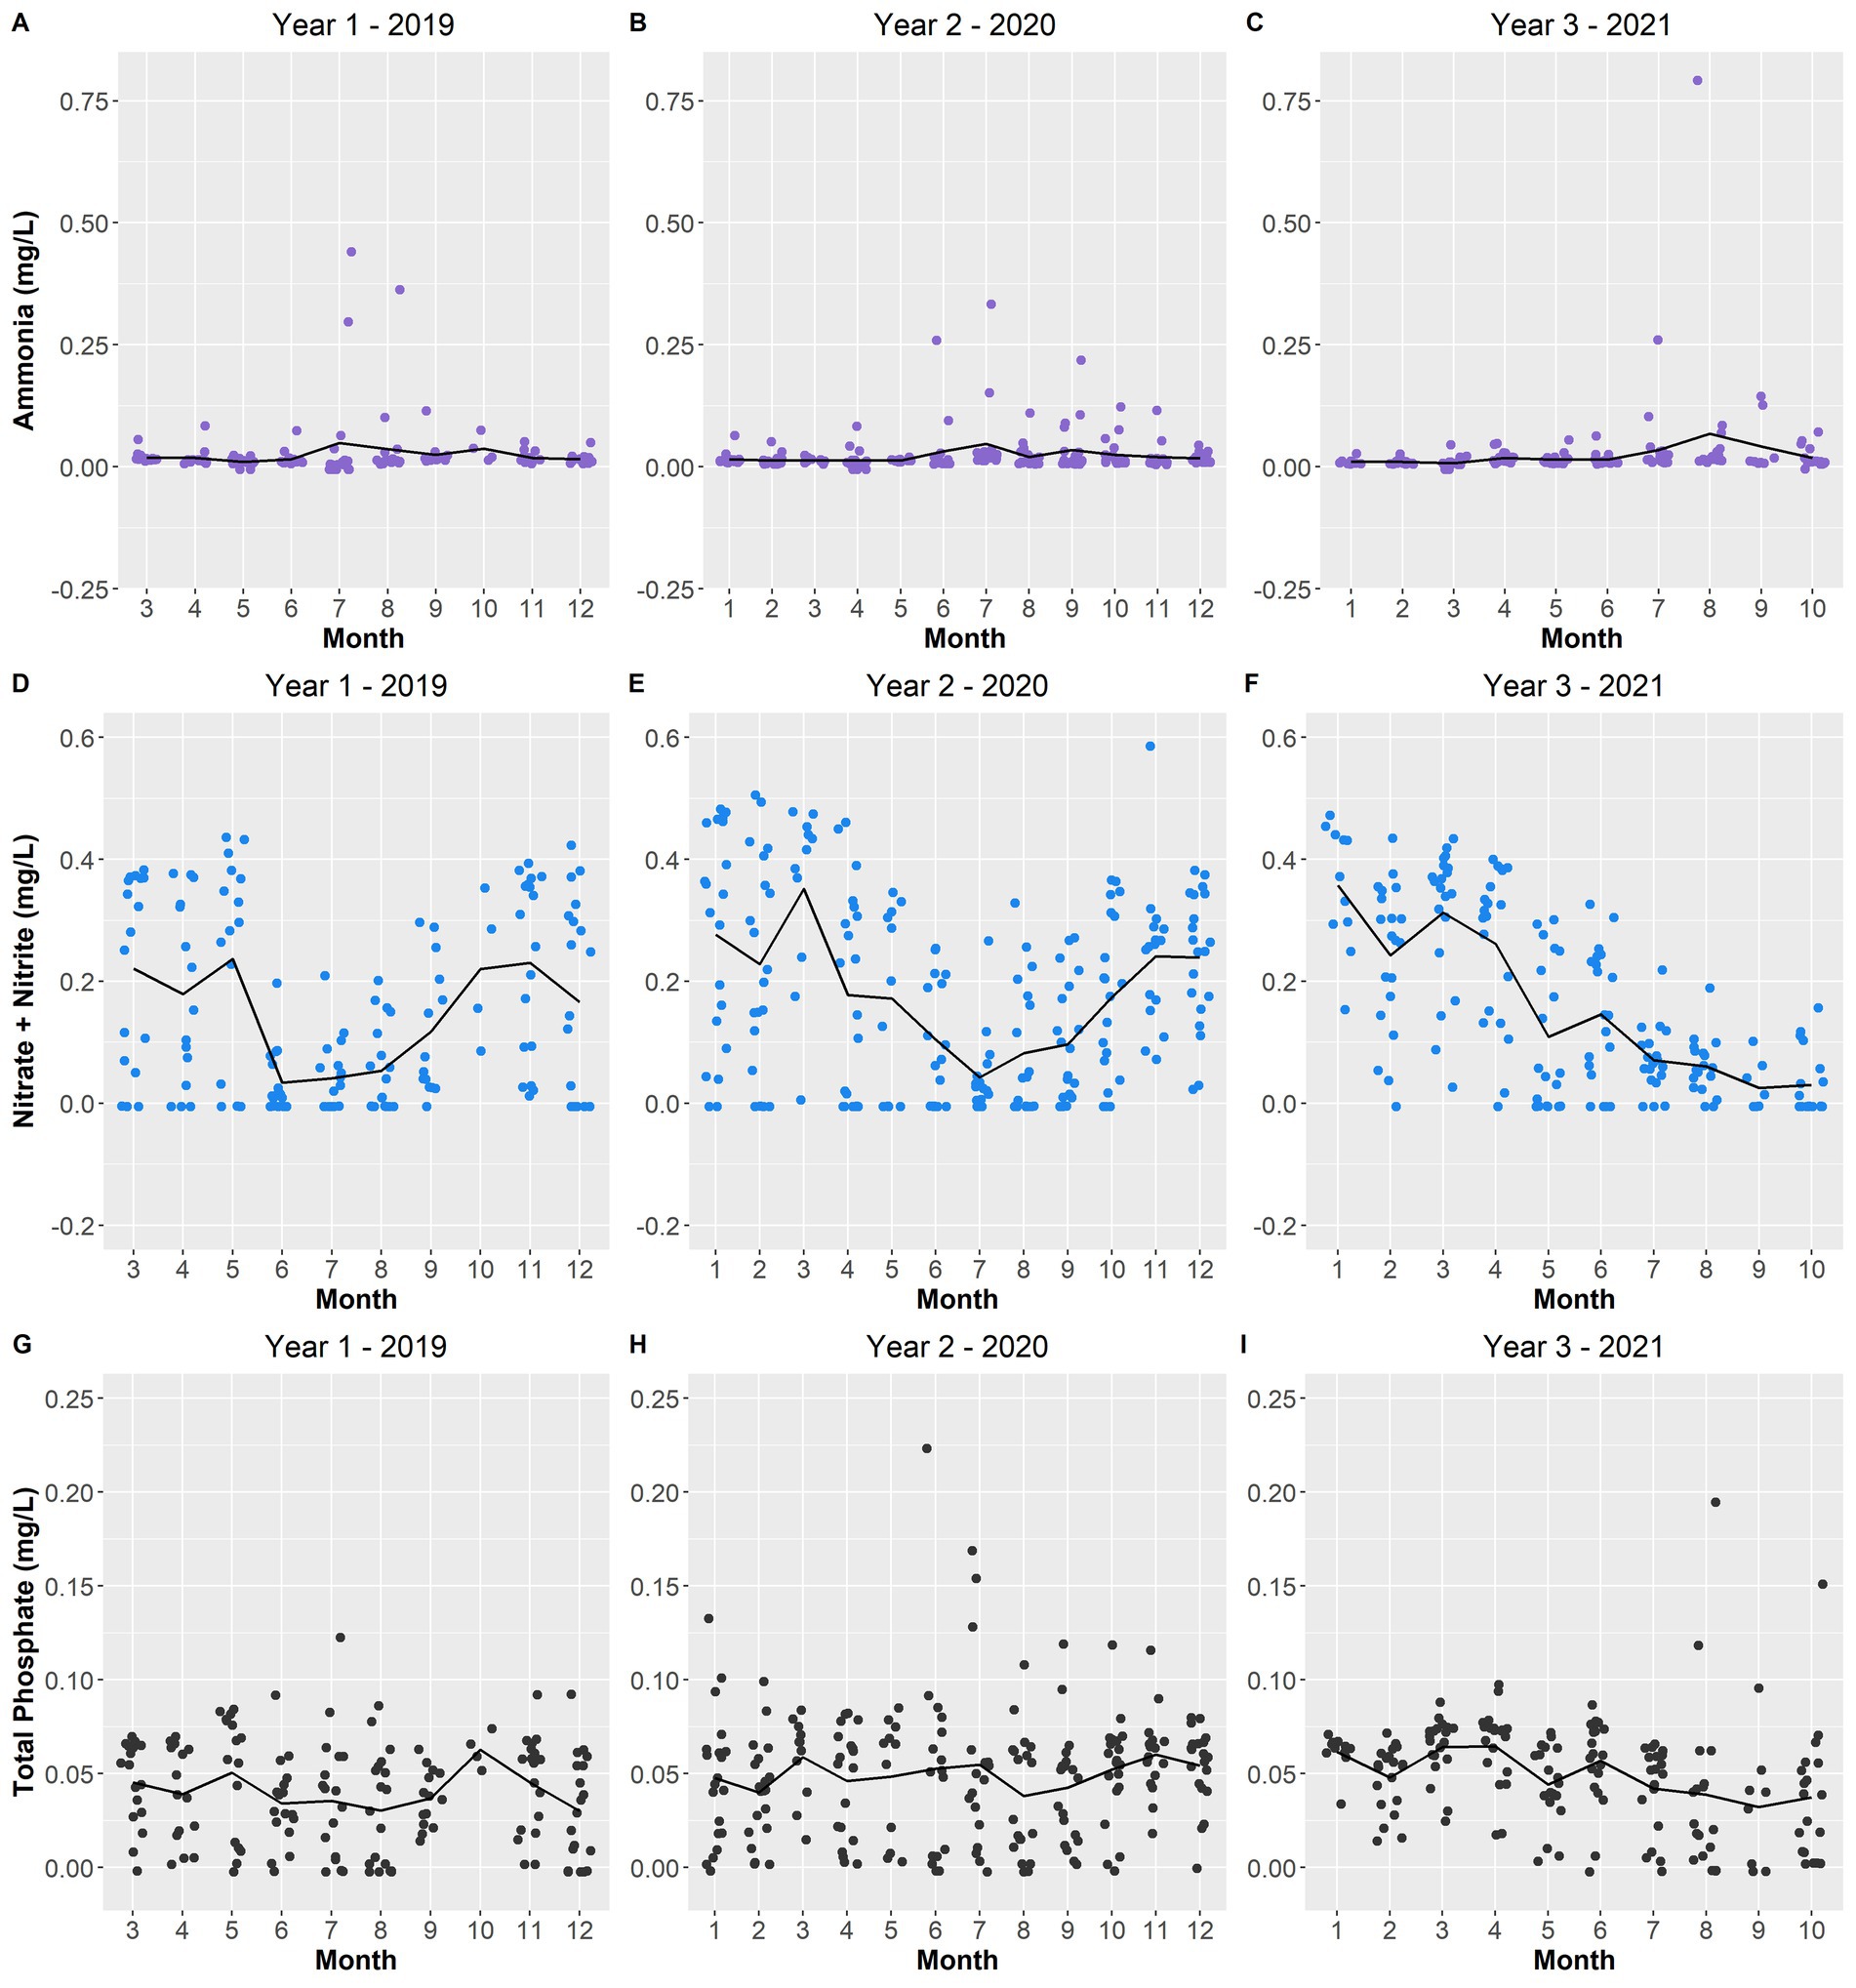
Figure 11. Scatterplot of ammonia (A–C), nitrate + nitrite (D–F), and total phosphate concentration (mg/L) (G–I), over the sampling period. The black line depicts the averages per month across the years.
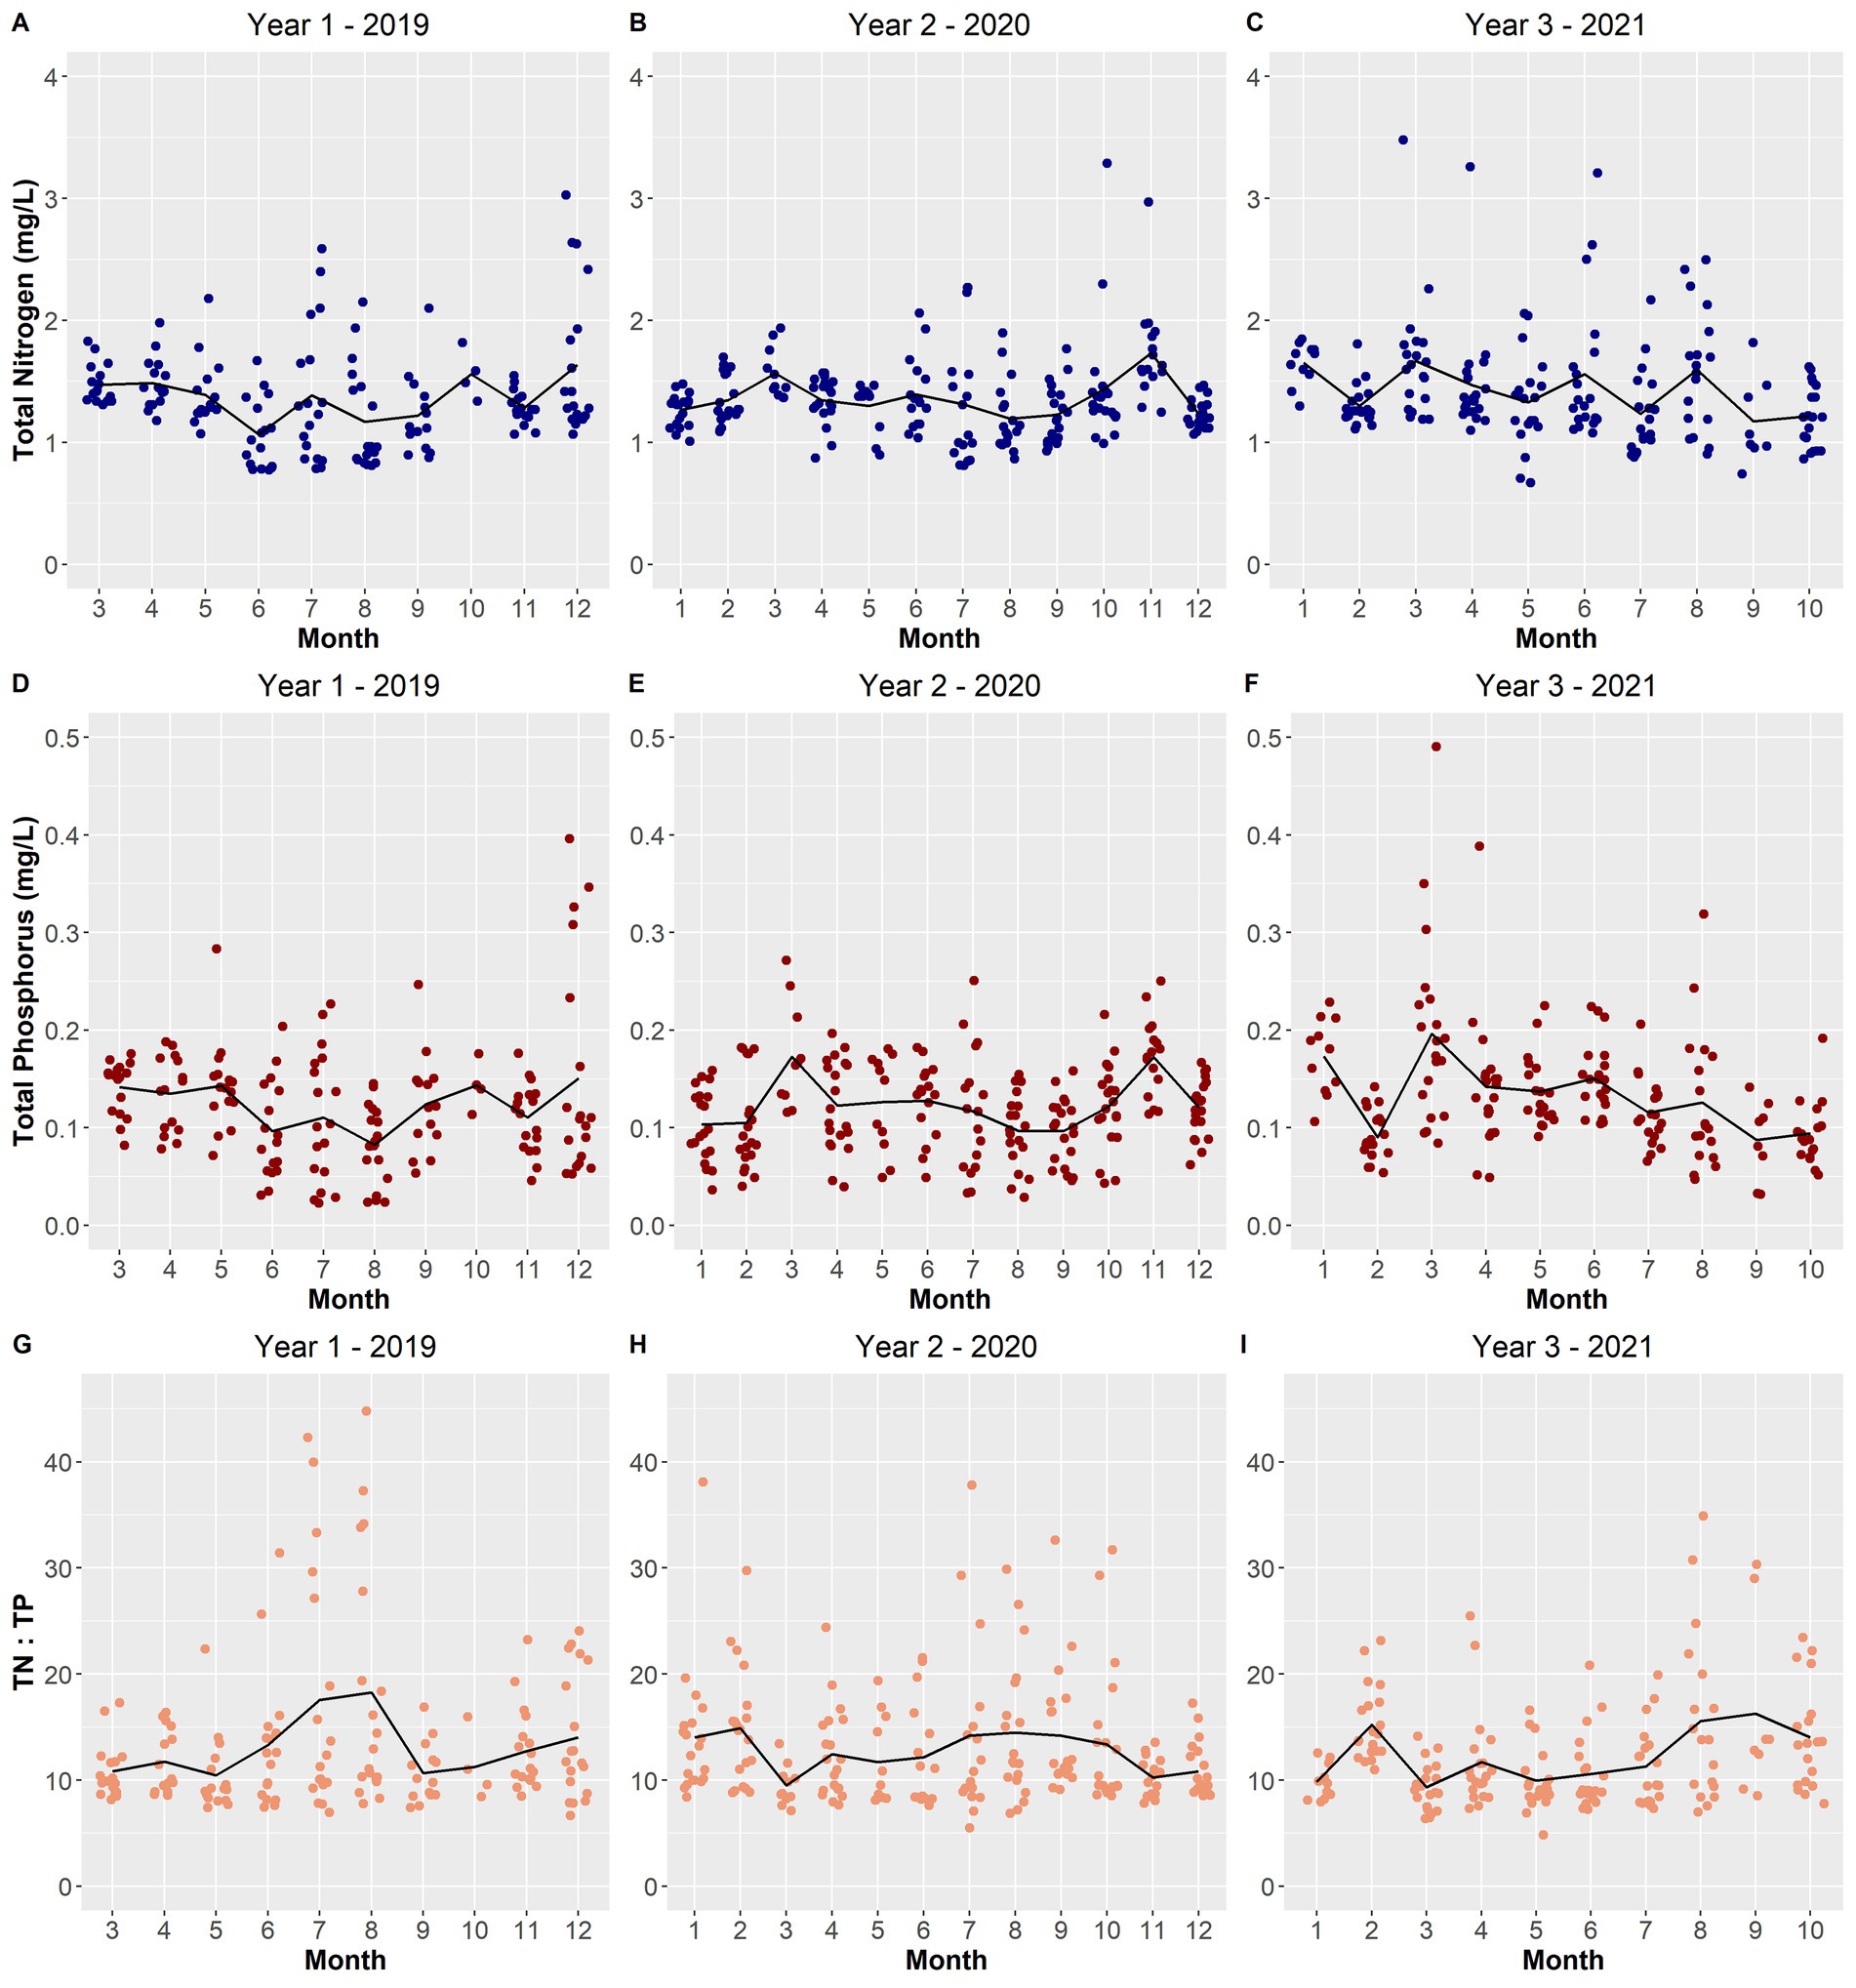
Figure 12. Scatterplot of total nitrogen concentrations (mg/L) (A–C), total phosphorus concentrations (mg/L) (D–F), and the ratio between them (G–I) over the sampling period. The black line depicts the averages per month across the years.
Most of the remaining selected environmental variables displayed changes from year-to-year. The total depth of Lake O was lower in year 1 while year 2 and year 3 experienced increasing average depths (Figures 10D–F). Year 1 and year 3 experienced warmer average surface water temperatures for a longer period compared to year 2, which exhibited a smoother transition between water temperature gradients across months (Figures 10G–I). Ammonia concentrations remained constant in year 1, with only three instances being substantially higher than average (Figure 11A). Year 3 also portrayed the same pattern; however, there was only one instance where the concentration was substantially above average (Figure 11C). Year 2 showed the most instances that were above average concentrations compared to the other two years (Figure 11B). Both Microcystis relative abundance and microcystin concentration were higher during year 2 and year 3 and lowest during year 1 (Figures 9D–I). Chl a concentration exhibited the same pattern—with year 1 exhibiting lower concentrations than year 2 and year 3 (Figures 9A–C). Year 1 and year 3 exhibited an unstable increase–decrease cycle in total nitrogen concentration across the monthly averages, while year 2 experienced only two increase averages during March and November (Figures 12A–C). Total phosphorus also experienced this pattern in concentration (Figures 12D–F). The average concentration of total phosphate stayed within the same range across the years until it began to decrease during July of year 3 (Figures 11G–I).
4 Discussion
Most of the cyanoHAB research conducted on Lake Okeechobee (Lake O) primarily focuses on bloom management via the control of nutrients going into the lake. However, a growing amount of research suggests that nutrient levels may not be the only factor influencing these blooms to occur so frequently (Wilhelm et al., 2020). There have not been many studies done on Lake O that assess how these cyanoHABs are affecting the other microbial communities within the lake during these blooms or how these other microbes could be influencing the blooms.
4.1 Microbial community diversity patterns
This study has found that the diversity of microbial communities in Lake O is affected by the occurrence of Microcystis, one of the main cyanobacteria genera causing cyanoHABs both in Lake O and around the world. Both species evenness and alpha diversity metrics (Shannon and inverse Simpson) were found to decrease as microcystin concentrations and Microcystis relative abundance increase, especially during cyanoHAB events. This result was expected as cyanoHAB conditions typically lead to a dominance of the blooming cyanobacteria and correlating species, thus reducing the overall diversity and evenness of species in the affected area. Additionally, the rise in microcystin concentrations acts as a selective pressure on the microbes that are in the vicinity of the bloom, shifting the microbial community composition toward bacterial taxa that are resistant to the toxins. These resistant bacterial communities contain certain functional pathways that allow them to outcompete other microbes during a bloom event including nitrogen cycling, phosphorus cycling, carbon cycling, and sulfur cycling, fatty acid metabolism, and vitamin biosynthesis (Krausfeldt et al., 2024). Although there were both temporal and spatial differences in microbial community diversity, more significant differences were found spatially between monitoring stations and ecological zones within all 3 years and between each year. There was obvious grouping among samples based on the ecological zones of the lake: the inflow zone samples were always coupled with the zone S79 samples, and the pelagic zone samples were always coupled with the nearshore zone samples, suggesting that these couples have similar microbial community composition. Although these zones exhibit differing physiochemical properties, these zones do not have clearly defined physical borders between them, resulting in dynamic spatial ranges (Krausfeldt et al., 2024). Within this study, year 2 showed no significant differences between zones when year 1 and year 3 showed significant differences. To further explore this, meteorological, nutrient load, and discharge data would need to be collected and analyzed to explore the potential microbial community homogenization that could be occurring within the lake. Due to absence of this data during this study, further exploration would need to be conducted to support this claim during the time of this study.
4.2 Microbial taxa outliers in Lake Okeechobee
The taxonomic make-up of Lake O was dominated primarily by four common bacterial phyla: Proteobacteria, Bacteroidota, Cyanobacteria, and Actinobacteriota (Supplementary Figure S2). These phyla appeared to change in distribution, along with the less-dominant taxa present, both temporally and spatially. However, there were some phyla that were irregular in both their distribution around the lake and their presence across the years. In year 1, phylum SAR324 (marine_clade group B) appeared in the top phyla of only two stations within Lake O and was found in no other year. SAR324 is a novel phylum that has been recently classified as its own phylum after initially being classified as “marine_clade group B” under the phylum Deltaproteobacteria (Malfertheiner et al., 2022; Parks et al., 2018; Pommier et al., 2005). SAR324 is known to be present only in marine environments; however, Malfertheiner et al. (2022) discovered that this phylum can also be found in terrestrial aquifers. Lake O is subjected to the risk of saltwater intrusion (Prinos, 2016; Barlow and Reichard, 2010)—the movement of seawater into freshwater aquifers—due to the water level being heavily managed. The SFWMD stated that saltwater intrusion is at a higher risk of occurring in Lake O starting at a depth of 10½ feet (or 3.2 meters) and compromising the Caloosahatchee lock at a starting depth of 9½ feet (or 2.9 meters) (SFWMD, “Impacts of Operating Lake Okeechobee at Lower Water Levels’”). Yet, throughout the majority of 2019, the total depth of Lake O was sustained between about 1 and 3 meters (3.3 feet and 9.8 feet). These conditions put Lake O in the position of a sustained high risk of saltwater intrusion, especially at the Caloosahatchee River lock (station S79) where SAR324 appears as one of the dominant taxa (Supplementary Figure S5A).
Phylum Armatimonadota appeared in year 2 as part of the top phyla at station KISSR0.0, which is located in the inflow zone and the mouth of the Kissimmee River (Supplementary Figure S4B). Genomic sequences of Armatimonadota were isolated from a variety of environments such as aerobic and anaerobic wastewater treatment processes, contaminated and uncontaminated soil and sediments (Im et al., 2012). Lake O and its connecting rivers—including St. Lucie, Kissimmee, and Caloosahatchee—are experiencing nutrient pollution due to agricultural and urban land runoff. Between 2019 and 2020, there was an increase in the average concentrations of total phosphate, total nitrogen, nitrate + nitrite, and total phosphorus (Figures 11, 12). Thus, the presence of this phylum may reflect the shift in nutrient loads from runoff into the lake.
An additional phylum, Patescibacteria, appeared only in 2021 at two stations, L004 and L006, within the lake (Supplementary Figure S4C). Patescibacteria inhabit a range of environments including groundwater and other aquifer environments, freshwater sediments, and deep-sea sediments (Herrmann et al., 2019; Proctor et al., 2018; Léon-Zayas et al., 2017; Luef et al., 2015; Brown et al., 2015). In Lake O, Patescibacteria were found only at two stations, L004 and L006, both of which are in the pelagic zone of the lake. The pelagic zone is the deepest part of the lake but also experiences the most turbidity due to sediment resuspension (Krausfeldt et al., 2024). It is this sediment resuspension that could allow this phylum to be collected in surface waters. The phylum Myxococcota was the only phylum that did not appear the top phylum in year 2 but appeared in years 1 and 3 (Supplementary Figure S5). Once classified within Deltaproteobacteria, Myxococcota became its own phylum in 2020 when Waite et al. (2020) acknowledged that it should be recognized as its own phylum due to its distinct phylogenetic and functional characteristics. These bacteria are known to be predatory bacteria that use a combination of epibiotic strategies and secondary metabolites to lyse the cells of their prey (Murphy et al., 2021). Majority of the species found within Myxococcota are associated with soil formation (Murphy et al., 2021). However, recent studies have found that this bacterial phylum provides a wide range of ecosystem roles such as stabilizing microbial ecosystems, carbon and sulfur cycling, and metabolite biosynthesis, especially in mangrove and wetland ecosystems (Zou et al., 2024; Kurashita et al., 2024; Padfield et al., 2024).
Abundances of a few bacterial taxa appeared to change across various chl a concentrations both temporally and spatially. As suspected, there was an increase in the abundance of cyanobacterial populations, including the genus Microcystis, as chl a concentration increased. Despite both Microcystis and other cyanobacterial taxa abundances increasing with increasing chl a concentration, there were fluctuations with the abundance of other cyanobacterial taxa like Cyanobium species according to the abundance of Microcystis. Within the heterotrophic bacterial community, the abundance of families Gemmatimonadaceae, Ilumatobacteraceae, and Nitrosopumilaceae appeared to decrease as chl a concentration increased. CyanoHABs caused by Microcystis alter pH and oxygen levels, as well as introduce toxins (i.e., microcystins) within the water column. During cyanobacteria bloom decomposition, certain taxon abundances can vary based on the fluctuating environmental conditions (Wilhelm et al., 2020). For example, aerobic bacterial species, like those found within the families Gemmatimonadaceae and Illumatobacteraceae, would be negatively impacted by the decrease in dissolved oxygen during bloom decomposition. Nitrosopumilaceae, an ammonia-oxidizing bacterial family, would also decrease in abundance as the Microcystis bloom outcompetes them for available ammonium in the water column (Donald et al., 2011). Additionally, the presence of microcystins produced from these blooms inhibits the growth of sensitive bacterial taxa, in turn, reducing their abundances as the bloom decomposes (Gobler and Jankowiak, 2022; Paerl and Otten, 2013).
4.3 Bacterial co-occurrences with Microcystis
Microcystis blooms can be influenced by abiotic factors such as environmental variables and nutrient inputs of freshwater ecosystems. There has been increasing interest in the role of the heterotrophic bacterial community in the aggregation and proliferation of the cyanobacterial colonies and how they could be maintaining cyanobacterial harmful algal blooms (cyanoHABs) created by Microcystis. Studies have shown that there are heterotrophic bacteria that live within and around Microcystis colonies, with either mutualistic, commensal, or antagonistic effects (Tu et al., 2019; Shen et al., 2011; Shi et al., 2009; Maruyama et al., 2003; Imamura et al., 2001). As mentioned previously, several results in this study suggested that Microcystis can alter the microbial community of Lake O through cyanoHABs. Both Microcystis and its related toxin, microcystin, showed strong negative correlations to species evenness and species diversity (Figure 8). In year 3—the year with the most intense blooms of the entire sampling period—Microcystis appeared as one of the strongest correlated variables, along with other environmental variables, which drove variation in the microbial communities in Lake O (Figure 11D). After revealing that Microcystis can alter microbial communities in the lake, a co-occurrence network was created to determine what other bacteria appeared with Microcystis. The co-occurrence network showed 22 significantly strong positive correlations between Microcystis and other heterotrophic bacteria; with two exceptions being cyanobacteria (Pseudanabaena_PCC-7429 and Snowella_OTU37S04) (Figure 4). Although some negative correlations did exist between Microcystis and other bacteria, their relationships were not strong enough to consider them as strong negative correlations (R2 = −0.7 or less).
Bradymonadales belongs to phylum Desulfobacterota and are predatory bacteria. Mu et al. (2020) found that Bradymonadales displays unique living strategies that apply a novel method of predation: a transition between obligate and facultative predation. Bradymonadales primarily prey on bacteria from the phyla Bacteroidetes, Flavobacteria, and Proteobacteria. Few prey species of Bradymonadales have been discovered including the coral pathogen Vibrio harveyi (Welsh et al., 2016), and various multi-drug-resistant pathogens such as Klebsiella pneumoniae, Pseudamonas aeruginosa, and Vibrio vulnificus (Gong et al., 2022). Interestingly, 11 of the 22 co-occurring bacteria with Microcystis belong to the phylum Proteobacteria with an additional two belonging to Bacteroidetes and Flavobacteria. Thus, Bradymonadales may utilize Microcystis colonies during the blooms as a feeding ground for its prey items. Bdellovibrio is another predatory bacterial genus that was seen to co-exist with Microcystis in Lake O. The species of Bdellovibrio found to cooccur with Microcystis in this study, Bdellovibrio exovorus, belongs to a group of like predatory bacteria known as Bdellovibrio and like organisms (BALOs) (Ezzedine et al., 2022). BALOs were the first records of predatory bacteria and continue to be used as a baseline for the discovery of novel predatory bacteria like Bradymonadales. Similar to Bradymonadales, B. exovorus are also obligatory predators that prey primarily on other Proteobacteria. However, it is important to note that some species of BALOs have been found to kill cyanobacterial cells. Caiola and Pellegrini (1984) found that BALOs were able to lyse Microcystis aeruginosa cells via penetration and proposed that these and other algicidal bacteria could be the reason for the dying out of cyanobacteria bloom events. Although not typically co-occurring with Microcystis, the order Silvanigrellales (Phylum Bdellovibrionota) was found in the top 20 orders of only year 1 of this study. While majority of the species were found to be uncultured under this order, the bacterial pathogen, Spirobacillus cienkowskii should be noted. This species largely infects zooplankton in lakes and increases the chances for the infected zooplankton to be eaten by predators due to their ability to change the color of the infected zooplankton (Wale et al., 2024).
Another interesting set of taxa that was highly correlated with Microcystis is the genera env.OP_17 and Silanimonas. env.OP_17 lacks much basic information; however, it is part of the order Sphingobacteriales and this order is known to be potential algicidal bacteria that favors the uptake of cyanobacterial excretions and decaying material (Mankiewicz-Boczek and Font-Najera, 2022). Furthermore, Mankiewicz-Boczek and Font-Najera (2022) found that env.OP_17 increased in abundance after a bloom, suggesting that this taxon takes a “cleanup” role once a cyanoHAB dies out. Silanimonas, one of the bacteria with the strongest correlation to Microcystis, is a recently discovered genus that was isolated from natural Microcystis colonies by Chun et al. (2017). A later study found that these bacteria possess the mlr gene cluster, genes that are seen in microcystin-degrading bacteria (Yancey et al., 2022; Mankiewicz-Boczek and Font-Najera, 2022). Though this study presented results focused primarily on the highly correlated relationships between other bacteria and Microcystis in Lake O, there was another bacterial genus, Streptomyces, that is known to exhibit algicidal activity toward Microcystis that was present in microbial community of Lake O (Zhang et al., 2023). On the contrary, the genus Phenylobacterium—another taxon that was found with a high correlation with Microcystis (Figure 4)—was found to aid in the growth and dominance of toxic Microcystis strains during cyanoHAB events. As mentioned previously, both toxic and non-toxic bloom-forming strains of Microcystis exist, and a study conducted by Zuo et al. (2021) revealed that Phenylobacterium was one of the few genera that strongly positively co-existed with toxic strains of Microcystis. This investigation found that there were three strains of Phenylobacterium that promoted the growth of these toxic strains of Microcystis, suggesting that Phenylobacterium may be a heterotrophic bacterium that could be aiding in the longevity of these blooms (Zuo et al., 2021). Unfortunately, there needs to be further investigation into the mechanisms by which Phenylobacterium interact with these toxic strains of Microcystis that allow Microcystis to remain dominant throughout the cyanoHAB event.
Two phototrophic cyanobacterial taxa shared strong positive correlations with Microcystis, genera Pseudanabaena_PCC-7429 and Snowella_OTU37S04. Pseudanabaena is an epiphytic cyanobacterium that is commonly found embedded within or attached to the mucilaginous sheath of Microcystis colonies (Li et al., 2020). Both taxa are frequently observed to be highly correlated during cyanoHABs, and this study also provides evidence of this pattern (Li et al., 2020; Berry et al., 2017; Ilhe, 2008). In the 1980s, Pseudanabaena was primarily described as a parasitic organism to Microcystis colonies (Chang, 1985). In 2016, Agha et al. (2016) directly investigated these interactions between Pseudanabaena and Microcystis and discovered that Pseudanabaena is selective on the mucilage structure of Microcystis species. They also discovered that Pseudanabaena is detrimental to Microcystis colonies both directly via cell lysis and indirectly via cell sedimentation. Thus, it may be possible that Pseudanabaena may also contribute to the dying stage of cyanoHAB events. Conversely, although the genus Snowella was also found to be highly correlated to Microcystis in a previous study, not much is known about their ecology and their interaction with Microcystis (Mankiewicz-Boczek and Font-Najera, 2022).
Over the last two decades, there has been increased interest as to how the microbial community aids in the recovery of freshwater environments from the toxic effects of cyanoHABs. One key role microbes likely play in recovery is through the biodegradation of the microcystins that are released in the water during bloom events. These toxin degraders may be important regulators of microbial communities and element cycling during and after bloom events (Lezcano et al., 2017; Manage et al., 2009). Manage et al. (2009) found that, in addition to the heterotrophic bacteria found in the phylum Proteobacteria (Sphingomonas sp.), there are other heterotrophic bacterial taxa found in the phylum Actinobacteria that degrade microcystins including Arthrobacter sp., Brevibacterium sp., and Rhodococcus sp., all of which were also found in low abundance in this study. Additionally, Massey and Yang (2020) provided an overview of the various heterotrophic bacterial taxa that may aid in the degradation of the numerous variants of microcystins, most of which were also present in this study. Among these taxa was the genus Cupriavidus sp. which was found to be strongly associated with the presence of Microcystis in this study (Figure 4). This evidence demonstrates the value of identifying and characterizing the toxin-degrading bacteria that reside in Lake Okeechobee, as it may provide new strategies for the biological management of the cyanoHABs in this important freshwater ecosystem.
4.4 Abiotic factors influencing Microcystis in Lake O
While it is important to investigate how biotic factors, such as the interactions between the blooming cyanobacteria and other microbes, influence cyanoHABs, there is substantial evidence that show how abiotic factors influence cyanoHABs, and vice versa, from blooms occurring worldwide. During this study, in addition to characterizing the microbial community of the lake, certain environmental variables were also collected to determine how these variables could be influencing these blooms along with the microbial community. Over the three sampling years of this study (2019–2021), bloom intensity and longevity increased. The peak average relative abundance of Microcystis and the average concentration of microcystin could be seen increasing over the years, with year 3 (2021) experiencing the highest abundance and concentration (Figures 9F,I, respectively). These changes were likely influenced by environmental conditions within 2021 that may have contributed to the increase in bloom intensity. For instance, 2021 had warmer average temperatures and a lower TN:TP ratio during the months (May to July) that blooms occurred (Figures 10I, 12I, respectively). Xie et al. (2003) uncovered that when Microcystis populations were exposed to sufficient amounts of nitrogen (N) but differing amounts of phosphorus (P), Microcystis blooms occurred only in environments with higher P concentrations. However, as these blooms progressed, both N and P concentrations declined, hence resulting in lower TN:TP ratios. Therefore, as an increase in temperature influences the growth of Microcystis blooms, there is a decrease in TN:TP ratio due to the increased use of the nutrients in the water column.
Numerous studies have shown that cyanobacteria favor higher temperatures thus increasing their growth rates during warmer periods of the year (Wilhelm et al., 2020; Paerl and Huisman, 2008; Jöhnk et al., 2008; Reynolds, 2006). In general, higher temperatures, those above 25 °C, promote the growth of cyanobacteria (Paerl and Huisman, 2008; Jöhnk et al., 2008; Reynolds, 2006). This relationship was further demonstrated by the significant positive correlations found between temperature and both Microcystis relative abundance and microcystin concentration (Figure 5). When temperatures increase, the water column becomes more stable and stratified since the increase in temperature weakens the amount of vertical mixing in the water column (Paerl and Huisman, 2008; Paerl and Fulton, 2006; Reynolds, 2006; Huisman et al., 2005). Microcystis aeruginosa, the dominant bloom-forming cyanobacteria species in Lake O, can take advantage of these more stratified conditions using their gas vesicles. The gas vesicles formed by M. aeruginosa give them the buoyancy they need to effectively migrate through the water column during favorable conditions, such as elevated temperatures and increased light availability (Dick, 2021; Huisman et al., 2018; Komárek, 2003). This buoyancy also provides M. aeruginosa the ability to form “mats” of biomass at the surface of the water; hence, cyanoHAB events tend to increase in frequency in the summer (You et al., 2017; Litchman et al., 2010). In 2021, temperatures reached between 25 °C and 30 °C each month from May through to September (Figure 3)—around the same months where microcystin concentrations and Microcystis relative abundances were the highest (Figure 2).
pH is also known to be a factor associated with Microcystis blooms. The importance of pH was made evident when it was included as an environmental factor driving differences in the microbial community composition across the sampling period (Figure 11). Additionally, pH demonstrated a significant positive correlation to microcystin concentration (Figure 5). During a dense bloom, the cyanobacteria rapidly consume inorganic carbon (in the form of dissolved CO2) that is available in the upper water column, in turn increasing the pH of the surface water to above 9 (Ji et al., 2020; Wilhelm et al., 2020). Across the sampling period, there were an increasing number of instances where the surface water pH was measured above 9 (Figure 3). With this increase in pH, the equilibrium of carbon in the water is shifted from inorganic carbon (dissolved CO2) to bicarbonate (HCO3−) and carbonate (CO32−) (Ji et al., 2020; Huisman et al., 2018). Microcystis, although also adaptive to high concentrations of CO2 concentrations, can utilize bicarbonate as a carbon source through the use of carbonic anhydrase found in cyanobacteria—further allowing these blooms to thrive during these alkaline conditions (Ji et al., 2020; Wilhelm et al., 2020; Huisman et al., 2018). Alkaline pH conditions also allow for the conversion of ammonium ions (NH4+) to ammonia (NH3), thus, a negative correlation between ammonia and pH which was significant in this study (Figure 5). Furthermore, an increase in ammonia was observed during the months where microcystin concentrations and Microcystis relative abundances were the highest (May to September) (Figures 9, 11).
5 Conclusion
This study provides a glimpse into the effects of cyanoHABs within the microbial community of the freshwater lake, Lake Okeechobee. It also provides an initial look into the taxonomic classification of the dynamic microbial community of Lake O over several years and the spatial changes that were seen within these communities. We determined that the cyanoHABs that are a common occurrence in Lake O do alter the microbial community composition of the lake. Further investigation of these changes within the microbial community composition yielded the identification of possible relationships between these microbial communities and Microcystis. With the identification of these possible relationships, future investigation should be conducted to see how the functions of these taxa are incorporated into their interaction with Microcystis. With that, we might be able to identify bacteria that may serve as possible bioindicators for these cyanoHAB events and aid in preventing or managing these recurring blooms in the lake.
The Lake Okeechobee watershed forms an essential part of South Florida’s freshwater ecosystems, serving as a source of drinking water for nearby towns, irrigation for the agricultural lands surrounding the lake, a critical water supply for the environment, and a habitat for various organisms in the water and on the land (South Florida Water Management District, n.d.). With the degrading water quality of the lake, concerns for life both within and around the lake continue to grow (Lapointe et al., 2024). To date, numerous studies have been conducted on reducing the nutrient loading into the lake (Canfield et al., 2021; Schelske, 1989; Canfield and Hoyer, 1988) and investigating the possible control of these recurring blooms (Pokrzywinski et al., 2022), primarily focusing on the cyanobacteria involved in these blooms. Few studies focusing on Lake Okeechobee explore the taxonomic structure and the temporal and spatial distributions of the microbial communities before, during, and after annual cyanoHABs. Furthermore, whether the microbial community’s taxonomic structure and temporal and spatial distributions rebound after a bloom event also have yet to be studied.
The conclusions reached in this study provide a glimpse into the effects that cyanoHABs caused by Microcystis may have on the microbial community composition within Lake O. To enable scientists to enhance their comprehension of the ongoing cyanoHABs in Lake Okeechobee and their interactions with the surrounding environment, particularly the microbial community, it is essential to fill these existing knowledge gaps. With that scientists will be able to examine the variations in the diversity and trophic structure of the lake before, during, and after the occurrence of these harmful blooms—bringing scientists closer to fully understanding the impact of cyanoHABs on Lake Okeechobee’s microbial communities.
Data availability statement
The datasets presented in this study can be found in online repositories. The names of the repository/repositories and accession number(s) can be found at: https://www.ncbi.nlm.nih.gov/, PRJNA813570; https://www.ncbi.nlm.nih.gov/, PRJNA1300817.
Ethics statement
The manuscript presents research on animals that do not require ethical approval for their study.
Author contributions
PS: Data curation, Investigation, Methodology, Writing – original draft, Writing – review & editing, Formal analysis, Conceptualization, Visualization. JL: Conceptualization, Supervision, Writing – review & editing, Funding acquisition, Project administration, Resources, Validation.
Funding
The author(s) declare that financial support was received for the research and/or publication of this article. This work was funded by a grant to JL from the US Army Corps of Engineers’ Engineer Research and Development Center (ERDC) and facilitated by South Florida and Caribbean Cooperative Ecosystems Studies Unit (SFC CESU) (USACE | W912HZ-19-2-0014).
Acknowledgments
We would like to thank staff of the South Florida Water Management District (SFWMD), Emily Karwacki, and Viviana Mazzei of the U.S. Geological Survey (USGS) for collecting, filtering, and sending all the water samples to NSU for further processing. We would also like to thank Dr. Lauren Krausfeldt for assisting with sample processing and sequencing, conducting preliminary data analyses, and advising data analysis methods. Additional thanks go to Athena Capetanakis and Pari Cribbins for help with the editing of this manuscript. Finally, we give many thanks to the numerous students who helped tremendously with sample processing and sequencing across the project years. Any use of trade, firm, or product names is for descriptive purposes only and does not imply endorsement by the U.S. government.
Conflict of interest
The authors declare that the research was conducted in the absence of any commercial or financial relationships that could be construed as a potential conflict of interest.
The author(s) declared that they were an editorial board member of Frontiers, at the time of submission. This had no impact on the peer review process and the final decision.
Generative AI statement
The authors declare that no Gen AI was used in the creation of this manuscript.
Any alternative text (alt text) provided alongside figures in this article has been generated by Frontiers with the support of artificial intelligence and reasonable efforts have been made to ensure accuracy, including review by the authors wherever possible. If you identify any issues, please contact us.
Publisher’s note
All claims expressed in this article are solely those of the authors and do not necessarily represent those of their affiliated organizations, or those of the publisher, the editors and the reviewers. Any product that may be evaluated in this article, or claim that may be made by its manufacturer, is not guaranteed or endorsed by the publisher.
Supplementary material
The Supplementary material for this article can be found online at: https://www.frontiersin.org/articles/10.3389/frwa.2025.1678547/full#supplementary-material
Footnotes
References
Agha, R., Del Mar Labrador, M., De Los Ríos, A., and Quesada, A. (2016). Selectivity and detrimental effects of epiphytic Pseudanabaena on Microcystis colonies. Hydrobiologia 777, 139–148. doi: 10.1007/s10750-016-2773-z
Anderson, D. M. (2009). Approaches to monitoring, control, and management of harmful algal blooms (HABs). Ocean Coast. Manag. 52, 342–347. doi: 10.1016/j.ocecoaman.2009.04.006
Barlow, P., and Reichard, E. (2010). Saltwater intrusion in coastal regions of North America. Hydrogeol. J. 18, 247–260. doi: 10.1007/s10040-009-0514-3
Berry, M. A., Davis, T. W., Cory, R. M., Duhaime, M. B., Johengen, T. H., Kling, G. W., et al. (2017). Cyanobacterial harmful algal blooms are a biological disturbance to western Lake Erie bacterial communities. Environ. Microbiol. 19, 1149–1162. doi: 10.1111/1462-2920.13640
Bláha, L., Babica, P., and Maršálek, B. (2009). Toxins produced in cyanobacterial water blooms - toxicity and risks. Interdisc. Toxicol. 2, 36–41. doi: 10.2478/v10102-009-0006-2
Bolyen, E., Rideout, J. R., Dillon, M. R., Bokulich, N. A., Abnet, C. C., al-Ghalith, G. A., et al. (2019). Reproducible, interactive, scalable and extensible microbiome data science using QIIME 2. Nat. Biotechnol. 37, 852–857. doi: 10.1038/s41587-019-0209-9
Brown, C. T., Hug, L. A., Thomas, B. C., Sharon, I., Castelle, C. J., Singh, A., et al. (2015). Unusual biology across a group comprising more than 15% of domain Bacteria. Nature 523, 208–211. doi: 10.1038/nature14486
Cai, H., Mclimans, C. J., Jiang, H., Chen, F., Krumholz, L. R., and Hambright, K. D. (2024). Aerobic anoxygenic phototrophs play important roles in nutrient cycling within cyanobacterial Microcystis bloom microbiomes. Microbiome 12:88. doi: 10.1186/s40168-024-01801-4
Caiola, M. G., and Pellegrini, S. (1984). Lysis of Microcystis aeruginosa (Kutz.) by Bdellovibrio-like Bacteria1. J. Phycol. 20, 471–475.
Canfield, D. E., Bachmann, R. W., and Hoyer, M. V. (2021). Restoration of Lake Okeechobee, Florida: mission impossible? Lake Reserv. Manage. 37, 95–111. doi: 10.1080/10402381.2020.1839607
Canfield, D., and Hoyer, M. (1988). The eutrophication of Lake Okeechobee. Lake Reserv. Manage. 4, 91–99. doi: 10.1080/07438148809354817
Caporaso, J. G., Ackermann, G., Apprill, A., Bauer, M., Berg-Lyons, D., Betley, J., et al. (2018). EMP 16S Illumina amplicon protocol. PLoS One. doi: 10.17504/protocols.io.nuudeww
Chang, T.-P. (1985). Selective inhabitation of parasitic cyanophyte pseudanabaena in water-bloom Microcystis colonies. Arch. Hydrobiol. 104, 419–426. doi: 10.1127/archiv-hydrobiol/104/1985/419
Chun, S.-J., Cui, Y., Ko, S.-R., Lee, H.-G., Oh, H.-M., and Ahn, C.-Y. (2017). Silanimonas algicola sp. Nov., isolated from laboratory culture of a bloom-forming cyanobacterium, Microcystis. International Journal of Systematic and Evolutionary Microbiology, 67, 3274–3278. doi: 10.1099/ijsem.0.002102
Cooper, R. Z., Ergas, S. J., and Nachabe, M. (2024). Multi-Decadal Nutrient Management and Trends in Two Catchments of Lake Okeechobee. Resources, 13:28. doi: 10.3390/resources13020028
Croci, C., Martínez de la Escalera, G., Kruk, C., Segura, A., Deus Alvarez, S., and Piccini, C. (2025). Selective enrichment of active bacterial taxa in the Microcystis-associated microbiome during colony growth. PeerJ 13:e19149. doi: 10.7717/peerj.19149
Cuklina, J., Lee, C. H., Williams, E. G., Sajic, T., Collins, B. C., Rodriguez Martinez, M., et al. (2021). Diagnostics and correction of batch effects in large-scale proteomic studies: a tutorial. Mol. Syst. Biol. 17:e10240. doi: 10.15252/msb.202110240
Dick, G. J. (2021). The genetic and ecophysiological diversity of Microcystis. Environ. Microbiol. 23, 7278–7313. doi: 10.1111/1462-2920.15615
Donald, D. B., Bogard, M. J., Finlay, K., and Leavitt, P. R. (2011). Comparative effects of urea, ammonium, and nitrate on phytoplankton abundance, community composition, and toxicity in hypereutrophic freshwaters. Limnol. Oceanogr. 56, 2161–2175. doi: 10.4319/lo.2011.56.6.2161
Eiler, A., and Bertilsson, S. (2004). Composition of freshwater bacterial communities associated with cyanobacterial blooms in four Swedish lakes. Environ. Microbiol. 6, 1228–1243. doi: 10.1111/j.1462-2920.2004.00657.x
Ezzedine, J. A., Desdevises, Y., and Jacquet, S. (2022). Bdellovibrio and like organisms: current understanding and knowledge gaps of the smallest cellular hunters of the microbial world. Crit. Rev. Microbiol. 48, 428–449. doi: 10.1080/1040841X.2021.1979464
Facey, J. A., Apte, S. C., and Mitrovic, S. M. (2019). A review of the effect of trace metals on freshwater cyanobacterial growth and toxin production. Toxins 11:643. doi: 10.3390/toxins11110643
Gaysina, L. A., Saraf, A., and Singh, P. (2019). Chapter 1 - Cyanobacteria in diverse habitats : Academic Press.
Gobler, C. J., and Jankowiak, J. G. (2022). Dynamic responses of endosymbiotic microbial communities within Microcystis colonies in north American Lakes to altered nitrogen, phosphorus, and temperature levels. Front. Microbiol. 12:1500. doi: 10.3389/fmicb.2021.781500
Gong, Y., Ping, X.-Y., Zeng, C.-H., Wang, S.-X., Zhou, Y., Wang, M.-Y., et al. (2022). Predation capacity of Bradymonabacteria, a recently discovered group in the order Bradymonadales, isolated from marine sediments. Arch. Microbiol. 204:695. doi: 10.1007/s00203-022-03303-z
Harke, M. J., Steffen, M. M., Gobler, C. J., Otten, T. G., Wilhelm, S. W., Wood, S. A., et al. (2016). A review of the global ecology, genomics, and biogeography of the toxic cyanobacterium Microcystis spp. Harmful Algae 54, 4–20. doi: 10.1016/j.hal.2015.12.007
Harrell, F. (2023). Hmisc: Harrell Miscellaneous. R package version 5.0-1. https://CRAN.R-project.org/package=Hmisc (Accessed February 17, 2023).
Havens, K. E., Hanlon, C., and James, R. T. (1995a). Historical trends in the Lake Okeechobee ecosystem, V. Algal blooms. Archiv fur Hydrobiolgie 107, 89–100.
Havens, K. E., Hanlon, C., and James, R. T. (1995b). Seasonal and spatial variation in algal bloom frequencies in Lake Okeechobee, Florida, USA. Lake Reserv. Manage. 10, 139–148.
Herrmann, M., Wegner, C. E., Taubert, M., Geesink, P., Lehmann, K., Yan, L., et al. (2019). Predominance of Cand. Patescibacteria in groundwater is caused by their preferential mobilization from soils and flourishing under oligotrophic conditions. Front. Microbiol. 10:1407. doi: 10.3389/fmicb.2019.01407
Huisman, J., Codd, G. A., Paerl, H. W., Ibelings, B. W., Verspagen, J. M., and Visser, P. M. (2018). Cyanobacterial blooms. Nat. Rev. Microbiol. 16, 471–483. doi: 10.1038/s41579-018-0040-1
Huisman, J. M., Matthijs, H. C. P., and Visser, P. M. (2005). Harmful Cyanobacteria Springer Aquatic Ecology Series 3. Dordrecht, The Netherlands.
Ilhe, T. (2008). The spatiotemporal variation of Microcystis spp. (Cyanophyceae) and microcystins in Quitzdorf reservoir (Sachsen). Die raum-zeitliche variation von Microcystis spp. (Cyanophyceae) und Microcystinen in der Talsperre Quitzdorf (Sachsen). Ph.D. dissertation. Germany: Universität Dresden.
Im, W.-T., Hu, Z.-Y., Kim, K.-H., Rhee, S.-K., Meng, H., Lee, S.-T., et al. (2012). Description of Fimbriimonas ginsengisoli gen. Nov., sp. nov. within the Fimbriimonadia class nov., of the phylum Armatimonadetes. Antonie Van Leeuwenhoek 102, 307–317. doi: 10.1007/s10482-012-9739-6
Imamura, N., Motoike, I., Shimada, N., Nishikori, M., Morisaki, H., and Fukami, H. (2001). An efficient screening approach for anti-Microcystis compounds: based on knowledge of aquatic microbial ecosystem. J. Antibiot. 54, 582–587. doi: 10.7164/antibiotics.54.582
Jackrel, S. L., Yang, J. W., Schmidt, K. C., and Denef, V. J. (2021). Host specificity of microbiome assembly and its fitness effects in phytoplankton. ISME J. 15, 774–788. doi: 10.1038/s41396-020-00812-x
Ji, X., Verspagen, J. M. H., Van de Waal, D. B., Rost, B., and Huisman, J. (2020). Phenotypic plasticity of carbon fixation stimulates cyanobacterial blooms at elevated CO2. Sci. Adv. 6:eaax2926. doi: 10.1126/sciadv.aax2926
Jöhnk, K. D., Huisman, J., Sharples, J., Sommeijer, B., Visser, P. M., and Stroom, J. M. (2008). Summer heatwaves promote blooms of harmful cyanobacteria. Glob. Change Biol. 14, 495–512. doi: 10.1111/j.1365-2486.2007.01510.x
Komárek, J. (2003). Coccoid and colonial Cyanobacteria Freshwater algae of North America. Amsterdam Elsevier 59–116
Krausfeldt, L. E., Shmakova, E., Lee, H. W., Mazzei, V., Loftin, K. A., Smith, R. P., et al. (2024). Microbial diversity, genomics, and phage–host interactions of cyanobacterial harmful algal blooms. mSystems 9:e00709-23. doi: 10.1128/msystems.00709-23
Kurashita, H., Hatamoto, M., Tomita, S., Yamaguchi, T., Narihiro, T., and Kuroda, K. (2024). Comprehensive insights into potential metabolic functions of Myxococcota in activated sludge systems. Microbes Environ. 39:4068. doi: 10.1264/jsme2.me24068
Lapointe, B. E., Brewton, R. A., McFarland, M. N., and Stockley, N. (2024). Nutrient availability in a freshwater-to-marine continuum: cyanobacterial blooms along the Lake Okeechobee waterway. Harmful Algae 139:102710. doi: 10.1016/j.hal.2024.102710
Larkin, S. L., and Adams, C. M. (2007). Harmful algal blooms and coastal business: economic consequences in Florida. Soc. Nat. Resour. 20, 849–859. doi: 10.1080/08941920601171683
Larsson, J. (2022). _eulerr: area-proportional Euler and Venn diagrams with Ellipses_. R package version 7.0.0. Available online at: https://CRAN.R-project.org/package=eulerr (Accessed December 14, 2022).
Lecher, A. L. (2021). A brief history of Lake Okeechobee: a narrative of conflict. J. Floria Stud. 1, 1–21.
Lefler, F. W., Barbosa, M., Zimba, P. V., Smyth, A. R., Berthold, D. E., and Laughinghouse, H. D. (2023). Spatiotemporal diversity and community structure of cyanobacteria and associated bacteria in the large shallow subtropical Lake Okeechobee (Florida, United States). Front. Microbiol. 14:1219261. doi: 10.3389/fmicb.2023.1219261
Léon-Zayas, R., Peoples, L., Biddle, J. F., Podell, S., Novotny, M., Cameron, J., et al. (2017). The metabolic potential of the single cell genomes obtained from the challenger deep, Mariana trench within the candidate superphylum Parcubacteria (OD1). Environ. Microbiol. 19, 2769–2784. doi: 10.1111/1462-2920.13789
Lezcano, M. Á., Velázquez, D., Quesada, A., and El-Shehawy, R. (2017). Diversity and temporal shifts of the bacterial community associated with a toxic cyanobacterial bloom: an interplay between microcystin producers and degraders. Water Res. 125, 52–61. doi: 10.1016/j.watres.2017.08.025
Li, Z. K., Dai, G. Z., Zhang, Y., Xu, K., Bretherton, L., Finkel, Z. V., et al. (2020). Photosynthetic adaptation to light availability shapes the ecological success of bloom-forming cyanobacterium Pseudanabaena to iron limitation. J. Phycol. 56, 1457–1467. doi: 10.1111/jpy.13040
Litchman, E., de Tezanos Pinto, P., Klausmeier, C. A., Thomas, M. K., and Yoshiyama, K. (2010). Linking traits to species diversity and community structure in phytoplankton. Hydrobiologia 653, 15–28. doi: 10.1007/s10750-010-0341-5
Luef, B., Frischkorn, K. R., Wrighton, K. C., Holman, H.-Y. N., Birarda, G., Thomas, B. C., et al. (2015). Diverse uncultivated ultra-small bacterial cells in groundwater. Nat. Commun. 6:6372. doi: 10.1038/ncomms7372
Ma, S. (2023). MMUPHin: Meta-analysis methods with uniform pipeline for heterogeneity in microbiome studies. R package version 1.12.1.
Magurran, A. E., and Henderson, P. A. (2003). Explaining the excess of rare species in natural species abundance distributions. Nature 422, 714–716. doi: 10.1038/nature01547
Malfertheiner, L., Martínez-Pérez, C., Zhao, Z., Herndl, G. J., and Baltar, F. (2022). Phylogeny and metabolic potential of the candidate phylum SAR324. Biology 11:599. doi: 10.3390/biology11040599
Manage, P. M., Edwards, C., Singh, B. K., and Lawton, L. A. (2009). Isolation and identification of novel microcystin-degrading Bacteria. Appl. Environ. Microbiol. 75, 6924–6928. doi: 10.1128/aem.01928-09
Mankiewicz-Boczek, J., and Font-Najera, A. (2022). Temporal and functional interrelationships between bacterioplankton communities and the development of a toxigenic Microcystis bloom in a lowland European reservoir. Sci. Rep. 12:19332. doi: 10.1038/s41598-022-23671-2
Markou, G., Vandamme, D., and Muylaert, K. (2014). Microalgal and cyanobacterial cultivation: the supply of nutrients. Water Res. 65, 186–202. doi: 10.1016/j.watres.2014.07.025
Maruyama, T., Kato, K., Yokoyama, A., Tanaka, T., Hiaishi, A., and Park, H. D. (2003). Dynamics of microcystin degrading bacteria in mucilage of Microcystis. Microb. Ecol. 46, 279–288. doi: 10.1007/s00248-002-3007-7
Massey, I. Y., and Yang, F. (2020). A Mini review on microcystins and bacterial degradation. Toxins 12:268. doi: 10.3390/toxins12040268
Mataloni, G., and Komarek, J. (2004). Gloeocapsopsis aurea, a new subaerophytic cyanobacterium from maritime Antarctica. Polar Biol. 27, 623–628. doi: 10.1007/s00300-004-0620-6
McMurdie, P. J., and Holmes, S. (2013). An R package for reproducible interactive analysis and graphics of microbiome census data. PLoS One 8:e61217. doi: 10.1371/journal.pone.0061217
McQuaid, A. L. (2019). The bioaccumulation of cyanotoxins in aquatic food webs. Doctoral Dissertations, 2481. Available online at: https://scholars.unh.edu/dissertation/2481 (Accessed December 14, 2022).
Metcalf, J. S., Banack, S. A., Powell, J. T., Tymm, F. J., Murch, S. J., Brand, L. E., et al. (2018). Public health responses to toxic cyanobacterial blooms: perspectives from the 2016 Florida event. Water Policy 20, 919–932. doi: 10.2166/wp.2018.012
Missimer, T. M., Thomas, S., and Rosen, B. H. (2021). Legacy phosphorus in Lake Okeechobee (Florida, USA) sediments: a review and new perspective. Water 13:39. doi: 10.3390/w13010039
Mo, Y., Peng, F., Gao, X., Xiao, P., Logares, R., Jeppesen, E., et al. (2021). Low shifts in salinity determined assembly processes and network stability of microeukaryotic plankton communities in a subtropical urban reservoir. Microbiome 9:128. doi: 10.1186/s40168-021-01079-w
Mu, D. S., Wang, S., Liang, Q. Y., Du, Z.-Z., Tian, R., Ouyang, Y., et al. (2020). Bradymonabacteria, a novel bacterial predator group with versatile survival strategies in saline environments. Microbiome 8:126. doi: 10.1186/s40168-020-00902-0
Murphy, C. L., Yang, R., Decker, T., Cavalliere, C., Andreev, V., Bircher, N., et al. (2021). Genomes of novel Myxococcota reveal severely curtailed machineries for predation and cellular differentiation. Appl. Environ. Microbiol. 87:e01706-21. doi: 10.1128/aem.01706-21
Myer, M. H., Urquhart, E., Schaeffer, B. A., and Johnston, J. M. (2020). Spatio-temporal modeling for forecasting high-risk freshwater cyanobacterial harmful algal blooms in Florida. Front. Environ. Sci. 8, 1–13. doi: 10.3389/fenvs.2020.581091
Oksanen, J., Simpson, G. L., Blanchet, F. G., Kindt, R., Legendre, P., Minchin, P. R., et al. (2022). Vegan: community ecology package. Available online at: https://CRAN.R-project.org/package=vegan (Accessed February 17, 2023).
Padfield, D., Kay, S., Vos, R., Quince, C., and Vos, M. (2024). Macroevolutionary dynamics in Micro-organisms: generalists give rise to specialists across biomes in the ubiquitous bacterial phylum Myxococcota. Mol. Biol. Evol. 41. doi: 10.1093/molbev/msae088
Paerl, H. W., Havens, K. E., Xu, H., Zhu, G., McCarthy, M. J., Newell, S. E., et al. (2020). Mitigating eutrophication and toxic cyanobacterial blooms in large lakes: the evolution of a dual nutrient (N and P) reduction paradigm. Hydrobiologia 847, 4359–4375. doi: 10.1007/s10750-019-04087-y
Paerl, H. W., and Huisman, J. (2008). Blooms like it hot. Science 320, 57–58. doi: 10.1126/science.1155398
Paerl, H. W., and Otten, T. G. (2013). Harmful cyanobacterial blooms: causes, consequences, and controls. Microb. Ecol. 65, 995–1010. doi: 10.1007/s00248-012-0159-y
Paerl, H., and Scott, J. (2010). Throwing fuel on the fire: synergistic effects of excessive nitrogen inputs and global warming on harmful algal blooms. Environ. Sci. Technol. 44, 7756–7758. doi: 10.1021/es102665e
Parks, D., Chuvochina, M., Waite, D., Rinke, C., Skarshewski, A., Chaumeil, P.-A., et al. (2018). A standardized bacterial taxonomy based on genome phylogeny substantially revises the tree of life. Nat. Biotechnol. 36:4229. doi: 10.1038/nbt.4229
PCR Purification with Beckman Coulter AMPure XP Magnetic Beads and the VIAFLO 96. (2020). Available online at: https://www.integra-biosciences.com/global/en/applications/pcr-purification-beckman-coulter-ampure-xp-magnetic-beads-and-viaflo-96#top (Accessed December 14, 2022).
Pokrzywinski, K. L., Bishop, W. M., Grasso, C. R., Fernando, B. M., Sperry, B. P., Berthold, D. E., et al. (2022). Evaluation of a peroxide-based algaecide for cyanobacteria control: a mesocosm trial in Lake Okeechobee, FL, USA. Water 14:169. doi: 10.3390/w14020169
Pommier, T., Pinhassi, J., and Hagstrom, A. (2005). Biogeographic analysis of ribosomal RNA clusters from marine bacterioplankton. Aquat. Microb. Ecol. 41, 79–89. doi: 10.3354/ame041079
Proctor, C. R., Besmer, M. D., Langenegger, T., Beck, K., Walser, J.-C., Ackermann, M., et al. (2018). Phylogenetic clustering of small low nucleic acid-content bacteria across diverse freshwater ecosystems. ISME J. 12, 1344–1359. doi: 10.1038/s41396-018-0070-8
Quast, C., Pruesse, E., Yilmaz, P., Gerken, J., Schweer, T., Yarza, P., et al. (2013). The SILVA ribosomal RNA gene database project: improved data processing and web-based tools. Nucl. Acids Res. 41, D590–D596. doi: 10.1093/nar/gks1219
R Core Team (2022). R: A language and environment for statistical computing. Vienna, Austria: R Foundation for Statistical Computing.
Rollwagen-Bollens, G., Lee, T., Rose, V., and Bollens, S. M. (2018). Beyond eutrophication: Vancouver Lake, WA, USA as a model system for assessing multiple, interacting biotic and abiotic drivers of harmful cyanobacterial blooms. Water 10. doi: 10.3390/w10060757
Rosen, B. H., Davis, T. W., Gobler, C. J., Kramer, B. J., and Loftin, K. A. (2017). Cyanobacteria of the 2016 Lake Okeechobee and Okeechobee waterway harmful algal bloom: U.S. Geological Survey open-file report 2017–1054.
Schelske, C. L. (1989). Assessment of nutrient effects and nutrient limitation in Lake Okeechobee. Water Resour. Bull. 25, 1119–1130.
Shannon, P., Markiel, A., Ozier, O., Baliga, N. S., Wang, J. T., Ramage, D., et al. (2003). Cytoscape: a software environment for integrated models of biomolecular interaction networks. Genome Res. 13, 2498–2504. doi: 10.1101/gr.1239303
Shen, H., Niu, Y., Xie, P., Tao, M., and Yang, X. (2011). Morphological and physiological changes in Microcystis aeruginosa as a result of interactions with heterotrophic bacteria. Freshw. Biol. 56, 1065–1080. doi: 10.1111/j.1365-2427.2010.02551.x
Shi, L., Cai, Y., Yang, H., Xing, P., Li, P., Kong, L., et al. (2009). Phylogenetic diversity and specificity of bacteria associated with Microcystis aeruginosa and other cyanobacteria. J. Environ. Sci. (China) 21, 1581–1590. doi: 10.1016/S1001-0742(08)62459-6
Sigee, D. (2005). Freshwater microbiology. Biodiversity and dynamic interactions of microorganisms in the aquatic environment. Chichester, UK: John Wiley & Sons, 328–338.
Smayda, T. J. (1997). What is a bloom? A commentary. Limnol. Oceanogr. 42, 1132–1136. doi: 10.4319/lo.1997.42.5_part_2.1132
South Florida Water Management District. (n.d.). Impacts of operating Lake Okeechobee at lower water levels [infographic]. SFWMD. Available online at: https://www.sfwmd.gov/sites/default/files/documents/infographic_lake_okee_depth.pdf (Accessed January 8, 2023).
Tu, J., Chen, L., Gao, S., Zhang, J., Bi, C., Tao, Y., et al. (2019). Obtaining genome sequences of mutualistic Bacteria in single Microcystis colonies. Int. J. Mol. Sci. 20. doi: 10.3390/ijms20205047
U.S. Army Corps of Engineers, J. D. (2021). Home. Herbert Hoover Dike. Available online at: https://www.saj.usace.army.mil/HHD/ (Accessed August 24, 2022).
Van Wichelen, J., Vanormelingen, P., Codd, G. A., and Vyverman, W. (2016). The common bloom-forming cyanobacterium Microcystis is prone to a wide array of microbial antagonists. Harmful Algae 55, 97–111. doi: 10.1016/j.hal.2016.02.009
Vestergaard, S. Z., Dottorini, G., Peces, M., Murguz, A., Dueholm, M. K. D., Nierychlo, M., et al. (2024). Microbial core communities in activated sludge plants are strongly affected by immigration and geography. Environ. Microbiome 19:63. doi: 10.1186/s40793-024-00604-2
Visser, P., Verspagen, J., Sandrini, G., Stal, L., Matthijs, H., Davis, T., et al. (2016). How rising CO2 and global warming may stimulate harmful cyanobacterial blooms. Harmful Algae 54, 145–159. doi: 10.1016/j.hal.2015.12.006
Waite, D. W., Chuvochina, M., Pelikan, C., Parks, D. H., Yilmaz, P., Wagner, M., et al. (2020). Proposal to reclassify the proteobacterial classes Deltaproteobacteria and Oligoflexia, and the phylum Thermodesulfobacteria into four phyla reflecting major functional capabilities. Int. J. Syst. Evol. Microbiol. 70, 5972–6016. doi: 10.1099/ijsem.0.004213
Wale, N., Freimark, C. B., Ramirez, J., Dziuba, M. K., Kafri, A. Y., Bilich, R., et al. (2024). Virulence and transmission biology of the widespread, ecologically important pathogen of zooplankton, Spirobacillus cienkowskii. Appl. Environ. Microbiol. 90:e0152923. doi: 10.1128/aem.01529-23
Wang, K., Mou, X., Cao, H., Struewing, I., Allen, J., and Lu, J. (2021). Co-occurring microorganisms regulate the succession of cyanobacterial harmful algal blooms. Environ. Pollut. 288:117682. doi: 10.1016/j.envpol.2021.117682
Welsh, R. M., Zaneveld, J. R., Rosales, S. M., Payet, J. P., Burkepile, D. E., and Thurber, R. V. (2016). Bacterial predation in a marine host-associated microbiome. ISME J. 10, 1540–1544. doi: 10.1038/ismej.2015.219
Whitton, B. A., and Potts, M. (2000a). The ecology of Cyanobacteria. Dordrecht: Kluwer Academic Publishers.
Whitton, B. A., and Potts, M. (2000b). “Introduction of cyanobacteria” in The ecology of Cyanobacteria. Their diversity in time and space. eds. B. A. Whitton and M. Potts (Dordrecht: Kluwer Academic), 1–10.
Wiegand, C., and Pflugmacher, S. (2005). Ecotoxicological effects of selected cyanobacterial secondary metabolites a short review. Toxicol. Appl. Pharmacol. 203, 201–218. doi: 10.1016/j.taap.2004.11.002
Wilhelm, S. W., Bullerjahn, G. S., and McKay, R. M. L. (2020). The complicated and confusing ecology of Microcystis blooms. MBio 11:e00529-20. doi: 10.1128/mBio.00529-20
Williams, C. D., Aubel, M. T., Chapman, A. D., and D'Aiuto, P. E. (2007). Identification of cyanobacterial toxins in Florida's freshwater systems. Lake Reserv. Manage. 23, 144–152. doi: 10.1080/07438140709353917
Xie, L. Q., Xie, P., and Tang, H. J. (2003). Enhancement of dissolved phosphorus release from sediment to lake water by Microcystis blooms—an enclosure experiment in a hyper-eutrophic, subtropical Chinese lake. Environ. Pollut. 122, 391–399. doi: 10.1016/S0269-7491(02)00305-6
Xue, Y., Chen, H., Xiao, P., Jin, L., Logares, R., and Yang, J. (2023). Core taxa drive microeukaryotic community stability of a deep subtropical reservoir after complete mixing. Environ. Microbiol. Rep. 15, 769–782. doi: 10.1111/1758-2229.13196
Xue, Y., Chen, H., Yang, J. R., Liu, M., Huang, B., and Yang, J. (2018). Distinct patterns and processes of abundant and rare eukaryotic plankton communities following a reservoir cyanobacterial bloom. ISME J. 12, 2263–2277. doi: 10.1038/s41396-018-0159-0
Yancey, C. E., Kiledal, E. A., Denef, V. J., Errera, R. M., Evans, J. T., Hart, L., et al. (2022). The western Lake Erie culture collection: a promising resource for evaluating the physiological and genetic diversity of Microcystis and its associated microbiome. Elsevier.
You, J., Mallery, K., Hong, J., and Hondzo, M. (2017). Temperature effects on growth and buoyancy of Microcystis aeruginosa. J. Plankton Res. 40, 16–28. doi: 10.1093/plankt/fbx059
Zamora-Barrios, C. A., Nandini, S., and Sarma, S. S. (2019). Bioaccumulation of microcystins in seston, zooplankton and fish: a case study in Lake Zumpango, Mexico. Environ. Pollut. 249, 267–276. doi: 10.1016/j.envpol.2019.03.029
Zhang, H., Xie, Y., Zhang, R., Zhang, Z., Hu, X., Cheng, Y., et al. (2023). Discovery of a high-efficient Algicidal bacterium against Microcystis aeruginosa based on examinations toward culture strains and natural bloom samples. Toxins 15:220. doi: 10.3390/toxins15030220
Zhang, X., Yang, F., Chen, L., Feng, H., Yin, S., and Chen, M. (2020). Insights into ecological roles and potential evolution of Mlr-dependent microcystin-degrading bacteria. Sci. Total Environ. 710:136401. doi: 10.1016/j.scitotenv.2019.136401
Zheng, Q., Wang, Y., Xie, R., Lang, A., Liu, Y., Lu, J., et al. (2018). Dynamics of heterotrophic bacterial assemblages within Synechococcus cultures. Appl. Environ. Microbiol. 84:e01517-17. doi: 10.1128/AEM.01517-17
Zou, D., Zhang, C., Liu, Y., and Li, M. (2024). Biogeographical distribution and community assembly of Myxococcota in mangrove sediments. Environ Microbiome 19:47. doi: 10.1186/s40793-024-00593-2
Keywords: Lake Okeechobee, Microcystis , cyanoHABs, cyanobacteria, freshwater ecosystem, high-throughput sequencing, microbiome, harmful algal bloom
Citation: Samuel PS and Lopez JV (2025) Diversity fluctuations of the microbial community during annual Microcystis blooms within Lake Okeechobee, FL. Front. Water. 7:1678547. doi: 10.3389/frwa.2025.1678547
Edited by:
Antonio Bucci, University of Molise, ItalyReviewed by:
Jun Chen, Nanjing University, ChinaBharat Manna, The University of Auckland, New Zealand
Copyright © 2025 Samuel and Lopez. This is an open-access article distributed under the terms of the Creative Commons Attribution License (CC BY). The use, distribution or reproduction in other forums is permitted, provided the original author(s) and the copyright owner(s) are credited and that the original publication in this journal is cited, in accordance with accepted academic practice. No use, distribution or reproduction is permitted which does not comply with these terms.
*Correspondence: Paisley S. Samuel, cHMxMTE3QG15bnN1Lm5vdmEuZWR1