Abstract
Groundwater is vital for agriculture in semi-arid regions like Kongwa District, where surface water is scarce and rainfall unstable. Despite its significance, detailed knowledge on groundwater distribution in such areas is often lacking, hindering effective irrigation planning and sustainable water management. This study, therefore, unleashes that hidden potential by applying Geographic Information Systems and the Analytical Hierarchy Process to map groundwater potential zones for irrigation in Kongwa District. Seven thematic layers were selected including geology, slope, drainage, rainfall, soils, land use, and lineament density for Groundwater potential analysis. Parameters were weighed and determined using AHP and ranked based on their contribution to groundwater potential by expert. The resulting weighted layers were then aggregated in ArcGIS 10.5 through the Weighted Linear Combination (WLC) technique to generate the final groundwater potential map of Kongwa District. Data from 35 boreholes records were collected to determine the model precision and model validation and hydrogeological dataset were used to map ground water potential. The results indicated three zone of groundwater potential namely, high (32%), moderate (45%) and poor (23%) groundwater potential zones. The high groundwater potential zone is concentrated in the western and Southwestern parts of Kongwa District. The middle and northern areas of the district, indicate moderate groundwater potential. Conversely, areas with poor groundwater potential are predominantly located in the eastern and southeastern parts of the district. Validation of Groundwater Potential Zones generated through the AHP–GIS model, the study utilized both secondary hydrogeological data and community-based perceptions. Secondary data including records of borehole yields, well depths, and groundwater level measurements from 2010 to 2022. These datasets provided quantitative evidence on groundwater availability and distribution across the district. The findings offer both academic and practical value. They support the use of geospatial tools for effective groundwater assessment and provide a framework for policymakers, planners, and farmers to make informed decisions about irrigation development, climate resilience, and land use in semi-arid regions of Tanzania.
1 Introduction
Groundwater constitutes about 30% of the total global freshwater supply, serving as the largest accessible source of subsurface water and the second-largest freshwater reservoir worldwide (Kisiki et al., 2022). It provides essential support for domestic, industrial, and agricultural uses and sustains ~38% of irrigated land globally (Karandish et al., 2025). Globally, around 301 million hectares of cropland are irrigated using groundwater, with India, China, and the United States accounting for the largest areas (Karandish et al., 2025). In India, for instance, groundwater supplies 65% of irrigation water, demonstrating its indispensable role in maintaining agricultural productivity (Selvam et al., 2014). The rising global demand for freshwater driven by population growth, agricultural intensification, and industrial expansion has amplified reliance on groundwater as a dependable and climate-resilient source, especially in arid and semi-arid regions (Seddon et al., 2021; Kisiki et al., 2022).
In Sub-Saharan Africa, groundwater remains an underutilized yet critical resource for improving food security and poverty reduction. Africa's groundwater reserves are estimated at 0.66 million km3 over one hundred times greater than the continent's annual renewable surface water supply (Komakech and de Bont, 2018). However, only about 1% of irrigated land in the region relies on groundwater, compared to over 40% in South Asia (Villholth et al., 2013). This underutilization stems from limited infrastructure, weak policy frameworks, and technological constraints. Nevertheless, expanding groundwater irrigation offers a reliable water source amid growing climate uncertainty. Investments in affordable pumping technologies, improved governance, and scientifically informed resource mapping are vital to harness this potential (Ally et al., 2024).
The sustainable use of groundwater requires understanding its spatial distribution and the hydrogeological factors influencing its availability. Integrating Geographic Information Systems (GIS) and Remote Sensing (RS) with multi-criteria decision-making models particularly the Analytical Hierarchy Process (AHP) has proven effective in delineating groundwater potential zones (Ngondo et al., 2022). Groundwater occurrence depends on interactions among geological, hydrological, and environmental variables, including aquifer structure, rainfall variability, slope, drainage density, soil type, and land use (Al-Abadi et al., 2016; Godfray and Tembo, 2024). GIS–AHP techniques synthesize these factors into weighted spatial layers that reveal the most promising groundwater zones. The approach is increasingly recognized for its methodological robustness and applicability in data-scarce regions.
Empirical studies across various hydrogeological settings confirm the reliability of GIS–AHP approaches. For example, Upadhyay et al. (2023) in India's Ghaggar River Basin achieved an AUC value of 0.877, delineating groundwater potential zones from very low to very high classes. Similar predictive accuracies were reported by Patel et al. (2024) in the Narmada Basin and by Harroud et al. (2025) in Morocco's High Atlas, where validation using resistivity data confirmed model accuracy above 85%. Other studies in Morocco Hilal et al. (2024) and Mexico Castillo et al. (2022) further validated GIS–AHP models, achieving ROC–AUC values between 0.80 and 0.88. In East Africa, Ombasa et al. (2022) applied the same framework in Kenya's Baringo County, linking mapped groundwater potential to borehole yield, while Melese and Belay (2022) in Ethiopia reported an 82.9% accuracy rate. Recent applications in Nigeria (Saidu et al., 2024) and Tanzania (Ally et al., 2024) yielded comparable outcomes, demonstrating that the integration of seven to eight thematic factors such as geology, slope, rainfall, soil, LULC, drainage density, and lineament density can accurately delineate groundwater zones with predictive accuracies above 90%.
In Tanzania, groundwater plays a crucial role in complementing surface water resources, especially in semi-arid zones where recurrent droughts and erratic rainfall undermine agricultural productivity (United Republic of Tanzania (URT), 2002). Farmers in these regions increasingly rely on groundwater for irrigation, yet many drill wells without hydrogeological guidance, often resulting in dry or short-lived boreholes (De Bont et al., 2019). This challenge underscores the need for spatially explicit assessments of groundwater potential to guide well placement and ensure sustainable abstraction. As groundwater demand grows, effective management requires spatial mapping, prioritization, and integration of scientific evidence into local decision-making.
This Paper addresses the pressing issue of inadequate spatial knowledge of groundwater resources in Kongwa District, a semi-arid area of central Tanzania characterized by frequent droughts, unreliable rainfall, and declining crop yields. Farmers' reliance on unguided borehole drilling has resulted in significant economic losses and inefficient resource use. Therefore, the Paper aims to identify and map groundwater potential zones using GIS, Remote Sensing, and AHP techniques to support sustainable irrigation planning. Specifically, it seeks to:
-
Analyse the key environmental and hydrological factors influencing groundwater occurrence.
-
Identify and map areas with high groundwater potential for irrigation development.
By integrating geospatial datasets and expert-based weighting within the AHP framework, this Paper provides a spatial decision-support tool to guide groundwater exploration and irrigation investment. Therefore, contributes to Tanzania's broader efforts toward sustainable water resource management and climate-resilient agriculture. Beyond the technical mapping, the paper emphasizes the policy relevance and participatory dimension of groundwater governance. It argues that sustainable groundwater utilization in semi-arid Tanzania cannot be achieved through technical solutions alone but must engage local stakeholders especially smallholder farmers to ensure that strategies are scientifically grounded, socially inclusive, and economically viable. In this sense, the research bridges the persistent gap between scientific discovery and practical application, demonstrating how geospatial analytics can be operationalized to support local irrigation planning and water security.
2 Materials and methods
As shown in Figure 1, the methodological flowchart outlines the full sequence of procedures; each stage is described comprehensively in the subsequent subsections.
Figure 1

Flowchart of the methodology used for groundwater potential using the AHP.
2.1 The study area
This study was conducted in Kongwa District (Figure 2) on of the seven districts in Dodoma Region. The district shares the borders Chamwino District to the west, Kiteto District (Manyara Region) to the north, Kilosa District (Morogoro Region) to the east and Mpwapwa District to the south. The population of Kongwa District was 443,867 according to the 2022 Tanzania National Population and Housing Census (National Bureau of Statistics (NBS), 2022). Geographically, Kongwa District lies on the lee side of the Ukaguru Mountains (5°30′-6°S, 36°15′-36°E) and covers an area of ~4,041 square kilometers. The district experiences semi-arid climatic conditions with annual rainfall ranging from 500–760 mm (Mkonda and He, 2017; Ngondo et al., 2022). The dry ocean winds that pass over the district flow parallel to the land surface, making rainfall events sporadic and often insufficient (United Republic of Tanzania (URT), 2016). Most rivers in Kongwa are seasonal, draining into the Wami-Ruvu catchment system located east of the district. The dominant soil type is Chromic Luvisols with a sandy loam texture, which provides moderate water-holding capacity and good drainage features favorable for irrigation development (Mideksa and Temesgen, 2020). Kongwa's varied geological structures, topographical diversity, and heterogeneous land use patterns create an appropriate environment for geospatial analysis and groundwater modeling.
Figure 2

Map showing the location of Kongwa District. The upper right map shows the location of Dodoma Region in Tanzania, while the bottom right map shows the location of Kongwa District in Dodoma Region.
2.2 Study design
This study adopted a mixed-methods design, integrating qualitative interviews with quantitative geospatial analysis to ensure a comprehensive understanding of groundwater potential in Kongwa District. Qualitative insights from farmers, local officials, and water experts were used to identify and prioritize the factors influencing groundwater occurrence. These insights guided the development of the AHP pairwise comparison matrix and the assignment of relative weights for each criterion. The resulting quantitative AHP outputs factor weights and groundwater potential maps were then cross-validated using qualitative evidence from field observations and stakeholder discussions. This integration enhanced the robustness and contextual relevance of the findings by aligning the model outputs with local realities and user experiences (MacDonald et al., 2012; Rahmati et al., 2016; Naghibi et al., 2017).
2.3 Data collection
Map showing the location of Kongwa District was obtained from Institute of Resource Assessment (IRA) GIS LAB, Seven layers data were derived from various spatial datasets such as Digital Elevation Models (DEM) -SRTM(30 m/Arcsec) for Slope, Landsat 8 OLI imagery from (NLUFP Volume III, 2009; IWRM JICA Report) Lineament and Land Use Land Cover, geological maps from Geological and Mineral Information System (GMIS), Soil from (FAO Website), Drainage Map from (WRBWB) and rainfall data obtained from the Tanzania Meteorological Authority (TMA), rainfall data were compiled from nine ground-based rain-gauge stations in the Dodoma area, including Dodoma Maji, Matumbulu Dam, Hombolo, Ihumwa, Msanga, Bihawana Seminary, Mpwapwa Research Station, and the Kinyasungwe Integrated station. Borehole information for 35 sites within Kongwa District was sourced from the Tanzania Ministry of Water catalog.
2.4 Data processing
All spatial and remote sense data inputs were harmonized in ArcGIS 10.5 to create analysis-ready rasters: the study assembled seven thematic layers slope from SRTM (30 m), lineaments and LULC from Landsat-8 OLI (following NLUFP Vol. III, 2009 and the IWRM–JICA report), geology from GMIS, soils from FAO, drainage from WRBWB, and rainfall compiled from nine Tanzania Meteorological Authority gauges in the Dodoma area together with 35 validation boreholes from the Ministry of Water catalog; each dataset was converted to a common grid and reclassified according to its groundwater-suitability contribution. The reclassified layers were then integrated using a Weighted Linear Combination driven by AHP-derived weights to produce the groundwater-potential index/map, with the processing sequence explicitly documented in the paper.
2.5 Analytic hierarchy process (AHP)
The Analytical Hierarchy Process (AHP) was employed to determine the relative importance (weight) of each factor influencing groundwater occurrence in Kongwa District. This multi-criteria evaluation followed Saaty's (1980) structured decision-making framework. AHP was chosen for this study because it ensures methodological simplicity, ease of interpretation. AHP uses crisp pairwise comparisons that are easier for respondents especially non-technical decision-makers such as local planners or farmers to understand and apply. Likewise, the study relied on quantitative and clearly defined evaluation criteria, where judgments were based on measurable or well-understood parameters. Therefore, the level of uncertainty did not justify the additional computational complexity introduced by fuzzy logic. Lastly, the main objective of this study was to prioritize factors through a clear and participatory process rather than to model uncertainty in human perception. Hence, AHP was more aligned with the study's goal of generating straightforward, defensible weights for each criterion.
Thirteen key-informant interviews were conducted with domain experts from both government and industry. Public-sector participants included hydrologists and hydrogeologists from the Ministry of Water, the National Irrigation Commission, and Kongwa District Council; private-sector participants comprised geologists and water-resources engineers from borehole-drilling companies. The purpose of these interviews was to obtain expert judgment on the appropriateness and adequacy of the criteria selected for groundwater-potential mapping, and to clarify how each criterion should inform the analysis.
The Analytic Hierarchy Process (AHP) proceeds through the following stages
Step 1: Seven thematic layers were developed to represent the main factors controlling groundwater potential, namely: slope, geology, rainfall, soil, drainage density, lineament density, and land use/land cover.
Step 2: A pairwise comparison matrix was constructed to quantify the relative importance of each factor using Saaty's 1–9 scale (Table 1). The matrix was normalized, and the mean value of each row was computed to obtain the AHP weight for each factor. The weights were then converted to percentage values representing their contribution to groundwater occurrence (Shekhar and Pandey, 2015).
Table 1
| Criterion | Slope | Geology | Rainfall | Soil | Drainage density | Lineament density | LULC | Weight |
|---|---|---|---|---|---|---|---|---|
| Slope | 1.0 | 1.136 | 1.25 | 1.786 | 2.5 | 3.125 | 3.571 | 0.2358 |
| Geology | 0.88 | 1.0 | 1.1 | 1.571 | 2.2 | 2.75 | 3.143 | 0.2075 |
| Rainfall | 0.8 | 0.909 | 1.0 | 1.429 | 2.0 | 2.5 | 2.857 | 0.1887 |
| Soil | 0.56 | 0.636 | 0.7 | 1.0 | 1.4 | 1.75 | 2.0 | 0.1321 |
| Drainage density | 0.4 | 0.455 | 0.5 | 0.714 | 1.0 | 1.25 | 1.429 | 0.0943 |
| Lineament density | 0.32 | 0.364 | 0.4 | 0.571 | 0.8 | 1.0 | 1.143 | 0.0755 |
| LULC | 0.28 | 0.318 | 0.35 | 0.5 | 0.7 | 0.875 | 1.0 | 0.0660 |
AHP pair wise comparison matrix among criterion.
Step 3. Using the geometric mean for each criterion, we calculated the normalized weights Equation 1. Table 2 presents the normalized weights.
Where: Wn = normalized weight (Eigenvector) of the matrix, and Gm = geometric mean of the individual criterion.
Table 2
| Criterion | Given share (%) | Normalized weight | Rank |
|---|---|---|---|
| Slope | 25.0 | 0.2358 | 1 |
| Geology | 22.0 | 0.2075 | 2 |
| Rainfall | 20.0 | 0.1887 | 3 |
| Soil | 14.0 | 0.1321 | 4 |
| Drainage density | 10.0 | 0.0943 | 5 |
| Lineament density | 8.0 | 0.0755 | 6 |
| LULC | 7.0 | 0.0660 | 7 |
Normalized weight of each criterion.
Step 4. To ensure consistency of expert judgment, the Consistency Index (CI) was calculated using Equation 2:
The Consistency Ratio (CR) was then obtained using Equation 3:
Where RI = Random Consistency Index (Saaty, 1980). A CR ≤ 0.1 indicates an acceptable level of consistency.
Step 5. Each thematic map layer was assigned a weight (Wi) and a rank (Xi) corresponding to the suitability of the factor for groundwater occurrence. The Groundwater Potential Index (GWPI) for each cell was computed using the weighted linear combination method as expressed in Equation 4:
Validation of the AHP model was achieved by comparing the derived groundwater potential index with field-observed borehole yields. The Pearson correlation coefficient (r) was computed using Equation 5 (Chen et al., 2025; Saidu et al., 2024):
The Coefficient of Determination (R2) was obtained using Equation 6:
High values of r and R2 confirm the reliability and predictive accuracy of the AHP-derived groundwater potential model, consistent with similar studies in Northern Nigeria (Saidu et al., 2024).
Groundwater potential data were collected from both primary and secondary sources using an integrated approach. Primary data included expert knowledge from hydrogeologists, GIS analyses, and field surveys, which were undertaken to validate and connect technical information with on-site realities. Secondary data were obtained from the Ministry of Water and the Tanzania Meteorological Authority (TMA), which provided insight into areas with potential water resources. To enhance analysis, thematic layers such as geology, geomorphology, rainfall, lineaments, land use and land cover (LULC), drainage density, and soil type were prepared using topographic maps, satellite imagery, and existing reports, including the Integrated United Republic of Tanzania (URT) (2021). These layers were processed through Remote Sensing (RS) and Geographic Information System (GIS) techniques, following a multi-parametric approach (Thakur et al., 2017). Ground truthing and field observations were conducted around well sites, with GPS coordinates recorded to close data gaps and ensure accuracy in mapping. The base map of Kongwa was developed using available datasets, while geology and geomorphology maps were refined from earlier studies. The entire technical workflow, from data acquisition to raster conversion, is outlined, which lists the parameters and sources of each dataset, including GMIS, WRBWB, FAO, USGS, and NLUFP Volume III (2009).
2.6 Ethical consideration
This study was carried out in accordance with the research ethics guidelines of University of Dar es salaam, Tanzania. Ethical clearance was obtained prior to fieldwork, and permission to collect data was granted by the President's Office, Regional Administration and Local Government and the Ministry of Water and Kongwa District Council. All participants involved in interviews and focus group discussions were informed about the study's objectives, and their participation was entirely voluntary. Informed consent was obtained from each respondent, and confidentiality was ensured by anonymizing all personal and location-specific information in the final report.
3 Results
3.1 Key environmental and hydrological factors that influence groundwater potential
3.1.1 Slope
The slope can be considered as a surface indicator for identification of groundwater, in other words, these thematic layers can be considered as the surrogate of surface runoff velocity and vertical percolation (i.e., infiltration is inversely related to the slope) and thus affecting recharge processes (Adiat et al., 2012). The findings revealed that the slope has normalized weights of (0.2358) and classification of Kongwa District is categorized into five distinct types, each linked to differing levels of groundwater potential. Areas with gradual inclines (964–1,000 m) are classified as possessing extremely high groundwater potential along the southern and south-eastern rim of the district, succeeded by high (1,000–1,150 m) mainly along the south and south-west margins, with a few small hill flanks in the central east, moderate (1,150–1,250 m) zones are scattered rings around hills and escarpment toes, especially in the south, south-central and a few spots in the central interior. Steeper areas, varying from 1,250 to 1,965 m, are classified as having low to extremely poor groundwater potential the dominant class, covering most of the central, north and north-east parts (See Figure 3).
Figure 3

Map of Kongwa district showing slope.
3.1.2 Geology
The study area's lithology/geology is considered as one of the controlling factors influencing the groundwater flow and its existence. Geology of Kongwa District has normalized weights of (0.2075). The serial arrangement of different rocks or lithological units and their interaction determines the area's total infiltration capacity. Porous and permeability of the lithology units refer to the storage and transmitting capacity, which supports the groundwater occurrence and occurrence of an area (USDA, 2014). Kongwa District is divided into three lithologic units such as Complex Basement (Granulite, gneiss, migmatite, amphibolite, marble, quartzite, schist and mylonite) shown with the black stipple. This unit covers most of the district, dominating the west, east, and central-north and extending to the northeast and southern sides outside the central part. Meta-igneous and meta-sedimentary rocks the light cream polygon. This forms a single, continuous tract across the south-central interior, trending west east and reaching into the southeast. Sandy, gravelly, silty sediments the yellow shaded area is confined to the far northwest corner of the district (Figure 4).
Figure 4

Map of Kongwa district showing geology.
3.1.3 Rainfall
The rainfall availability was considered as a major source of recharge (Magesh et al., 2012; Adama et al., 2024; Foster and Cardy, 2000). The rainfall has a significant effect on the groundwater potential and the efficiency of infiltration rate. The findings revealed that Rainfall in Kongwa District has normalized weights of (0.1887), and it has been systematically categorized into five distinct classes based on annual precipitation levels that, Very High (350–374 mm/year), High (326–350 mm/year), Moderate (302–326 mm/year), Low (278–302 mm/year), and Very Low (254–278 mm/year). Generally, the western and southwestern parts of the district, which fall within the Very High and High rainfall classes, are strongly associated with areas of high groundwater potential. In contrast, the eastern and southeastern parts of the district, falling under the Very Low rainfall category, face challenges in recharge due to limited rainfall (See Figure 5).
Figure 5

The map depicts the geographical distribution of average yearly rainfall in Kongwa District for the period 1985 to 2015. The rainfall data were obtained from the Tanzania Meteorological Authority (TMA). Precipitation values were classified into five distinct categories to represent varying rainfall intensity across the district.
3.1.4 Soils
Soils play an important role in the groundwater movement in the unsaturated zone. It depends on moisture content in the soils, infiltration rate, the grain size of the soils and specific composition of the soils (Cosby et al., 1984; Harini et al., 2018). Figure 6 shows that Kongwa District contains three FAO–WRB soil units: Ferric Acrisols, Chromic Cambisols, and Eutric Nitisols. Ferric Acrisols occur predominantly in the central and northern zones and, within the mapped dataset. The second one is Chromic Cambisols are concentrated in the southwest. Eutric Nitisols are mapped mainly in the southeast of the district. Kongwa District has soil normalize weights of (0.1321).
Figure 6

Map of Kongwa district showing soil characteristics.
3.1.5 Drainage and drainage density
The findings from the study revealed that, in Kongwa District, drainage density has normalized weights of (0.0943), and its classes range from Class 1 to Class 5, each reflecting varying groundwater recharge potential that directly impacts groundwater-irrigated agriculture. Class 1 (0.07–0.89) very high dominated in in the central-west interior and in the central-south and smaller parts in the north-central of the district, Class 2 (0.89–1.263) High drainage density most notably from the south-west through the central toward the east-central area, and again in parts of the south-east and Class 3 (1.263–1.637) Moderate drainage density found across the middle of the district, the central and north-central interior and along the east-central parts, Class 4 (1.637–2.370) Low drainage density is visible in the north-west interior, central-east, and several parts in the south-east and Class 5 (2.370–3.735) Very low drainage density, dominating the outer periphery especially the north-east and east, with broad areas also in the west and along parts of the southern area.
The drainage map of Kongwa District (left) shows a comprehensive network of streams and rivers throughout the district, with heightened drainage concentration in the center and southern areas. The drainage density map (right) classifies the district into zones according to drainage concentration and its effects on groundwater potential (See Figure 7). The findings from the study revealed that, in Kongwa District, drainage density classes range from Class 1 to Class 5, each reflecting varying groundwater recharge potential that directly impacts groundwater-irrigated agriculture. Class 1 (0.07–0.89), representing very high groundwater potential with lowest drainage density, Class 2 (0.89–1.263) and Class 3 (1.263–1.637) reflect high to moderate potential with balanced runoff and recharge conditions, in contrast, Class 4 (1.637–2.370) and Class 5 (2.370–3.735), showing low to very low groundwater potential due to higher drainage density, tend to have faster runoff and reduced infiltration.
Figure 7

Map of Kongwa district showing drainage A and drainage density B.
3.1.6 Lineament and lineament density
We found that the lineament and Lineament density in Kongwa District has normalized weights of (0.0755), and is categorized into five classes: very low (0.00–8.52 km/km2) dominates the northern and north-western interior of the district, low (8.52–17.05 km/km2) dominated in the west-central, central, and east-central parts, moderate (17.05–25.57 km/km2) from the west-central area across the center to the east-central/south-east, high (25.57–34.09 km/km2) found in North West to South East across the central area and a North to South strip in the east-central part of the district., and very high (34.09–42.62 km/km2) is concentrated along the south-central, south-west and south-east, rated from 1 to 5, correspondingly (Figure 8).
Figure 8

Maps of Kongwa showing lineament A and lineament density B.
3.1.7 Land use and land cover
The findings from the study revealed that, Land use and Land cove change in Kongwa District has normalized weights of (0.0660) and it has been categorized into five main classes according to their contribution to groundwater recharge (Figure 9) including Rangeland (Very High), Croplands (High), Natural Vegetation (Moderate), Bare Soil (Low), and Urban Areas (Very Low).
Figure 9

Map of Kongwa district showing land use and land cover.
3.2 Mapped areas with significant groundwater potential in Kongwa district
The groundwater potential zone map was prepared by overlaying of cumulative weight assigned to all the thematic layers (geomorphology, drainage, drainage density, lineaments, lineaments density, soil and slope) using the weighted overlay techniques in spatial analysis tool of Arc GIS 10.5 method. In the process of weighted overlay analysis each thematic layer has been assigned by ranking and weightage based on their water holding capacity (Table 2). Higher and lower weightages were given to higher and low potential of groundwater, respectively. After assigning ranking and weightage of each layer were added and sum grouped into potential zone of groundwater. All the layers were converted into raster format and overlaid. Based on weighted overlay analysis the study area classified into three classes such as high, moderate and poor groundwater potential (Figure 10). Likewise, the findings indicate that borehole yields in Kongwa District are generally low, moderate to high, ranging between 0.2 and 3.5 liters per second (l/s), with the majority producing less than 1.5 l/s. Boreholes are categorized as low-yield (< 1 l/s), moderate-yield (1–2.5 l/s), and high-yield (>2.5 l/s, though rare in Kongwa).
Figure 10
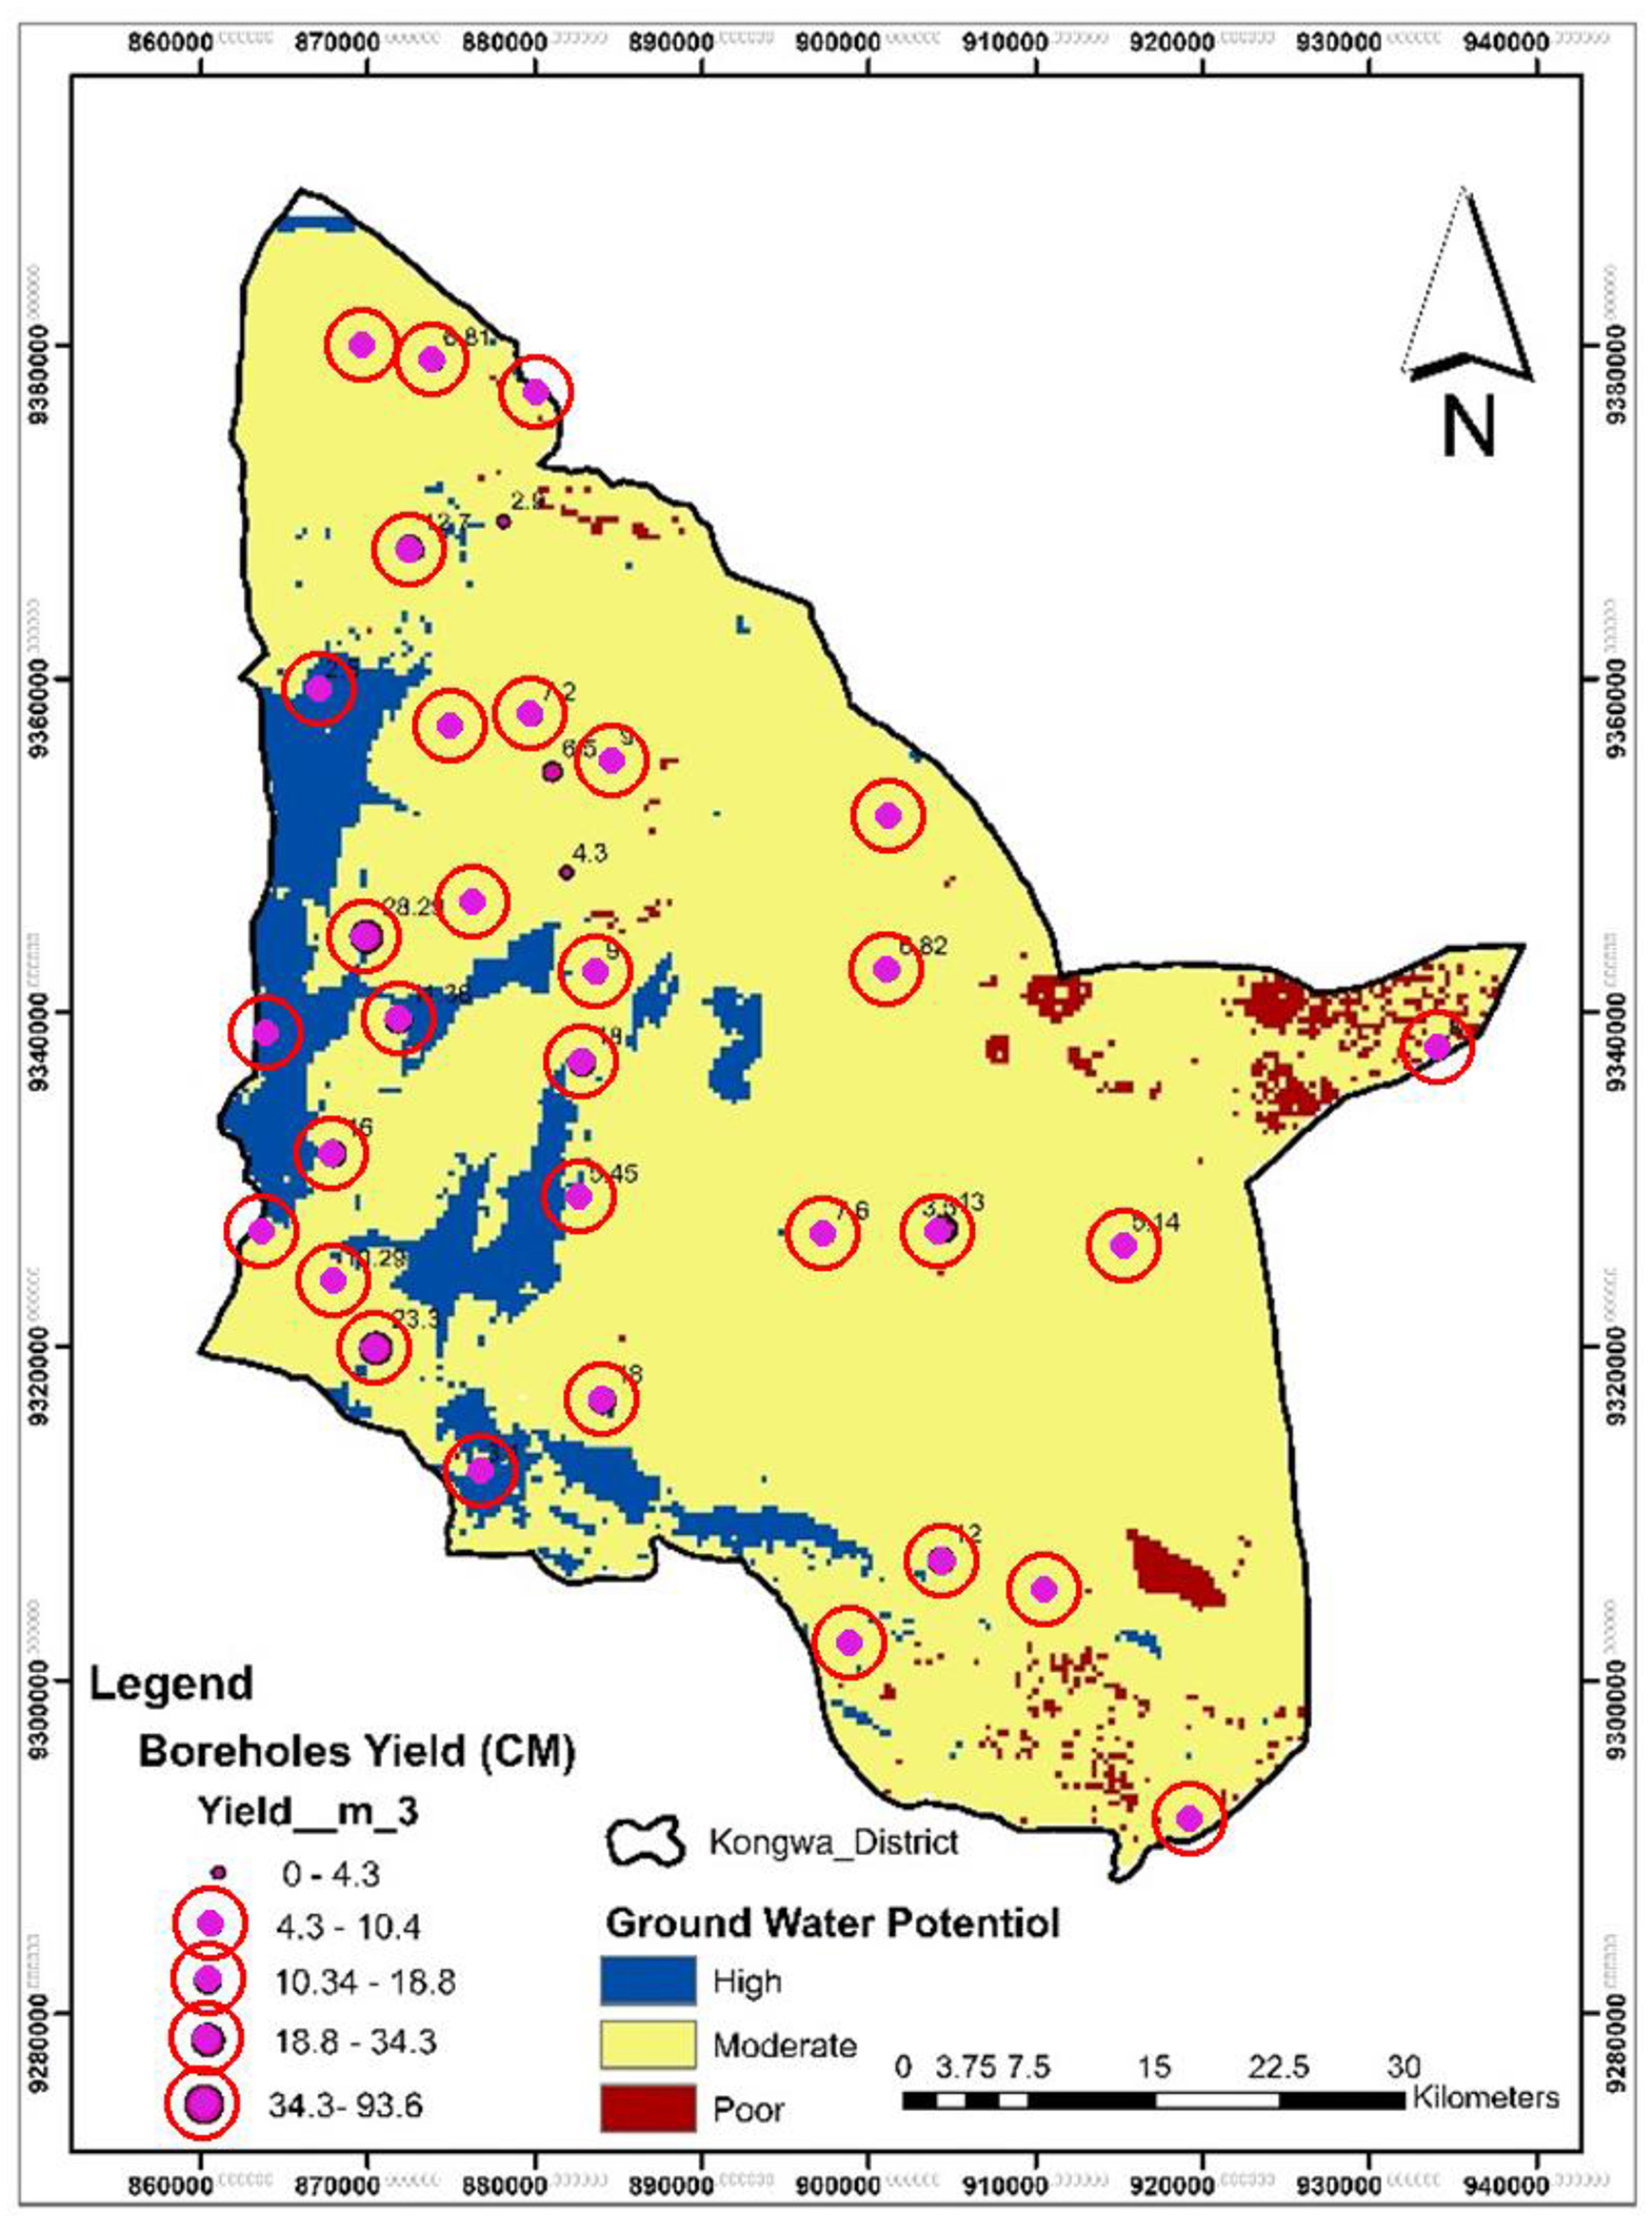
The maps depict the spatial distribution of groundwater potential in Kongwa District, classified into three zones: high, moderate, and poor in the left and Boreholes yield in the right.
3.3 Validation with borehole data
Using inventoried well points and yields (field/GIS overlay), the model achieved a success rate of 68% of productive wells falling within High + Very High zones. The correlation coefficient between GWPI and borehole yield (r) was 0.64, yielding R2 = 0.41. The Area Under Curve (AUC) from ROC analysis was 0.81, indicating good separation between productive and non-productive locations (MacDonald et al., 2012; Rahmati et al., 2016; Naghibi et al., 2017).
4 Discussion
This study aimed to achieve two key objectives, the first objective was to analyse environmental and hydrological factors influencing groundwater availability and the second objective was to identify and map areas with high groundwater potential, in Kongwa District. The results corresponding to each objective are discussed below.
To address the first objective, the study comprehensively analyzed the environmental (geology, soil type, slope, vegetation cover, land use, lineaments, drainage) and hydrological factors (rainfall) affecting groundwater potential (Magesh et al., 2012; Shekhar and Pandey, 2015). The multi-criteria analysis shows that terrain (slope), geology, and rainfall are the dominant physical controls on groundwater occurrence in Kongwa, with AHP weights of 0.2358 (slope), 0.2075 (geology), and 0.1887 (rainfall), respectively (Olomo et al., 2025). This ordering is consistent with the hydrogeologic logic for a semi-arid, hard-rock setting: gentler slopes lengthen residence time and favor percolation; fractured/crystalline bedrock governs secondary permeability; and spatial rainfall gradients regulate recharge opportunities. Lower, but still meaningful, contributions arise from soils (0.1321), drainage density (0.0943), lineament density (0.0755), and LULC (0.0660). Together, these factors explain the mapped pattern of groundwater potential across the district.
Slope is a critical factor influencing groundwater infiltration, as it determines the rate of surface runoff and the residence time of rainwater on the land surface. Likewise, slope facilitating better groundwater recharge, which is more favorable for groundwater-based irrigation without proper soil and water conservation measures. In gently sloping areas, surface runoff is slower, allowing rainwater more time to percolate into the ground, thus enhancing groundwater recharge. Conversely, steep slopes accelerate runoff and reduce infiltration opportunities, limiting groundwater accumulation. Therefore, slope serves as an essential indicator of groundwater prospect potential (Ettazarini, 2007; Saud, 2010). As supported by Adiat et al. (2012), slope can function as a proxy for surface runoff velocity and vertical percolation, with infiltration inversely proportional to slope gradient.
Geology is another influential factor for groundwater potential, Kongwa District is mostly underlain by ancient rocks of the Usagara mountains, which were created during the Archean and Proterozoic epochs of the Precambrian period (United Republic of Tanzania (URT), 1959). These dense crystalline rocks, including marble, quartzite, schists, and amphiboles, exhibit poor primary porosity, limiting natural groundwater storage. However, groundwater can be accessed through secondary features such as fractures and weathered zones, making the area moderately suitable for irrigated agriculture when boreholes are strategically placed. Historical drilling data from 1948 to 1960 reveal aquifer horizons under fractured granite and schists at depths ranging from 30 to 82 meters The geological heterogeneity throughout the district dramatically affects groundwater potential (Kongwa District, 2016). The western and northeastern areas, dominated by unconsolidated deposits like gravel and sand, demonstrate high to extremely high porosity and permeability, leading to significant groundwater potential (Mseli et al., 2023). Conversely, the central and southeastern areas, dominated by dense meta-sedimentary and meta-igneous formations, exhibit low to extremely low groundwater potential due to limited permeability. Fractured zones in hard crystalline rocks across the district may supply moderate groundwater if accurately identified by hydrogeological study and borehole placement.
The results also, indicated that rainfall is a crucial factor influencing groundwater recharge in Kongwa District. Annual rainfall varies significantly, with the primary wet season coming from November to April. Areas experiencing high rainfall, particularly in the western and southwestern sectors, demonstrate enhanced groundwater potential owing to superior infiltration and recharging, especially in areas characterized by permeable soils and fractured bedrock. In contrast, the eastern and southeastern regions have reduced rainfall, constraining groundwater reserves and complicating irrigation efforts without measures like rainwater gathering. The intensity of rainfall markedly affects recharge efficiency. Insufficient precipitation results in suboptimal soil saturation and restricted recharge, whereas moderate to abundant rainfall enhances infiltration and groundwater replenishment (Magesh et al., 2012; Shekhar and Pandey, 2015). Consequently, adequate precipitation is crucial for maintaining groundwater resources, especially in the context of groundwater-irrigated agriculture. Areas with high rainfall are more suitable for dependable irrigation systems, while arid locations may necessitate specific water management practices or alternate resources to sustain agricultural productivity.
Soils play a critical role in groundwater movement within the unsaturated zone, influenced by factors such as moisture content, infiltration rate, grain size, and specific soil composition (Cosby et al., 1984; Harini et al., 2018). In Kongwa District, the dominant soil texture is sandy clay loam, comprising ~48% of the area, followed by sandy loam at around 26% (Nhunda et al., 2024). These textures suggest a moderate water retention capacity and permeability, which are favorable for groundwater recharge. These zones are more favorable for groundwater-irrigated agriculture due to their relatively higher permeability and potential for aquifer development. Consequently, both weathered or fractured crystalline rock areas and sedimentary deposits present better potential for groundwater extraction, influencing the viability and design of irrigation systems in Kongwa District. These findings affirm that groundwater availability is a function of multiple interacting physical parameters, as similarly reported by Rahmati et al. (2016), Muavhi et al. (2022), and Ally et al. (2024).
The findings reveal that drainage and drainage density across Kongwa District varies, influencing the potential for groundwater recharge. Areas with low to very low drainage density (Classes 1–3), particularly found in the western, central, and southeastern zones, exhibit slower surface runoff and higher infiltration rates, making them highly favorable for groundwater accumulation and irrigation development (Godfray and Tembo, 2024). In contrast, areas with high to very high drainage density (Classes 4–5), mainly located in the northern and Northeastern parts, are characterized by rapid runoff and limited percolation due to steeper slopes or less permeable soils, reducing their suitability for groundwater-irrigated agriculture (Magesh et al., 2012). These spatial variations highlight the need for targeted water management strategies such as artificial recharge or watershed protection to optimize groundwater use across the entire district.
Lineament and lineament density also prey a crucial role in groundwater potential. This dense network of geological formations significantly improves subsurface permeability, promoting groundwater infiltration, movement, and storage (Olomo et al., 2025). Lineament and lineament density were classified into five density ranks, areas showing high to extremely high lineament density (Classes 4 and 5) indicate advantageous hydrogeological conditions for aquifer recharging, rendering them particularly appropriate for groundwater-dependent irrigation, especially in arid periods. Moderate-density zones (Class 3) have moderate potential and may necessitate additional water saving strategies, such as drip irrigation. Equally, regions characterized by low and extremely low density (Classes 2 and 1) exhibit restricted structural permeability and diminished groundwater capacity, presenting obstacles for sustainable agricultural practices in the absence of other water sources. Focusing on high-density areas for GWIA development can improve water accessibility, agricultural output, and climate resilience in the district.
Land use and land cover play a crucial role in influencing groundwater recharge in Kongwa District. The vegetation composition in Kongwa district predominantly consists of shrubs, interspersed with patches of acacia and baobab trees. Grasslands are prevalent in the northern and north-eastern areas, adjacent to Kiteto district (Lyanga and Chen, 2020). The southern and southeastern areas, characterized by croplands and rangelands, exhibit enhanced infiltration and recharge attributed to superior vegetation cover. Conversely, central, and northern areas characterized by bare soils and sparse vegetation experience diminished recharge due to erosion and surface sealing. Vegetation loss in the dry season, caused by overgrazing, deforestation, and slash-and-burn practices, exacerbates land degradation (United Republic of Tanzania (URT), 2016). The Land Use and Land Cover (LULC) map of Kongwa District (See Figure 10) the findings indicates that the terrain is predominantly characterized by rangeland (light brown), which encompasses a significant portion of the central and northern areas of the district. Dispersed areas of natural vegetation (green), agricultural fields (located in the southern and southeastern areas), and urbanized zones (red) delineate regions of human engagement, agricultural advancement, and ecological significance. Aligning irrigation practices with appropriate land cover and rehabilitating degraded areas is crucial for effective water management and enhance agricultural productivity and sustainability in the district.
Regarding the second objective, spatially the final groundwater-potential map partitions Kongwa into high (32%), moderate (45%), and poor (23%) zones. High-potential areas cluster in the west and south-west including Mlali, Msunjilile, Songambele, Tubugwe Kibaoni, Banyibanyi Mkutani, Mtanana, Pandambili, and Mkoka where favorable combinations of gentler relief, permeable/fractured substrates, balanced drainage density, and relatively higher rainfall and permeable soils coincide, which collectively enhance groundwater recharge, storage, and accessibility. The abundance of fractures in these high-density zones facilitates greater water retention and movement within the subsurface, making them highly suitable for groundwater-based irrigation. Consequently, these areas offer promising opportunities for sustainable agricultural production, particularly during dry seasons, by providing reliable and accessible water sources. Such areas are ideal for investment in boreholes, drip irrigation systems, and other water infrastructure, supporting the cultivation of water-intensive, high-value crops and contributing to improved agricultural productivity and rural livelihoods. The middle and northern areas of the district, shown in yellow, indicate moderate groundwater potential and encompass the majority of the land, including areas like Chitego, Songambele B, Silale, Mloleti and the peripheries of Ngomae, Chiwe and Mlanje. Conversely, eastern and southeastern especially in Pembamoto, Mbangilwa, Chamkoroma, Njoge, Mageseni and certain areas of Mlali ward were found to have poor groundwater potential, primarily due to steep slopes, crystalline bedrock, sparse vegetation, and low aquifer yields. These areas are less suitable for groundwater-irrigated agriculture and require integrated water resource management strategies tailored to their environmental constraints for instance, rainwater harvesting, construction of check dams, percolation pits, infiltration pits, protecting and managing upstreaming catchment areas through afforestation, terracing, and soil conservation.
The spatial differentiation in groundwater potential provides a strategic framework for localized planning regarding GWIA, high-potential zones can be prioritized for agricultural intensification, for example, increasing the availability of agricultural inputs (fertilizers, pesticides, proven seeds), cultivating high yield crop varieties and application of digital tools, weather forecasting, and data analytics in farm management. While moderate and low-potential areas the district planning regarding GWIA should focus on water conservation practices that enhances water infiltration and percolation, sustainable land use such as crop rotation and intercropping to maximize land productivity, and adaptive irrigation practices for example the use of sprinkler, water recycling and automated irrigation systems that use sensors. Effective mapping and understanding the spatial distribution of groundwater resources is crucial for informed decision-making in Kongwa District. This guides borehole positioning, infrastructural advancement, and land utilization planning essential elements for improving agricultural output, food security, and climate resilience in the area.
Out of the 35 boreholes found in areas classified as Good to Excellent groundwater potential, 28 were located exactly within those high-potential zones, while 7 were very close within about 100 m. The inclusion of exact borehole locations in the final groundwater potential map demonstrates a strong spatial correlation between modeled potential zones and empirical groundwater yields (Magesh et al., 2012; Shekhar and Pandey, 2015). The slight positional variations are attributable to resolution limitations, coordinate precision, and localized hydrogeologic heterogeneity. Overall, the validation confirms that the generated map provides a scientifically credible and decision-supportive representation of groundwater occurrence in the study area.
In comparison with previous studies in other semi-arid regions of Sub-Saharan Africa, such as those conducted by Makonyo and Msabi (2021); Kisiki et al. (2022), this study aligns with the broader understanding that geological structure (particularly lineament density), soil texture, and rainfall intensity are the most influential variables for groundwater occurrence. Unlike previous studies, this research includes environmental and socio-economic factors, stressing local stakeholder involvement in groundwater management (Adiat et al., 2012). Many policy frameworks have historically overlooked the intersection between geospatial insights and farmer-centered water management practices (Qadir et al., 2020; Seddon et al., 2021).
The implications of this research are multifaceted. Firstly, the identification of groundwater-rich zones provides a practical basis for targeting investments in borehole drilling, solar-powered irrigation, and water-saving technologies in agriculture. Secondly, the findings serve as a critical input for district-level water planning, land use zoning, and climate adaptation strategies. Moreover, the study underscores the importance of maintaining and restoring vegetation cover especially in bare and degraded zones as a strategy to improve infiltration and recharge. Integrating such ecosystem-based approaches would not only support irrigation but also enhance landscape resilience in the face of climate variability.
However, studying is not without limitations. Additionally, the resolution of the remote sensing imagery, while useful for regional-scale mapping, may not capture micro-scale variations in aquifer conditions. Furthermore, the lack of adequate borehole distribution across all villages constrains the accuracy of subsurface geological validation, as acknowledged in previous hydrogeological works (Godfray and Tembo, 2024).
5 Future research directions
Future research should consider integrating high-resolution geophysical surveys, such as Electrical Resistivity Tomography (ERT) and Ground Penetrating Radar (GPR), to refine subsurface aquifer characterization. Additionally, seasonal groundwater monitoring through real-time sensors could offer a more dynamic understanding of aquifer behavior under varying climatic conditions. Socio hydrological research is also necessary to explore how community practices, land tenure systems, and policy enforcement interact with groundwater sustainability. A longitudinal, interdisciplinary approach involving hydrologists, agronomists, and local communities will be crucial in designing adaptive and inclusive groundwater management strategies.
6 Conclusion and recommendations
Access to reliable groundwater resources is essential for sustaining agricultural productivity in semi-arid regions such as Kongwa District, where rainfall is erratic and surface water is insufficient. However, the lack of scientifically validated groundwater potential mapping has led to inefficient borehole siting, water scarcity, and underutilization of groundwater for irrigation. This study integrated Remote Sensing (RS), GIS, and the Analytic Hierarchy Process (AHP) to delineate groundwater-potential (GWP) zones in Kongwa District. The multi-criteria weighting shows that slope (0.2358), geology (0.2075), and rainfall (0.1887) are the most influential controls on groundwater occurrence in the area, with lower but still meaningful contributions from soil, drainage density, lineament density, and LULC.
The resulting GWP map classifies the district into High to moderate potential zones were concentrated in the western and southwestern areas notably Mlali, Pandambili, and Mkoka where favorable conditions for sustainable groundwater irrigation. These zones are marked by fractured aquifers, gentle slopes, permeable soils, moderate rainfall, and balanced drainage density. In contrast, the eastern and northeastern zones of the district, including Mtanana and Chamkoroma, demonstrated low groundwater potential due to steep slopes, hard crystalline rock (geology), sparse vegetation, and poor recharge condition. This reflecting the combined effects of the key determinants of groundwater occurrence, including lineament density, rainfall intensity, drainage pattern, vegetation cover, soil texture, and land use types. Model skill was evaluated by comparing the GWP index with field-observed borehole yields from the government inventory (35 wells), using the Pearson correlation coefficient as the primary statistic; this follows established practice in AHP–GWP studies and provides an objective, quantitative check on predictive mapping. This study provides a valuable scientific foundation for sustainable groundwater management in Kongwa District. The methodology and insights presented here can guide future research, improve irrigation planning, and contribute to national efforts toward achieving water security and agricultural resilience in Tanzania.
Statements
Data availability statement
The original contributions presented in the study are included in the article/supplementary material, further inquiries can be directed to the corresponding author.
Ethics statement
The study obtained ethical clearance from University of Dar es salaam; Ministry of local Government and Administration; Ministry of Water and National Irrigation Commission before data collection. The participants provided their written informed consent to participate in this study.
Author contributions
FZ: Writing – original draft, Writing – review & editing, Conceptualization, Data curation, Formal analysis, Methodology. JN: Supervision, Writing – review & editing. EL: Supervision, Writing – review & editing.
Funding
The author(s) declare that financial support was received for the research and/or publication of this article. The authors did not receive any financial support from any source for writing this article.
Acknowledgments
The authors would like to thank the University of Dodoma and Mott Foundation for financial support. The authors also thank the members of the Ministry of Water Emmanuel Florent Nahozya and Rajabu Z. Mwinyilapo, National Irrigation Commission and Kongwa District, for their invaluable advice and support during field data collection and technical support and Dr. Fadhili Bwagalilo and Dr. Ayoub Juma for academic writings advice.
Conflict of interest
The authors declare that the research was conducted in the absence of any commercial or financial relationships that could be construed as a potential conflict of interest.
Generative AI statement
The author(s) declare that no Gen AI was used in the creation of this manuscript.
Any alternative text (alt text) provided alongside figures in this article has been generated by Frontiers with the support of artificial intelligence and reasonable efforts have been made to ensure accuracy, including review by the authors wherever possible. If you identify any issues, please contact us.
Publisher’s note
All claims expressed in this article are solely those of the authors and do not necessarily represent those of their affiliated organizations, or those of the publisher, the editors and the reviewers. Any product that may be evaluated in this article, or claim that may be made by its manufacturer, is not guaranteed or endorsed by the publisher.
References
1
Adama A. Juscar N. Mama N. Tsoptie T. Rachida B. Elvis K. (2024). Delineation of groundwater potential zones using multi-criteria analysis (AHP), frequency ratios (RF), remote sensing and GIS: a case study of the Batcham municipality (west Cameroon). Discov. Water4:75. doi: 10.1007/s43832-024-00108-7
2
Adiat K. A. N. Nawawi M. N. M. Abdullah K. (2012). Assessing the accuracy of GIS-based elementary multi criteria decision analysis as a spatial prediction tool - A case of predicting potential zones of sustainable groundwater resources. J. Hydrol.440, 75–89. doi: 10.1016/j.jhydrol.03.028
3
Al-Abadi A. M. Al-Temmeme A. A. Al-Ghanimy M. A. (2016). A GIS-based combining of frequency ratio and index of entropy approaches for mapping groundwater availability zones at Badra-Al Al-Gharbi-Teeb areas, Iraq. Sustain. Water Resour. Manage.2, 265–283. doi: 10.1007/s40899-016-0056-5
4
Ally A. M. Yan J. Bennett G. Lyimo N. N. Mayunga S. D. (2024). Assessment of groundwater potential zones using remote sensing and GIS-based fuzzy analytical hierarchy process (F-AHP) in Mpwapwa District, Dodoma, Tanzania. Geosyst. Geoenviron.3:100232. doi: 10.1016/j.geogeo.2023.100232
5
Castillo J. L. U. Leal J. A. R. Cruz D. A. M. Vargas J. T. Celestino A. E. M. Tapia S. A. R. (2022). Delineation of groundwater potential zones (GWPZs) in a semi-arid basin through remote sensing, GIS, and AHP approaches. Water14, 1–29. doi: 10.3390/w14132138
6
Chen M. Zhang S. Liu S. Li M. Zhang T. Wu T. et al . (2025). Mapping the groundwater potential zones in mountainous areas of Southern China using GIS, AHP, and fuzzy AHP. Sci. Rep.15, 1–23. doi: 10.1038/s41598-025-01837-y
7
Cosby B. J. Hornberger G. M. Clapp R. B. Ginn T. R. (1984). A statistical exploration of the relationships of soil moisture characteristics to the physical properties of soils. Water Resour. Res.20, 682–690. doi: 10.1029/WR020i006p00682
8
De Bont C. Komakech H. C. Veldwisch G. J. (2019). Neither modern nor traditional: farmer-led irrigation development in Kilimanjaro Region, Tanzania. World Dev.116, 15–27. doi: 10.1016/j.worlddev.11.018
9
Ettazarini S. (2007). Groundwater potentiality index: a strategically conceived tool for water research in fractured aquifers. Environ. Geol.52, 477–487. doi: 10.1007/s00254-006-0481-0
10
Foster S. Cardy F. (2000). WTP463 Groundwater in Rural Development Facing the CiallevQges of Supply and Resource. Washington, DC: World Bank. doi: 10.1596/0-8213-4703-9
11
Godfray G. Tembo M. M. (2024). Assessment of ground water potentiality in semi-arid area of central Tanzania. Implication from geology and geomorphology of the dodoman supergroup. Geol. Ecol. Landscapes8, 165–184. doi: 10.1080/24749508.2022.2109833
12
Harini P. Sahadevan D. K. Manikyamba C. Durgaprasad M. Nandan M. J. Das I. C. (2018). Regional groundwater assessment of krishna river basin using integrated GIS approach. J. Indian Soc. Remote Sensing46, 1365–1377. doi: 10.1007/s12524-018-0780-4
13
Harroud A. Dhmane L. A. Benjmel K. Moustadraf J. Mehdi K. Mehdi I. et al . (2025). Assessing groundwater potential in the western high atlas (Morocco): an integrated approach based on remote sensing, GIS techniques, frequency ratio, and Shannon entropy. Sci. Afr.29:e02930. doi: 10.1016/j.sciaf.2025.e02930
14
Hilal I. Qurtobi M. Saadi R. Benmansour M. Aqnouy M. Bouizrou I. et al . (2024). Integrating remote sensing, GIS-based, and AHP techniques to delineate groundwater potential zones in the Moulouya Basin, North-East Morocco. Appl. Water Sci. 14, 122–139. doi: 10.1007/s13201-024-02175-6
15
Karandish F. Liu S. de Graaf I. (2025). Global groundwater sustainability: a critical review of strategies and future pathways. J. Hydrol. 657:133060. doi: 10.1016/j.jhydrol.2025.133060
16
Kisiki C. P. Bekele T. W. Ayenew T. Mjemah I. C. (2022). Geospatial application on mapping groundwater recharge zones in Makutupora basin, Tanzania. Heliyon8:e10760. doi: 10.1016/j.heliyon.2022.e10760
17
Komakech H. C. de Bont C. (2018). Differentiated access: challenges of equitable and sustainable groundwater exploitation in Tanzania. Water Altern.11, 623–637. Available online at: https://www.water-alternatives.org/ (Accessed July 27, 2025).
18
Kongwa District (2016). Kongwa District: Social-Economic Profile. Dodoma: President Office- Regional Adminstration and Local Government.
19
Lyanga A. A. Chen M-. K. (2020). The impacts of fee - free education policy in Junior Secondary schools in Tanzania. Asian J. Educ. Soc. Stud.13, 36–47. doi: 10.9734/ajess/2020/v13i330333
20
MacDonald A. M. Bonsor H. C. Dochartaigh B. É. Ó. Taylor R. G. (2012). Quantitative maps of groundwater resources in Africa. Environ. Res. Lett.7:024009. doi: 10.1088/1748-9326/7/2/024009
21
Magesh N. S. Chandrasekar N. Soundranayagam J. P. (2012). Delineation of groundwater potential zones in Theni district, Tamil Nadu, using remote sensing, GIS and MIF techniques. Geosci. Front.3, 189–196. doi: 10.1016/j.gsf.10.007
22
Makonyo M. Msabi M. M. (2021). Identification of groundwater potential recharge zones using GIS-based multi-criteria decision analysis: a case study of semi-arid midlands Manyara fractured aquifer, North-Eastern Tanzania. Remote Sensing Appl. Soc. Environ.23:100544. doi: 10.1016/j.rsase.2021.100544
23
Melese T. Belay T. (2022). Groundwater potential zone mapping using analytical hierarchy process and GIS in Muga Watershed, Abay Basin, Ethiopia. Global Challenges6, 1–13. doi: 10.1002/gch2.202100068
24
Mideksa G. Temesgen T. (2020). Irrigation water potential and land suitability assessment in Kurfa Chele-Girawa watershed, Wabe Shebelle River basin, Ethiopia. Turk. J. Agric. Food Sci. Technol. 8, 139–146. doi: 10.24925/turjaf.v8i1.139-146.2863
25
Mkonda M. Y. He X. (2017). Yields of the major food crops: implications to food security and policy in Tanzanias semi-arid agro-ecological zone. Sustainability9, 1490–1506. doi: 10.3390/su9081490
26
Mseli Z. H. Mwegoha W. J. Gaduputi S. (2023). Identification of potential groundwater recharge zones at Makutupora basin, Dodoma Tanzania. Geol. Ecol. Landsc.7, 198–211. doi: 10.1080/24749508.2021.1952763
27
Muavhi N. Thamaga K. H. Mutoti M. I. (2022). Mapping groundwater potential zones using relative frequency ratio, analytic hierarchy process and their hybrid models: case of Nzhelele-Makhado area in South Africa. Geocarto Int.37, 6311–6330. doi: 10.1080/10106049.2021.1936212
28
Naghibi S. A. Ahmadi K. Daneshi A. (2017). Application of support vector machine, random forest, and genetic algorithm optimized random forest models in groundwater potential mapping. Water Resour. Manage.31, 2761–2775. doi: 10.1007/s11269-017-1660-3
29
National Bureau of Statistics (NBS) (2022). 2022 Population and Housing Census: Population by Administrative Areas. Dodoma: National Bureau of Statistics. Available online at: https://www.nbs.go.tz/uploads/statistics/documents/sw-1720088450-2022%20PHC%20Initial%20Results%20-%20English.pdf?utm (Accessed October 9, 2024).
30
Ngondo J. Cheng H. Mango J. Dubi A. Li X. Nobert J. (2022). Hydrological response of the wami-ruvu basin to land-use and land-cover changes and its impacts for the future. Water14, 184–198. doi: 10.3390/w14020184
31
Nhunda D. M. Semoka J. M. Hamisi T. (2024). Assessment of soil fertility status in selected fields under maize production in Kongwa District, Dodoma Region, Tanzania. J. Agric. Ecol. Res. Int.25, 32–47. doi: 10.9734/jaeri/2024/v25i1570
32
Olomo O. K. Danga O. A. Aliyu A. O. (2025). Exploration of quality groundwater through lineament delineation in Okene and its surroudings. Geosyst. Geoenviron.4:100350. doi: 10.1016/j.geogeo.2024.100350
33
Ombasa D. T. Kosgei J. R. Nyandwaro G. Munishi E. S. (2022). Multi-criteria approach to assess groundwater potential: a case study of Baringo County, Kenya. Water Pract. Technol.17, 2199–2223. doi: 10.2166/wpt.2022.122
34
Patel D. K. Thakur T. K. Thakur A. Karuppannan S. Swamy S. L. Pant R. R. (2024). Groundwater potential zone mapping using AHP and geospatial techniques in the upper Narmada basin, central India. Discov. Sustain.5, 1–10. doi: 10.1007/s43621-024-00560-4
35
Qadir J. Bhat M. S. Alam A. Rashid I. (2020). Mapping groundwater potential zones using remote sensing and GIS approach in Jammu Himalaya, Jammu and Kashmir. GeoJournal, 85, 487–504. doi: 10.1007/s10708-019-09981-5
36
Rahmati O. Pourghasemi H. R. Melesse A. M. (2016). Application of GIS-based data driven random forest and maximum entropy models for groundwater potential mapping: a case study at Mehran Region, Iran. Catena137, 360–372. doi: 10.1016/j.catena.10.010
37
Saaty T. L. (1980). Marketing applications of the analytic hierarchy process. Manage. Sci.26, 641–658. doi: 10.1287/mnsc.26.7.641
38
Saidu A. A. Aldrees A. Dan'azumi S. Abba S. I. Hamza S. M. (2024). Groundwater potential mapping in semi-arid region of Northern Nigeria by integrating analytic hierarchy process and GIS. Front. Water6:1484753. doi: 10.3389/frwa.2024.1484753
39
Saud M. Al. (2010). Mapping potential areas for groundwater storage in Wadi Aurnah Basin, western Arabian Peninsula, using remote sensing and geographic information system techniques. Hydrogeol. J.18, 1481–1495. doi: 10.1007/s10040-010-0598-9
40
Seddon D. Kashaigili J. J. Taylor R. G. Cuthbert M. O. Mwihumbo C. MacDonald A. M. (2021). Focused groundwater recharge in a tropical dryland: empirical evidence from central, semi-arid Tanzania. J. Hydrol. Reg. Stud.37, 1–18. doi: 10.1016/j.ejrh.2021.100919
41
Selvam S. Manimaran G. Sivasubramanian P. Arun K. V. Chidambaram S. (2014). GIS-based evaluation of water quality index of groundwater resources around Tuticorin coastal city, South India. Environ. Earth Sci.71, 2847–2867. doi: 10.1007/s12665-013-2662-y
42
Shekhar S. Pandey A. C. (2015). Delineation of groundwater potential zone in hard rock terrain of India using remote sensing, geographical information system (GIS) and analytic hierarchy process (AHP) techniques. Geocarto Int.30, 402–421. doi: 10.1080/10106049.2014.894584
43
Thakur J. K. Singh S. K. Ekanthalu V. S. (2017). Integrating remote sensing, geographic information systems and global positioning system techniques with hydrological modeling. App. Water Sci.7, 1595–1608. doi: 10.1007/s13201-016-0384-5
44
United Republic of Tanzania (URT) (1959). Water Ordinance (Cap. 257 of the Laws of Tanzania). Dar es Salaam: Government Printer. Available online at: https://files.core.ac.uk/download/pdf/7115756.pdf?utm (Accessed May 2, 2025).
45
United Republic of Tanzania (URT) (2016). National Five-Year Development Plan 2016/17-2020/21: Nurturing Industrialization for Economic Transformation and Human Development. Dodoma: Ministry of Finance and Planning. Available online at: https://www.eeas.europa.eu/sites/default/files/gcca_tz_policy_brief_1_water_2019_v6.pdf?utm (Accessed March 11, 2025).
46
United Republic of Tanzania (URT) (2002). National Water Policy (NAWAPO 2002). Dar es Salaam: Ministry of Water and Livestock Development. Available online at: https://www.maji.go.tz/uploads/publications/sw1742701826-NATIONAL%20WATER%20POLICY.pdf (Accessed August 24, 2024).
47
United Republic of Tanzania (URT) Ministry of Water. (2021). Integrated Water Resources Management and Development Plan (IWRMDP) for the [Name] Basin, Tanzania. Dodoma: Ministry of Water. Available online at: https://www.gwp.org/globalassets/global/activities/act-on-sdg6/sdg-map/stage-2-reports/sdg-6-iwrm-action-plan-tanzania.pdf?utm (Accessed August 18, 2025).
48
Upadhyay R. K. Kishore N. Tripathi G. Singh S. K. Đurin B. Šamanović S. et al . (2023). Groundwater potential zone mapping in the Ghaggar River Basin, North-West India, using integrated remote sensing and GIS techniques. Water15, 1–21. doi: 10.3390/w15050961
49
USDA (2014). Inherent Factors Affecting Soil Infiltration, Natural Resources Conservation Service. Washington, DC: USDA, 1–7.
50
Villholth K. G. Ganeshamoorthy J. Rundblad C. M. Knudsen T. S. (2013). Smallholder groundwater irrigation in sub-Saharan Africa: an interdisciplinary framework applied to the Usangu plains, Tanzania. Hydrogeol. J.21, 1481–1495. doi: 10.1007/s10040-013-1016-x
Summary
Keywords
groundwater potential, geospatial analysis, irrigated agriculture, Kongwa District, analytical hierarchy process (AHP)
Citation
Zacharia F, Nobert J and Liwenga E (2025) Geospatial mapping of groundwater potential for irrigated agriculture in semi-arid Kongwa District, Central Tanzania. Front. Water 7:1679500. doi: 10.3389/frwa.2025.1679500
Received
04 August 2025
Revised
12 November 2025
Accepted
18 November 2025
Published
12 December 2025
Volume
7 - 2025
Edited by
S. Shanmugan, Koneru Lakshmaiah Education Foundation, India
Reviewed by
Ashish Khanal, TERI School of Advanced Studies (TERI SAS), India
Dawit Yohannes Meskele, Marche Polytechnic University, Italy
Updates
Copyright
© 2025 Zacharia, Nobert and Liwenga.
This is an open-access article distributed under the terms of the Creative Commons Attribution License (CC BY). The use, distribution or reproduction in other forums is permitted, provided the original author(s) and the copyright owner(s) are credited and that the original publication in this journal is cited, in accordance with accepted academic practice. No use, distribution or reproduction is permitted which does not comply with these terms.
*Correspondence: Faida Zacharia, faidazaka@gmail.com; faida.zacharia@student.udsm.ac.tz
Disclaimer
All claims expressed in this article are solely those of the authors and do not necessarily represent those of their affiliated organizations, or those of the publisher, the editors and the reviewers. Any product that may be evaluated in this article or claim that may be made by its manufacturer is not guaranteed or endorsed by the publisher.