 Haileyesus Belay Lakew1,2
 Meron Teferi Taye
- 1International Water Management Institute, Addis Ababa, Ethiopia
- 2Center for Water Research, Institute of Water, Environment and Climate Research (IWECR), Addis Ababa University, Addis Ababa, Ethiopia
- 3Department of Meteorology, University of Nairobi, Nairobi, Kenya
- 4School of Geography and the Environment, University of Oxford, Oxford, United Kingdom
Reliable flood monitoring and prediction remain a challenge in data-scarce regions, particularly in arid and semi-arid environments. This study explores the integration of remote sensing data and machine learning techniques to improve flood detection and early warning capabilities in Lodwar Town of the Turkwel Basin, Kenya. This depended on finding a relationship between daily rainfall and Normalized Difference Water Index (NDWI). Among multiple rainfall products evaluated, Climate Hazards Group InfraRed Precipitation with Station (CHIRPS) was selected due to its fine spatial resolution and performance. Daily NDWI time series derived from Aqua MODIS (Moderate Resolution Imaging Spectroradiometer) imagery were used as a proxy for water accumulation and flood indicators. A python-based Decision Tree Regressor (DTR) model was trained using the daily CHIRPS rainfall data with various lag times, along with auxiliary meteorological variables including relative humidity, wind speed, and mean temperature for the period from 2002 to 2024 to predict NDWI of Lodwar Town. The machine learning model substantially improved the correlation between rainfall and NDWI, raising the correlation coefficient by 25%. Spatial analysis of rainfall-NDWI correlation revealed that areas in the west, northwest, and southwest of Lodwar Town, with elevations between 508 m and 648 m have high correlation. Rainfall in these regions can serve as signal for potential rapid flooding with 0-day lag-time in Lodwar Town situated at an elevation of approximately 500 m. These areas are not necessarily the primary high rainfall sources, rather they act as signal zones for floods of Lodwar Town that can provide flood early warning information. The proposed methodology in this study can offer a practical approach to anticipatory action and flood risk reduction for vulnerable communities in remote regions with no or limited hydrometeorological stations.
1 Introduction
Floods have become a pressing global issue, causing widespread devastation and economic losses. Globally, during 1990–2022 period 4,713 events were recorded impacting over 3.2 billion people, causing 218,000 + deaths, and inflicting more than $1.3 trillion in economic losses worldwide (Liu et al., 2024). In 2024, the Australian National University (ANU-led) Global Water Monitor reported that water-related disasters (mainly floods) caused more than $550 billion in losses, displaced roughly 40 million people, and resulted in nearly 8,700 deaths globally (Van Dijk et al., 2025).
Africa is one of the highly vulnerable continents to climate-related disasters, with floods causing widespread disruption in recent years (WMO, 2025). For instance, devastating floods after consecutive years of below average rainfall in East Africa (Taye and Dyer, 2022; WMO, 2025) is a case in point. In East Africa, recurrent flooding driven by climate extremes and rising water levels affected over one million people in 2024 alone through displacement, loss of homes and livelihoods, damage to infrastructure, and limited access to clean water and basic services. More than 500 people lost their lives, and hundreds of thousands were displaced (IOM, 2024; UNICEF, 2024).
Floods in Kenya’s Turkana County have caused extensive damage over the years, impacting both the physical environment and the local economy. The Lodwar Town in the county has faced repeated flood disasters caused by the Turkwel River, a perennial river, that frequently overflows during the rainy season and the Kawalasee River, a seasonal tributary, prone to sudden flash floods (Taye, 2025). Significant flood events occurred in multiple years in the past decade, including years 2016, 2018, 2019, 2022, and 2024, each posing unique challenges to the local community (Korzenevica et al., 2024a,b). In 2016, heavy rains caused rivers to overflow, leading to loss of lives and displacement of over 1,000 residents. Subsequent floods in 2019 destroyed nine out of twelve boreholes supplying water to the town, affecting access to clean water (Korzenevica et al., 2024b). In 2022, rising waters submerged critical boreholes and irrigation schemes, further exacerbating water shortages and threatening food security for thousands (Korzenevica et al., 2024b). By 2024, poor drainage systems and inadequate waste management intensified the flooding problem, increasing health risks due to contaminated water sources (Wanguba et al., 2024).
To respond to the increasing flooding, one of the approaches is understanding the characteristics of the floods and their early signals through modelling approaches. Modelling floods using hydraulic and hydrological models requires high temporal resolution of historical rainfall and streamflow datasets, in addition to high-resolution digital elevation terrains data (Brázdil et al., 2024; Ma et al., 2021; Rinat et al., 2021). However, many flood-affected areas in Africa, which are predominantly lowlands and plains, lack sufficient historical high-resolution hydro-meteorological datasets compared to other regions (Li et al., 2023; Zhang et al., 2022). This is the case for Lodwar Town in Kenya.
Recently, other approaches leveraged advanced technologies like radar for detecting and forecasting floods. These methods also utilize ultrasonic and infrared sensors to measure rainfall rates and water levels in real-time, providing timely warnings for floods (Martinaitis et al., 2023; Mashaly and Ghoneim, 2018; Prakash et al., 2023). Obtaining advanced high-technology instruments and high-quality observed datasets is a significant challenge in developing countries in Africa, including Kenya, particularly in basins like the Turkwel, where ground observation datasets are scarce due to the absence of gauging stations. Consequently, remote sensing technology, utilizing satellite imagery, emerges as the most effective and viable method for detecting floods in areas with limited or no gauging stations available (Atefi and Miura, 2022; Anushree and Singh, 2023; Sadiq and Imran, 2022).
Although Normalized Difference Water Index (NDWI), rainfall products, and machine learning have been applied in flood studies [e.g., Obada et al. (2025); Wedajo et al. (2024)], most efforts have focused on detecting flood sources in data-rich regions. Such approaches remain limited in areas where hydrological observations and monitoring infrastructure are scarce.
This study develops a low-cost framework tailored for data-scarce regions that not only identifies rainfall signal zones but also demonstrates potential for flood forecasting when forecasted rainfall is available. Using Lodwar Town, Kenya, as a case study, the integration of freely available satellite rainfall products and machine learning offers a scalable approach for enhancing flood detection and early warning.
2 Study area
The Turkwel River, also known as the Suam River at its source is located in the northwest of Kenya and flows to the north covering a total area of 23,740 km2. The river originates at Mount Elgon (4,321 m.a.s.l) and drains into Lake Turkana (361 m.a.s.l) flowing a total journey of 125 km as shown in Figure 1 (Gabriel Stecher, 2019). The climate of the Turkwel River basin in northern Kenya is characterized as semi-arid in the highlands and arid in the lowlands. This region experiences significant rainfall variability, with a bimodal annual rainfall pattern as shown in Figure 2, that experiences long rains from March to May peaking in April and short rains from October to December peaking in October. In the higher south-western area, annual rainfall ranges from 900 to 1,750 mm, while the arid lowlands receive much less, typically between 100 to 400 mm per year (Gabriel Stecher, 2019; Hirpa et al., 2018). This river is the main source of riverine flood in the Lodwar Town. Additionally, the Kawalasee River is the second most significant source of flooding in Lodwar Town, next in magnitude to the Turkwel River. It is a seasonal tributary of the Turkwel that drains the north-western part of the basin toward Lodwar. Unlike the perennial Turkwel, the Kawalasee typically remains dry during prolonged dry seasons but becomes a powerful flash flood channel during periods of intense rainfall.
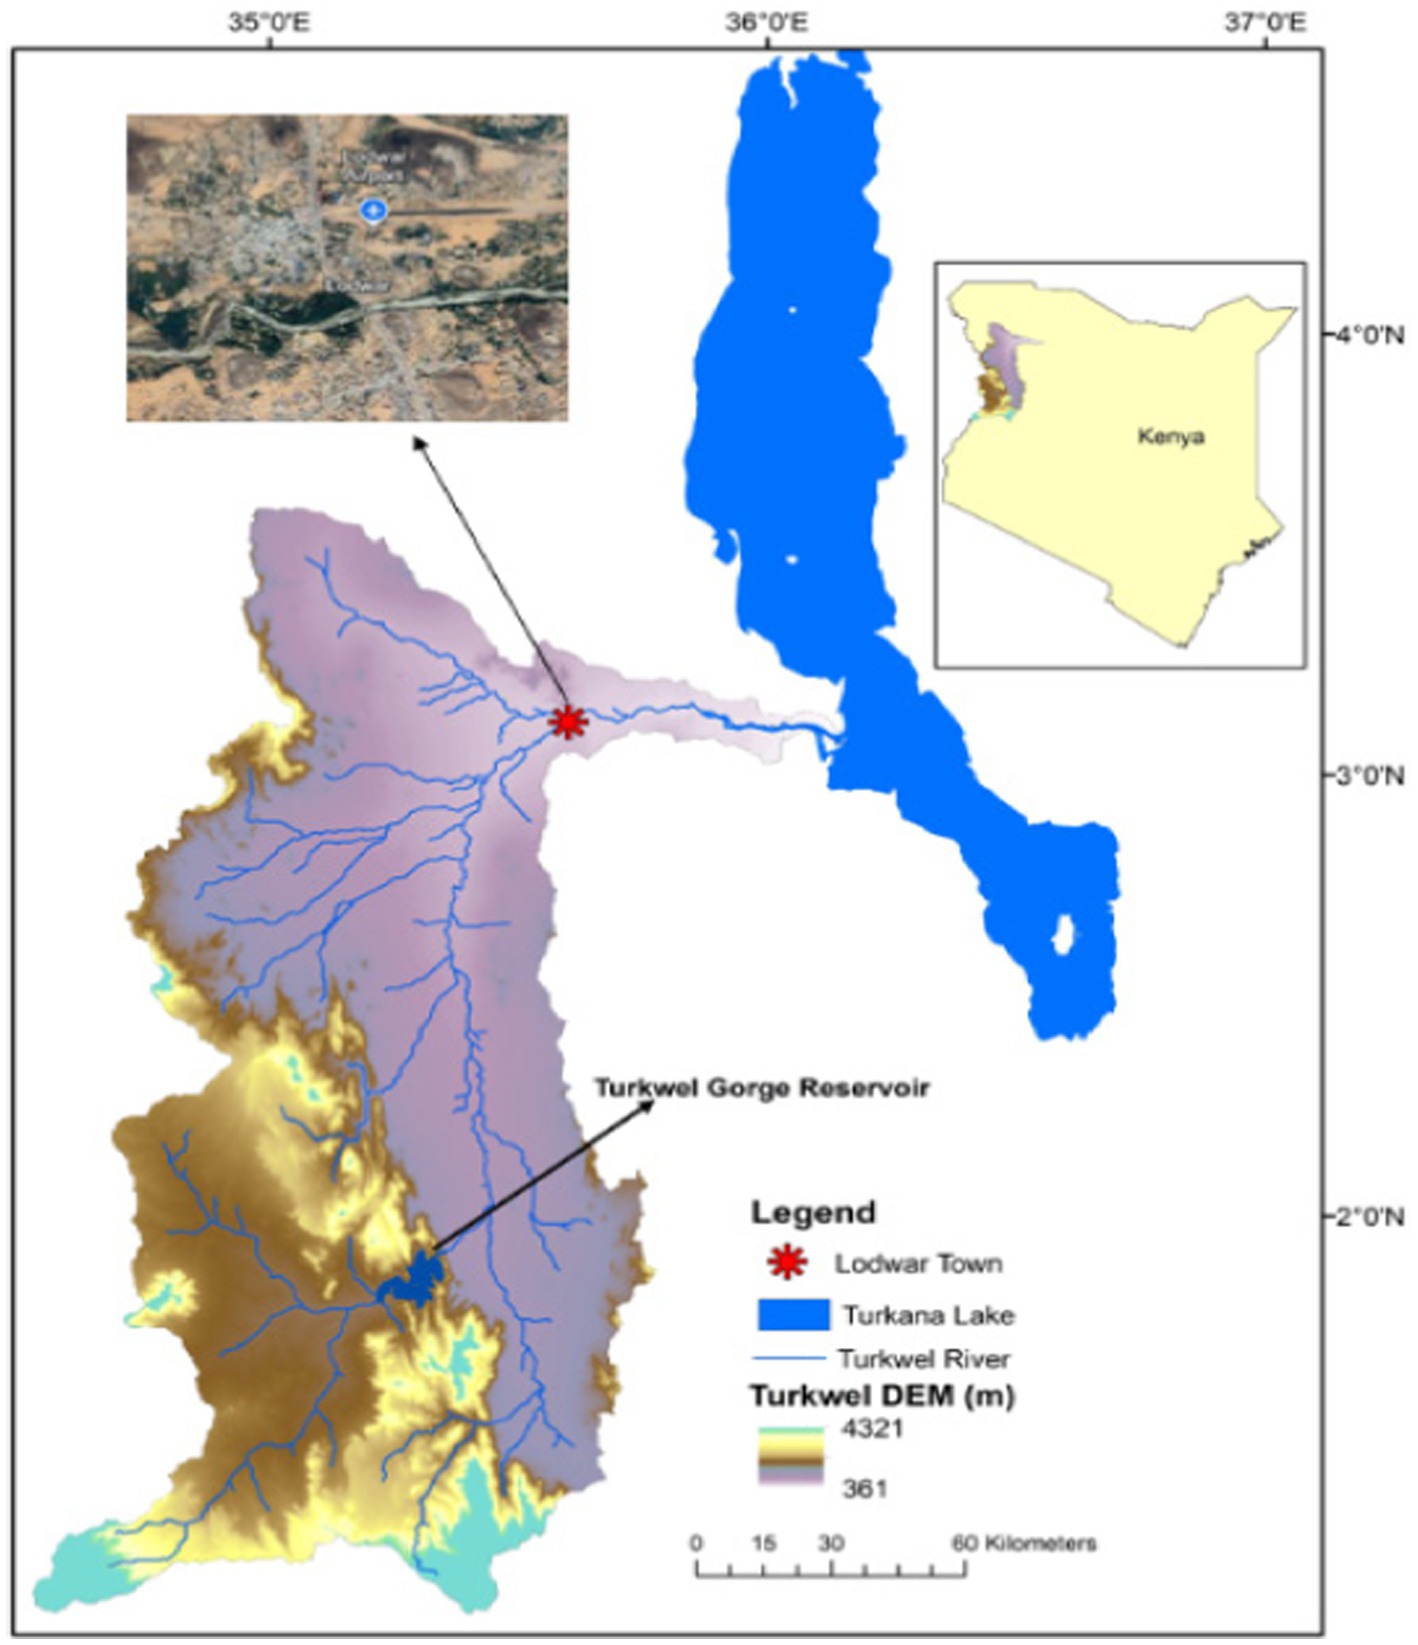
Figure 1. Location of Lodwar Town within the Turkwel Basin and Lake Turkana, Kenya.
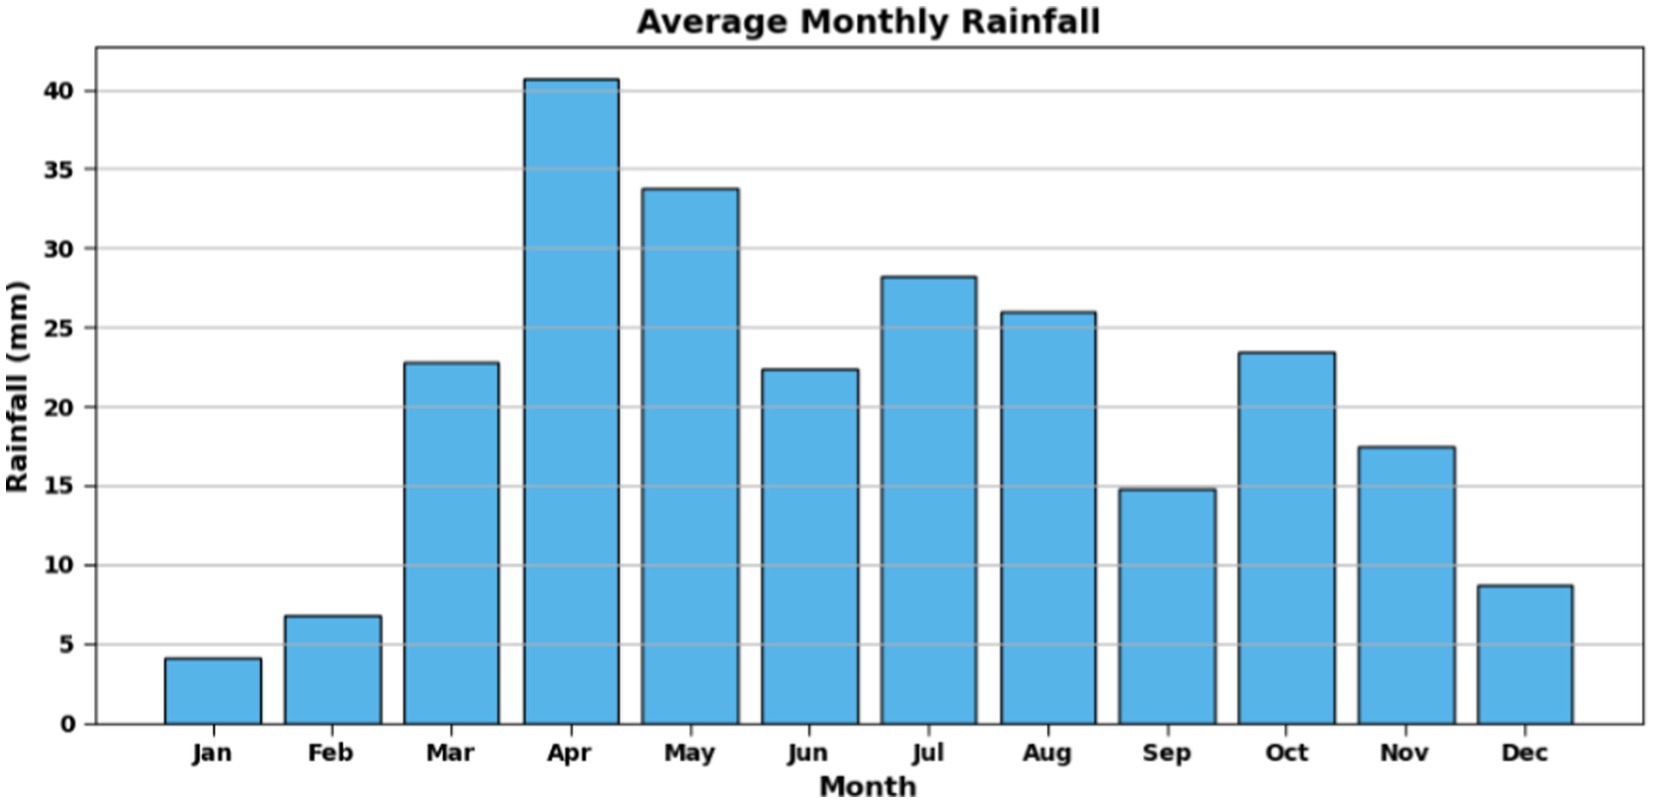
Figure 2. Spatial mean monthly rainfall of Turkwel Basin for the period from 2002 to 2024.
Lodwar Town that covers a total area of 17 km2 is located in north-western Kenya in Turkwel Basin, serving as the capital of Turkana County.1 It is situated west of Lake Turkana along the A1 Road, which connects it to other major towns and regions in the area. The town lies between latitudes 3°40′ and 4°30’ North and longitudes 35°36′ and 36°40′East, making it a strategic point in the region. Surrounded by geographical features such as the Loima Hills to the west, Lodwar is characterized by its hot desert climate with mean temperatures around 29.4 °C (Figure 3) and maximum reaches up to 38 °C. The Potential Evapotranspiration (PET) is high due to the hot, dry climate. Estimates range from about 2,000 to 2,500 mm per year. As the largest town in the region, Lodwar plays a pivotal role in local trade and serves as a gateway to exploring the unique landscapes and cultures of Turkana County (Gabriel Stecher, 2019). The location of the town is shown in Figure 1 relative to Kenya and Lake Turkana.
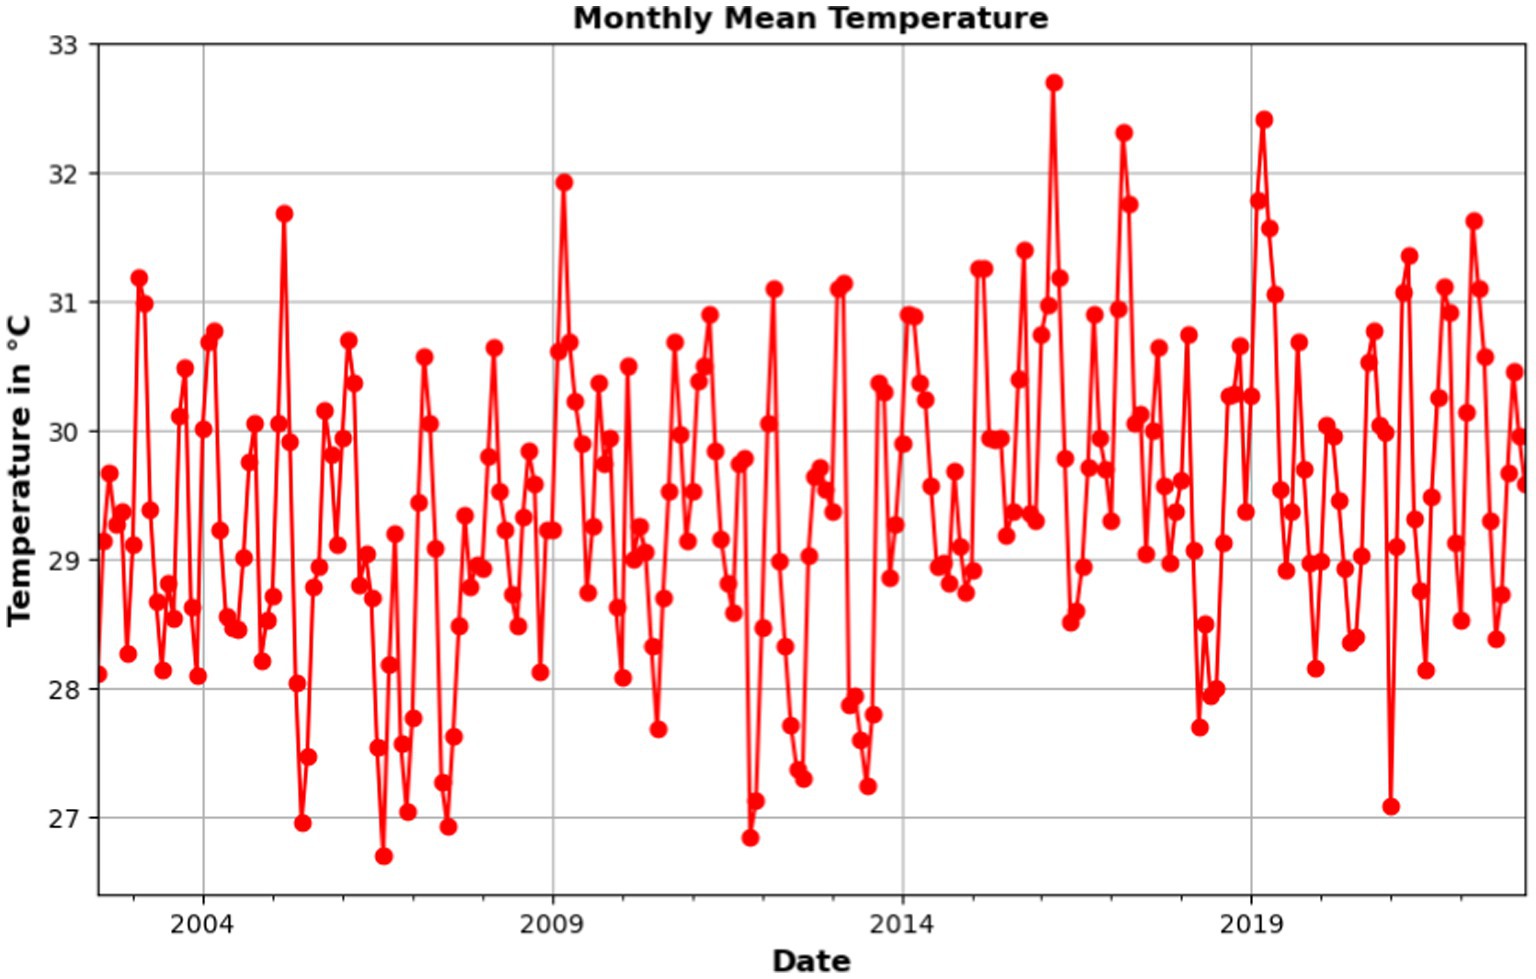
Figure 3. Monthly mean Temperature of Lodwar Town for the period from 2002 to 2024.
2.1 Datasets
2.1.1 Climatological datasets
For the Lodwar Town due to unavailability of in-situ rainfall observations for 2002–2024, we used multiple gridded, satellite-based precipitation products to obtain relationship between rainfall and NDWI and delineate flood-prone zones. Datasets with high spatial and temporal resolution and long-term coverage were selected: CHIRPS (0.05° × 0.05°, infrared-based, 1981–present; Funk et al., 2015). The Multi Source Weighted Ensemble Precipitation (MSWEP, 0.1° at 3-hourly intervals, combining gauges, satellite, and reanalysis data Beck et al., 2017). The Integrated Multi-satellitE Retrievals (IMERG, 0.1° × 0.1° at half-hourly intervals, merged GPM satellite data Rajagopal et al., 2021; Saouabe et al., 2022). The Tropical Applications of Meteorology using Satellite (TAMSAT, ~0.0375° daily estimates from Meteosat cold cloud duration data Maidment et al., 2014; Tarnavsky et al., 2014).
For flood forecasting, CHIRPS-GEFS was used, which blends CHIRPS observations with NCEP’s GEFS to create bias-corrected forecasts (5-, 10-, and 15-day totals); in this study, we focus on 10-day forecast anomalies via the ClimateSERV portal to capture impending rainfall signals. Additionally, we retrieved daily meteorological variables (relative humidity at 2 m, wind speed at 2 m, and mean temperature at 2 m) for the Turkwel Basin for the period 2002–2024 from NASA’s POWER portal. These climate predictors were employed as input features in a Decision Tree Regression (DTR) model to simulate the NDWI time series and thus infer flood dynamics. The full list of input variables is given in Table 1.
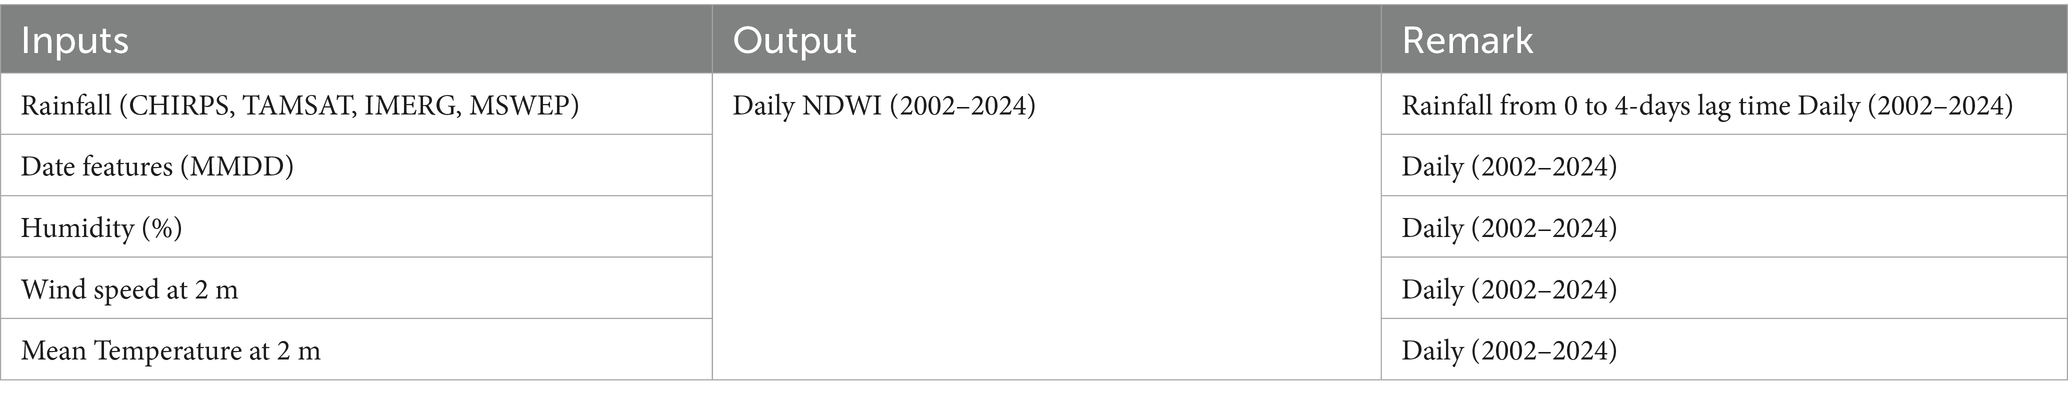
Table 1. Input variables and output used for machine learning training.
2.2 Satellite products for obtaining NDWI
NDWI is a remote sensing index used to detect and monitor water bodies. Table 2 summarizes key non-commercial satellite imagery products for NDWI time series generation. Moderate Resolution Imaging Spectroradiometer (MODIS), a NASA-operated satellite sensor, provides daily revisit capability with a 250 m spatial resolution, making it suitable for detecting short-lived flood events. Sentinel-2 offers higher spatial resolution at 10 m but with a 5-day revisit period, which may be less effective for capturing brief flood events. In this study, Aqua MODIS data was utilized for time-series analysis and machine learning to investigate the relationships between water pixel dynamics and daily rainfall in Lodwar Town. Sentinel-2 data was employed to assess historical flood events by mapping and examining the spatial distribution of flood inundation during the rainy seasons (March–May and October–December).
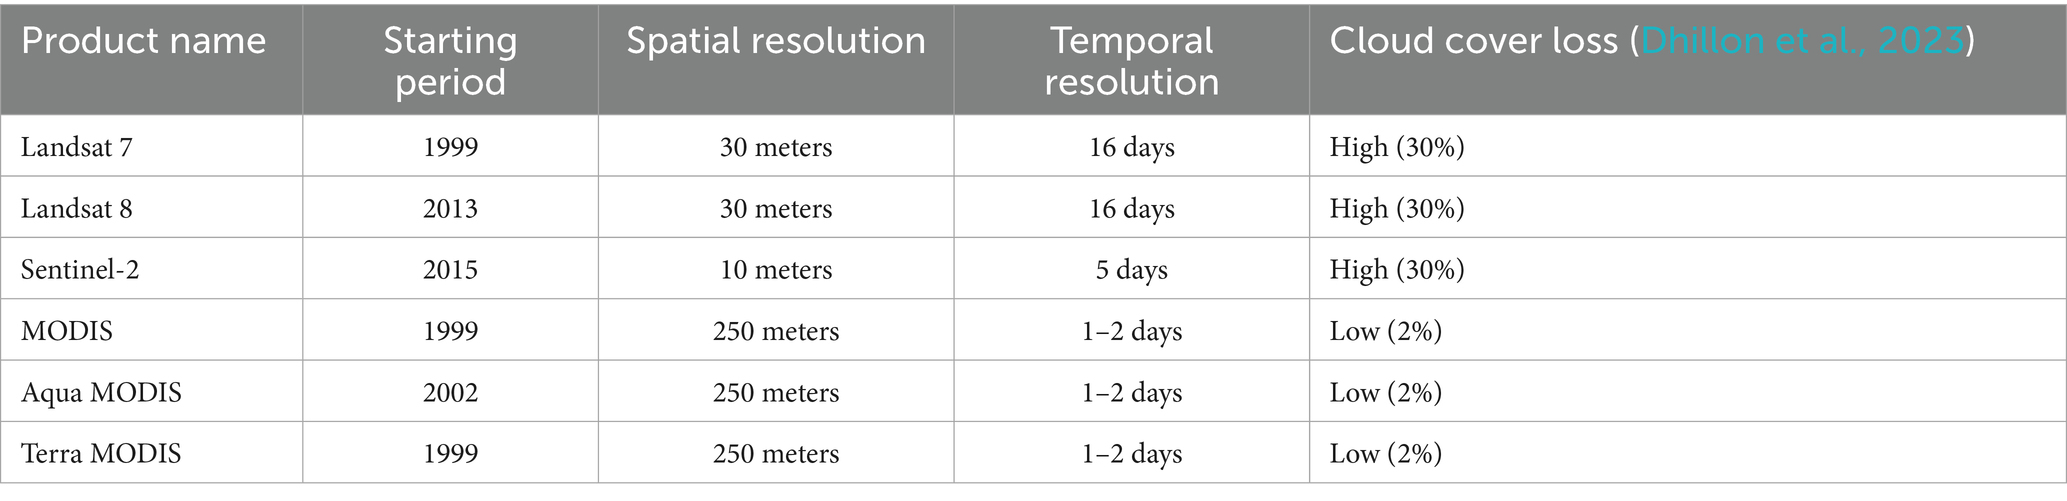
Table 2. Common types of non-commercial satellite imagery products.
3 Methodology
3.1 Preliminary assessment
In data-scarce regions where no instrumental flood records are available, community-based data collection provides critical context for analysis. To support this approach, a stakeholder workshop was held in Lodwar from May 2021–2023 under the CLARE PALM-TREEs project, hosted by the International Water Management Institute (IWMI) following the establishment of Turkana’s Climate Information System (CIS). The workshop engaged approximately 30 participants, including representatives from county government departments, local meteorological services, NGOs, academic institutions, and community leaders, ensuring that both scientific expertise and local knowledge informed the discussions.
Field visits and participatory mapping exercises identified flood “hot spots,” including Napetet village and the confluence of the Turkwel and Kawalasee rivers, validating remote sensing–derived inundation zones. Community members highlighted the multi-dimensional impacts of floods, such as borehole submergence, riverbank erosion, and damage to housing and infrastructure. These insights directly informed the study by (i) refining the identification of flood prone areas, (ii) contextualizing rainfall–NDWI correlations with observed flood experiences, and (iii) emphasizing practical priorities such as integration of traditional knowledge with scientific forecasting and early warning.
Discussions further clarified the types, sources, and seasonality of floods affecting the town. Participants reported two primary flood types: riverine flooding from Turkwel River overflow and flash flooding from the seasonal Kawalasee River. The major flood season occurs from March to May, peaking in April, with a secondary season from October to December, peaking in October.
Stakeholders also noted a perceived increase in rainfall in recent years, identifying this as a key driver of more frequent flooding, and highlighted the expansion of Lake Turkana as a visible indicator of this trend. These community observations were subsequently examined and validated using remote sensing data. Rainfall trends were analysed using the CHIRPS dataset spanning from 1981 to 2024, while changes in the surface area of Lake Turkana were assessed using Sentinel-2 imagery from 2018 to 2024. As illustrated in Figure 4, the CHIRPS data confirms a rising trend in annual rainfall in Turkwel Basin. Additionally, Figure 5 shows that the surface area of Lake Turkana expanded by approximately 585 km2 during the 2018–2024 period. The Blue color indicates the expanded area throughout the Lake Turkana.
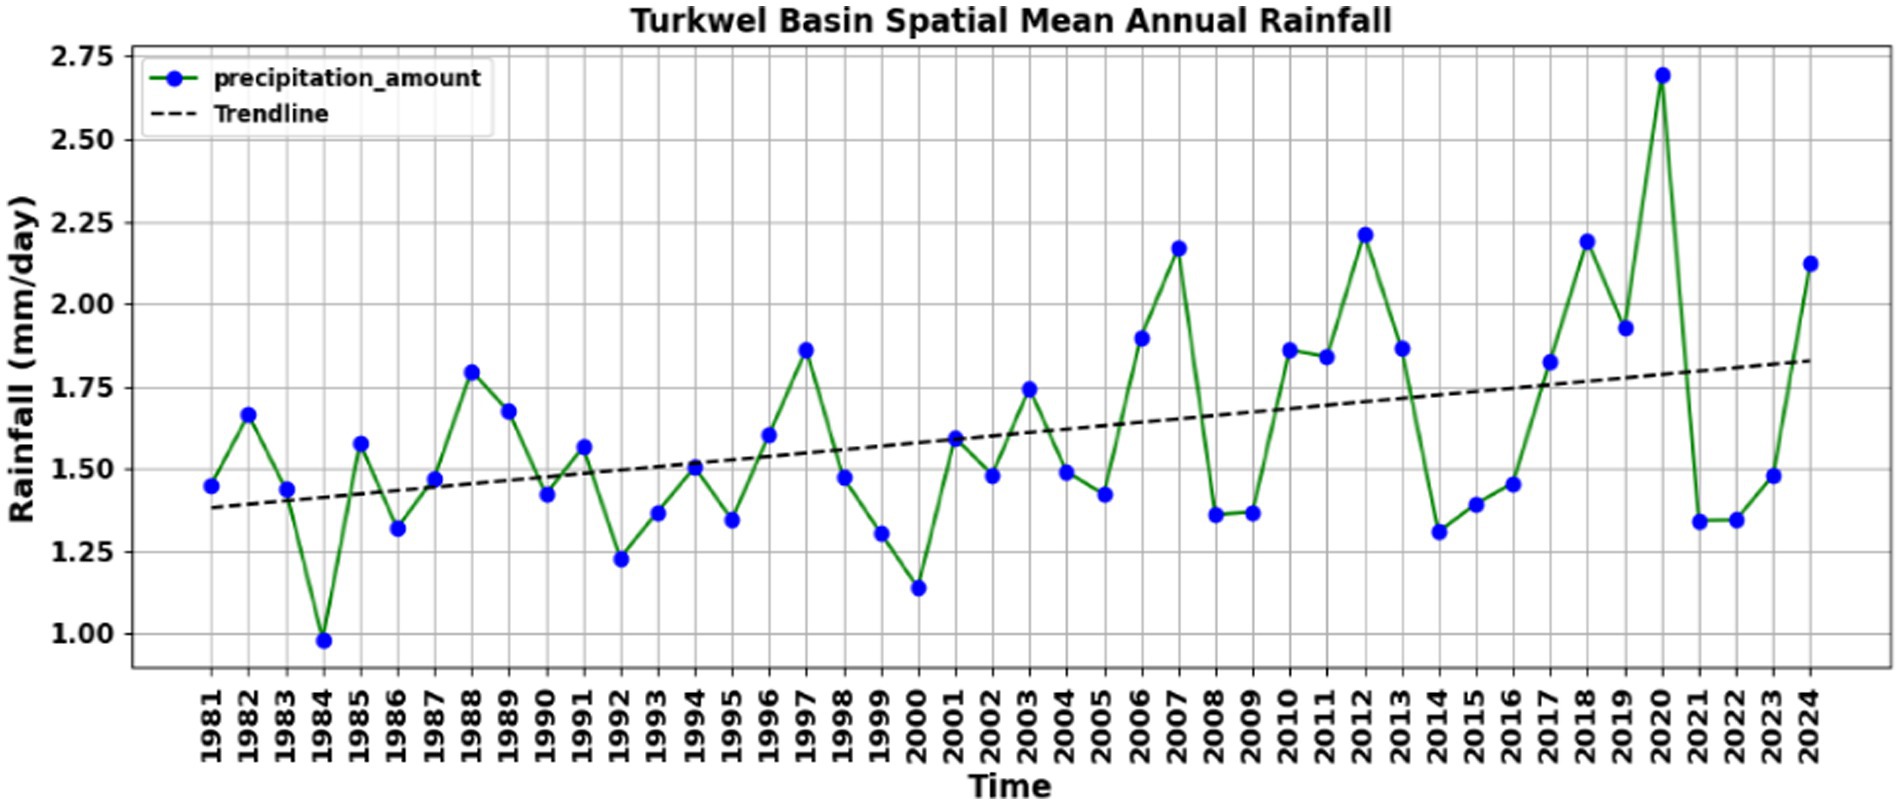
Figure 4. Spatial mean of Turkwel Basin’s annual rainfall from 1981 to 2024.
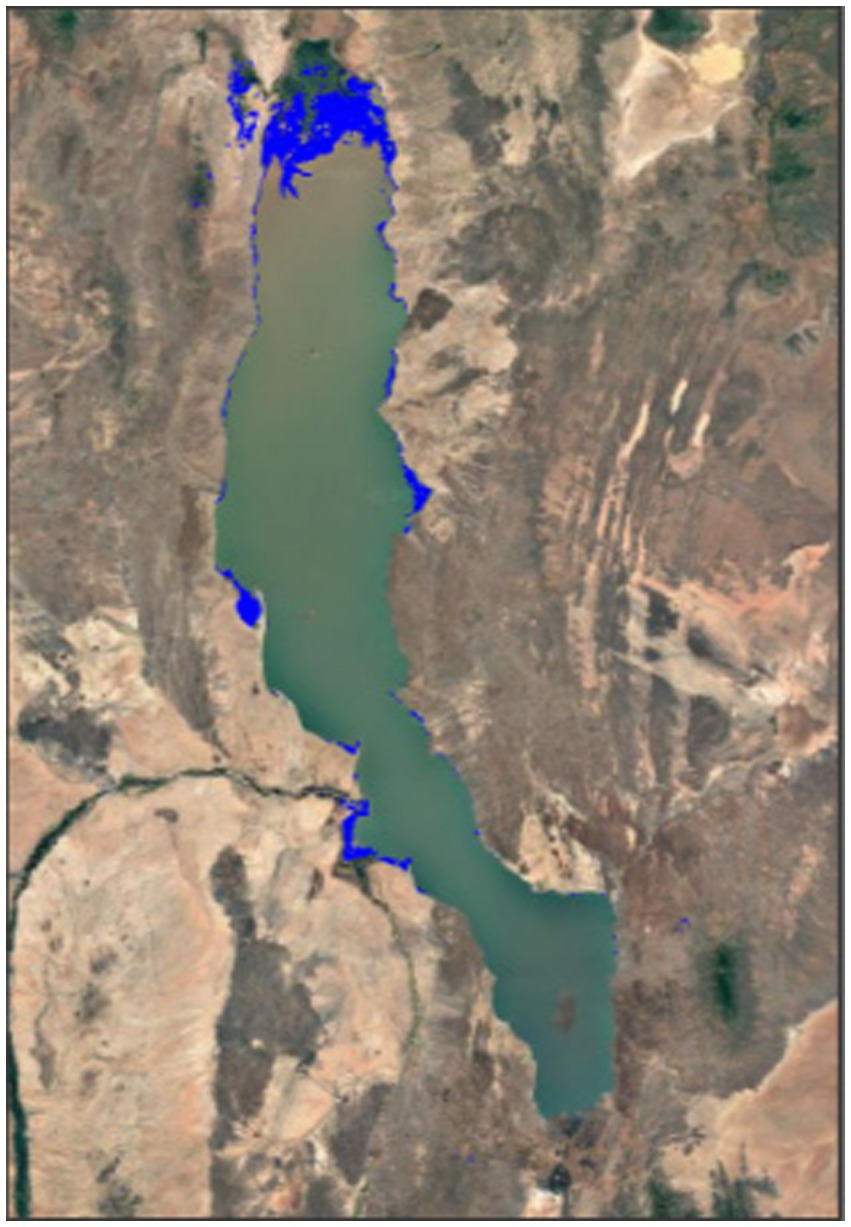
Figure 5. Expansion of Lake Turkana from 2018 to 2024 (The Blue colour indicates the expanded area).
3.2 NDWI computation
Land surface conditions and rainfall patterns that contribute to flood risks can be detected using remote sensing technologies. By monitoring changes in vegetation, soil moisture, rainfall, and water bodies over time, remote sensing can help identify areas that are particularly vulnerable to flooding (Liu et al., 2022). This information is crucial for developing effective flood management strategies in flood-prone regions. However, freely available satellite imagery products have varying spatial and temporal resolutions, time frames and different cloud cover effects. This demands careful investigation of a suitable satellite imagery product for detecting historical floods for a given location. This is through the use of NDWI, which is a proxy and reference as observed data for inundated areas that capture pixels covered with water.
Historical flood events were identified by generating and analysing a time series of the NDWI using Google Earth Engine (GEE).2 The NDWI is a remote sensing index used to detect and monitor water bodies, including lakes, rivers, and wetlands. It is calculated by subtracting the near-infrared (NIR) band from the shortwave infrared (SWIR) band and then dividing it by the sum of the two bands (Liu et al., 2022; Mondejar and Tongco, 2019). The NDWI time series derived from satellite imagery allows for correlation with historical rainfall data, which can help identify the locations of rainfall events that best correlate with the generated NDWI values. Therefore, satellite imagery products capable of generating historical daily NDWI time series for specific locations and exhibiting strong correlations with rainfall are suitable for detecting potential flooding. Moreover, areas demonstrating strong NDWI–rainfall correlations can be identified as key rainfall signal zones, serving as early indicators of flood risk in Lodwar Town. Signal zones are areas where rainfall shows a strong, consistent correlation with downstream flooding, serving as early indicators of flood events.
The NDWI is computed using the following formula.3
The NDWI values correspond to the following ranges:
0.2–1 ➔Water surface, 0.0–0.2 ➔ Flooding, humidity, −0.3–0.0 ➔ Moderate dry non-aqueous surfaces, −1–−0.3 ➔ Dry.
The generated NDWI values range between −1 and 1, representing the spectrum from water surface to dry. However, the focus is mainly on detecting flood events, which corresponds to NDWI values above zero. Therefore, to simplify the analysis and achieve maximum correlation with rainfall values, all NDWI values less than zero are replaced with zero. By setting negative NDWI values to zero, the analysis can concentrate on capturing the extent and duration of flood events, which is crucial for understanding the relationship between NDWI and rainfall patterns in the region.
3.3 Machine learning: decision tree regression
Decision Tree Regression (DTR) was selected for this study due to its ability to model nonlinear relationships between NDWI, daily rainfall, temporal features (month and day), and lagged rainfall variables without extensive pre-processing. Incorporating lag times allows the model to capture delayed hydrological responses that are critical for early flood detection (Elsayed et al., 2024; Jena et al., 2023). While ensemble methods like Random Forests or Gradient Boosting, and deep learning approaches, can offer higher predictive accuracy, they require larger datasets and many input variables to achieve optimal performance, which may not be feasible in data-scarce regions. DTR provides a practical balance between predictive performance, simplicity, and interpretability, making it well-suited for operational flood early warning in regions with limited hydrometeorological data (Meng and Jin, 2023).
The Decision Tree Regression (DTR) approach was implemented within a Jupyter Notebook (Python) of Decision TreeRegressor package to develop a predictive model. The Decision TreeRegressor python package is a powerful machine learning method used for predicting continuous target variables by modelling the relationship between input features and the output. This algorithm operates by splitting the dataset into smaller subsets based on feature values, effectively creating a tree-like structure where each internal node represents a feature decision, and each leaf node represents a predicted outcome (Pedregosa et al., 2011).
The model can handle both numerical and categorical features, providing flexibility in its application. Users can control various hyperparameters, such as maximum depth and minimum samples per leaf, to prevent overfitting and improve generalization to unseen data. Once trained, the model can predict outcomes for new data points using its predict function, making it suitable for real-time applications in various fields, including finance and environmental science (Buitinck et al., 2013). The dataset was randomly divided into training (80%) and validation (20%) subsets. The training data were used to fit the Decision Tree Regression (DTR) model, while the validation data were reserved to independently evaluate predictive performance. In addition, we assessed input importance by extracting feature importance scores from the DTR model in scikit-learn, which are based on the reduction in Coefficient of Correlation (CC) error attributed to each predictor across all decision nodes. The normalized scores indicate the relative contribution of each input variable to streamflow prediction.
This machine learning approach enables more accurate modelling of the relationship between lagged rainfall, auxiliary meteorological variables, and NDWI, thereby enhancing flood monitoring and prediction in the region. Additionally, it improves the correlation between input climate features and NDWI by optimizing the model through training, leading to better representation of surface water dynamics associated with flood events.
Model hyperparameters were calibrated for Lodwar Town to optimize predictive accuracy. The selected parameters are summarized in Table 3. These values were selected to ensure a balance between model complexity and generalization, avoiding both overfitting and underfitting.
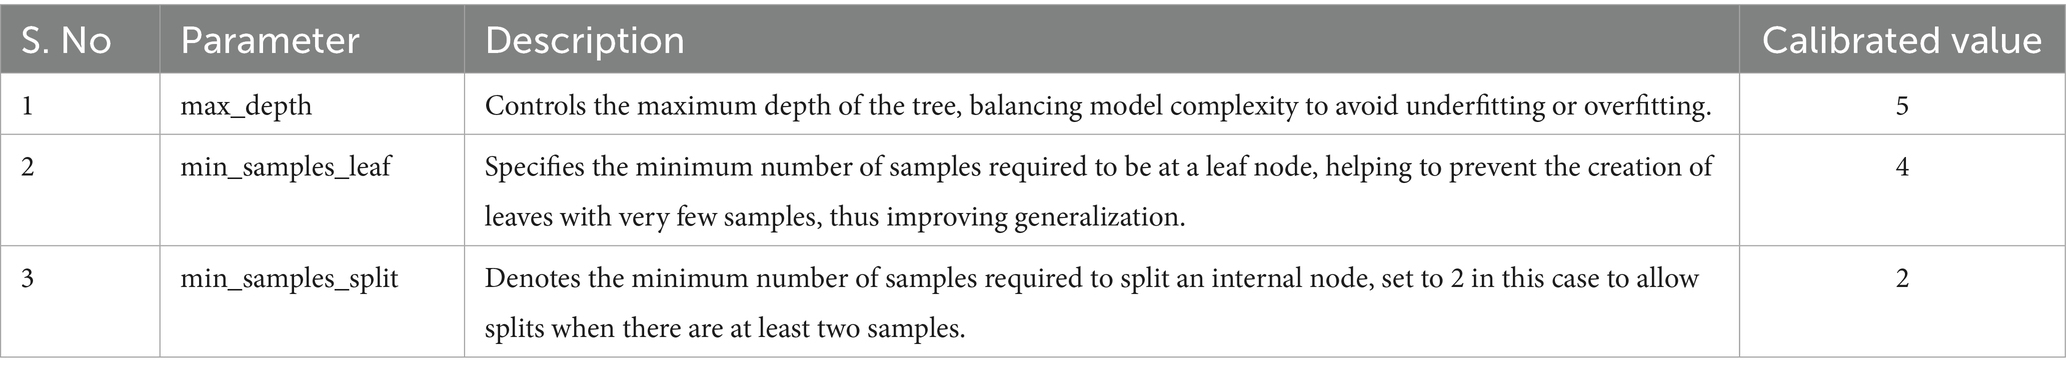
Table 3. Parameters of the Decision Tree Regression (DTR) for Lodwar Town NDWI.
3.4 Performance evaluation
Four rainfall products of CHIRPS, MSWEP, IMERG, and TAMSAT were evaluated on their ability to detect floods represented by NDWI for Turkwel Basin’s Lodwar Town generated from Aqua MODIS. Each rainfall product is evaluated using the correlation coefficient (CC) metric with the NDWI. A higher CC value suggests a stronger correlation between rainfall at a given location and NDWI on potential flooded areas that helps to prepare a model to predict the flood in the Lodwar Town.
The correlation coefficient is a statistical measure that quantifies the strength and direction of the linear relationship between two variables. It ranges from −1 to 1, with −1 indicating a perfect negative correlation, 0 indicating no correlation, and 1 indicating a perfect positive correlation (Schober et al., 2018).
Where is the NDWI of the ith day; is the rainfall of ith day; and the average of all the daily NDWI values, and is the average of all daily rainfall values.
After the CC evaluation, the P-test was carried out whether a sample correlation coefficient r provides sufficient evidence to conclude that a true population correlation (ρ) exists between two variables, rather than the observed correlation being due to chance (Turney, 2024).
Where F is the cumulative distribution function (CDF) of the t-distribution with df degree of freedom. Then the t distribution is calculated as.
Where, n is the sample size and if p < 0.05: statistically significant and if p > 0.1 not statistically significantly.
4 Results
4.1 NDWI data availability analysis
Among the available satellite imagery products, Aqua MODIS was selected for this study due to its high temporal resolution, which is essential for capturing short-duration flood events (Table 3). Although Landsat 7, Landsat 8, and Sentinel-2 offer finer spatial resolution (10–30 m), their longer revisit periods (16 days for Landsat and 5 days for Sentinel-2) increase the likelihood of missing dynamic hydrological events. In contrast, Aqua MODIS provides daily observations with a moderate spatial resolution of 250 meters and minimal cloud cover loss (~2%) (Dhillon et al., 2023), enabling the generation of historical daily NDWI products with low noise. This makes Aqua MODIS particularly suitable for temporal analyses, such as correlating daily NDWI with rainfall for flood monitoring. For analyses that require higher spatial detail, such as mapping flood extent, Sentinel-2 was employed due to its finer spatial resolution.
4.2 Rainfall analysis
Table 4 compares the four rainfall datasets, revealing that CHIRPS and MSWEP exhibit the strongest alignment with NDWI, with correlation coefficients of 0.51 and 0.53, respectively; both correlations are statistically significant (p < 0.001). This suggests they are more effective in capturing water pixels (flooded area) represented by the daily NDWI generated from Aqua MODIS product for the period 2002–2024. Both CHIRPS and MSWEP, along with TAMSAT, have a lag time of 0 days for the highest correlation values, indicating that their rainfall estimates have an immediate impact on potential flood generation in the Lodwar Town.
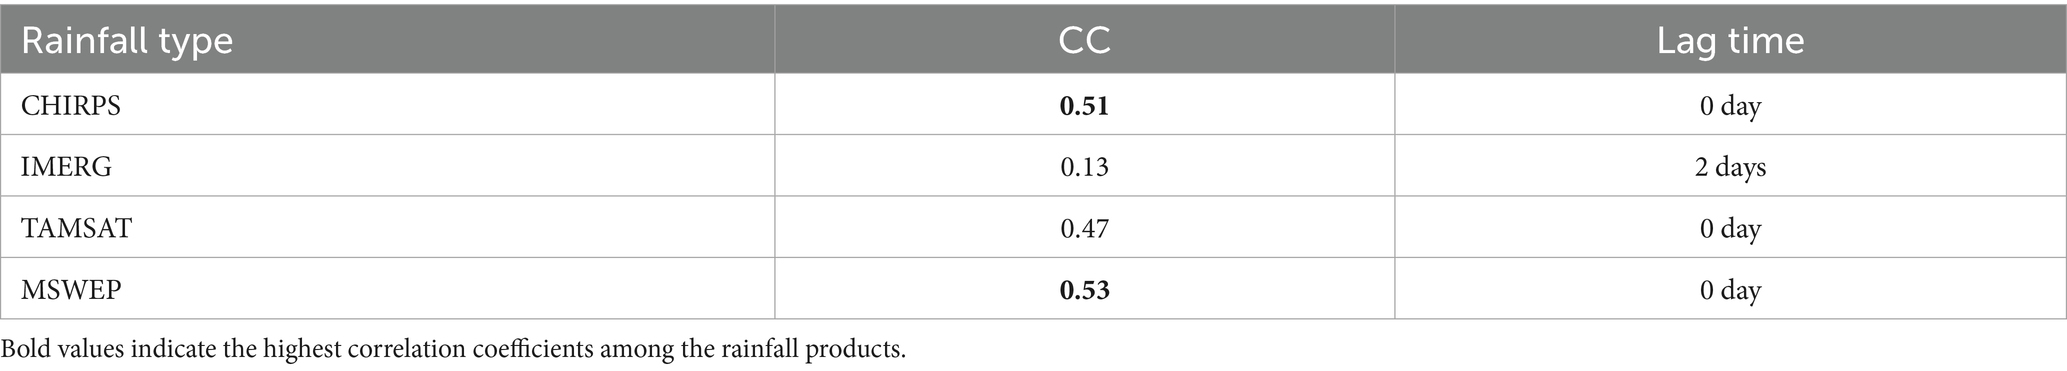
Table 4. Correlation coefficient (CC) performance of different rainfall products with the Aqua MODIS NDWI of Lodwar Town.
In contrast, IMERG shows a significantly lower correlation coefficient of 0.13 and a lag time of 2 days. This indicates that IMERG is not suitable for flood analysis and poor to capture flood events in the region compared to the other rainfall products. The TAMSAT rainfall shows relatively average performance compared with the other rainfall products with CC of 0.47 to capture the NDWI of Lodwar Town.
Both MSWEP and CHIRPS rainfall products exhibited comparable performance. However, CHIRPS was selected for further analysis due to its finer spatial resolution, making it more suitable for localized flood assessment. Following its selection as the most appropriate rainfall dataset for the Turkwel Basin and Lodwar Town, a detailed analysis of the spatial distribution of average monthly rainfall was carried out for the period 2002 to 2024 (Figure 2). Figure 2 indicate that in the Turkwel Basin, peak rainfall occurs in April, followed by May, marking the onset and progressive intensification of the wet season. During the October–December rainfall window, October exhibits the highest rainfall. Consequently, April and October have been identified as the months with maximum rainfall, establishing clear temporal benchmarks for focused flood analysis in Lodwar Town. Concentrating efforts on these periods allows for targeted examination of rainfall patterns that may serve as indicators of potential flood-prone areas.
Following the bar graph presented in Figure 2, a time-series analysis of CHIRPS total rainfall for April and October was conducted (Figures 6, 7). This analysis aimed to identify the year with the highest cumulative rainfall in the Turkwel Basin. The results indicate that April 2018 recorded the highest rainfall during the 2002–2024 period, while October 2019 exhibited the peak October rainfall within the study timeframe. “This analysis indicates that the October 2019 flood was primarily driven by the intense rainfall that occurred within that month, whereas the April 2018 flood was associated with the cumulative effect of successive peak rainfall. To validate these findings, daily Aqua MODIS-derived NDWI data for Lodwar Town were compared between the 2 years corresponding to these peak rainfall months. Figure 8 depicts the NDWI time series: in April 2018, the index shows multiple moderate peaks, indicating sustained periods of inundation, whereas October 2019 features a single, sharp peak, reflecting a more acute flood response. These contrasting patterns underscore distinct flood dynamics between the two events. The similar temporal patterns observed between CHIRPS-derived rainfall and MODIS-based NDWI confirm that both datasets consistently capture flood events in Lodwar Town. This conclusion is further validated by community insights from a workshop held on May 2025, as part of the PALM-TREEs project in Lodwar. Participants including residents and government stakeholders noted October 2019 as the most severe recent flood, reflecting extensive damage and confirming the timing identified through remote sensing.
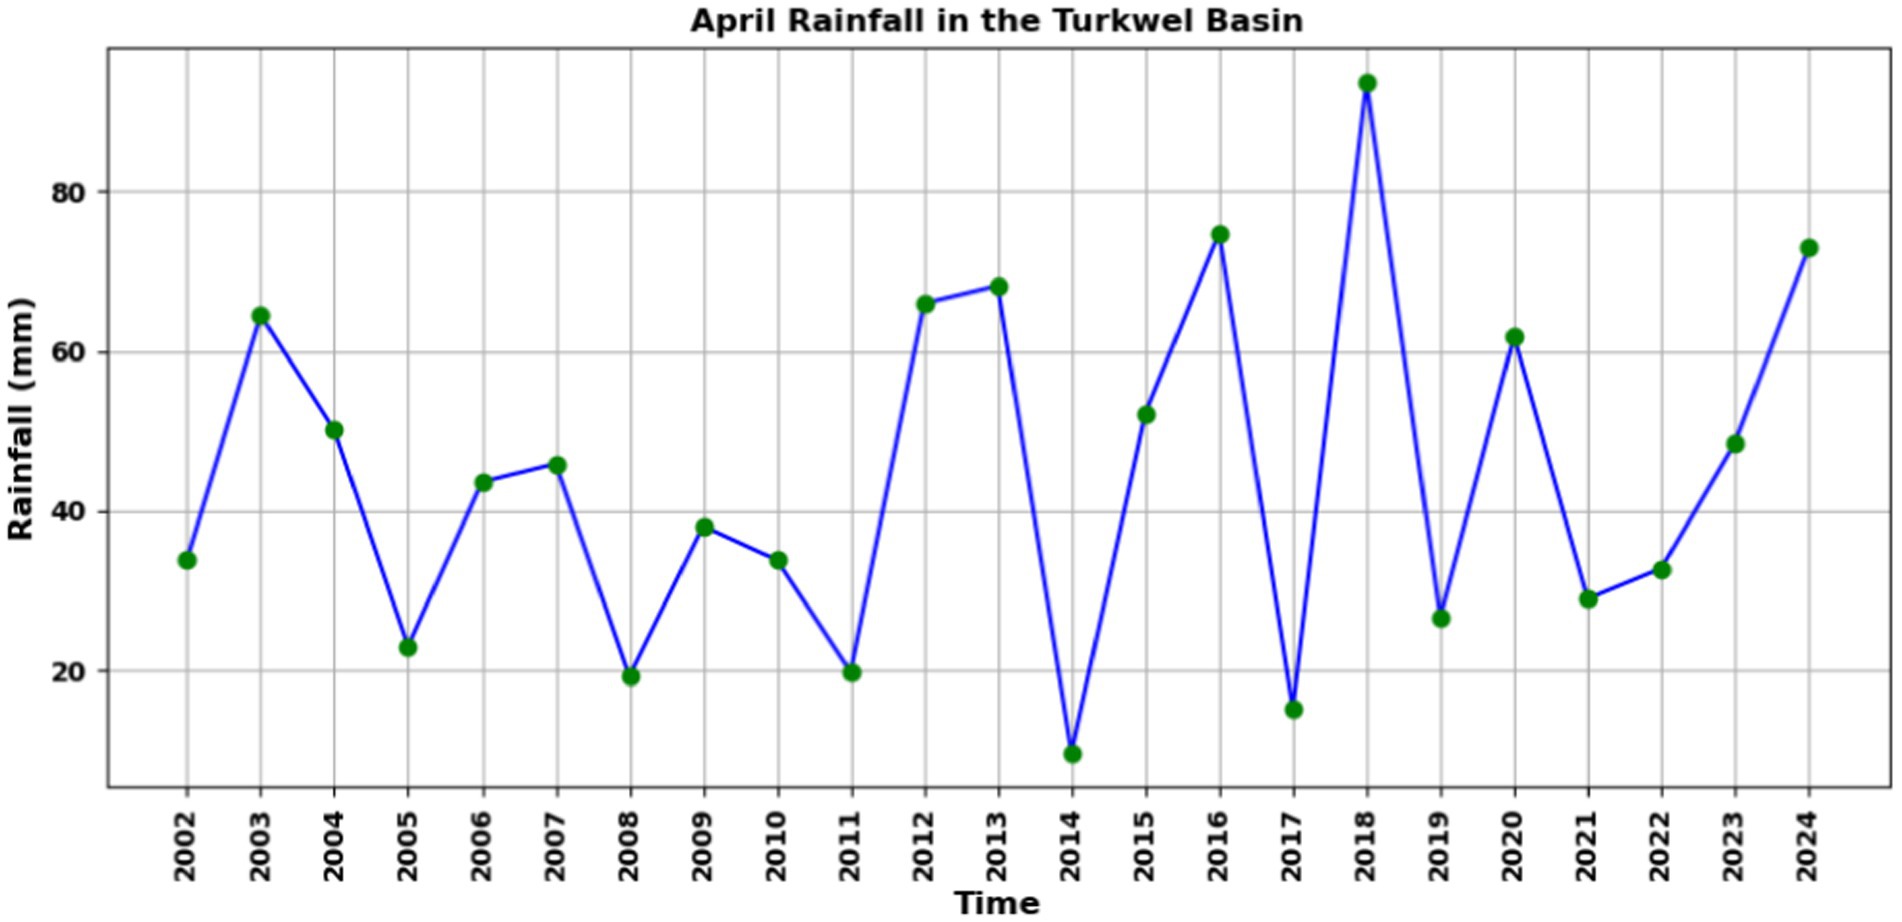
Figure 6. Spatial mean of April rainfall from 2002 to 2024 for Turkwel Basin per year.
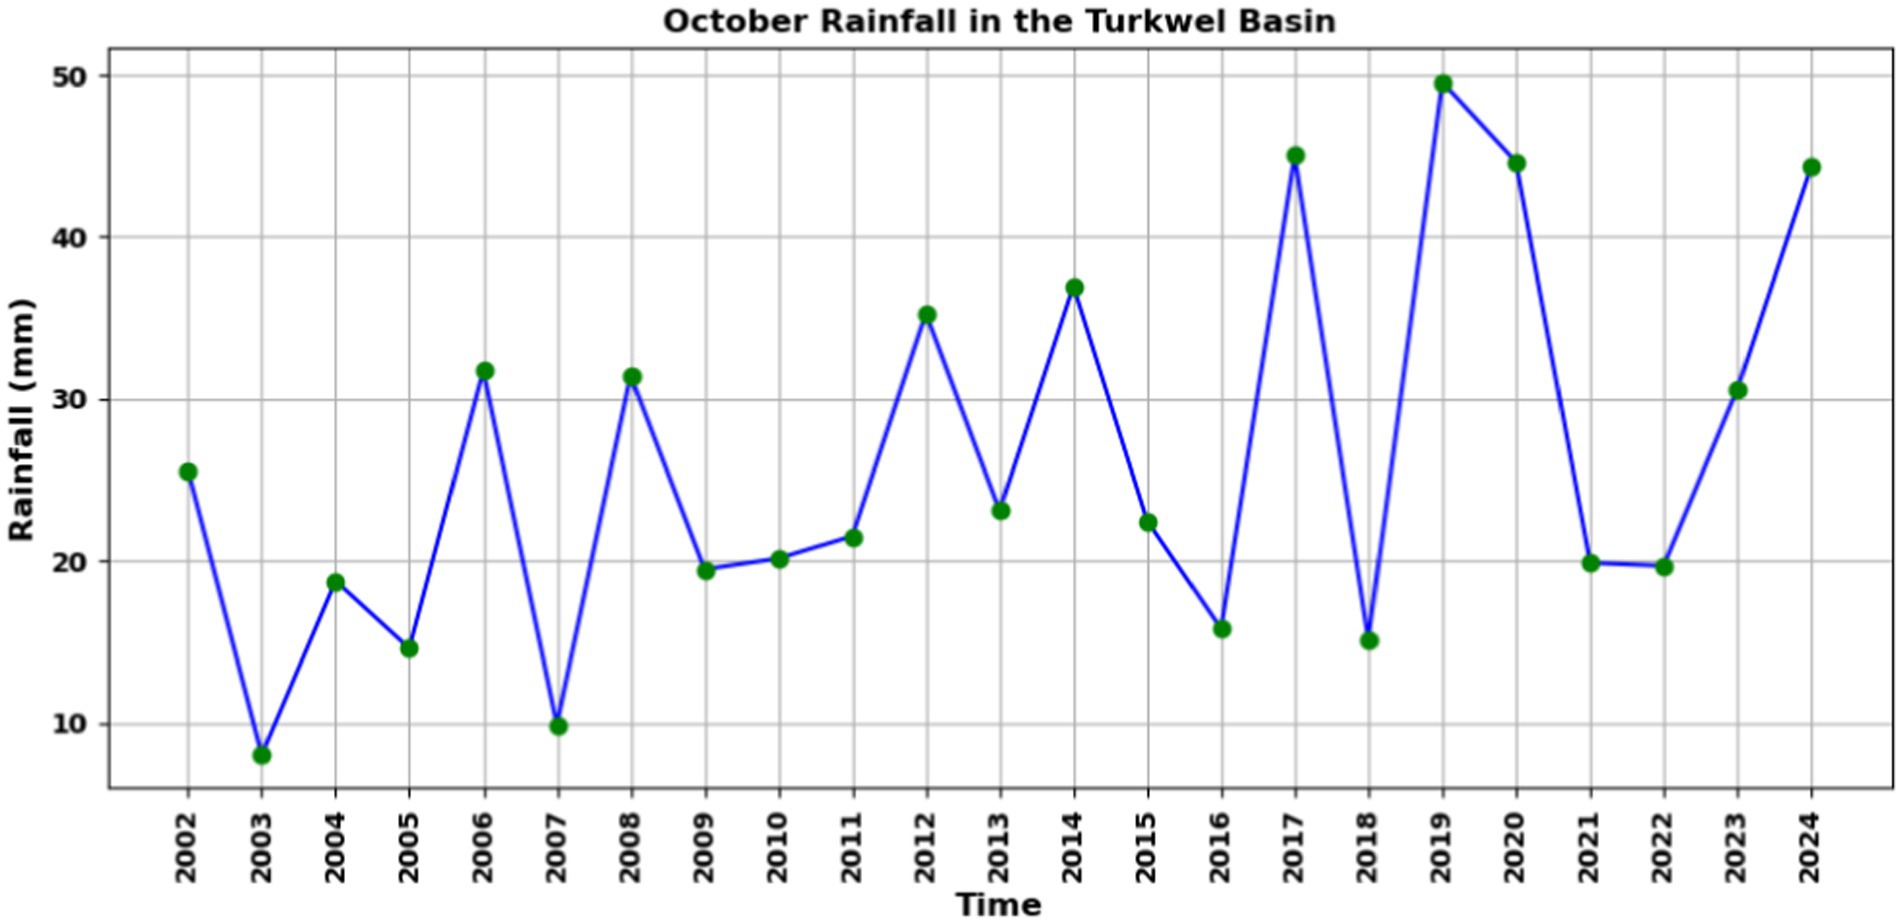
Figure 7. Spatial mean of October rainfall from 2002 to 2024 for Turkwel Basin per year.
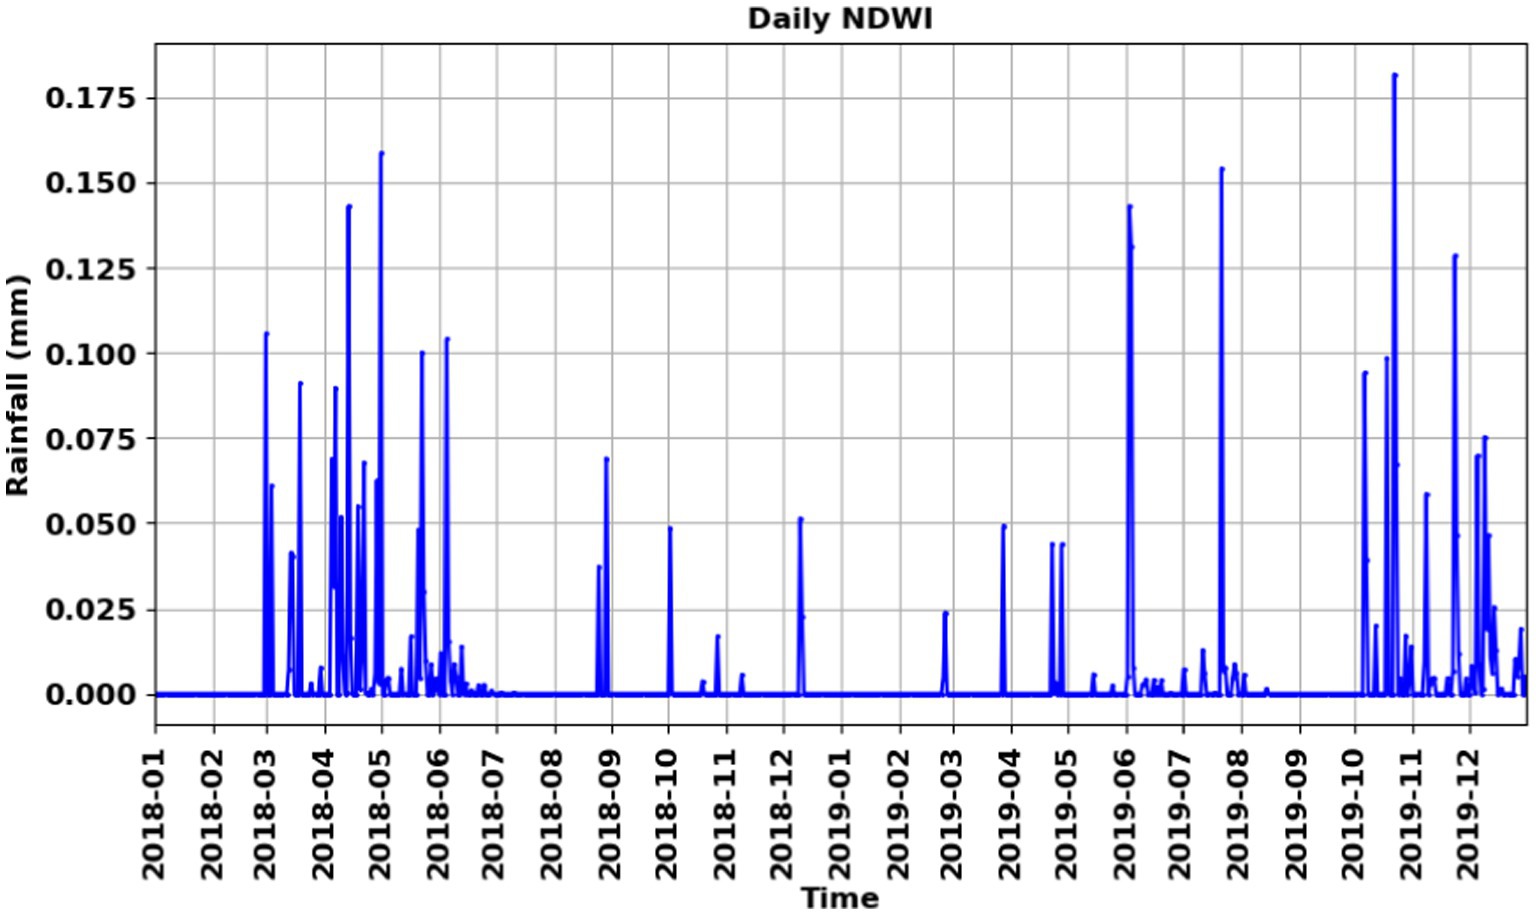
Figure 8. Daily Aqua MODIS NDWI time series of Lodwar Town for 2018 and 2019.
The spatial flood-inundation maps derived from Sentinel-2 NDWI for Lodwar Town (2018–2023) with April results in Figure 9 and October results in Figure 10 provide independent confirmation of the flood peaks identified through Aqua MODIS NDWI and CHIRPS rainfall time series. April 2018 shows the most widespread inundation during the MAM season, while October 2019 exhibits notably high flood coverage in the OND season. These Sentinel-2 observations reinforce the conclusion that April 2018 and October 2019 corresponded, respectively, to the wettest and most flood-prone periods.
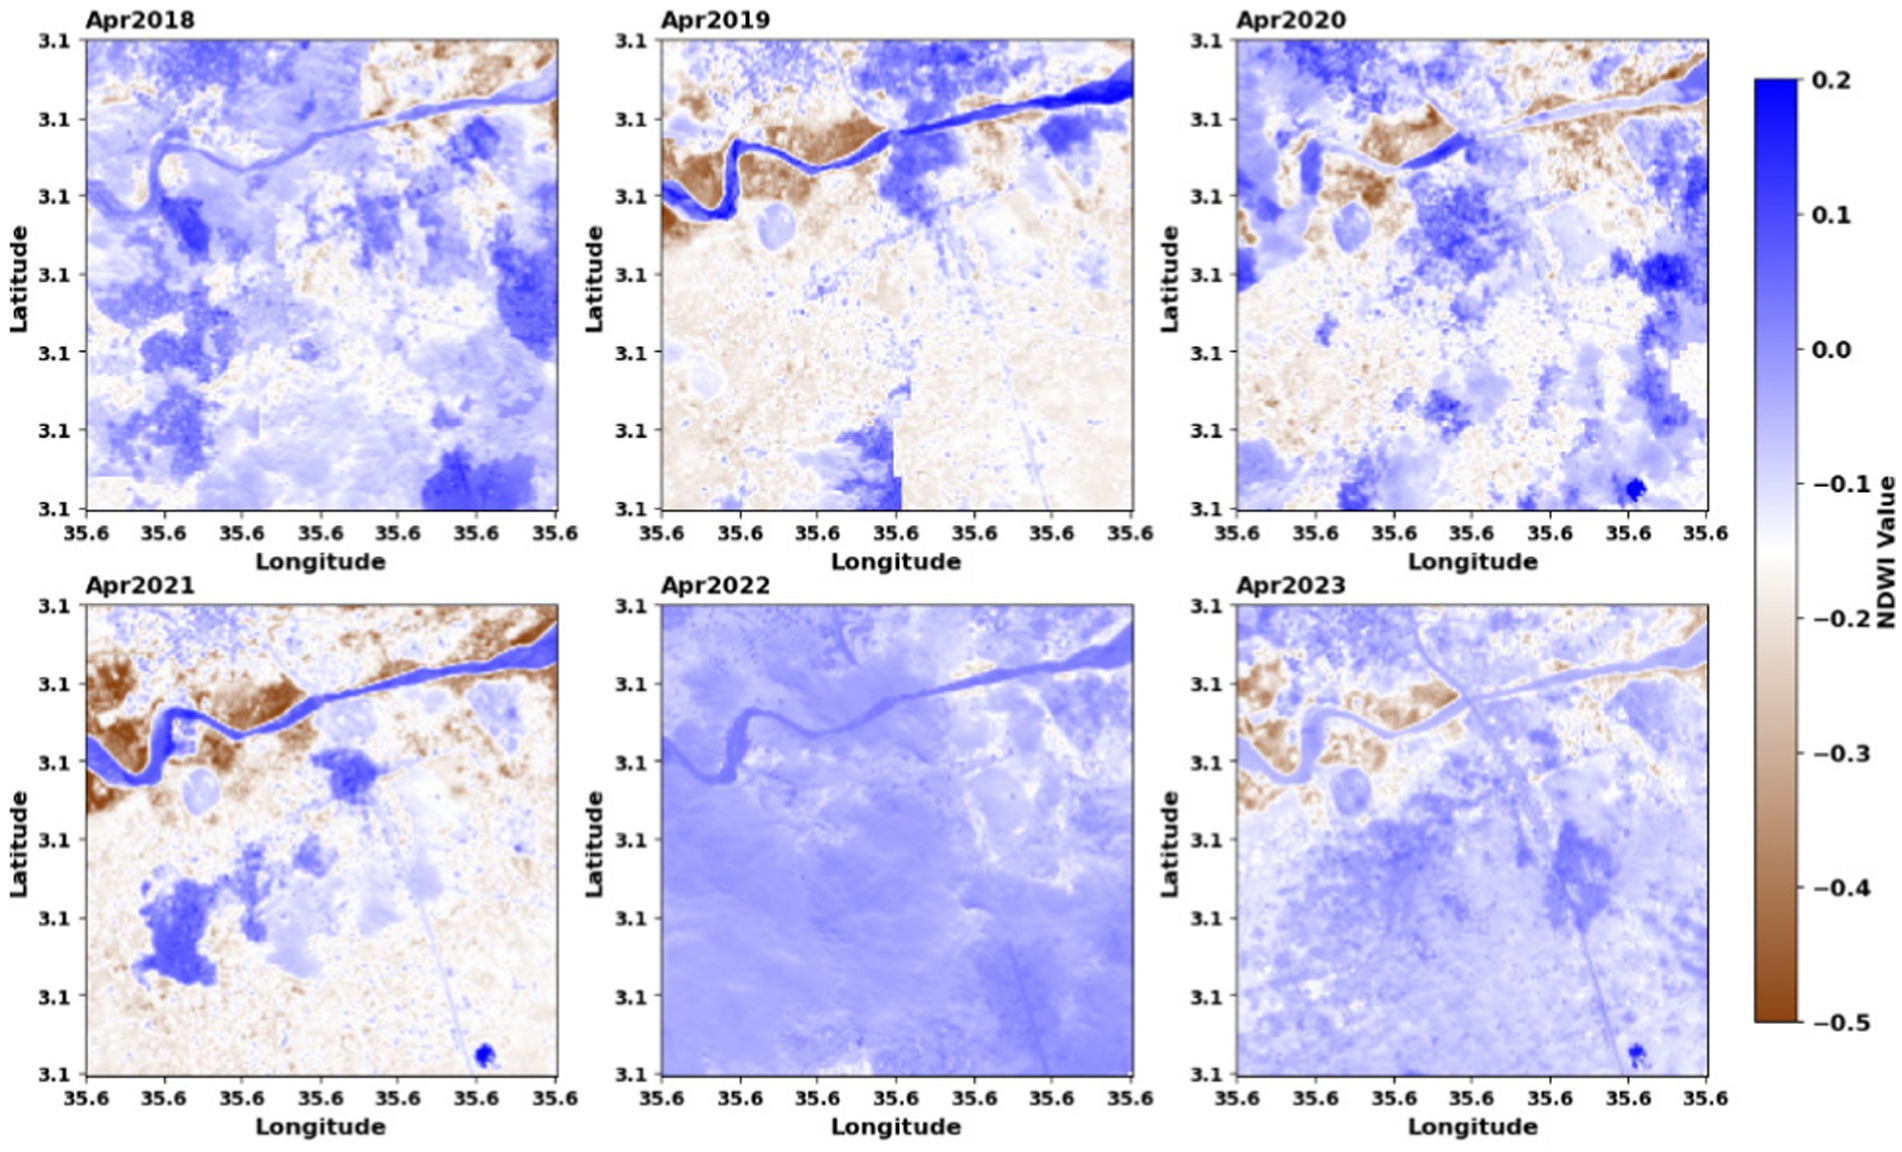
Figure 9. Sentinel-2 maximum NDWI spatial map of April for the Lodwar Town for 2018–2023.
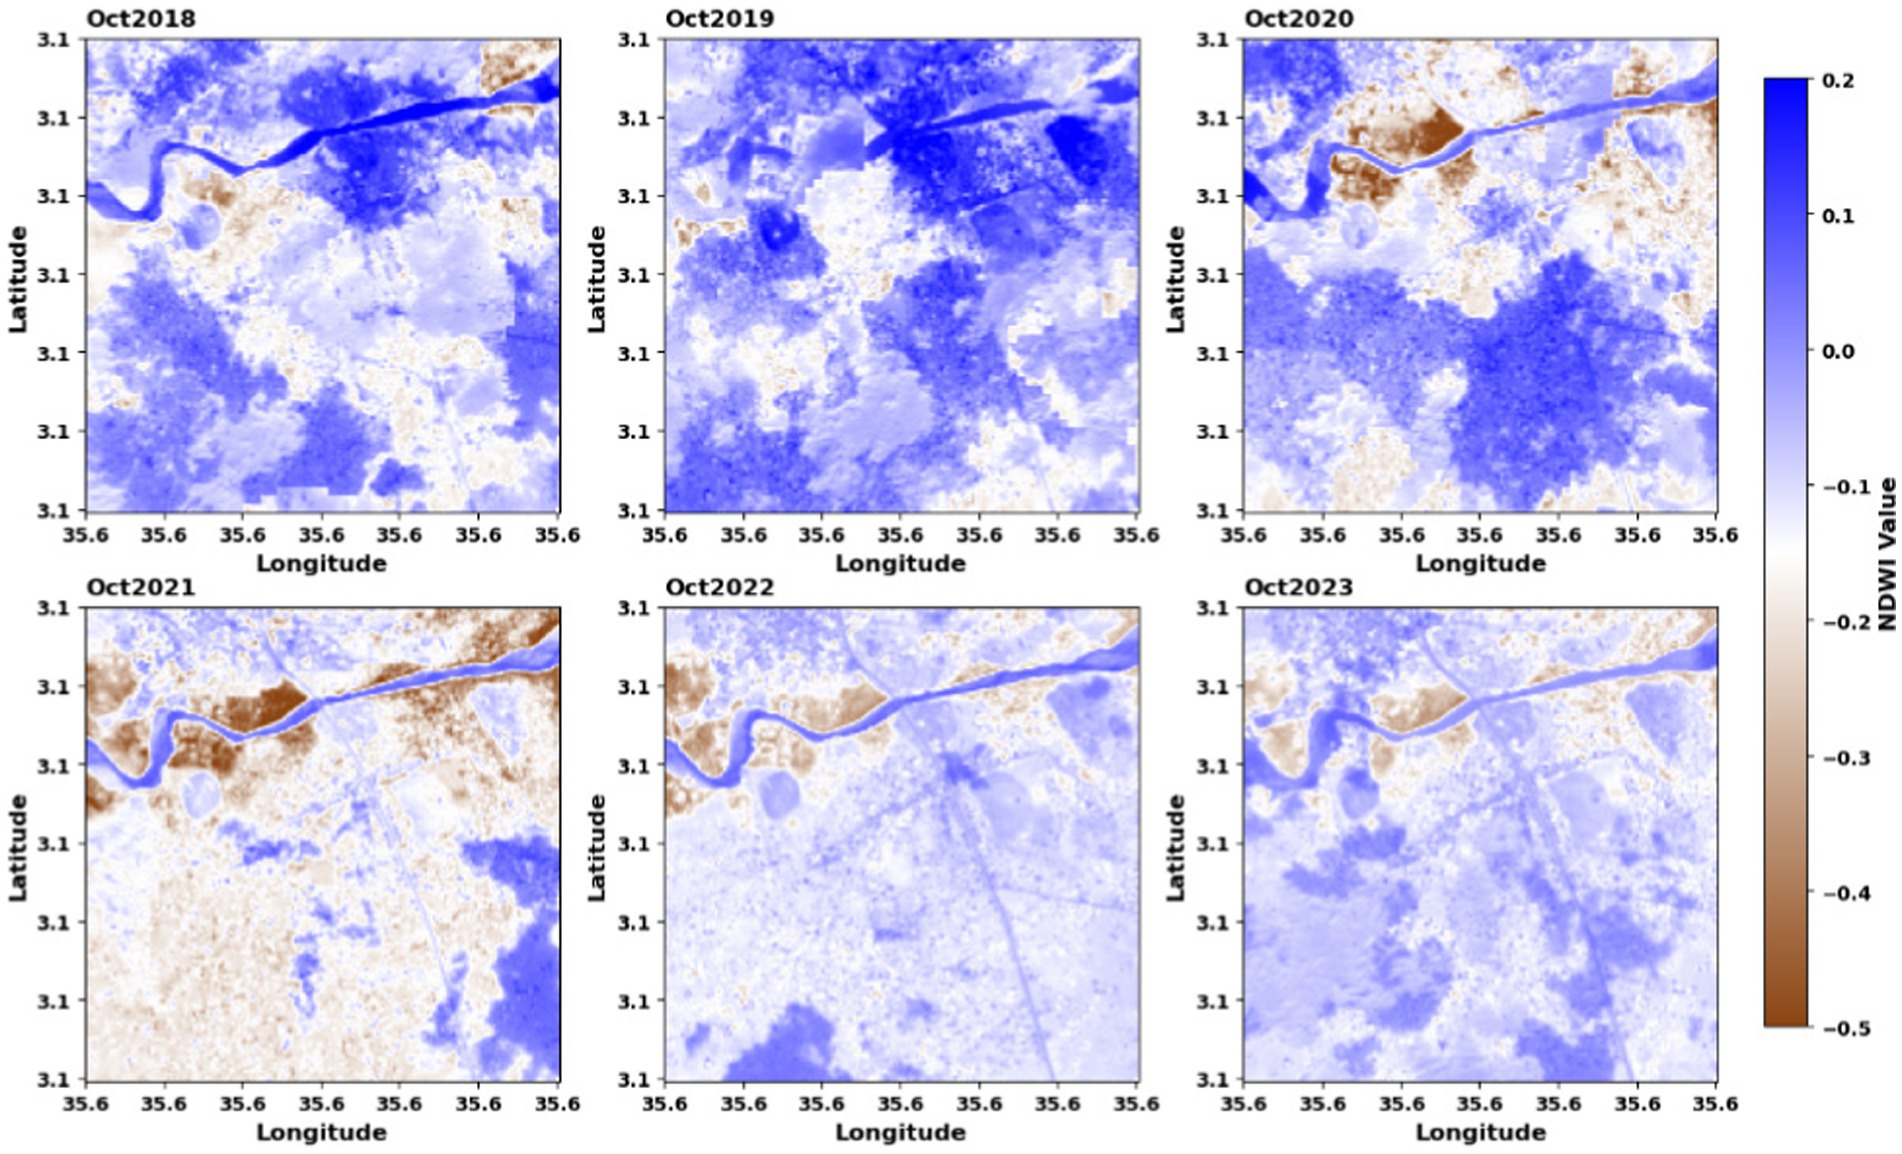
Figure 10. Sentinel-2 maximum NDWI spatial of October for the Lodwar Town for 2018–2023.
However, Sentinel-2’s ability to capture every flood event is limited by its optical nature: cloud cover and revisit intervals can result in missed inundation events. In contrast, MODIS, despite its coarser spatial resolution, offers daily coverage and composites that enable the monitoring of flood dynamics on a consistent temporal basis. Thus, combining Sentinel-2’s detailed spatial inundation mapping with MODIS’s temporal consistency yields a more robust framework for flood analysis.
Figure 11 illustrates the spatial distribution of mean April and October rainfall (in millimetres) across the Turkwel Basin. The northern and north-eastern sectors of the basin exhibit the lowest rainfall, whereas the southern and south-western regions receive the highest rainfall in the basin. These spatial variability in April and October rainfall suggests that the southern and south-western parts of the basin are likely the primary sources of flooding due to their significantly higher rainfall inputs.
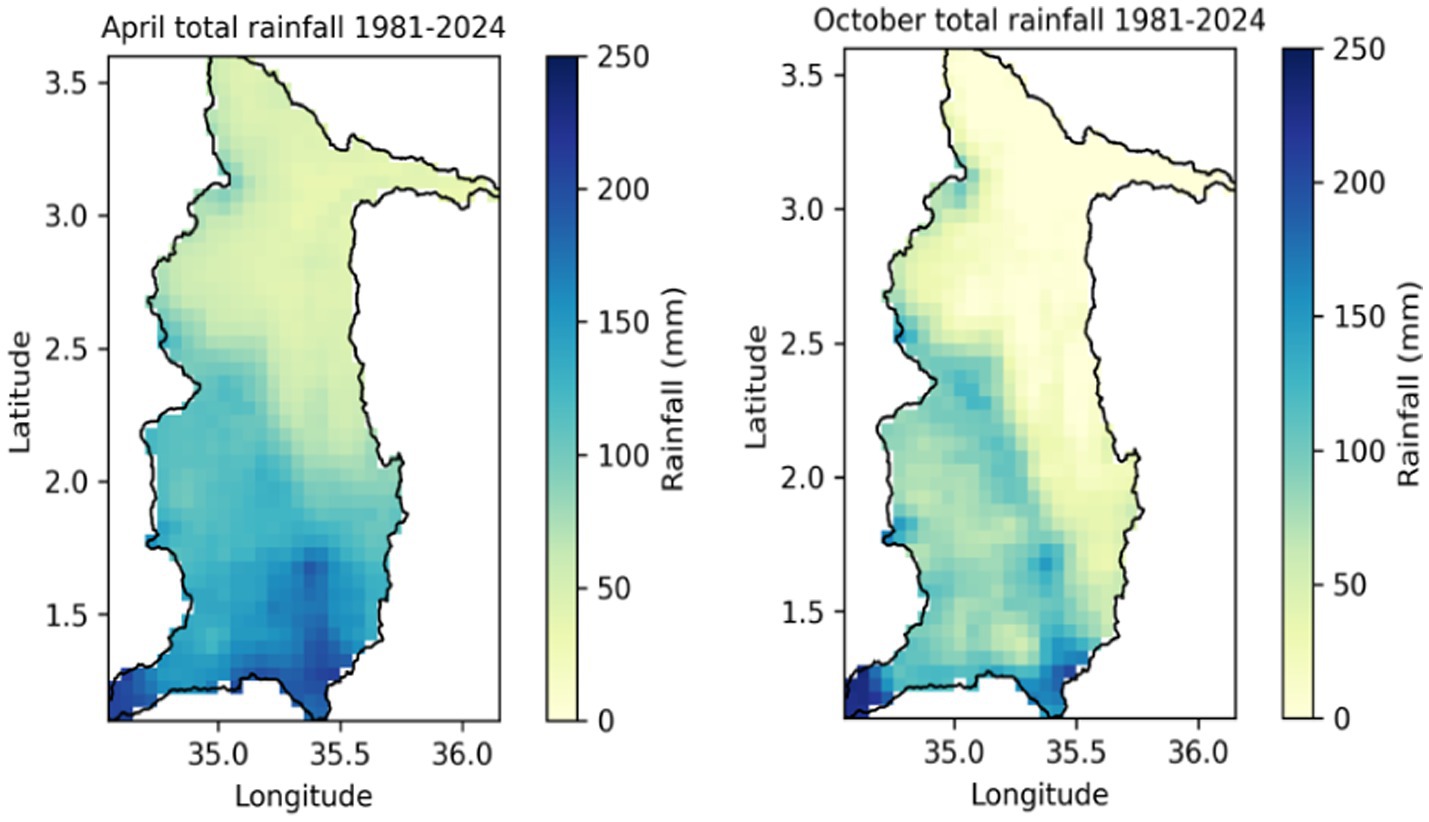
Figure 11. The spatial distribution of April and October rainfall throughout the Turkwel Basin.
In contrast, Figure 12, which presents the NDWI–cross-correlation (CC) map, reveals that areas exhibiting the highest correlation coefficients with the NDWI time series of Lodwar Town are situated near the town and receive relatively low rainfall. This observation aligns with Figure 11, which shows that these high-correlation regions correspond to zones with lower rainfall levels, highlighting an inverse relationship between rainfall amount and correlation strength with NDWI in Lodwar. Therefore, the integrated analysis of Figures 11, 12 reveals a key insight that the regions exhibiting high NDWI cross-correlation with Lodwar Town are not the primary sources of flooding, as they do not experience the highest rainfall intensities. Instead, these areas may function as critical flood signals. When significant rainfall does occur in these proximal zones, the likelihood of short-lived flooding events impacting Lodwar Town increases substantially.
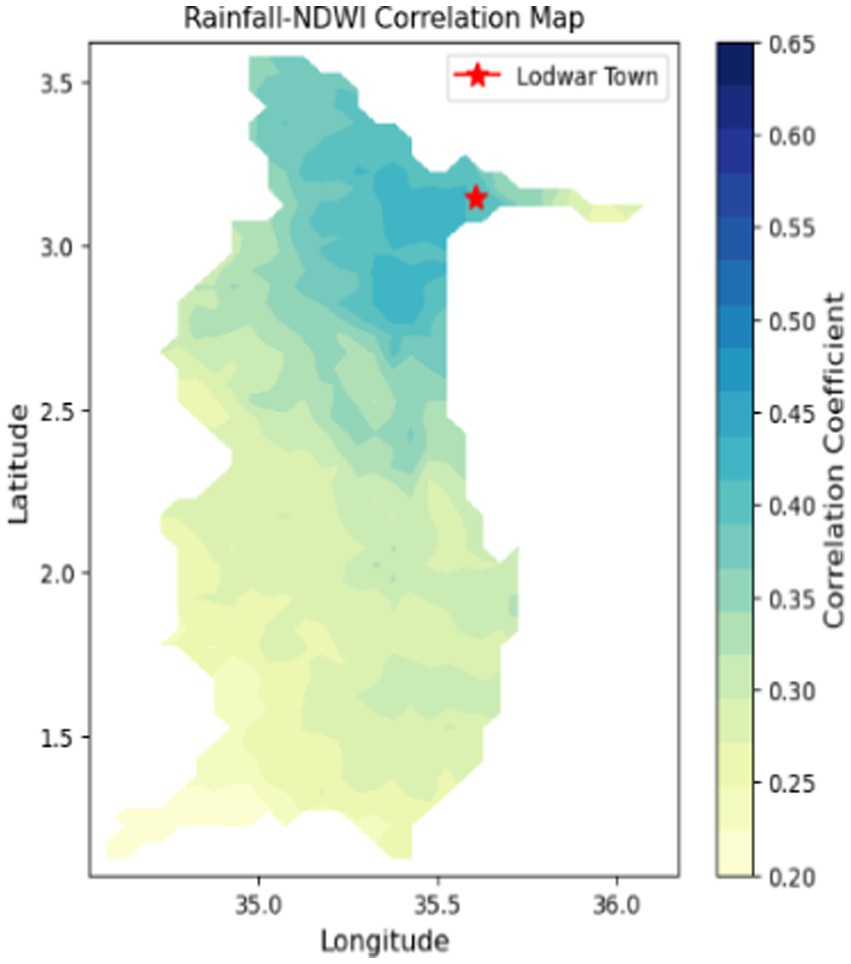
Figure 12. Rainfall-NDWI correlation coefficient map of the Turkwel Basin based on 2002–2024 data.
The performance evaluation of rainfall products, as shown in Table 4 and Figure 12, revealed that the highest cross-correlation (CC) between the NDWI time series of Lodwar Town and rainfall data was 0.51. This moderate correlation indicates the need for the application of additional machine learning techniques to strengthen the predictive relationship. Integrating remote sensing-based variables as input features can further improve the model’s ability to represent NDWI dynamics and enhance flood detection in the region.
4.3 Machine learning application
To assess the contribution of each variable, an input importance analysis was performed, as shown in Figure 13. The results indicated that rainfall with zero-day lag (RF_0DayLT) was the most significant input, followed by relative humidity, date features (MMDD), and mean temperature. In contrast, rainfall data with one-day or greater lag (RF_1DayLT, RF_2DayLT, RF_3DayLT) contributed minimally, suggesting that in Lodwar Town, rainfall impacts flood conditions almost instantaneously. Among the input variables, RF_3DayLT exhibited relatively low importance, followed by RF_2DayLT and wind speed, indicating their limited contribution to the model’s predictive performance compared to other features.
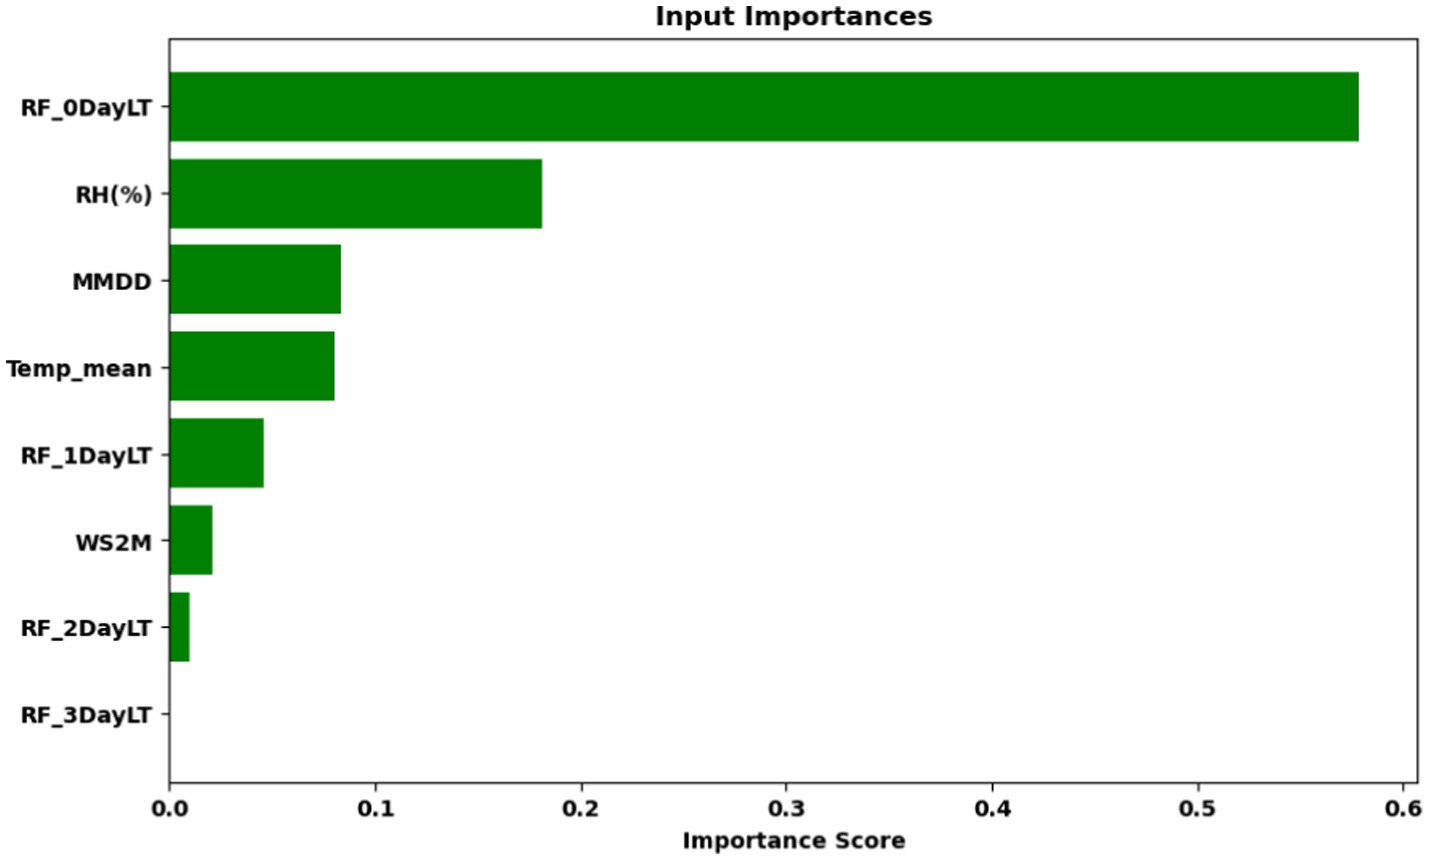
Figure 13. Relative importance of meteorological variables and date features used as inputs in the machine learning model.
The application of the DTR algorithm from the Python machine learning library resulted in a substantial improvement in the correlation coefficient between CHIRPS rainfall data and the NDWI of Lodwar Town, increasing from 0.51 (as shown in Table 4 and Figure 12) to 0.64 (Figure 14). This enhancement was achieved by training the DTR model using CHIRPS rainfall with various lag times, along with auxiliary meteorological variables such as mean temperature, humidity, wind speed, and dates. The trained model was then used to predict daily NDWI values derived from Aqua MODIS observations for Lodwar Town.
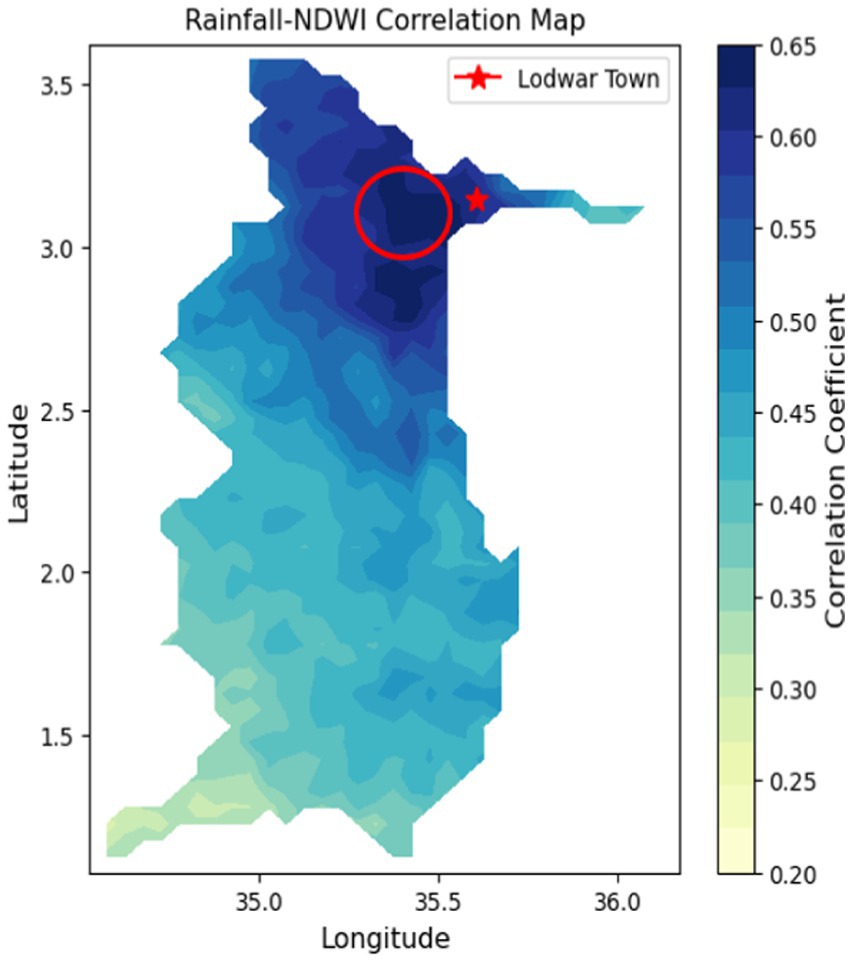
Figure 14. Rainfall- NDWI coefficient of correlation map after machine learning.
Although the correlation improvement from 0.51 to 0.64 may appear modest, it has practical significance for flood monitoring and early warning in data-scarce regions. The higher correlation indicates that rainfall signals are more accurately captured by the NDWI-based model, allowing for more reliable identification of “signal zones” where rainfall is likely to trigger flooding downstream. By incorporating lag times, the model provides actionable lead time identifying areas where rainfall can potentially cause flooding in Lodwar Town within 0 day. Furthermore, if forecasted rainfall with a 7-day lead time or more is available, it could significantly enhance preparedness by allowing authorities and communities to plan and implement mitigation measures in advance. This enhanced predictive capacity enables timely alert dissemination, evacuation planning, and targeted monitoring, thereby reducing flood risks even in regions with limited hydrometeorological data.
The blue marked highlighted spot areas that have high correlation coefficients encircled in red in Figure 14 indicate locations where CHIRPS rainfall data exhibits significant correlation (correlation coefficients >0.6) with daily NDWI. These regions, despite receiving relatively low rainfall (Figure 11), demonstrate a strong association with NDWI fluctuations in Lodwar Town. This suggests that these areas act as signal zones, where significant rainfall events are indicative of an increased likelihood of flooding in Lodwar Town, despite not being the primary sources of floodwaters. As such, these regions serve as valuable early-warning indicators of flood risk rather than direct contributors to flood generation.
These zones are in the west, north-west, and south-west of Lodwar Town. Rainfall observed in identified flood indicator areas with elevations ranging from 508 m to 648 m. This flooding occurs with a 0-day lag time, as the town is situated at approximately 500 m elevation. Therefore, model result from machine learning revealed that, if forecasted rainfall data from the identified areas is available, it is possible to forecast potential flooding events in the town.
4.4 Predictive model evaluation
The trained DTR model then was applied to predict daily NDWI values for the year 2018 a period marked by high rainfall and notable flood events in Lodwar Town utilizing 10-day forecasted CHIRPS-GEFS rainfall data along with auxiliary meteorological variables. This evaluation aimed to assess the model’s capability to reproduce observed NDWI dynamics and capture flood for the year 2018 using the 10-day forecasted CHIRPS-GEFS rainfall data in Lodwar Town.
The evaluation of 10-day CHIRPS-GEFS rainfall forecasts for the Turkwel Basin reveals a consistent positive bias compared to observed CHIRPS data, indicating that bias correction is essential before integrating these forecasts into machine learning models. By analysing paired historical forecast and observed values, an empirical bias-correction formula was derived to recalibrate future forecasts.
To correct the CHIRPS-GEFS precipitation forecasts, we applied a simple bias correction using observed CHIRPS rainfall. First, the spatially averaged rainfall over the study basin was computed for both CHIRPS (observed) and CHIRPS-GEFS (forecasted) for the period 2002.–2024. The bias-corrected forecast was then calculated by scaling the CHIRPS-GEFS forecast according to the ratio of observed CHIRPS rainfall to the CHIRPS-GEFS forecast:
where is the bias-corrected forecast, is the original CHIRPS-GEFS forecast, and and are the spatially averaged rainfall values over the basin for the historical period.
This method ensures that the forecasted rainfall aligns with the long-term observed rainfall climatology. Validation was performed by comparing the bias-corrected CHIRPS-GEFS forecasts with the observed CHIRPS rainfall, which showed improved agreement and reduced systematic over- or underestimation of rainfall over the basin.
Application of this bias correction results in adjusted CHIRPS-GEFS rainfall estimates that better reflect both the magnitude and temporal variability of observed CHIRPS values, as demonstrated in Figure 15. Notably, once corrected, these forecasts more accurately predict enhanced water pixel prevalence crucial indicators of flood-prone zones and used to validate the year of 2018 NDWI using the machine learning model. Ultimately, obtaining improved forecast accuracy will strengthen machine learning models tasked with identifying flood prone areas in Lodwar Town by capturing the NDWI values.
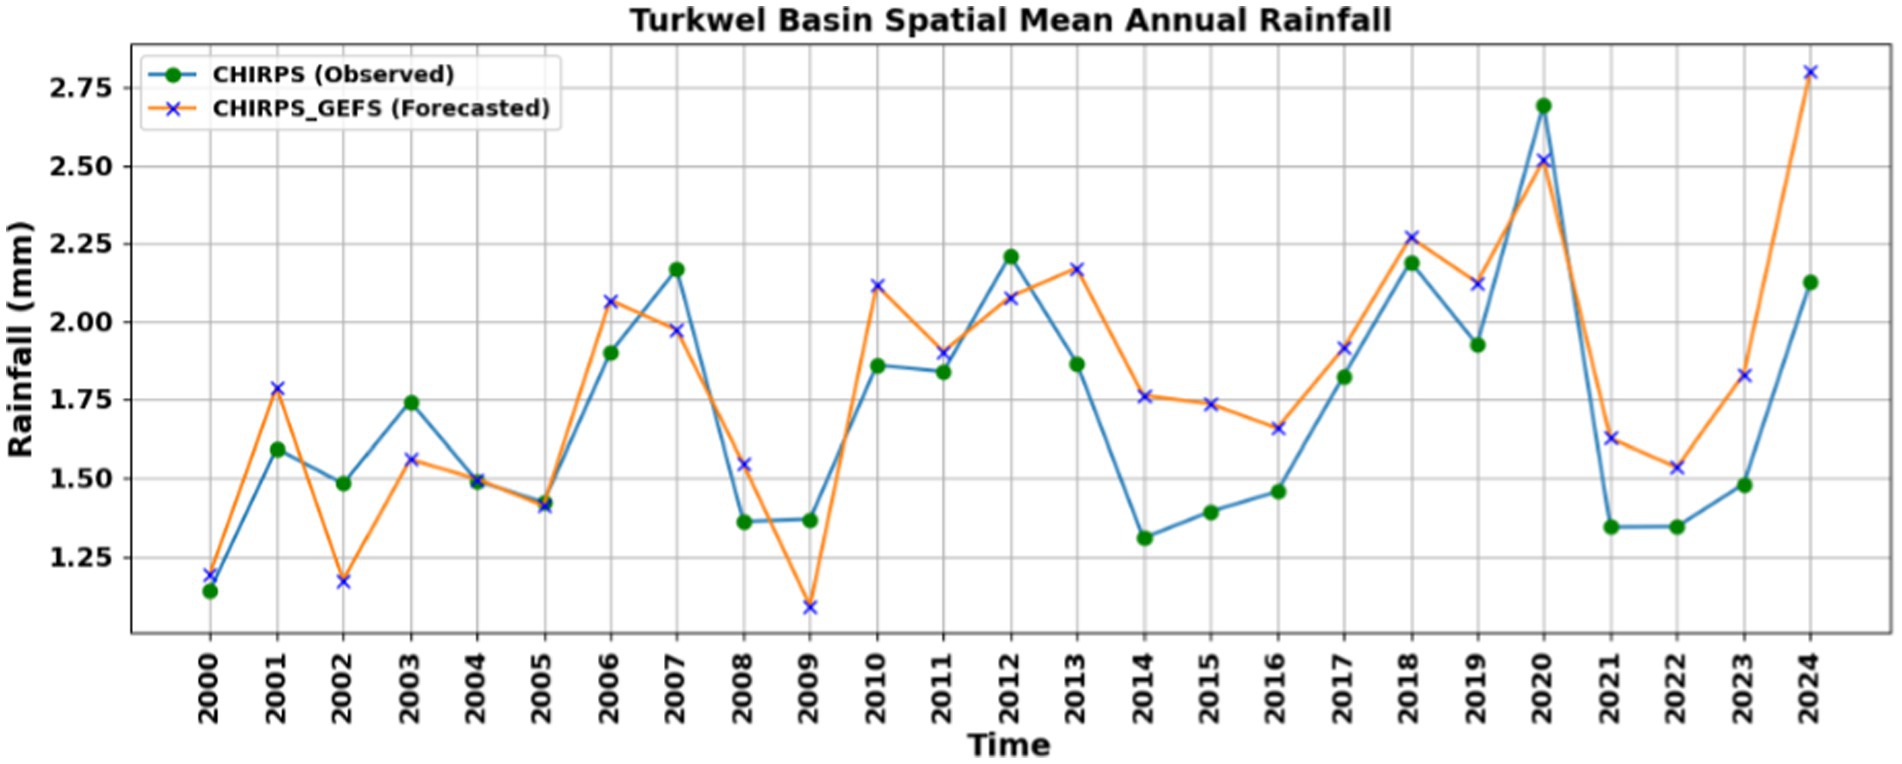
Figure 15. Bias corrected forecasted CHIRPS-GEFS and observed CHIRPS for the Turkwel Basin.
The ML (DTR) model achieved a correlation coefficient of 0.66 between the predicted and observed NDWI, indicating a substantial improvement in performance and demonstrating the utility of machine learning for capturing flood indicators for the high rainfall recorded year 2018. Despite the overall strong agreement, visual inspection of Figure 16 reveals that the model tends to underestimate certain NDWI peak values. While the general temporal trend is well captured, the inability to reproduce some of the sharper peaks suggests limitations, likely stemming from the coarse spatial resolution of the Aqua MODIS sensor used to derive the observed NDWI.
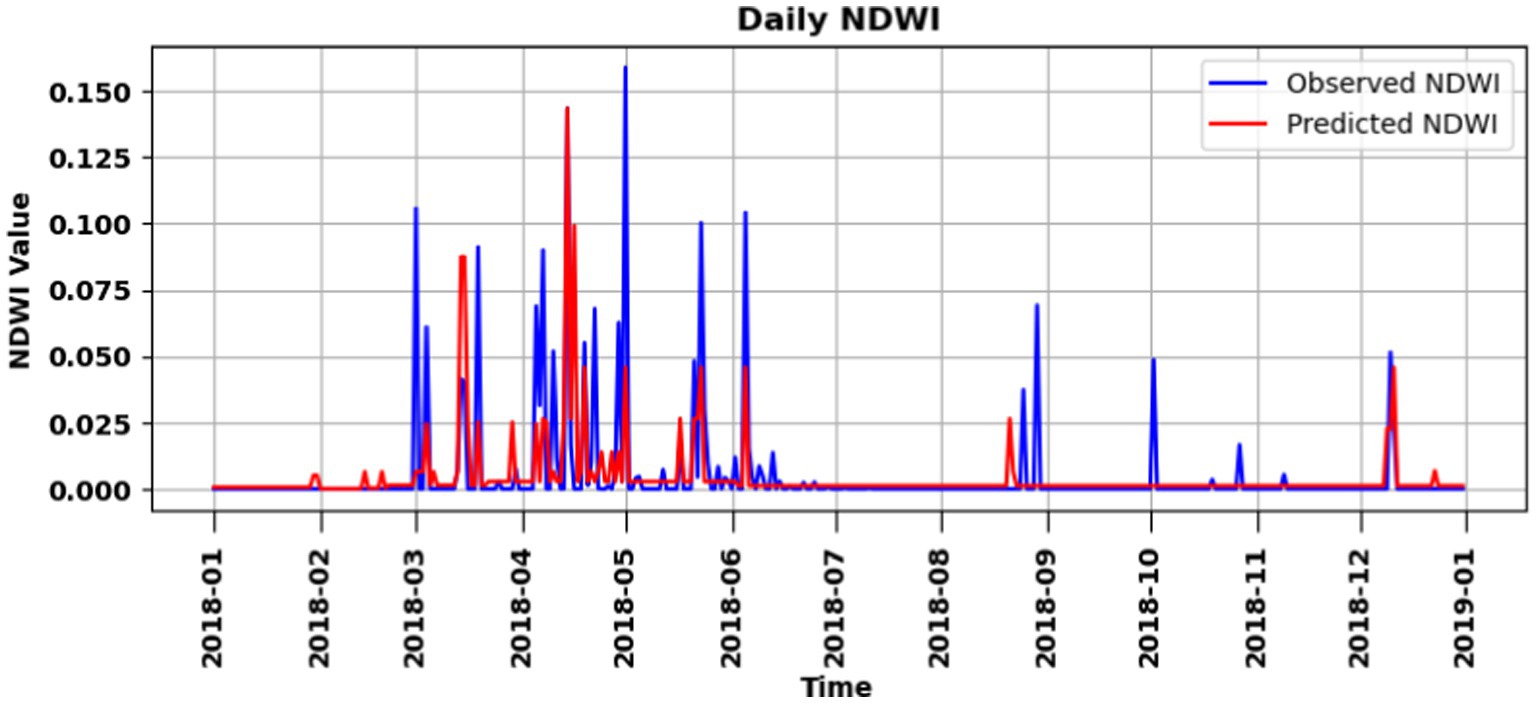
Figure 16. Observed daily NDWI generated from Aqua MODIS and predicted NDWI for the Lodwar Town using forecasted CHIPRS-GEFS rainfall.
At the time of the analysis, Aqua MODIS represented the only freely available satellite product suitable for continuous NDWI monitoring in the region. However, to improve model accuracy and better represent peak flood-related signals, future studies might consider incorporating higher-resolution satellite imagery products, which may provide more detailed spatial information critical for accurately predicting NDWI and associated flood events.
5 Discussion
This study demonstrates a practical approach for enhancing flood detection and forecasting in regions with limited hydrometeorological infrastructure. By leveraging machine learning and exclusively using remotely sensed data, the method significantly advances flood monitoring capabilities, particularly in areas such as Lodwar Town, where ground-based stations and historical hydrological records are scarce (Remesan and Mathew, 2015). Similar approaches using NDWI, and rainfall data have been successfully applied in semi-arid regions for flood monitoring (McFeeters, 1996), but the integration of bias-corrected CHIRPS-GEFS forecasts with machine learning models in this study provides added predictive capability.
The machine learning system effectively predicts NDWI values based on rainfall and supplementary meteorological datasets. This enables timely identification and forecasting of floods in flood-prone areas whenever rainfall forecasts are available. Such predictive ability empowers local authorities and communities to implement preparatory measures, thereby minimizing the adverse impacts of short-lived floods, particularly where conventional observing networks are lacking (Rasheed et al., 2022). A robust association is established between periods of extreme rainfall and observed flood events in the Turkwel Basin, with April 2018 and October 2019 identified as especially flood prone. This conclusion is supported by the convergence of multiple data streams, including, CHIRPS rainfall data, Aqua MODIS NDWI time series, and high-resolution spatial mapping from Sentinel-2. The evident increase in extreme rainfall during these periods underscores an escalating flood risk across the region.
Analysis reveals a moderate temporal correlation (r ≈ 0.51 at zero lag) between daily CHIRPS rainfall and MODIS NDWI, improving to ~0.64 with decision-tree regression models. This indicates the NDWI’s strength in detecting and tracking inundation events and aligns with previous studies using machine learning for streamflow or flood prediction in ungauged basins (Khosravi et al., 2021). The detailed spatial information from Sentinel-2 maps corroborates flood occurrence and extent, despite occasional underestimation caused by cloud cover and limited revisit frequency. MODIS, while offering coarser spatial resolution, provides consistent temporal coverage critical for early warning in data-scarce regions, similar to findings by McFeeters (1996).
Bias correction of CHIRPS-GEFS rainfall forecasts significantly improves alignment with observed CHIRPS rainfall, enhancing their utility as inputs for machine learning flood prediction models. Without such corrections, raw CHIRPS-GEFS forecasts tend to overestimate rainfall, which could reduce predictive accuracy. The model also demonstrates actionable lead time: even modest improvements in correlation enable identification of “signal zones” and potential flooding in advance, and the use of 7-day or more ahead forecasted rainfall could further enhance preparedness (Nearing et al., 2024).
Overall, the study’s integrated, multi-sensor framework presents a scalable and robust solution for flood detection in data-scarce environments. The strong agreement among the various datasets rainfall, NDWI variability, spatial inundation, and bias-corrected forecasts bolsters the reliability of early warning systems. As a result, this framework holds promise for broader application in other semi-arid regions susceptible to riverine and short-lived flooding. To further strengthen these capabilities, future research might incorporate high spatiotemporal resolution satellite imagery and extend the methodology to comparable at-risk regions.
6 Conclusion
This study underscores the effectiveness of integrating remote sensing data with machine learning techniques to improve flood detection and prediction in data-scarce regions, exemplified by Lodwar Town in the Turkwel Basin. The use of the DTR algorithm significantly enhanced the correlation between CHIRPS rainfall incorporating various lag times and auxiliary meteorological variables with the NDWI derived from Aqua MODIS imagery of Lodwar Town, which serves as an indicator of surface water dynamics and flood events.
The DTR model improved the correlation coefficient from 0.51 to 0.64 during training, and further to 0.66 when evaluated for the year 2018 using bias corrected CHIRPS-GEFS forecasted 10-day rainfall data, which recorded the highest rainfall during the 2002–2024 study period. These results demonstrate the viability of machine learning models, combined with remotely sensed data, in supporting early warning systems using the forecasted rainfall data and enhancing flood risk assessment where ground-based hydrometeorological observations are limited or unavailable.
The model successfully captured the general temporal trends of NDWI and exhibited the capacity to reflect flood-related signals. However, it underestimated certain NDWI peak values, a limitation attributed in part to the coarse spatial resolution of MODIS data. Aqua MODIS was the only freely available satellite product suitable for this purpose, however future research might explore higher-resolution alternatives to improve peak flood detection.
Spatial analysis revealed that areas with high cross-correlation to Lodwar’s NDWI are not the main sources of floods, as they receive relatively low rainfall. Instead, these regions function as hydrological indicator zone’s locations where significant rainfall can signal a high probability of flooding in Lodwar Town. This finding highlights the importance of identifying such signal regions to support early warning and disaster preparedness efforts.
Overall, the study underscores the value of digital innovations, particularly the integration of remotely sensed data and machine learning, in supporting early warning systems in regions lacking hydrometeorological observation networks. This method provides a viable, cost-effective alternative for enhancing short lived flood detection and forecast in vulnerable, data-limited regions.
Data availability statement
Publicly available datasets were analyzed in this study. This data can be found here: Open data sources for Remote sensing products were used. All are provided in the manuscript.
Author contributions
HL: Methodology, Visualization, Data curation, Conceptualization, Writing – review & editing, Writing – original draft, Formal analysis. MT: Conceptualization, Project administration, Writing – review & editing, Methodology, Funding acquisition, Supervision. OL: Writing – review & editing, Data curation. ED: Project administration, Writing – review & editing, Funding acquisition.
Funding
The author(s) declare that financial support was received for the research and/or publication of this article. This work was funded by UK aid from the UK government and by the International Development Research Centre (IDRC), Ottawa, Canada as part of the Climate Adaptation and Resilience (CLARE) research programme through the PALM-TREEs Project (Collaborative program on Climate Adaptation and Resilience) project (grant no. 110002-003).
Conflict of interest
The authors declare that the research was conducted in the absence of any commercial or financial relationships that could be construed as a potential conflict of interest.
Generative AI statement
The authors declare that no Gen AI was used in the creation of this manuscript.
Any alternative text (alt text) provided alongside figures in this article has been generated by Frontiers with the support of artificial intelligence and reasonable efforts have been made to ensure accuracy, including review by the authors wherever possible. If you identify any issues, please contact us.
Publisher’s note
All claims expressed in this article are solely those of the authors and do not necessarily represent those of their affiliated organizations, or those of the publisher, the editors and the reviewers. Any product that may be evaluated in this article, or claim that may be made by its manufacturer, is not guaranteed or endorsed by the publisher.
Author disclaimer
The views expressed herein do not necessarily represent those of the UK government, IDRC or its Board of Governors.
Footnotes
1. ^https://www.lodwarmunicipality.go.ke
2. ^https://code.earthengine.google.com/bd7ca6c861565752b95e90bf022328f2
References
Anushree, R., and Singh, D. P. (2023). “Detection of flood events from satellite images using deep learning” in Intelligent data engineering and analytics. eds. S. C. Satapathy, Y. D. Zhang, V. Bhateja, and R. Majhi (Singapore: Springer Nature Singapore), 259–268.
Atefi, M. R., and Miura, H. (2022). Detection of flash flood inundated areas using relative difference in NDVI from Sentinel-2 images: a case study of the august 2020 event in Charikar, Afghanistan. Remote Sens 14:647. doi: 10.3390/rs14153647
Beck, H. E., van Dijk, A. I. J. M., Levizzani, V., Schellekens, J., Miralles, D. G., Martens, B., et al. (2017). MSWEP: 3-hourly 0.25° global gridded precipitation (1979–2015) by merging gauge, satellite, and reanalysis data. Hydrol. Earth Syst. Sci. 21, 589–615. doi: 10.5194/hess-21-589-2017
Brázdil, R., Faturová, D., Šulc Michalková, M., Řehoř, J., Caletka, M., and Zahradníček, P. (2024). Spatiotemporal variability of flash floods and their human impacts in the Czech Republic during the 2001–2023 period. Nat. Hazards Earth Syst. Sci. 24, 3663–3682. doi: 10.5194/nhess-24-3663-2024
Buitinck, L., Louppe, G., Blondel, M., Pedregosa, F., Mueller, A., Grisel, O., et al. (2013). API design for machine learning software: Experiences from the scikit-learn project. In ECML PKDD 2013 Workshop: Languages for Data Mining and Machine Learning. Berlin, Germany: Springer. 108–122.
Dhillon, M. S., Kübert-Flock, C., Dahms, T., Rummler, T., Arnault, J., Steffan-Dewenter, I., et al. (2023). Evaluation of MODIS, Landsat 8 and Sentinel-2 data for accurate crop yield predictions: a case study using STARFM NDVI in Bavaria, Germany. Remote Sens 15:830. doi: 10.3390/rs15071830
Elsayed, A., Rixon, S., Levison, J., Binns, A., and Goel, P. (2024). Machine learning models for prediction of nutrient concentrations in surface water in an agricultural watershed. J. Environ. Manag. 372:123305. doi: 10.1016/j.jenvman.2024.123305
Funk, C., Peterson, P., Landsfeld, M., Pedreros, D., Verdin, J., Shukla, S., et al. (2015). The climate hazards infrared precipitation with stations—a new environmental record for monitoring extremes. Sci. Data 2:150066. doi: 10.1038/sdata.2015.66
Gabriel Stecher, M. H. (2019). Spatio-temporal vegetation analysis for the Turkwel River. Available online at: https://www.appear.at/fileadmin/Dokumente/appear.at/projects/project158/capnex_publications/Annex-BOKU-05_Appendix_NDVI_Turkwel_Gabriel_MHe_01082019_midTermReport.pdf (Accessed May 10, 2025).
Hirpa, F. A., Dyer, E., Hope, R., Olago, D. O., and Dadson, S. J. (2018). Finding sustainable water futures in data-sparse regions under climate change: insights from the Turkwel River basin, Kenya. J. Hydrol. Reg. Stud. 19, 124–135. doi: 10.1016/j.ejrh.2018.08.005
IOM. (2024). International Organization for Migration 2024 IOM report. IOM. Available online at: https://www.iom.int
Jena, P. K., Rahaman, S. M., Kumar, P., Mohapatra, P. K. D., Barik, D. P., Surabhi Patra, D., et al. (2023). Hydrological modelling for flood prediction using machine learning. J. Hydrol. 620:129583.
Khosravi, K., Miraki, S., Saco, P. M., and Farmani, R. (2021). Short-term river streamflow modeling using ensemble-based additive learner approach. J. Hydro Environ. Res. 39, 81–91. doi: 10.1016/j.jher.2021.07.003
Korzenevica, M., Ng’asike, P. O., Ngikadelio, M., Lokomwa, D., Ewoton, P., and Dyer, E. (2024a). Flood impacts and community response in Turkana County. Front Clim. 6:1374558.
Korzenevica, M., Ng’asike, P. O., Ngikadelio, M., Lokomwa, D., Ewoton, P., and Dyer, E. (2024b). From fast to slow risks: shifting vulnerabilities of flood-related migration in Lodwar, Kenya. Clim. Risk Manag. 43:100584. doi: 10.1016/j.crm.2024.100584
Li, J., Wang, Z., and Zhang, T. (2023). Flood simulation using the hydrological model and the hydrological–hydrodynamic coupling model in a small watershed in semi-arid and sub-humid region, North China. J. Water Clim. Change 14, 3496–3516. doi: 10.2166/wcc.2023.161
Liu, Q., Du, M., Wang, Y., Deng, J., Yan, W., Qin, C., et al. (2024). Global, regional and national trends and impacts of natural floods, 1990–2022. Bull. World Health Organ. 102, 410–420. doi: 10.2471/blt.23.290243
Liu, H., Hu, H., Liu, X., Jiang, H., Liu, W., and Yin, X. (2022). A comparison of different water indices and band downscaling methods for water bodies mapping from Sentinel-2 imagery at 10-M resolution. Water 14:696. doi: 10.3390/w14172696
Ma, W., Ishitsuka, Y., Takeshima, A., Hibino, K., Yamazaki, D., Yamamoto, K., et al. (2021). Applicability of a nationwide flood forecasting system for typhoon Hagibis 2019. Sci. Rep. 11:10213. doi: 10.1038/s41598-021-89522-8
Maidment, R. I., Grimes, D., Allan, R. P., Tarnavsky, E., Stringer, M., Hewison, T., et al. (2014). The 30 year TAMSAT African rainfall climatology and time series (TARCAT) data set. J. Geophys. Res. Atmos. 119:927. doi: 10.1002/2014JD021927
Martinaitis, S. M., Wilson, K. A., Yussouf, N., Gourley, J. J., Vergara, H., Meyer, T. C., et al. (2023). A path toward short-term probabilistic flash flood prediction. Bull. Am. Meteorol. Soc. 104, E585–E605. doi: 10.1175/BAMS-D-22-0026.1
Mashaly, J., and Ghoneim, E. (2018). Flash flood Hazard using optical, radar, and stereo-pair derived DEM: Eastern Desert. Egypt. Remote Sens. 10:204. doi: 10.3390/rs10081204
McFeeters, S. K. (1996). The use of the normalized difference water index (NDWI) in the delineation of open water features. Int. J. Remote Sens. 17, 1425–1432. doi: 10.1080/01431169608948714
Meng, C., and Jin, H. (2023). A comparison of machine learning models for predicting flood susceptibility based on the enhanced NHAND method. Sustainability 15:928. doi: 10.3390/su152014928
Mondejar, J. P., and Tongco, A. F. (2019). Near infrared band of Landsat 8 as water index: a case study around Cordova and Lapu-Lapu City, Cebu, Philippines. Sustain. Environ. Res. 29:16. doi: 10.1186/s42834-019-0016-5
Nearing, G., Cohen, D., Dube, V., Gauch, M., Gilon, O., Harrigan, S., et al. (2024). Global prediction of extreme floods in ungauged watersheds. Nature 627, 559–563. doi: 10.1038/s41586-024-07145-1
Obada, E., Biao, E. I., Zohou, P. J., Yarou, H., Hounnondaho, F. Z., and Alamou, E. A. (2025). Using machine learning and satellite data to improve flood forecasting: the case of the Ouémé basin at the Bétérou outlet. Hydrol. Res. 56, 153–166. doi: 10.2166/nh.2025.133
Pedregosa, F., Varoquaux, G., Gramfort, A., Michel, V., Thirion, B., Grisel, O., et al. (2011). Scikit-learn: machine learning in Python. J. Mach. Learn. Res. 12, 2825–2830.
Prakash, C., Barthwal, A., and Acharya, D. (2023). FLOODWALL: a real-time flash flood monitoring and forecasting system using IoT. IEEE Sensors J. 23, 787–799. doi: 10.1109/JSEN.2022.3223671
Rajagopal, M., Zipser, E., Huffman, G., Russell, J., and Tan, J. (2021). Comparisons of IMERG version 06 precipitation at and between passive microwave overpasses in the tropics. J. Hydrometeorol. doi: 10.1175/JHM-D-20-0226.1
Rasheed, Z., Aravamudan, A., Gorji Sefidmazgi, A., Anagnostopoulos, G. C., and Nikolopoulos, E. I. (2022). Advancing flood warning procedures in ungauged basins with machine learning. J. Hydrol. 609:127736. doi: 10.1016/j.jhydrol.2022.127736
Remesan, R., and Mathew, J. (2015). Hydrological data driven modelling: A case study approach. Cham, Switzerland: Springer.
Rinat, Y., Marra, F., Armon, M., Metzger, A., Levi, Y., Khain, P., et al. (2021). Hydrometeorological analysis and forecasting of a 3D flash-flood-triggering desert rainstorm. Nat. Hazards Earth Syst. Sci. 21, 917–939. doi: 10.5194/nhess-21-917-2021
Sadiq, R., and Imran, M. (2022). “Remote sensing for flood mapping and monitoring” in International handbook of disaster research. ed. A. Singh (Singapore: Springer Nature Singapore), 1–19.
Saouabe, T., Naceur, K. A., El Khalki, E. M., Hadri, A., and Saidi, M. E. (2022). GPM-IMERG product: a new way to assess the climate change impact on water resources in a Moroccan semi-arid basin. J. Water Clim. Chang. 13, 2559–2576. doi: 10.2166/wcc.2022.403
Schober, P., Boer, C., and Schwarte, L. A. (2018). Correlation coefficients: appropriate use and interpretation. Anesth. Analg. 126, 1763–1768. doi: 10.1213/ANE.0000000000002864
Tarnavsky, E., Grimes, D., Maidment, R., Black, E., Allan, R. P., Stringer, M., et al. (2014). Extension of the TAMSAT satellite-based rainfall monitoring over Africa and from 1983 to present. J. Appl. Meteorol. Climatol. 53, 2805–2822. doi: 10.1175/JAMC-D-14-0016.1
Taye, M. T. (2025). Responding to increasing hydrological extremes: the case of Lodwar floods. Available online at: https://clareprogramme.org/update/responding-to-increasing-hydrological-extremes-the-case-of-lodwar-floods/ (Accessed May 18, 2025).
Taye, M. T., and Dyer, E. (2022). Using past and future hydrometeorological stress to inform water management in a changing climate: an approach to creating localized storylines in an Ethiopian river basin. AGU Fall Meet. Abst. 2022, H42E–H1350E.
Turney, S. (2024). Pearson correlation coefficient (r) | guide and examples. Available online at: https://www.scribbr.com/statistics/pearson-correlation-coefficient/ (Accessed May 18, 2025).
UNICEF. (2024). United Nations children’s fund report. Available online at: https://www.unicef.org (Accessed May 15, 2025).
Van Dijk, A. I. J. M., Beck, H. E., Boergens, R. A. M., de Jeu, R., Dorigo, W. A., Edirisinghe, C., et al. (2025). Global water monitor 2024, Summary Report. Available online at: https://www.globalwater.online/globalwater/wp-content/uploads/2018/09/GWM-Report-2024.pdf (Accessed May 15, 2025).
Wanguba, B., Siriba, D. N., and Okumu, B. O. (2024). GIS-based multi-criteria decision analysis model for utility water demand: the case of Lodwar municipality, Turkana County, Kenya. Heliyon 10:e36518. doi: 10.1016/j.heliyon.2024.e36518
Wedajo, G. K., Lemma, T. D., Fufa, T., and Gamba, P. (2024). Integrating satellite images and machine learning for flood prediction and susceptibility mapping for the case of Amibara, Awash Basin, Ethiopia. Remote Sens 16:163. doi: 10.3390/rs16122163
WMO. (2025). State of the Climate in Africa 2024. Available online at: https://wmo.int/publication-series/state-of-climate-africa-2024 (Accessed May 16, 2025).
Keywords: flood, machine learning, decision tree regression, remote sensing, Lodwar Town
Citation: Lakew HB, Taye MT, Lino O and Dyer E (2025) Remote sensing and machine learning integration to detect and forecast floods in Lodwar Town, Turkwel Basin, Kenya. Front. Water. 7:1683545. doi: 10.3389/frwa.2025.1683545
Edited by:
Alexandra Gemitzi, Democritus University of Thrace, GreeceReviewed by:
Indra Mani Tripathi, Indian Institute of Technology Gandhinagar, IndiaLuh Joni Erawati Dewi, Ganesha University of Education, Indonesia
Copyright © 2025 Lakew, Taye, Lino and Dyer. This is an open-access article distributed under the terms of the Creative Commons Attribution License (CC BY). The use, distribution or reproduction in other forums is permitted, provided the original author(s) and the copyright owner(s) are credited and that the original publication in this journal is cited, in accordance with accepted academic practice. No use, distribution or reproduction is permitted which does not comply with these terms.
*Correspondence: Meron Teferi Taye, bWVyb24udGF5ZUBjZ2lhci5vcmc=