 Piyush Tripathi
 Kriti Varma
 Pawan Kumar Jha
- Centre of Environmental Studies, University of Allahabad, Prayagraj, Uttar Pradesh, India
Groundwater quality assessment is crucial for understanding the effects of natural and anthropogenic activities on water resources, particularly in regions like Uttar Pradesh, India, where groundwater serves as a primary source for drinking, irrigation, and industrial purposes. This study examines the hydrogeochemical characteristics, metal pollution indices, and groundwater quality in relation to carcinogenic and noncarcinogenic risks to adult and child populations, using an integrated approach that combines several metal pollution indices. The analysis is based on 50 samples (25 samples per season) collected in Mirzapur district. The mean concentration of heavy metals in the pre-monsoon phase followed the order: Zn > Fe > Cd > As> Pb > Cr, and during the post-monsoon, it was: Fe > Zn > Cd > As > Pb > Cr. This reversal in the relative abundance of Zinc and Iron likely reflects post-monsoon mobilisation of Fe through reductive dissolution of Fe-bearing minerals, coupled with dilution and leaching effects that reduce Zn concentrations during recharge. The study revealed elevated concentrations of arsenic (100 μg/L) and cadmium (125 μg/L), along with high values of HPI (2900), HEI (47), and NI (34). All of these exceeded the critical values, indicating significant pollution by heavy metals in the region. Chronic exposure to Fe and Cd exhibited Hazard Quotient (HQ) values far above safe thresholds of 1, reaching up to 1.25 for Fe and 3 for Cd. The Total Carcinogenic Risk (TCR) values for As exceeded the acceptable range, reaching up to 4 × 10⁻³, and particularly impacted vulnerable groups, such as children.
1 Introduction
Water is universally acknowledged as the cornerstone of life, playing an indispensable role in sustaining ecological balance and ensuring the well-being of all living organisms. Among its various sources, groundwater stands out as a critical resource, particularly in regions where surface water availability is either limited or seasonally variable (Shaikh and Birajdar, 2024). Groundwater not only supports essential domestic needs such as drinking, cooking, and sanitation, but also underpins agricultural productivity, which is vital for food security, and industrial operations, which drive economic growth. In a developing country like India, which is among the world’s largest consumers of groundwater, the importance of groundwater is further magnified by demographic pressure, climate variability, and uneven spatial distribution of surface water resources (Panda et al., 2022). India is heavily dependent on groundwater to meet its water demands, with nearly 85% of the rural population relying on it for drinking water and approximately 60% of the irrigated agriculture being sustained by it. However, in recent decades, the quality of groundwater has emerged as a pressing concern due to increasing contamination driven by both natural (geogenic) processes and human-induced (anthropogenic) activities (Akhtar et al., 2021). One of the most alarming forms of contamination is the presence of heavy metals in groundwater, often found at concentrations that exceed the acceptable limits defined by international and national regulatory bodies such as the World Health Organisation (WHO) and the Bureau of Indian Standards (BIS). The Water Quality Index in several regions of the Ganga belt had shown significant depletion from ‘good’ to ‘poor’ and ‘very poor’ categories as evident from the recent studies of Akram et al. (2024) in Malda, West Bengal, and pollution of heavy metals such as iron, cadmium, and manganese in Dinajpur area of West Bengal as reported by Rahman et al. (2024).
Heavy metals, including arsenic (As), cadmium (Cd), lead (Pb), chromium (Cr), zinc (Zn), and iron (Fe), pose a serious threat to public health and environmental safety due to their toxic, non-biodegradable, and bioaccumulative nature (Mishra et al., 2019; Mishra et al., 2018). Once introduced into the aquifer system, these metals persist in the environment for long periods and can enter the food chain through drinking water and crop irrigation, gradually accumulating in human tissues over time. Chronic exposure, even at trace levels, is associated with a multitude of health disorders such as neurological impairment, renal failure, cardiovascular diseases, weakened immune response, skeletal damage, developmental issues in children, and an elevated risk of carcinogenesis. These risks are especially pronounced in resource-poor communities, where groundwater is consumed without treatment and access to healthcare is limited, thereby exacerbating the public health burden (Ohiagu et al., 2022).
In this context, the Mirzapur district, located in southeastern Uttar Pradesh, presents a unique and understudied case. Situated at the intersection of the Indo-Gangetic Plain and the Vindhyan Plateau, Mirzapur is hydrogeologically diverse, with its subsurface composed of a complex mix of sedimentary and crystalline rocks, including shales, sandstones, limestones, and granites (Pandey and Mishra, 2024). These lithological formations are naturally enriched with trace elements that may leach into groundwater under favourable geochemical conditions, contributing to geogenic contamination. Furthermore, Mirzapur is undergoing rapid socio-economic transformation, characterised by the expansion of urban settlements, intensification of agriculture, the indiscriminate use of chemical fertilisers and pesticides, and the emergence of small-scale industrial clusters (Sharma et al., 2025). These activities significantly disturb the hydrogeochemical equilibrium, promoting the mobilisation, migration, and accumulation of toxic heavy metals in the groundwater system. Despite its environmental vulnerability and high dependency on groundwater, Mirzapur has not received adequate scientific attention in the domain of water quality research and risk assessment. Most studies involving Mirzapur focus on the River Ganga water quality in the district, while studies involving groundwater are sparse. Existing groundwater quality data are either fragmented, outdated, or limited to basic physico-chemical parameters, offering an incomplete picture of the region’s water security. The absence of a comprehensive and updated database on heavy metal contamination and the associated health risks poses a significant barrier to effective water resource management (Michael, 2020). Therefore, a detailed and systematic investigation is urgently needed to identify contamination hotspots, trace the potential sources (both geogenic and anthropogenic), understand spatial variability and seasonal trends, and quantify the degree of human health risk associated with heavy metal exposure through groundwater.
To address this research gap, the present study sets out with four primary objectives: (a) to determine the concentration levels of selected heavy metals including As, Cd, Pb, Cr, Fe & Zn in groundwater samples collected from multiple locations across Mirzapur; (b) statistical analysis including one-way ANOVA, correlation, and cluster analysis for source identification; (c) to evaluate the extent and severity of contamination by using Heavy Metal Pollution Index (HPI), Heavy Metal Evaluation Index (HEI), Nemerow Index (NI), and Ecological Risk Index (ERI); and (d) to conduct a quantitative health risk assessment by calculating Chronic Daily Intake (CDI), Health Quotient (HQ), Hazard Quotient (HI), and Cancer Risk (TCR) values for both adults and children.
This multi-metric approach ensures a holistic understanding of groundwater safety in the district (Sharafi and Salehi, 2025). Mirzapur is located in the Mid-Gangetic plain. The Ganga plain is one of the largest alluvial plains on Earth, with 40% of the Indian population depending on it for water and food supply. The increase in urban and industrial activities, along with population growth, has adversely affected the environment of the plain. The groundwater pollution in the Gangetic flood plain is not just an Indian or South Asian concern; it is a global environmental challenge as it involves issues related to water security, public health at a global scale due to metal contamination, global food safety and progress toward international sustainability goals (Devi and Yadav, 2018; Ansari et al., 2000). By generating robust data and applying internationally accepted risk assessment protocols, the findings will serve as a valuable resource for policymakers, environmental regulators, and public health officials. The insights derived from this study can inform the design of targeted monitoring programs, the implementation of preventive and corrective measures, and the development of evidence-based water quality management strategies at both the district and state levels. Furthermore, by highlighting the vulnerability of groundwater-dependent populations, this research contributes to broader goals, such as Sustainable Development Goal 6 (Clean Water and Sanitation), environmental justice, and the protection of marginalised communities in hydro-environmentally sensitive regions, like Mirzapur.
2 Study area
Mirzapur district is situated in the southeastern part of Uttar Pradesh, India, and serves as a transitional zone between the fertile Gangetic plains and the rugged Vindhyan plateau. Geographically, the district lies between 23°52’N and 25°32’N latitude and 82°07′E and 83°33′E longitude, covering an area of approximately 4,521 square kilometres. It is bounded by Prayagraj to the west, Varanasi to the north, Sonbhadra to the southeast, and shares its southwestern boundary with Madhya Pradesh. The Ganga River, which flows along the northern periphery of the district, serves not only as a major surface water body but also plays a crucial role in recharging local aquifers. The geomorphology of Mirzapur is highly varied, comprising flat alluvial plains in the north and undulating plateaus and hill ranges in the south and southeast. The Vindhyan highlands, which dominate the southern part of the district, consist of dissected plateaus, escarpments, ridges, and steep valleys. In contrast, the northern plains are relatively flat, agriculturally productive, and enriched with alluvial deposits brought in by the Ganga and its tributaries. The district’s elevation ranges from approximately 80 meters above mean sea level (AMSL) near the river plains to over 400 meters AMSL in the hilly terrain. The drainage pattern is dendritic, governed by the Ganga and its tributaries, including the Tons, Belan, Karmanasha, and Jargo Rivers, which significantly influence the hydrological regime and groundwater recharge potential.
Geologically, Mirzapur is underlain predominantly by formations of the Vindhyan Supergroup, which include sandstones, shales, limestones, and quartzites. These sedimentary rock formations are well-exposed in the southern and central parts of the district, playing a critical role in the area’s hydrogeology (Dinkar et al., 2019). The northern part of the district comprises recent alluvial deposits, which are more conducive to groundwater accumulation due to their porous and permeable nature. The lithology of the region influences the mobilisation of various elements into the groundwater system, especially under the influence of weathering, leaching, and rock-water interactions. Notably, sandstone and shale formations in the plateau regions are known to release heavy metals, including Fe, As, Cr, and Pb, under specific geochemical conditions. Hydrogeologically, groundwater in the district occurs under unconfined to semi-confined conditions in the weathered and fractured Vindhyan rocks. At the same time, in the alluvial plains, it is found under phreatic to confined conditions. The aquifer characteristics vary with geological formations: the alluvial belt has relatively high permeability and yields, whereas the hard rock areas depend on secondary porosity developed through fracturing and weathering (Mishra et al., 2023). The depth to the water table in the district varies seasonally, typically ranging from 5 to 30 meters below ground level (mbgl). Groundwater recharge primarily occurs through monsoonal rainfall, river infiltration, and return flow from irrigation. However, overexploitation, coupled with contamination from agricultural runoff and anthropogenic activities, has led to deteriorating water quality in several parts of the district.
Demographically, Mirzapur is home to a population of over 2.5 million people, according to the 2011 Indian Census, with a relatively even distribution between urban and rural settlements. The economy is predominantly agrarian, supported by irrigation from groundwater, although industrial development and urbanisation have seen a gradual rise in recent decades (Verma, 2025). Many communities across Mirzapur rely almost entirely on groundwater for drinking, domestic use, and irrigation, making them particularly vulnerable to contamination. Limited access to piped water and treatment facilities increases the risk of exposure to naturally occurring and anthropogenically introduced heavy metals, posing significant public health concerns, especially in rural and peri-urban areas. Given this complex interplay of hydrogeology, geology, land use, and human dependence on groundwater, Mirzapur provides a representative and critical case for studying heavy metal contamination and associated health risks in groundwater. The district’s unique geogenic settings, combined with socio-economic vulnerabilities, underscore the importance of systematic scientific investigation and public health-oriented groundwater quality assessments in the region. The selected sampling points in the Mirzapur district are presented in Figure 1. The details of sampling sites with site codes, geo-coordinates, and land use type are provided in the Supplementary Table S1.
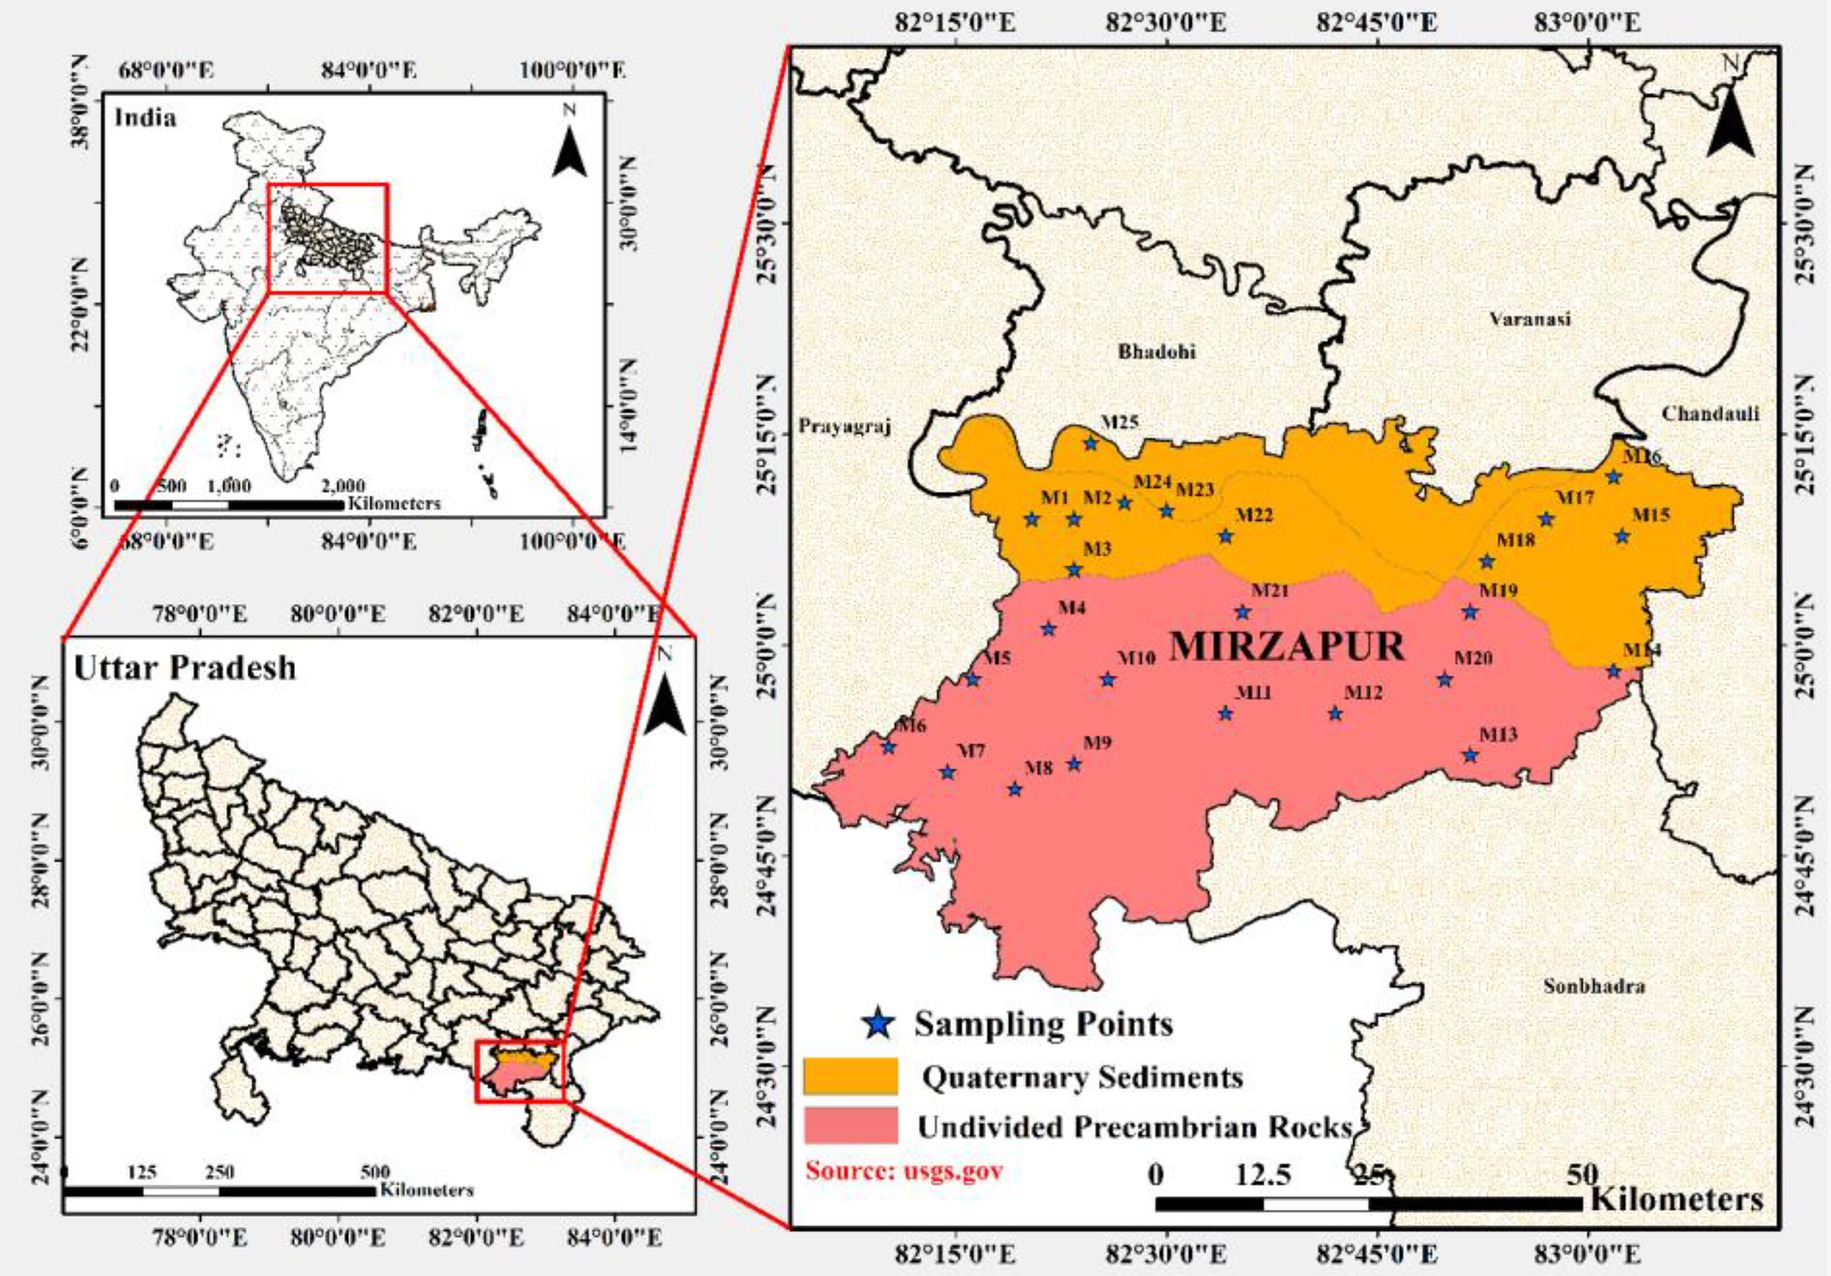
Figure 1. Study area map of selected locations of Mirzapur.
The land use and land cover map (Figure 2) of Mirzapur district reveals a diverse landscape dominated by tree cover and agricultural land. Dense tree cover, particularly in the central and southern regions, indicates significant forested areas likely associated with the Vindhyan hills, supporting local biodiversity and ecological stability. Agricultural land is primarily concentrated in the southern and southeastern parts, reflecting the region’s dependence on farming for livelihood. Built-up areas, marked in red, are mostly located in the northeastern section near Varanasi and along major transportation routes such as NH-2 and the Grand Trunk Road, highlighting zones of urbanisation and infrastructure development. Water bodies, scattered across the district, especially in the central and southern parts, play a critical role in irrigation and domestic use. Sand deposits are mainly found along the Ganges River in the north, indicating active fluvial processes, while barren lands are sparsely distributed in the southern areas, pointing to rocky or non-cultivable terrain. Overall, this spatial distribution underscores the need for balanced land use planning that integrates agricultural productivity, forest conservation, urban growth, and environmental sustainability.
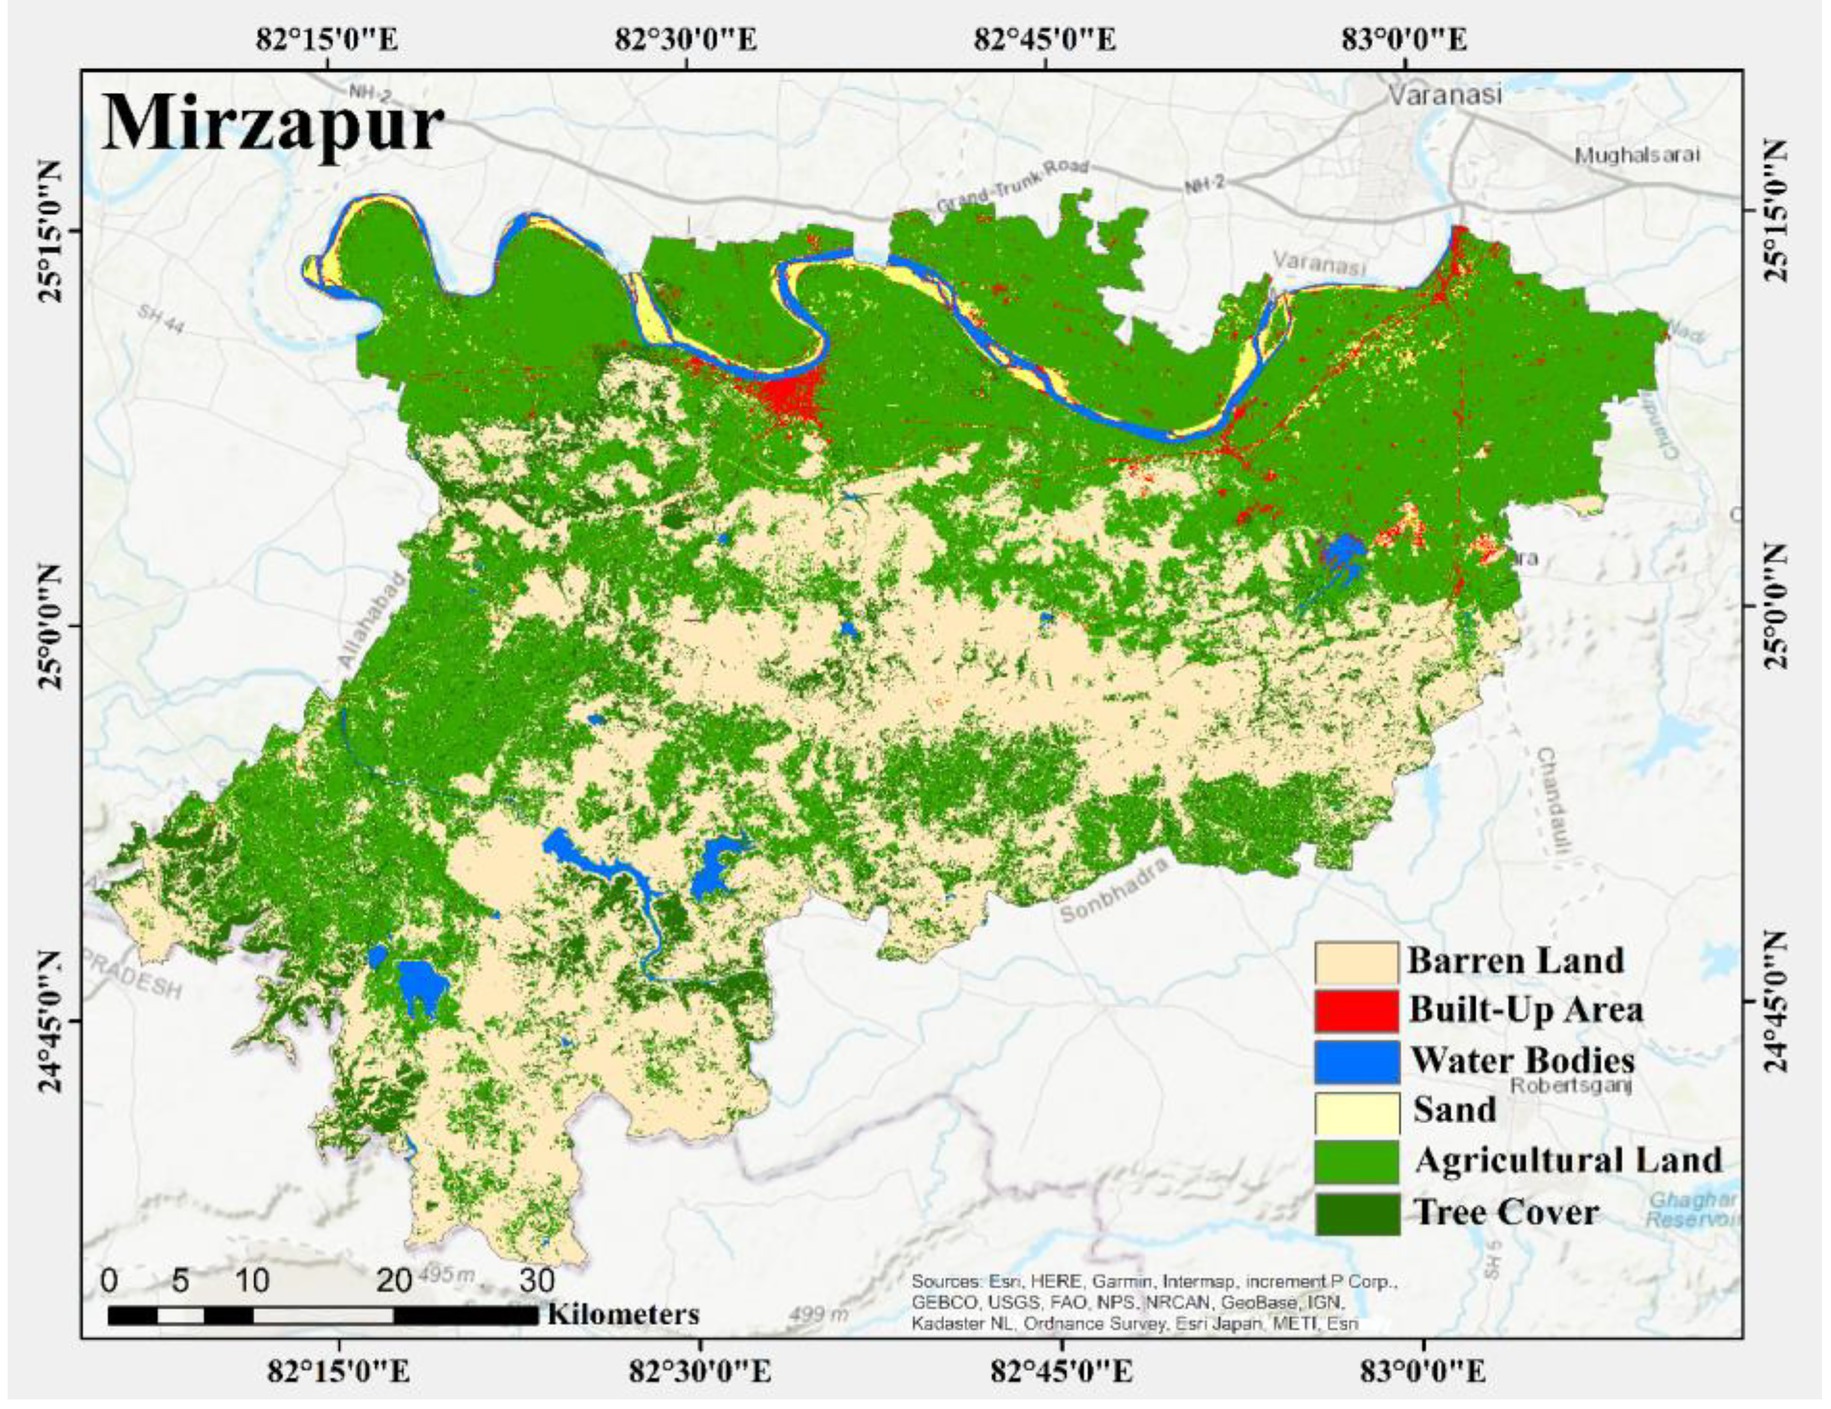
Figure 2. Land use land cover map of Mirzapur district, Uttar Pradesh.
3 Methodology
The present study employed a structured approach, involving field sampling and laboratory analysis, to assess the concentration of heavy metals in groundwater and evaluate the associated health risks in Mirzapur district, Uttar Pradesh. The methodology was designed to provide both spatial and quantitative insights into groundwater contamination and its implications for human health. Groundwater samples were collected from 25 locations each in the pre-monsoon (Pre-M) and post-monsoon (Post-M) seasons across the district to capture spatial and seasonal variability in contamination levels. The sampling sites were selected to encompass a diverse range of settings, including urban, semi-urban, and rural areas, as well as locations near potential sources of pollution, such as agricultural lands, industrial units, and waste disposal sites. Sampling was conducted using a random sampling approach, with particular attention to ensuring representation across different land use types and geological settings in the study area.
Water samples were collected from hand pumps, open wells, and borewells, which are commonly used by the local population for drinking and domestic purposes. Before collection, the water source was flushed for 3 to 5 min to eliminate stagnant water and obtain a representative sample. Samples were collected in pre-cleaned, acid-washed polyethene bottles. To minimise changes in metal concentration due to adsorption or microbial activity, the samples were immediately acidified to pH < 2 using ultra-pure nitric acid (HNO₃) after filtration in the field. The bottles were properly sealed, labelled, stored in iceboxes, and transported to the laboratory under cold conditions to preserve the integrity of the samples.
pH and electrical conductivity (EC) were measured on-site using a Labtronics pH/EC meter, model LT-68. Prior to measurement, the instrument was calibrated using standard buffer solutions (pH 4.0, 7.0, and 10.0 for pH calibration) and standard conductivity solutions of KCl (1,413 μS/cm) for EC calibration, in accordance with the manufacturer’s instructions. (APHA, 2017). The electrodes were thoroughly rinsed with distilled water between samples to prevent cross-contamination. pH and EC readings were taken after allowing the probes to stabilise in the sample solution.
The concentrations of metals (Fe, Pb, Cd, Cr, As, and Zn) were determined using a Flame Atomic Absorption Spectrophotometer (Analytik Jena novAA 350) and the analysis was conducted at a National Accreditation Board for Testing and Calibration (NABL)-certified laboratory (Bharat Oil and Waste Management Ltd., Kanpur). For arsenic measurement, a vapour generation accessory was used (AAS–HS 50 hydride generation system). The As concentration was measured at 193.7 nm. The detection limits for arsenic range between 1 μg/L and 1,000 μg/L for FAAS (Singh et al., 2010). Instrument calibration was performed using multi-element standard solutions prepared from certified stock solutions (1,000 mg/L) (Merck, Germany), and quality assurance was ensured through replicate analyses. The stock solutions were further diluted in the range of: 0.2–1 mg/L for Fe, 0.1–0.5 mg/L for Cd, 2–8 μg/L for As, 0.2–1 mg/L for Pb, 0.2–1 mg/L for Zn, and 0.2–1 mg/L for Cr and used for the calibration of AAS. The calibration curves yielded regression coefficients close to 0.99, indicating excellent linearity (Supplementary Figure S2). Alongside, a Certified Reference Material (CRM) [INORGANIC VENTURES make; Concentration 1,000–1,002 μg/mL density: 1.002 to 1.015 g/cm3 at 20 °C] was examined to confirm the correctness of the procedure (Supplementary Table S3). The CRM solution was diluted to make different concentrations of spiked solution to carry out the recovery analysis experiment to determine the accuracy of the analytical method. The results of the recovery analysis experiment (%) (Mean±SD) were in the range of: 99.68 ± 2.68% for Fe, 100.19 ± 1.52% for Cd, 99.80 ± 1.88% for As, 100.22 ± 1.39% for Pb, 99.54 ± 2.90% for Zn, and 99.54 ± 2.82% for Cr. The results of the recovery analysis experiment indicate high accuracy in determining heavy metals (Supplementary Table S3). The results were expressed in micrograms per litre (μg/L) and compared against the permissible limits set by the World Health Organisation (WHO, 2017). The Limits of Detection (LOD) and Limits of Quantification (LOQ) were calculated for the analytical blanks and slopes of the analytical curves. The LOD value for the heavy metals was 0.026 for Fe, 0.027 for Cd, 0.70 for As, 0.41 for Pb, 0.035 for Zn, and 0.040 for Cr; while the LOQ value was observed to be 0.08 for Fe, 0.081 for Cd, 2.14 for As, 1.24 for Pb, 0.11 for Zn, and 0.12 for Cr. The relative standard deviation (RSD%) was observed to be in the range of 0.50 to 7.60% for Fe, 0.2 to 9.4% for Cd, 4.2 to 9.6% for As, 0.4 to 4.8% for Pb, 0.2 to 9.4% for Zn, and 0.6 to 9.70% for Cr.
Q-GIS (version 3.44.1) was employed to plot the concentration of metals using Inverse Distance Weighting (IDW) in the study area. The interpolation technique, IDW, uses the values and distances to neighbouring sampled points to estimate the values at unsampled places. A cell’s value in this method is the weighted average of the values of neighbouring sample points. A point has more weight if it is nearer the cell in question (Zhang et al., 2015).
The data was analysed using the KMO (Kaiser-Meyer-Olkin) measure and Bartlett’s test of sphericity to determine its suitability for factor analysis. The KMO measures sampling adequacy, while Bartlett’s test assesses whether the variables are correlated enough to be factored. A high KMO score (ideally > 0.7) and a significant p-value (p < 0.05) from Bartlett’s test indicate that factor analysis is appropriate. However, this study had a KMO value below 0.7 and a p-value above 0.05 from Bartlett’s Test, and hence, Pearson’s Correlation and Cluster Analysis were performed for statistical analysis. Correlation analysis was employed to determine the strength of relationships among the measured physicochemical parameters (Tripathi et al., 2023). By calculating Pearson’s correlation coefficients (r), this analysis helps identify variables that may have shared origins, interdependencies, or causal relationships (Ravi et al., 2023). Hierarchical Cluster Analysis (HCA) was used to classify the sampling sites based on similarities in water quality parameters. This multivariate statistical technique organises the sites into clusters or groups with homogeneous characteristics, providing insights into the spatial patterns of contamination. The use of dendrograms in HCA visually illustrates the degree of similarity among sampling locations, aiding in the identification of areas influenced by common environmental or anthropogenic factors.
Additionally, a one-way Analysis of Variance (ANOVA) was conducted to evaluate the statistical significance of seasonal variations in environmental parameters. ANOVA determines whether there are significant differences between the means of different groups, using F-statistics and p-values as indicators (Varma et al., 2022). A p-value less than 0.05 was considered statistically significant in this study. The statistical analyses, including correlation and hierarchical cluster analysis, were performed using Origin software (2019). One-way ANOVA was performed using Microsoft Excel (2017).
To evaluate the degree of groundwater contamination, several pollution indices were computed using the measured metal concentrations. The Heavy Metal Pollution Index (HPI) was calculated using the following Equation 1:
where Qn is the quality rating of the nth water quality parameter and Wn is the unit weight of the nth water quality parameter (Kamali Maskooni et al., 2020; Rahman et al., 2024). The Heavy Metal Evaluation Index (HEI) was calculated using Equations 2, 3:
Where Mi is the observed concentration of the ith heavy metal, and Himac is the maximum permissible concentration of the ith heavy metal. The Nemerow Index (NI) was calculated to evaluate the metal risk to ecology using Equation 4:
Where (Mi/Ii)mean is the average value of (Mi/Ii) of all target heavy metals of a water sample, and (Mi/Ii)max is the maximum value of (Mi/Ii) among all target heavy metals detected in the water sample (Kamali Maskooni et al., 2020). The Ecological Risk Index (ERI) was calculated to evaluate the metal risk on the ecology using Equation 5:
where Cf is the contamination factor; n is the number of metals; Eir and Tir are the potential ecological risk factor and the toxicity response factor for individual metal, respectively (Sharafi and Salehi, 2025). Furthermore, a health risk assessment was conducted using Equation 6 for Chronic Daily Intake (CDI), Equation 7 for Hazard Quotient (HQ), and Equation 8 for Carcinogenic Risk (CR) as given below:
Where C is concentration of metal; IR is the ingestion rate (1.8 L/day for children and 2.2 L/day for adults); EF is the exposure frequency (365 d y−1 for both age groups); ED is the exposure duration (10 y for children and 65y for adult); BW is the body weight of the exposed individual (22.3 kg for children and 70 kg for adult); T is the time period over which the dose is averaged EF ED. The values, except C, were taken from Howladar et al. (2021) and Wu et al. (2024).
Where CSF is the carcinogenic slope factor.
The combined use of laboratory-based measurements and risk modelling provided a comprehensive understanding of groundwater quality and its potential impacts on public health in Mirzapur. This methodology ensured scientific rigour and reliability in evaluating heavy metal pollution, while also generating critical insights to inform water resource management and health policy decisions at the district level.
4 Result and discussion
4.1 Physicochemical analysis
The physicochemical parameters analysed in the study are shown through the interpolation maps given in Figure 3. The Pre-M map indicates a wider range of pH values across the region. A significant portion of the central and southern areas exhibits higher pH values, specifically in the range of 8.00 to 8.50. The high pH suggests that the soil or water in these areas was alkaline before the monsoon season. A smaller area in the north-central part exhibits pH levels ranging from 7.50 to 8.00. The Post-M map reveals a more uniform and generally lower pH distribution. The pH values in the 7.00–7.50 range indicate a shift towards a more neutral or slightly alkaline condition across the majority of the region. A small, isolated area in the northern part exhibits a pH range of 6.50–7.00, indicating slightly acidic to neutral conditions.
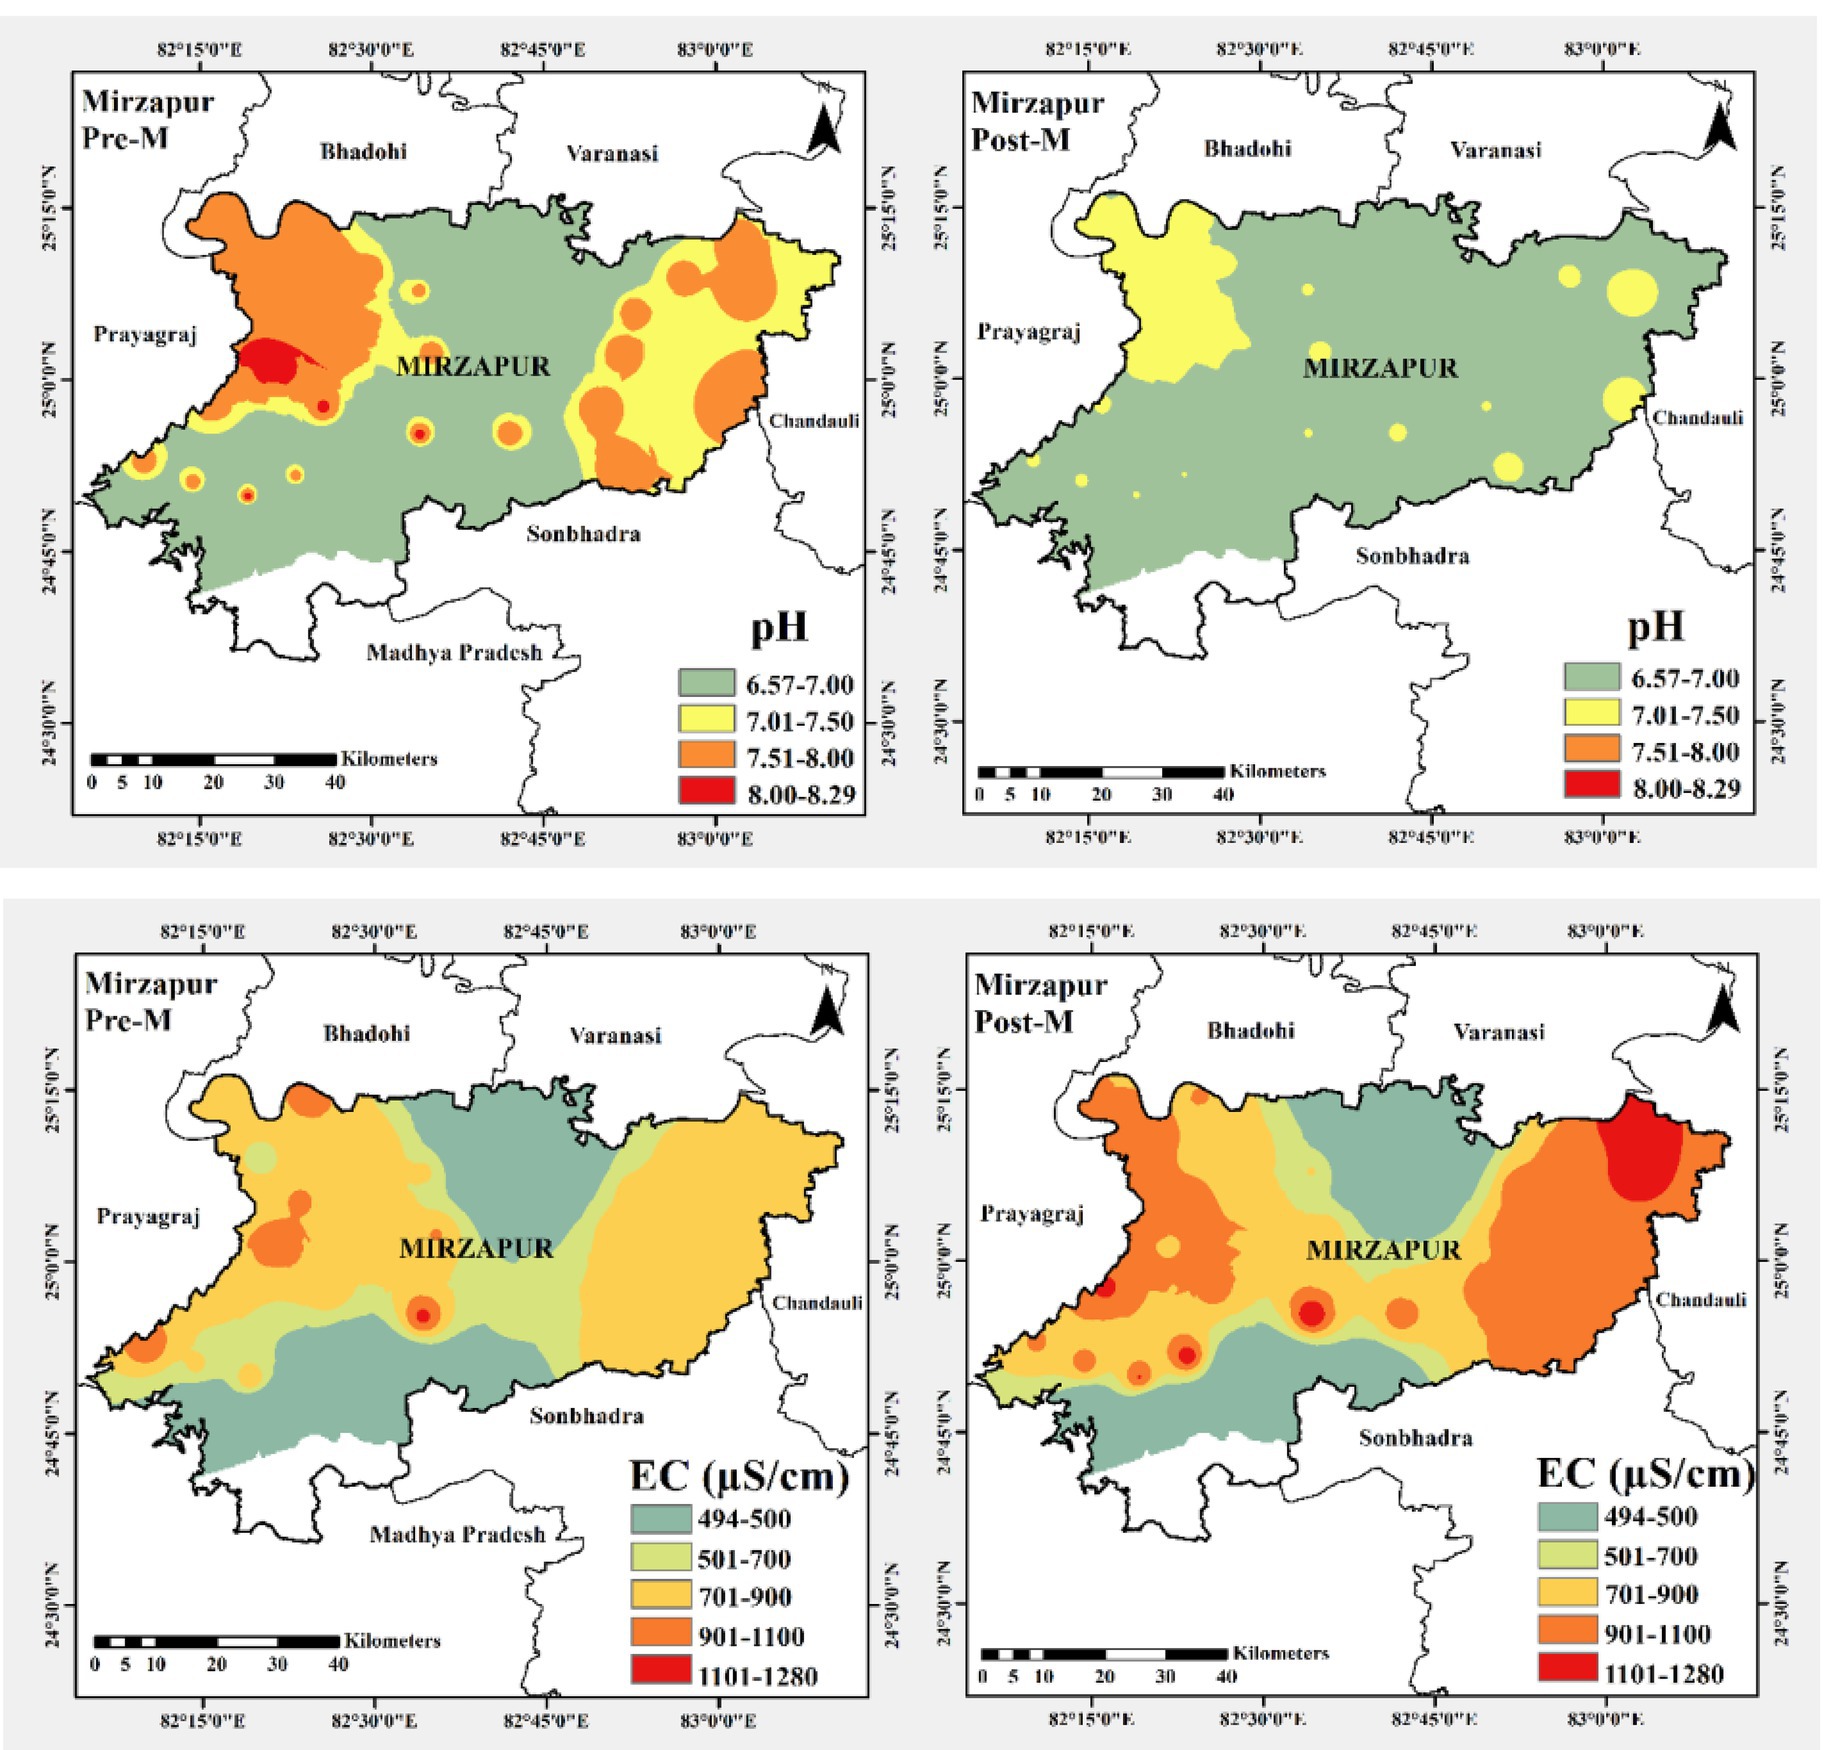
Figure 3. Spatial distribution pattern of the physicochemical parameters in Mirzapur district.
The comparison between the two maps clearly demonstrates a general decrease in pH levels across Mirzapur after the monsoon season. This reduction in pH can be attributed to several factors associated with monsoon rainfall, including the leaching of alkaline salts, the dilution of dissolved alkaline compounds, or the introduction of slightly acidic rainwater (Ahmed et al., 2022). The maps collectively provide valuable insights into the seasonal variability of pH in the Mirzapur region, highlighting the significant influence of monsoon events on the local environmental chemistry. This information is crucial for understanding soil fertility, water quality, and agricultural implications in the area.
The majority of the area exhibits moderately high EC values, predominantly in the 750–900 μS/cm range in the Pre-M season. There are several localised pockets with higher EC, reaching 900–1,200 μS/cm, particularly in the central and western parts. Conversely, a few smaller areas, mainly in the north-central and southwestern regions, display lower EC values, falling within the 600–750 μS/cm range, with isolated spots around 450–600 μS/cm. In contrast, the Post-M map indicates a significant and widespread increase in EC levels across Mirzapur. The EC values ranged from 900 to 1,200 μS/cm across most of the region. There are still some areas with moderately high EC (750–900 μS/cm) in the northern and western parts, but the overall trend points towards a substantial rise in EC. Some isolated spots recorded EC values in the range of 600–750 μS/cm.
Comparing the two maps, there is a clear and notable increase in Electrical Conductivity across Mirzapur after the monsoon season. This Post-M surge in EC suggests an accumulation of dissolved salts and ions in the soil and water. The increase in EC value can be attributed to various factors, such as the evaporation of standing water bodies left by the monsoon, which leads to the concentration of dissolved solids, or the leaching of salts from higher elevations and their subsequent deposition in lower areas. The rise in EC after the monsoon is a critical environmental indicator, as elevated EC can negatively impact agricultural productivity by affecting water uptake by plants and can also indicate changes in water quality (Panday et al., 2025). This seasonal variation in EC, therefore, highlights the intricate relationship between rainfall patterns and hydro-geochemical processes in the region.
4.2 Heavy metal concentration
The concentration of the analysed heavy metals was assessed in the study area to evaluate spatial and seasonal variations in metal concentration (Figure 4; Table 1). The mean concentration of heavy metals in the Pre-M phase followed the order: Zn > Fe > Cd > As> Pb > Cr, and during the Post-M, it was: Fe > Zn > Cd > As > Pb > Cr. This reversal in the relative abundance of Zn and Fe likely reflects post-monsoon mobilisation of Fe through reductive dissolution of Fe-bearing minerals, coupled with dilution and leaching effects that reduce Zn concentrations during recharge.

Figure 4. Spatial distribution pattern of the analysed heavy metals in Mirzapur district.
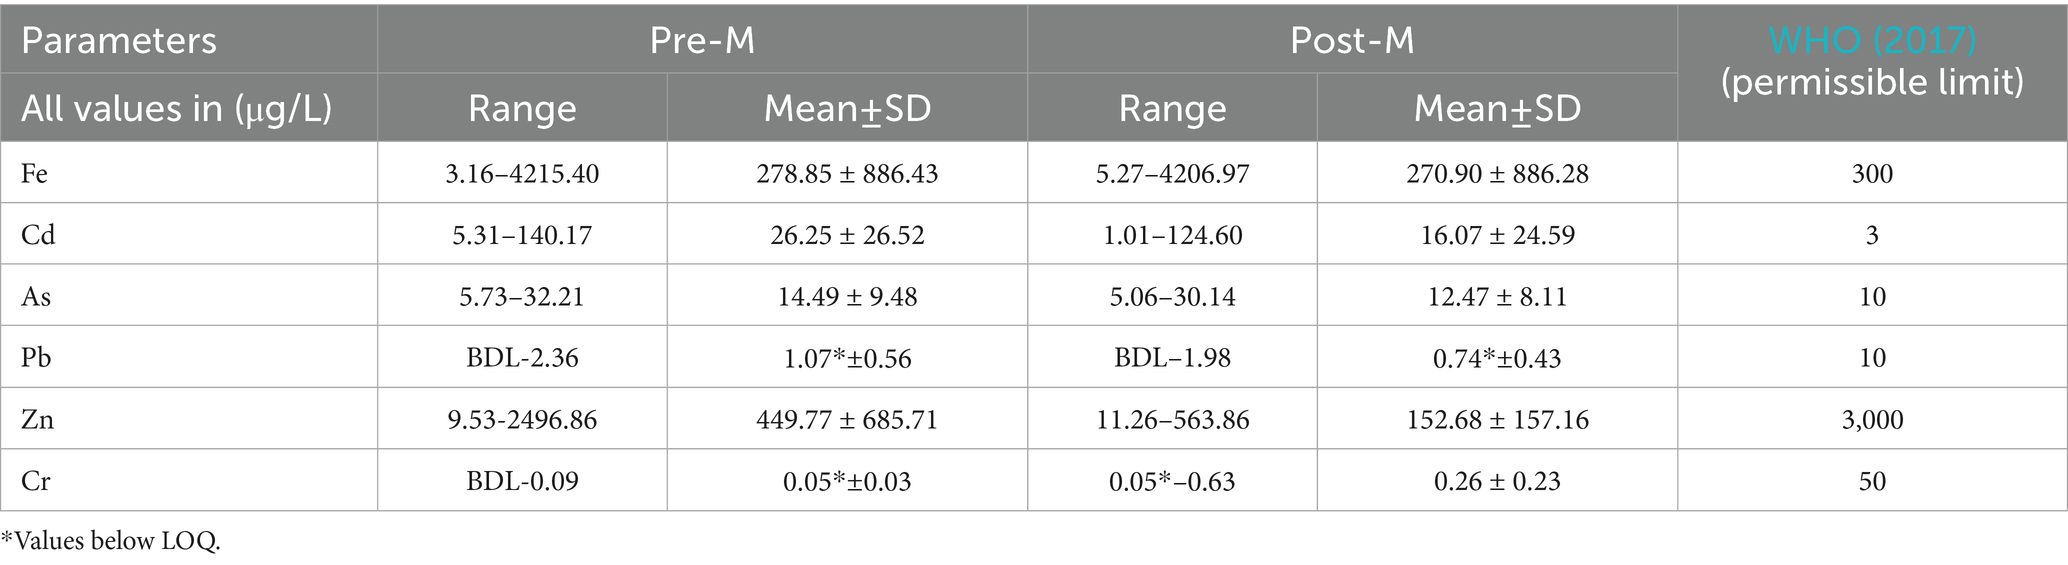
Table 1. Seasonal variation in the concentration of various heavy metals in groundwater of Mirzapur district.
During the Pre-M season, most of the district exhibits Fe concentrations below 500 μg/L, which, although relatively lower, still exceed safe drinking water standards. A prominent hotspot is observed in the northwestern part of the district, where Fe concentrations exceed 4,000 μg/L, depicted in red. Surrounding this core zone are concentric bands representing decreasing concentrations (Figure 4). This pattern suggests a strong, localised source of Fe contamination, potentially influenced by geogenic factors such as the weathering of Fe-rich lithologies, including lateritic soils or ferruginous sandstones, or by anthropogenic activities, including agricultural runoff, open dumping, or leaching from corroded pipelines (Ghosh and Guchhait, 2020). In the Post-M season, the overall spatial pattern remains similar, with the hotspot persisting in the same northwestern region. However, there is a slight shift and possible intensification of the high-concentration zones, possibly due to monsoonal recharge processes that mobilise Fe from soil and rock matrices into the aquifers. The persistence of Fe concentrations above 4,000 μg/L even after the monsoon underscores the severity and stability of the contamination source. Additionally, the lack of significant dilution after the rainy season suggests that natural attenuation is limited in this region.
Cd values significantly exceed the World Health Organisation (WHO) permissible limit for Cd in drinking water, which is 3 μg/L, highlighting an alarming level of contamination in several areas. In the Pre-M period, the central and southern parts of the district predominantly fall within the 25 μg/L range, with a few isolated pockets registering at 10 μg/L, indicating relatively moderate contamination. However, the northwestern part of Mirzapur exhibits very high Cd concentrations, with values reaching up to 125 μg/L, surrounded by areas with concentrations of 75 μg/L and 50 μg/L (Figure 4). This hotspot suggests anthropogenic sources, such as industrial discharges, the use of phosphate fertilisers, and improper waste disposal, along with the weathering of metal-rich rocks. During the Post-M season, there is a noticeable change in the spatial pattern. While the northwestern hotspot remains clearly visible and persists with high Cd concentrations (>125 μg/L), large parts of the district exhibit a dilution effect, especially in the eastern and southern regions, where many zones now fall within the 10 μg/L category (blue) (Figure 4). This seasonal decline in Cd concentration is likely due to monsoonal recharge, which introduces fresh water into the aquifers, diluting metal concentrations. However, the persistence of extreme Cd levels in the northwestern zone even after the monsoon suggests long-term contamination with low attenuation capacity and/or ongoing input from active pollution sources. Overall, Cd contamination is a significant concern for groundwater quality in Mirzapur, with some areas exceeding safe limits by more than 40 times. Given Cd′s high toxicity, non-biodegradability, and its potential to cause kidney damage, skeletal disorders, and carcinogenic effects, urgent remedial measures are needed. Sanad et al. (2024) reported relatively lower Cd values in the Gharb Plain of Morocco, ranging from 0.8 to 4.20 μg/L. A review on Cd in soils and groundwater notes that background concentrations in groundwater are typically less than 1 μg/L. However, in a study in Pakistan, mean Cd concentrations of 10 μg/L were found to originate from sulfide-bearing sedimentary rocks (Naseem et al., 2014). A study on groundwater contamination in an industrial area of West Uttar Pradesh, India, reported a mean Cd concentration of 60 μg/L, which is higher than the WHO permissible limit of 3 μg/L (Mishra et al., 2019; Mishra et al., 2018).
In the Pre-M, the majority of the district indicates As concentrations around 20 μg/L. However, the northeastern region shows a particularly intense hotspot with concentrations rising to 100 μg/L, flanked by areas of 80 μg/L and 60 μg/L. Additionally, smaller pockets of moderate As levels (40–60 μg/L) are found in the central and southwestern parts of the district (Figure 4). This pattern suggests a geogenic origin of As, likely due to natural dissolution of As-bearing minerals in alluvial or sedimentary aquifers, possibly intensified by overexploitation of groundwater (Jha and Tripathi, 2021). The predominant arsenic-bearing minerals potentially responsible for groundwater enrichment include arsenopyrite (FeAsS), realgar (As₄S₄), orpiment (As₂S₃), and arsenic-substituted pyrite (FeS₂As). Under reducing conditions prevailing in the grey to dark silty alluvium of the floodplain, reductive dissolution of Fe-oxyhydroxides such as goethite and ferrihydrite, which often adsorb or co-precipitate As, may release arsenic into groundwater. In oxidising microenvironments or near recharge zones, secondary minerals such as scorodite (FeAsO₄·2H₂O) and beudantite (PbFe₃(AsO₄)(SO₄)(OH)₆)] may form, stabilising As temporarily in solid phases (Kanel et al., 2023). Thus, both primary sulfide minerals and secondary Fe-oxyhydroxide-associated As phases likely govern the observed high and moderate arsenic levels in Mirzapur groundwater. In the Post-M season, while a general dilution effect is observed in some parts of the district, the northeastern hotspot remains persistent, still registering concentrations around 100 μg/L, indicating that the contamination in this area is chronic and sustained. The As distribution in the rest of the district appears to show slight reductions, particularly in the central and southern parts, due to aquifer recharge from monsoonal rainfall, which dilutes contaminant levels. However, these levels still far exceed the safe threshold, underscoring the severity of As contamination. The persistence of high As levels even after the monsoon implies that either the source of contamination is active year-round, or that As is strongly mobilised under certain redox conditions in the aquifer system. Chronic exposure to elevated As poses serious public health risks, including skin lesions, cardiovascular diseases, neurological disorders, and increased cancer risk, particularly skin and bladder cancers. Sanad et al. (2024) reported As concentrations in the range of 0.13 to 11.02 μg/L in groundwater of the Gharb Plain in Morocco. Another study in Pakistan, along the Kabul River, found As concentrations ranging from 10.00 to 15.20 μg/L, with some samples exceeding the WHO standard of 10 μg/L (Ghani et al., 2022). A study on groundwater contamination in parts of India found that As concentrations in some samples were as high as 4,100 μg/L (Shakoor et al., 2016).
According to the Bureau of Indian Standards (BIS) and the World Health Organisation (WHO), the acceptable limit for Pb in drinking water is 10 μg/L. The findings reflect Pb values ranging from below detection limit (BDL) to 2.36 in the Pre-M season and from BDL to 1.98 in the Post-M season, indicating low contamination of the metal. The Post-M season reflects a notable reduction in Pb concentrations. The Central Groundwater Board (2022) found similar Pb concentrations in Mirzapur, with levels ranging from 0 to 2 μg/L. Sanad et al. (2024) reported high Pb values in the Gharb Plain of Morocco, ranging from 1.03 to 15.25 μg/L. A study on groundwater samples found Pb concentrations in the range of 10–400 μg/L (Ghani et al., 2022). In Bangladesh, a review of groundwater quality highlighted Pb contamination, with concentrations in various districts ranging from 0.6 to 70 μg/L (Islam and Mostafa, 2024). Chronic Pb exposure is associated with neurological impairment, developmental delays in children, kidney dysfunction, and cardiovascular issues, making it a critical contaminant to monitor.
Zn, while an essential trace element for human health, becomes toxic at elevated levels. The BIS permissible limit for Zn in drinking water is 500 μg/L; values beyond this threshold indicate potential contamination. In the Pre-M season, Zn contamination is widespread and severe. A major portion of the district, particularly the western and central regions, falls within the red zone (>1,000 μg/L), indicating excessive Zn concentrations that exceed acceptable drinking water standards. The surrounding areas are mostly in the 1,000 μg/L and 500 μg/L categories, suggesting a large spatial footprint of elevated Zn levels. Only a few scattered pockets in the eastern and southern parts show relatively lower. The Pre-M scenario may reflect the accumulation of Zn due to reduced dilution, possible contributions from industrial discharge, the use of Zn-rich fertilisers, geogenic sources, or the corrosion of galvanised pipes. In contrast, the Post-M map shows a marked reduction in Zn concentrations across the district. The intense red and orange zones have largely disappeared, with only a small, isolated red hotspot remaining in the northwestern part, which may indicate localised, persistent contamination sources unaffected by seasonal flushing. This seasonal difference highlights the crucial role that natural hydrological cycles play in regulating metal concentrations in groundwater systems. The data suggest that Pre-M conditions are more vulnerable to Zn accumulation, likely due to stagnant aquifer conditions and anthropogenic pressures, whereas Post-M dilution tends to improve water quality significantly. Sanad et al. (2024) reported similar Zn values in the Gharb Plain of Morocco, ranging from 1057.50 to 4525.40 μg/L.
Cr, a heavy metal with toxicological significance, is monitored due to its potential health impacts, particularly hexavalent Cr (Cr6+), which is known to be carcinogenic. In the Pre-M season, most of the district shows very low Cr concentrations with values below LOQ. The entire region is largely covered in blue, indicating levels below 0.05 μg/L, which is well within the safe drinking water limits as per WHO and BIS standards. The Post-M season, however, reveals a notable increase in Cr concentration and spread. Several zones, particularly in the central to northeastern part of Mirzapur, have transitioned into orange (0.30 μg/L) and red zones (>0.30 μg/L), indicating significantly elevated Cr levels that may pose serious health risks if used for drinking (Figure 4). These red hotspots suggest the mobilisation of Cr during the monsoon recharge, potentially due to leaching from soils and sediments, weathering of ultramafic rocks, or diffuse contamination from industrial or agricultural sources. Sanad et al. (2024) reported lower Cr values in the Gharb Plain of Morocco, ranging from 10.3 to 62 μg/L. Chronic exposure to elevated Cr concentrations can cause kidney and liver damage, skin lesions, and increased cancer risk, making it imperative to investigate both natural and anthropogenic origins of Cr and enforce remedial actions in Mirzapur.
4.3 Statistical analysis
4.3.1 Correlation
The correlation analysis results for this study are presented in Figure 5. During the Pre-M season, As and Zn exhibit a strong positive correlation (r = 0.57), suggesting that these metals may originate from common sources or are mobilised under similar geochemical conditions, such as reductive dissolution of metal-bearing minerals or release from industrial/agricultural inputs. Conversely, a pronounced negative correlation (r = −0.70) is observed between Cd and Pb, which may reflect differences in their geochemical behaviour, competitive adsorption onto mineral surfaces, or the presence of distinct anthropogenic inputs. Similarly, the strong positive correlation between Pb and Chromium (Cr) (r = 0.55) indicates either shared sources, such as industrial effluents, or comparable transport mechanisms in groundwater.
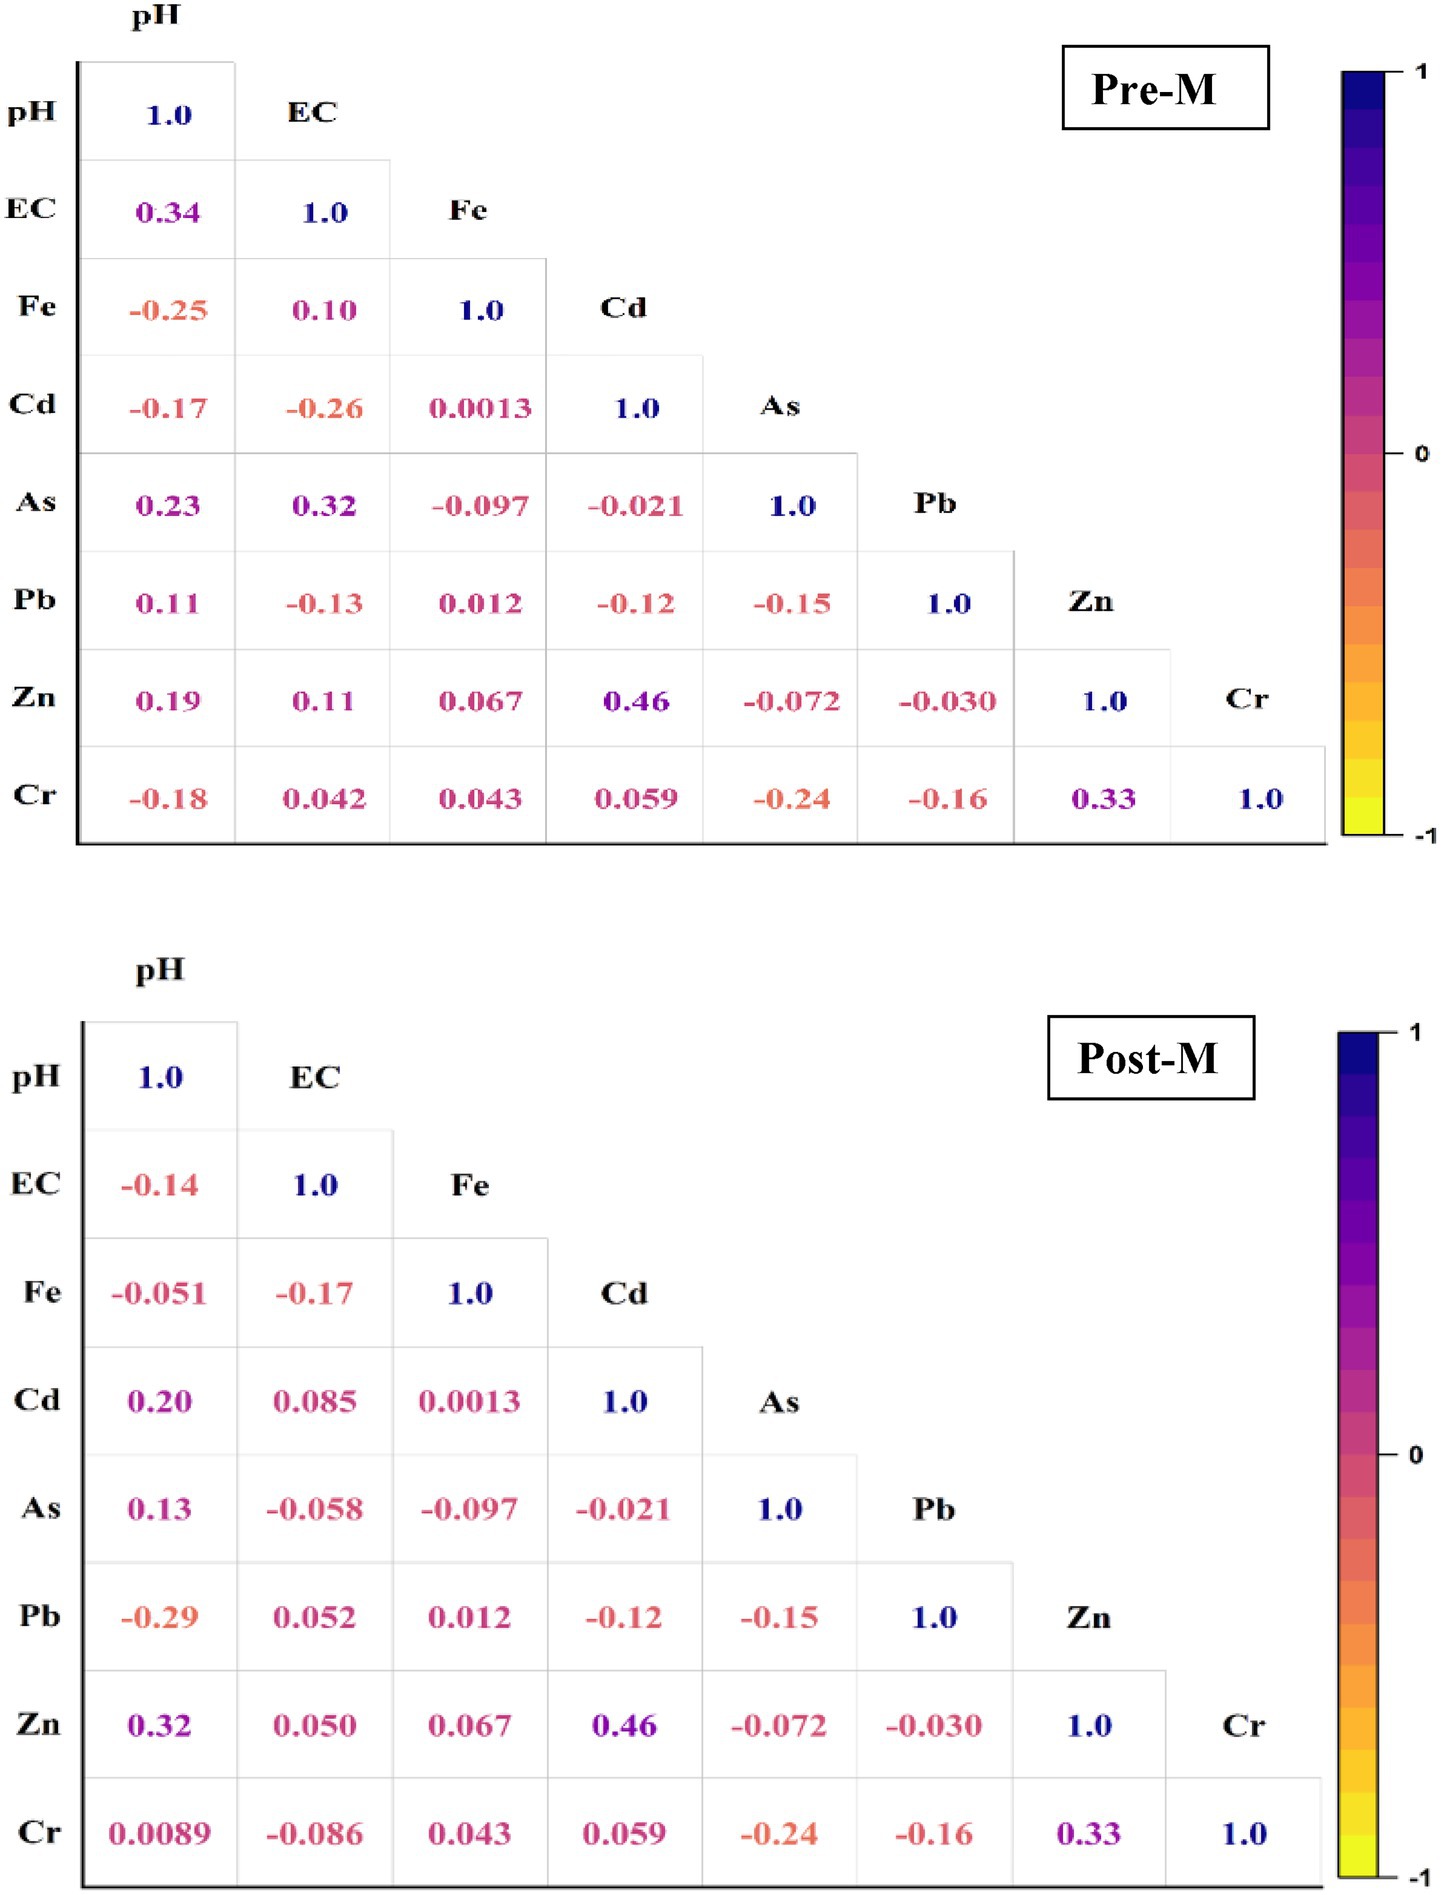
Figure 5. Correlation analysis among physicochemical parameters and heavy metals in Mirzapur.
In contrast, the Post-M season displays marked shifts in inter-element relationships, likely reflecting the influence of monsoonal recharge, dilution effects, and changes in redox and pH conditions. For instance, the strong positive association between As and Zn in the Pre-M season becomes a weak negative one (r = −0.066) post-monsoon, possibly due to enhanced flushing of Zn from surface and agricultural sources during recharge, while for As, the redox-driven desorption processes may govern mobility. Likewise, the weakening of the negative Cd–Pb correlation (from r = −0.70 to r = −0.12) may indicate partial homogenisation of sources and altered competitive interactions at adsorption sites under recharge conditions. The reversal of the Pb–Cr relationship from a strong positive (r = 0.55) to a weak negative correlation (r = −0.16) could be attributed to differences in solubility and speciation, where Cr mobility is favoured under oxidising conditions, while carbonate equilibria more strongly control Pb. Additionally, the emergence of moderate correlations between pH and metals such as As (r = 0.26), Cd (r = 0.20), Pb (r = −0.29), and Zn (r = 0.32) in the Post-M season emphasises the role of acid–base conditions in governing metal solubility and adsorption–desorption dynamics. Overall, these seasonal variations underscore the significance of hydrogeochemical processes, such as monsoonal flushing, redox transformations, and pH-mediated reactions, in influencing the relationships between metals in groundwater (Domingos et al., 2015).
4.3.2 One-way ANOVA
To investigate the extent of seasonal variability in water quality parameters at Mirzapur, a one-way analysis of variance (ANOVA) was conducted (Table 2). The statistical interpretation was based on a direct comparison of the calculated F-values for each parameter with the critical F-value (Fcrit = 4.043) at a 5% level of significance. Parameters with F-values exceeding this threshold were considered to exhibit significant seasonal variation.
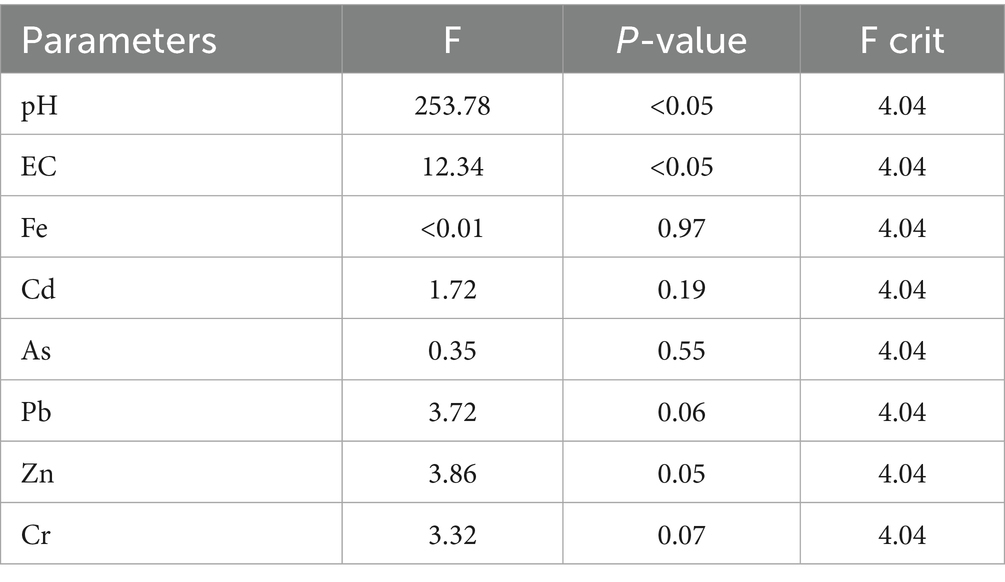
Table 2. One-way ANOVA analysis showing significant seasonal variation in physicochemical parameters and heavy metals in Mirzapur district.
The results revealed that only two parameters, pH and electrical conductivity (EC), demonstrated statistically significant seasonal variability. The F-value for pH was exceptionally high (F = 253.780), far exceeding the critical value. This indicates a strong seasonal influence, likely due to changes in temperature, rainfall, and biological activity that affect the water’s acid–base balance. Similarly, EC showed a substantial F-value of 12.348, which is well above the F-critical value. This suggests that seasonal fluctuations significantly affect the concentration of dissolved ions, possibly due to runoff, dilution effects, and agricultural practices.
In contrast, the F-values for several heavy metals, including iron (Fe = 0.001), cadmium (Cd = 1.725), and arsenic (As = 0.353), were all considerably below the F-critical value. These results indicate a lack of statistically significant seasonal variation in the concentrations of these elements. Such stability might be attributed to the geogenic origin of these metals or consistent anthropogenic input throughout the year. Three other metals, lead (Pb = 3.723), zinc (Zn = 3.866), and chromium (Cr = 3.328), presented F-values that approached the critical threshold but were still below the cutoff. The mean concentration of these metals was relatively higher in the pre-monsoon season (Table 2). The ANOVA results indicate that among all parameters tested, only pH and EC exhibit significant seasonal variability, as their F-values surpass the critical threshold. The remaining parameters, including heavy metals, appear to remain relatively stable across seasons, with minor or statistically insignificant variations. These findings underscore the importance of continuous monitoring, particularly of physicochemical parameters, which are more responsive to seasonal dynamics in the aquatic environment.
4.3.3 Cluster analysis
The dendrogram shown in Figure 6 represents a hierarchical cluster analysis (HCA) of groundwater quality parameters during the Pre-M season. This statistical approach groups variables based on their similarity or correlation, with the horizontal axis indicating the linkage distance, a measure of dissimilarity between clusters. Variables that cluster at lower distances are more similar in behaviour, whereas those clustering at higher distances are less related. In the Pre-M season dendrogram, the first notable cluster forms between Zn and Cd, indicating a strong association and possibly similar geogenic or anthropogenic sources, such as industrial effluents or agricultural runoff. This cluster further joins with Cr, suggesting a secondary linkage and similar behaviour in the groundwater system. Fe appears as a distinct variable that joins the cluster containing Cr, Zn, and Cd at a higher distance, indicating moderate association. Another significant cluster includes pH, EC and As, which shows a close relationship likely due to the influence of geochemical processes, such as mineral dissolution or redox reactions, that affect As mobility. This group merges with F and Pb, hinting at a shared hydrogeochemical pathway or common contamination source. The formation of clusters at different distances highlights the varying degrees of association among parameters.
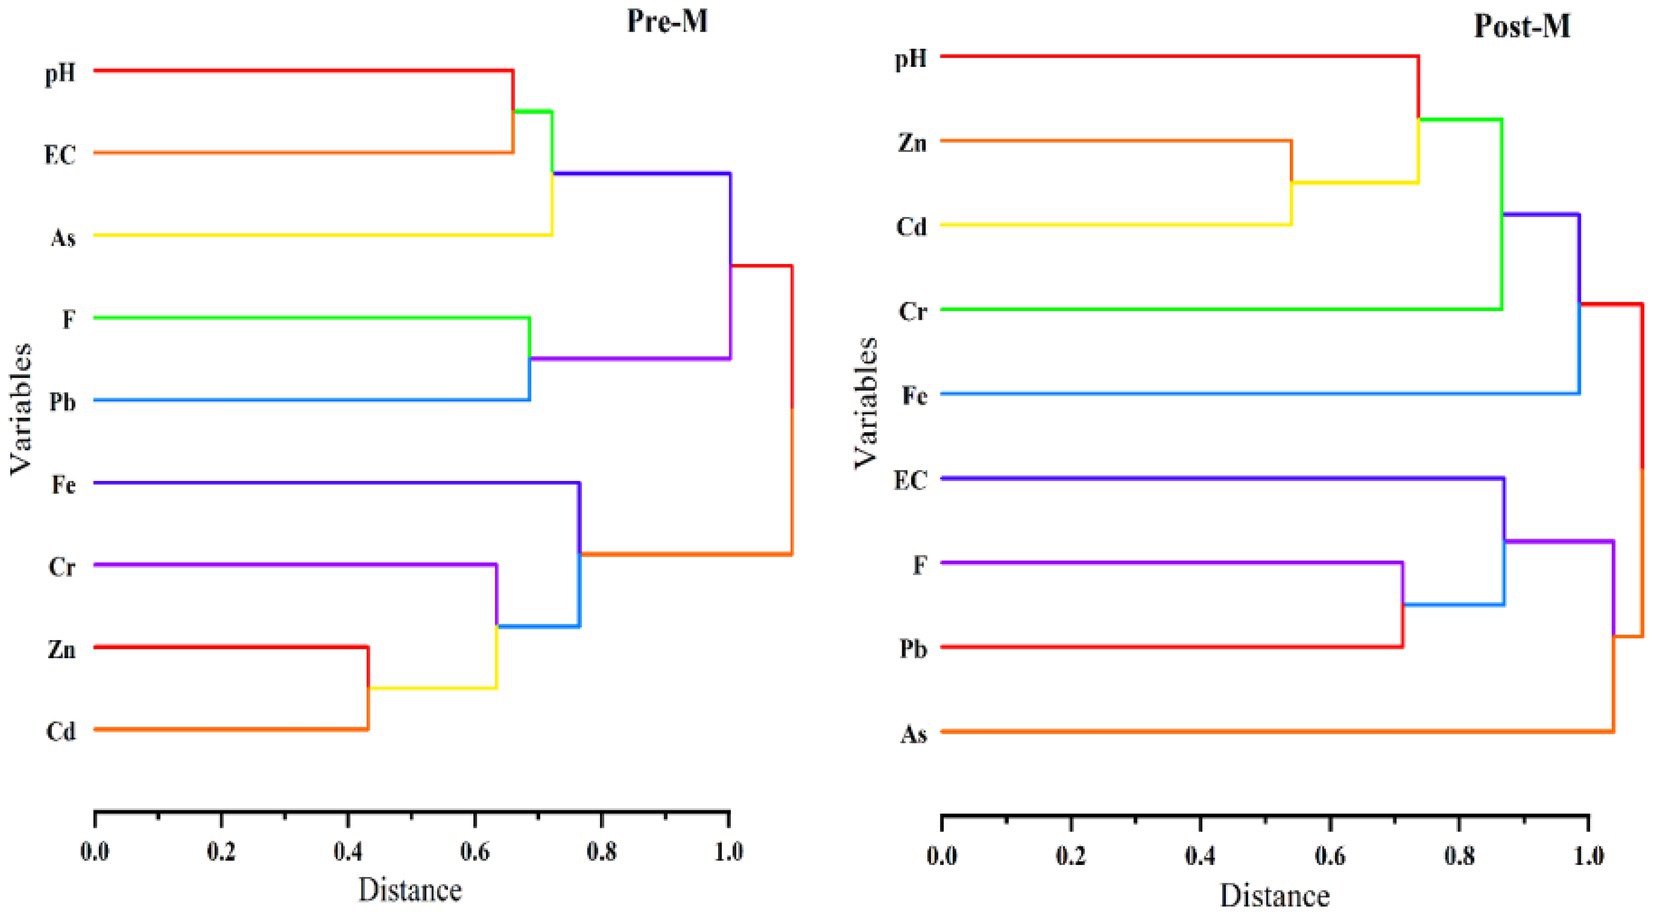
Figure 6. Cluster analysis of physicochemical parameters and heavy metals in Mirzapur.
In the Post-M season, Zn and Cd form a close cluster, reflecting a strong similarity likely due to common sources such as industrial discharge or leaching from galvanised materials and phosphate fertilisers. This cluster merges with pH, suggesting that acidity or alkalinity may influence the mobilisation of these metals in the aquifer environment. This cluster further links with Cr, indicating moderate similarity in behaviour, possibly due to similar redox conditions influencing their presence in groundwater. Fe joins this group at a higher linkage distance, indicating a weaker association but still suggesting some level of hydrochemical connection, potentially from natural weathering or anthropogenic input. A separate cluster includes F, Pb, and EC, indicating that fluoride and Pb levels may be influenced by the ionic strength and conductivity of the water, which is often related to dissolved salts and anthropogenic contamination. Finally, As appears as an outlier, clustering only at a high distance, implying its behaviour is distinct from that of other parameters, likely governed by specific geochemical conditions such as reductive dissolution of Fe oxides or adsorption–desorption dynamics. This dendrogram illustrates the shifting relationships among groundwater constituents between seasons, suggesting the influence of monsoonal recharge, dilution effects, and changes in geochemical equilibrium, all of which are crucial for understanding contaminant behaviour and informing groundwater management strategies.
4.4 Metal pollution indices
4.4.1 Heavy metal pollution index (HPI)
The spatial distribution pattern of HPI is presented in Figure 7 for Pre-M and Post-M seasons in Mirzapur. The HPI serves as an aggregate indicator of heavy metal contamination in water, integrating the concentration of multiple toxic metals into a single pollution index. This metric is widely used to assess ecological health and water quality, particularly in regions affected by anthropogenic activities such as industrial and urban discharges, as well as agricultural inputs. The spatial variation across sites shows that site M1 exhibits alarmingly high HPI values in both seasons (Pre-M ~ 2,900, Post-M ~ 2,500), suggesting it is a hotspot of heavy metal contamination. Such elevated levels may be linked to industrial, agricultural, and domestic discharges that mix with the groundwater.
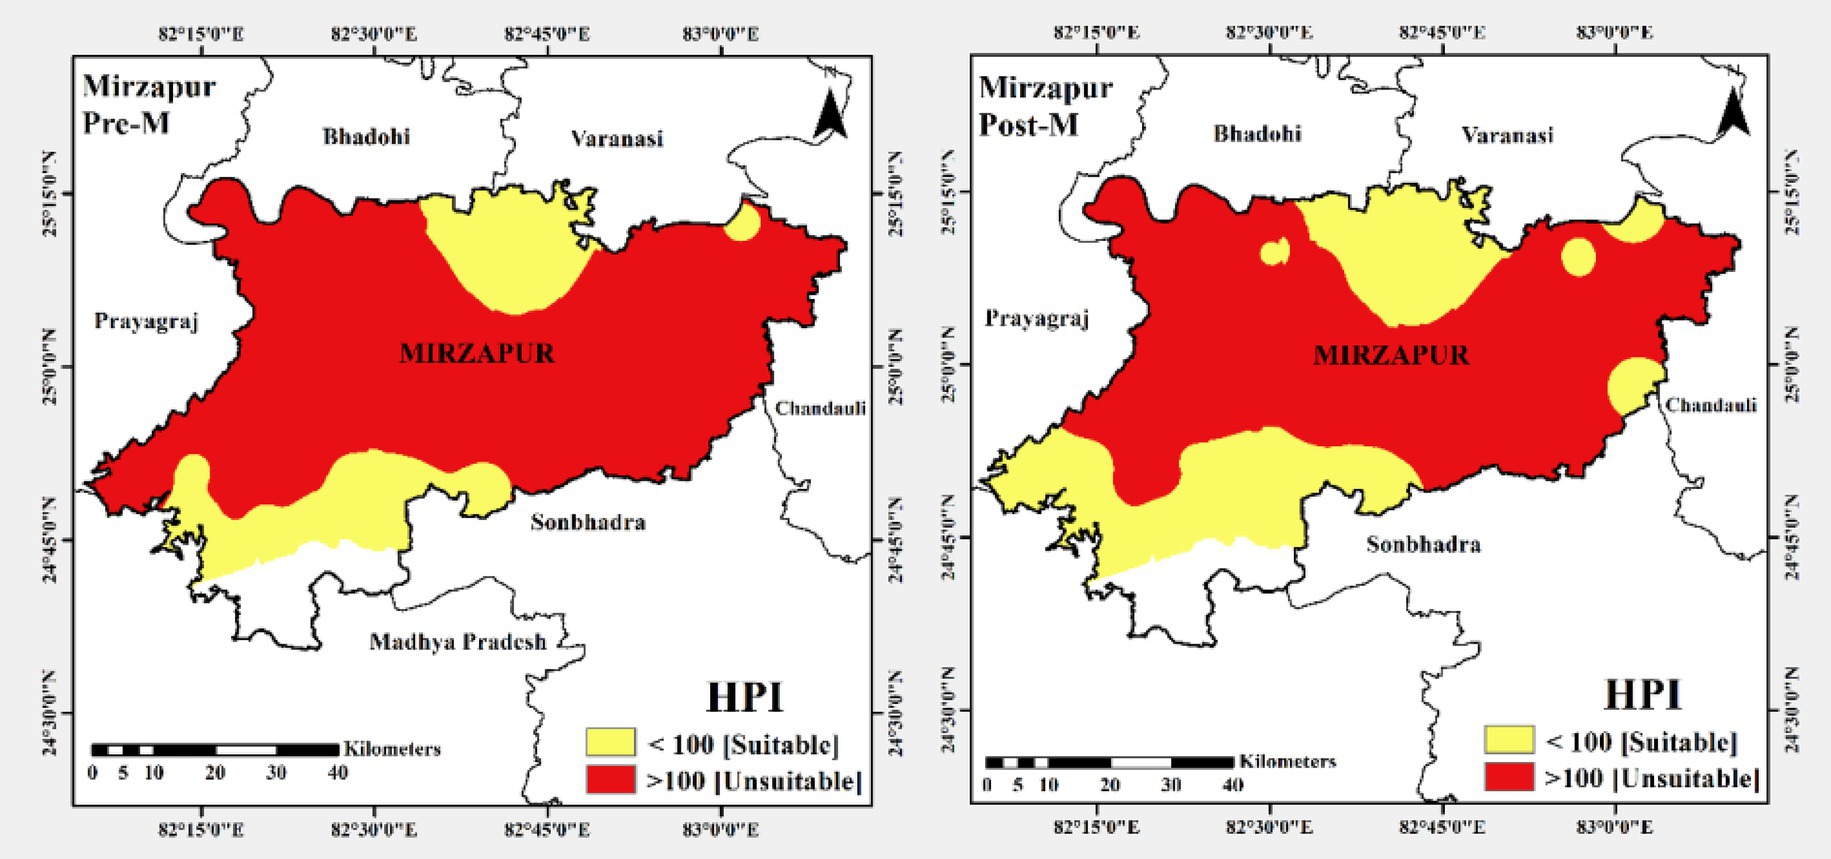
Figure 7. Spatial distribution pattern of the heavy metal pollution index (HPI) in Mirzapur district.
In contrast, many other sites, particularly M6, M7, M17, and M18, exhibit very low HPI values, indicating minimal anthropogenic influence. A distinct seasonal trend is also evident in the data. At most sites, Pre-M HPI values are higher than Post-M values. This seasonal pattern is consistent with known hydrological and climatic mechanisms in monsoon-influenced regions. During the Pre-M period, high temperatures and low rainfall lead to reduced flow, concentrating dissolved heavy metals.
Following the onset of the monsoon, the Post-M season typically shows a reduction in HPI values due to the dilution effect of heavy rainfall. However, some sites (e.g., M9, M13, M14, M24) show comparable or even slightly elevated Post-M values. In such cases, while rainfall initially dilutes pollutants, it may also transport metals into the groundwater during the interaction between surface water and groundwater. The moderate HPI values across sites M8 to M16 suggest transitional zones, likely semi-urban or peri-urban regions, where the pollution burden is neither extreme nor negligible. The fluctuation in seasonal values at these sites highlights the role of land-use patterns, soil characteristics, and hydrological connectivity in influencing seasonal heavy metal dynamics.
In conclusion, the map reveals a clear interaction between seasonal hydrology and spatial land use in determining heavy metal pollution levels in aquatic environments. The Pre-M season promotes accumulation and concentration of metals, while the Post-M season generally facilitates partial dilution and redistribution. These findings underscore the need for seasonally adaptive monitoring programs and site-specific pollution control strategies. Effective management would require targeting critical hotspots, such as M1, for remediation and maintaining surveillance in transitional and low-impact areas to prevent degradation over time. Dheeraj et al. (2024) reported that approximately 97% of the samples had low to medium HPI values in the coalfield region of India. Srivastava et al. (2025) reported low contamination of heavy metals in Singrauli, Madhya Pradesh, India, with HPI values below 100. Kamali Maskooni et al. (2020) reported that 16% of the samples fell into the unacceptable category for drinking, whereas around 5–52% of the samples were in the excellent to very good category in Iran.
4.4.2 Heavy metal evaluation index (HEI)
The spatial distribution pattern presents the Heavy Metal Evaluation Index (HEI) values recorded at 25 distinct sampling locations (M1 to M25) during the Pre-M and Post-M seasons, as shown in Figure 8. The HEI is a widely recognised indicator used to assess the cumulative impact of multiple heavy metals in aquatic systems, especially in relation to their permissible limits. Unlike the Heavy Metal Pollution Index (HPI), which reflects overall pollution trends, HEI focuses on evaluating potential health risks based on metal concentrations relative to safe thresholds, offering a more targeted risk-based perspective. A clear spatial variation is observed in the HEI values across different sites. Among all locations, M1 exhibits the highest HEI in both seasons (Pre-M ~ 47; Post-M ~ 47), indicating critical contamination levels and severe exceedance of acceptable limits. The high value of HEI suggests the presence of intense point-source pollution, likely from industrial discharges, untreated sewage, or mining activities. Site M2 also records high HEI values, albeit significantly lower than those of Site M1, followed by a gradual decline from Sites M3 to M7. These sites may be located near industrial corridors, urban catchments, or areas with substantial anthropogenic activity, which contributes to elevated heavy metal loads.
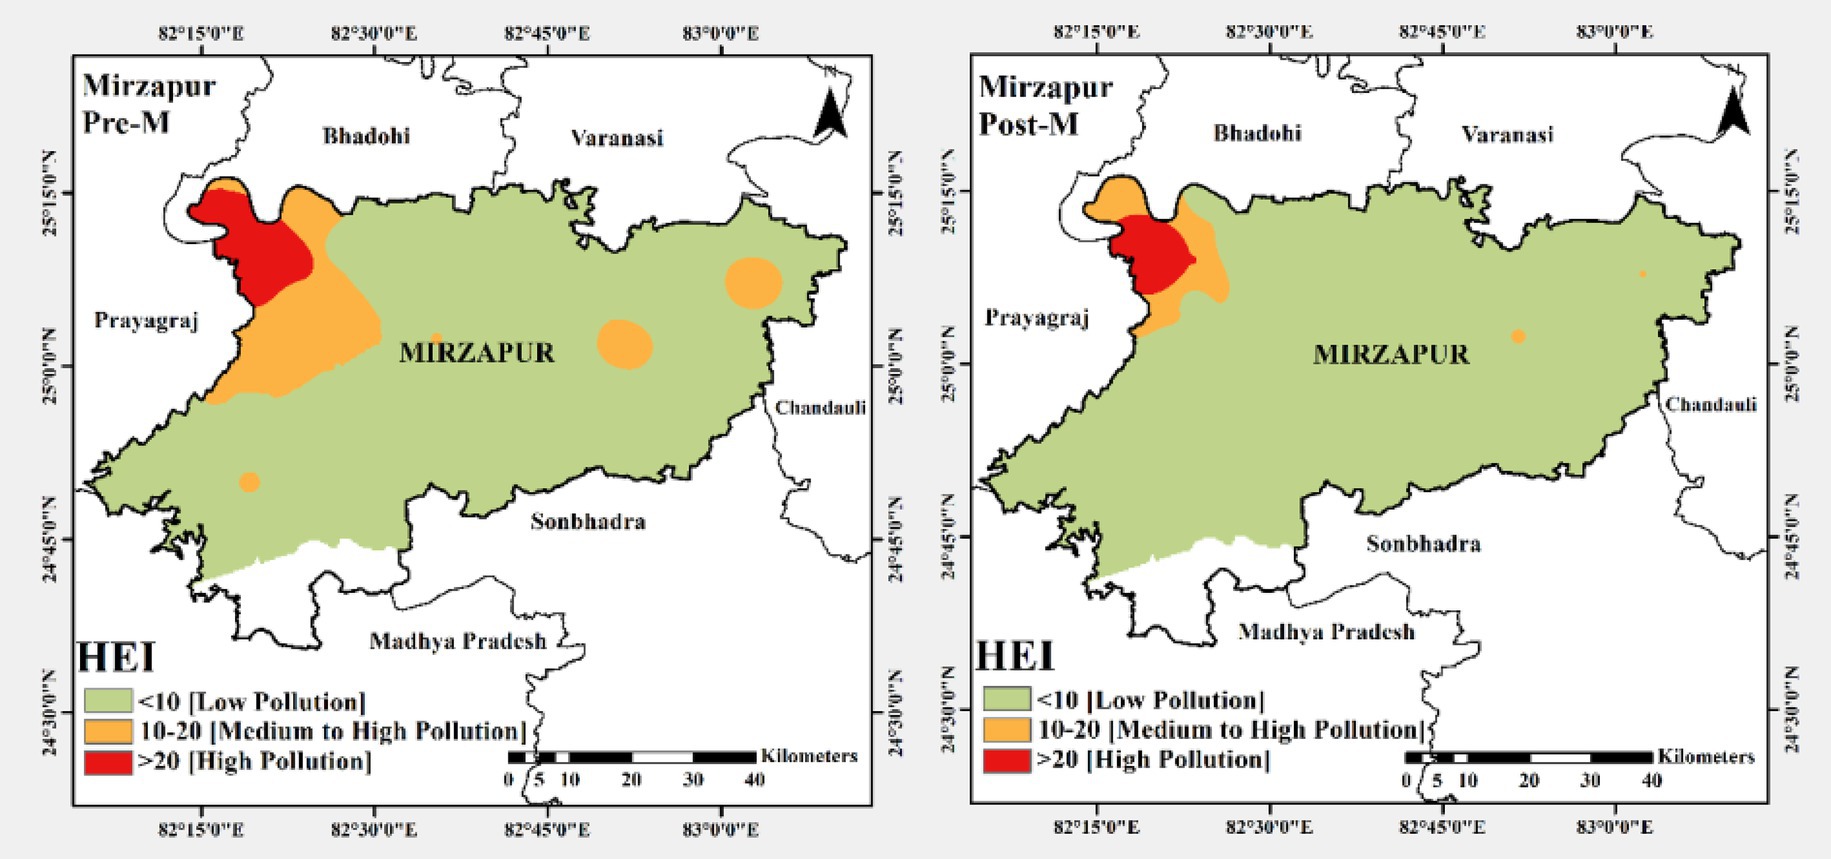
Figure 8. Spatial distribution pattern of the heavy metal evaluation index (HEI) in Mirzapur district.
Throughout the map, Pre-M values consistently exceed Post-M values at most sites. This trend aligns with typical hydrological behaviour observed in monsoon-affected regions. During the Pre-M period, the absence of rainfall, coupled with elevated temperatures, leads to the concentration of pollutants. Additionally, discharge from agricultural fields and industrial zones can intensify metal accumulation. In contrast, the Post-M season typically sees dilution of metal concentrations due to increased water volumes from monsoonal rains, leading to lower HEI values at many sites. However, some anomalies are evident. For example, in M19, the Post-M HEI value is higher than the Pre-M value, indicating possible remobilisation of metals from contaminated zones. Similarly, sites like M13, M14, and M25 exhibit only marginal reductions in HEI between seasons, indicating the presence of persistent contamination sources that are less affected by seasonal hydrology (Figure 8). These locations may be near sites of chronic pollution, such as landfills, effluent discharge zones, or areas with minimal dilution due to poor water exchange.
Sites M6 to M7 and M16 to M18 show very low HEI values, often approaching or falling below the threshold of concern (Figure 8). These may represent relatively unimpacted areas with low industrial or urban influence. The pre-M season poses higher ecological and health risks due to concentration effects. However, site-specific pollution sources appear to play an equally important role, as some locations remain highly impacted. This underscores the need for continuous, site-specific monitoring and the implementation of targeted remediation efforts at critical hotspots such as M1 and M2. Understanding both the spatial and seasonal patterns of HEI is crucial for developing sustainable water management strategies, particularly in monsoon-dominated regions where pollutant fluxes are significantly influenced by rainfall cycles. Maliqi et al. (2020) reported HEI values in the range of 9.03 to 39.33 in southeastern Europe. Their finding suggested that all samples had low levels of pollution in the study region.
4.4.3 Nemerow index (NI)
The spatial distribution pattern (Figure 9) illustrates the Nemerow Index (NI) values across 25 sampling sites (M1 to M25) for Pre-M and Post-M seasons in Mirzapur. The Nemerow Index is a comprehensive pollution assessment metric that incorporates both the average and maximum concentration of multiple heavy metals to provide a more conservative estimate of pollution severity. It is particularly effective in identifying pollution hotspots where even a single metal exceeds safe limits by a substantial margin. This figure provides insights into the spatial distribution of heavy metal contamination and the influence of seasonal hydrological changes. From the figure, it is evident that Site M1 has the highest NI value in both Pre-M and Post-M seasons, with values reaching approximately 34 and 30, respectively. This indicates a high level of contamination likely due to concentrated anthropogenic activities such as industrial discharge, agricultural activities, or untreated sewage. M2 also displays significantly elevated NI values, reinforcing the likelihood of upstream or direct pollution inputs in this area. These sites, consistently ranking high regardless of season, highlight persistent pollution sources that are not substantially diluted or mitigated by monsoonal rainfall.
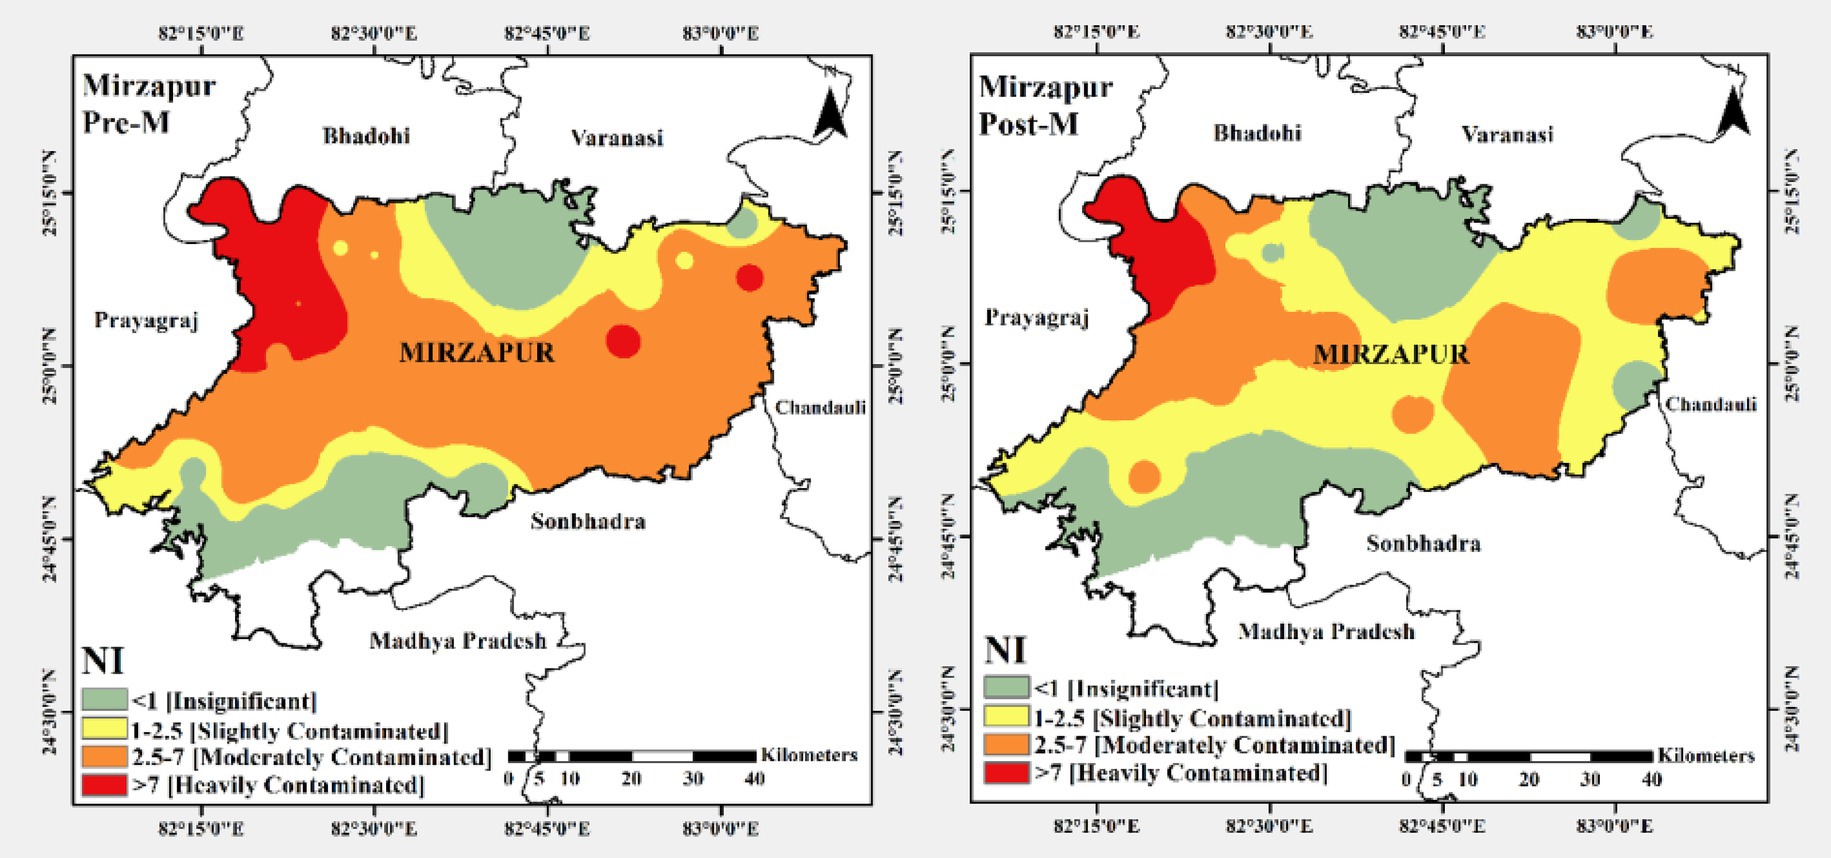
Figure 9. Spatial distribution pattern of the nemerow index (NI) in Mirzapur district.
Across most sites, the Pre-M NI values are higher than the Post-M values, demonstrating a seasonal trend that aligns with the known hydrological behaviour in monsoon-influenced regions. During the Pre-M period, the absence of rainfall, coupled with elevated temperatures, contributes to the concentration of pollutants in aquatic environments. In contrast, the Post-M season, which follows heavy rainfall and flooding, tends to dilute metal concentrations due to increased flow and water volume, resulting in lower NI readings at most sites. However, this seasonal pattern is not uniform. Certain sites, such as M19, M20, and M21, exhibit relatively small differences or even slightly higher Post-M NI values. This may be attributed to post-monsoonal runoff, where metals are mobilised into the groundwater.
Sites M6 to M7 and M16 to M18 demonstrate consistently low NI values in both seasons. These could serve as reference or baseline sites in water quality assessments, supporting the identification of natural background levels of heavy metals. The pattern observed from M8 to M15 and M22 to M25 reflects moderate pollution levels, with clear seasonal fluctuations. These areas might represent transitional zones between heavily polluted and relatively clean regions, possibly influenced by mixed land uses including agriculture, small-scale industries, and semi-urban development. The differences between Pre- and Post-M seasons in these areas suggest that seasonal hydrodynamics significantly affect pollutant dispersion and accumulation.
In summary, the Nemerow Index data reveal clear spatial and seasonal variations in heavy metal pollution across the study area. The Pre-M season generally exhibits higher contamination due to increased pollutant concentration and reduced flow. At the same time, the Post-M period shows signs of dilution, although some sites continue to reflect high pollution risks. The persistence of high NI values at specific locations, particularly M1 and M2, emphasises the importance of targeted pollution control strategies and the need for seasonally adaptive monitoring programs. Incorporating such indices into water quality management frameworks will help identify critical zones requiring remediation and guide sustainable environmental planning in monsoon-affected regions. A study by Abed et al. (2022) reported that 58% of the wells were seriously polluted, 33% heavily polluted, and 9% moderately polluted by trace elements in Iraq.
4.5 Ecological risk index (ERI)
Figure 10 illustrates the Environmental Risk Index (ERI) across Mirzapur district during the Pre-M and Post-M seasons. The ERI values are categorised into four distinct classes based on risk severity: Low Risk (<110), Moderate Risk (110–200), Considerable Risk (200–400), and Very High Risk (>400). During the Pre-M season, a substantial portion of the district, particularly the central, southern, and eastern regions, falls within the Considerable Risk category (ERI = 200–400). This spatial concentration of higher ERI values suggests heightened environmental stress, likely driven by factors such as water scarcity, increased surface temperatures, declining vegetation cover, and soil degradation typical of dry Pre-M conditions. The Moderate Risk zone (ERI = 110–200) occupies a transitional band around the high-risk core, extending across the north-central and northeastern zones. Meanwhile, low-risk areas (ERI < 110) are relatively sparse and scattered, primarily located in the southwestern corner and in small pockets of the central and northern regions. Notably, an area in the northwestern part of Mirzapur, bordering Prayagraj, is classified under Very High Risk (ERI > 400). This indicates extreme environmental vulnerability, possibly due to a combination of anthropogenic pressures (e.g., industrial activity or urban sprawl), severe land degradation, and minimal natural vegetation cover.
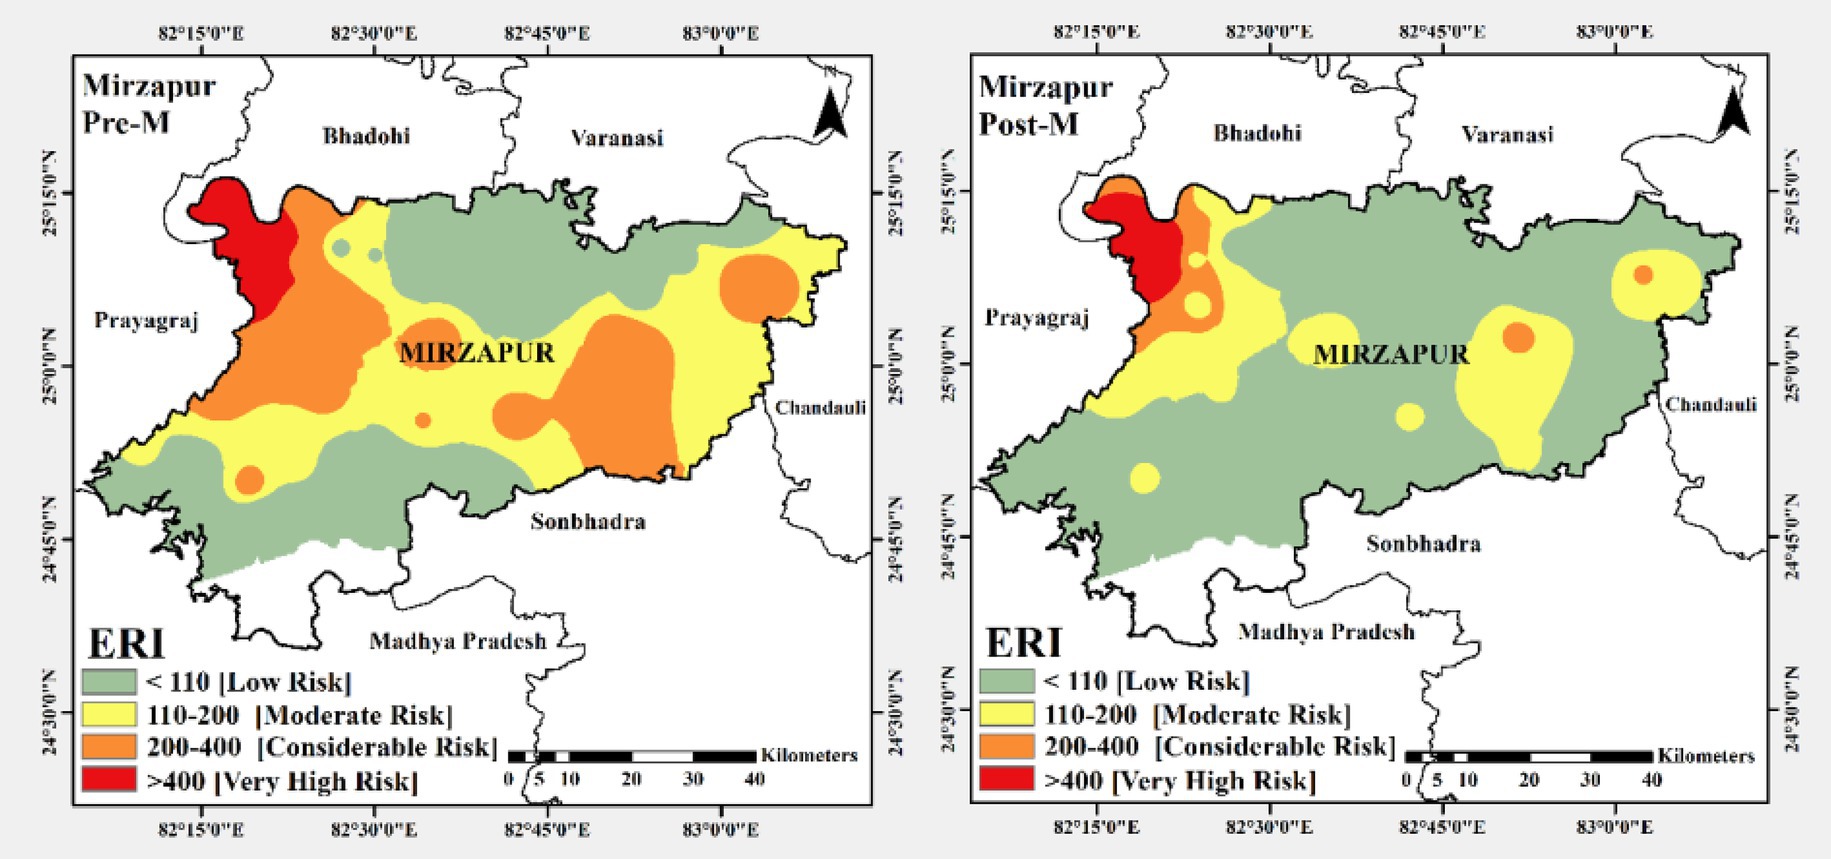
Figure 10. Spatial distribution pattern of the ecological risk index (ERI) in Mirzapur district.
The Post-M season reflects a substantial decline in ERI values across the district, indicating an overall improvement in environmental conditions. Following the monsoon rainfall, much of the district transitions into Low Risk (ERI < 110) and Moderate Risk (ERI = 110–200) categories, suggesting enhanced soil moisture, groundwater recharge, and vegetative regrowth. The Low Risk zone dominates large sections of the southern, southwestern, and central parts of Mirzapur, representing a marked spatial improvement compared to the Pre-M period. The Moderate Risk regions were mostly confined to north-central and eastern zones, with a noticeable reduction in both extent and intensity. Importantly, the Considerable Risk category (ERI = 200–400) has almost disappeared, except for isolated patches, particularly near the eastern border with Chandauli district. However, the northwestern area adjacent to Prayagraj remains under Very High Risk (>400), showing minimal change between seasons. This persistent hotspot indicates structural or chronic stressors that are not significantly mitigated by seasonal precipitation—possibly due to ongoing deforestation, poor land-use practices, or urban encroachment.
4.6 Health risk assessment
4.6.1 Chronic daily intake (CDI)
Ingestion is the primary pathway for heavy metal uptake from groundwater, as humans regularly consume this water for drinking and cooking purposes. While dermal and inhalation pathways exist, they are less common and typically less significant. The skin acts as a robust barrier against absorption, and inhaling aerosolised heavy metals from groundwater is an uncommon exposure route. Consequently, the high volume of daily water intake via ingestion leads to a much greater cumulative dose; that is why we have used the ingestion pathway for calculating CDI.
The result obtained from the evaluation of Chronic Daily Intake (CDI) is presented in Table 3. For iron (Fe), the RfD is 0.0070 mg/kg/day. The CDI values for adults are slightly above the RfD (0.0088 in Pre-M and 0.0085 in Post-M), while children exhibit markedly higher values (0.0198 in Pre-M and 0.0192 in Post-M), nearly three times the safe limit. This indicates that both adults and children are vulnerable to Fe overexposure, with children at greater risk due to their higher water consumption relative to body weight. Although Fe is an essential micronutrient required for haemoglobin synthesis and cellular respiration, its inclusion in health risk assessment is justified in this study because the measured concentrations substantially exceed recommended dietary intakes and approach thresholds associated with haemochromatosis and other iron overload disorders. Excessive Fe exposure has been linked to gastrointestinal distress, hepatic dysfunction, oxidative stress, and long-term tissue damage. The lack of significant seasonal variability further suggests a persistent geogenic contribution from aquifer lithology, with possible reinforcement from anthropogenic inputs. Thus, even though regulatory guidelines often exclude essential elements like Fe from noncarcinogenic risk calculations, the unusually high concentrations observed in this study warrant their consideration to capture the true health burden of groundwater contamination.
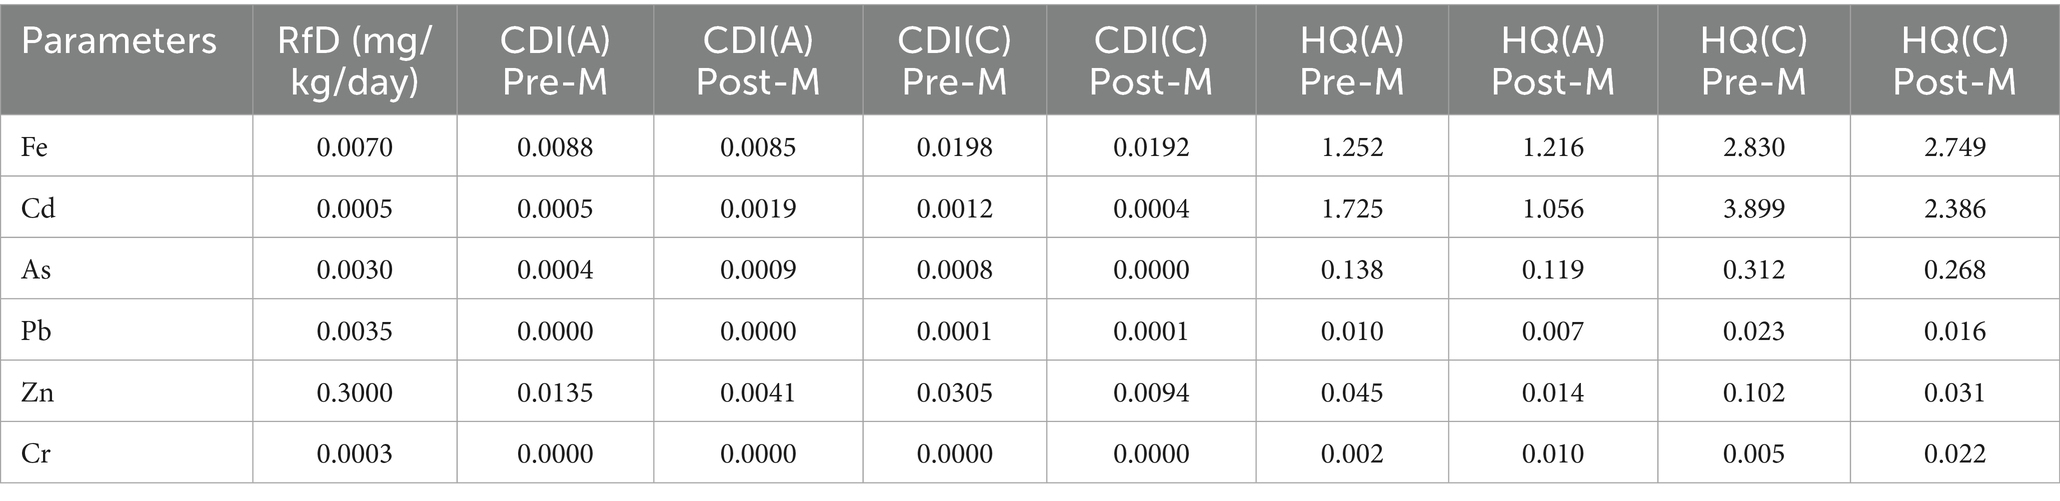
Table 3. CDI, RfD, and HQ values as obtained in Mirzapur district.
Cd, with an RfD of 0.0005 mg/kg/day, demonstrates serious health concerns. For adults, the CDI during pre-monsoon conditions is exactly at the threshold (0.0005), but for children, the CDI values are far higher: 0.0019 (Pre-M) and 0.0012 (Post-M). These exceedances are approximately four times and twice as high as the safe limit, respectively. Even the Post-M dilution does not lower Cd exposure to safe levels in children. Chronic Cd intake is associated with renal impairment, skeletal deformities, hypertension, and carcinogenic outcomes. The higher Pre-M CDI values may reflect seasonal concentration effects due to reduced recharge and dilution. In the case of As, the RfD is 0.0030 mg/kg/day, and CDI values are well below the threshold: 0.0004 (Pre-M) and 0.0009 (Post-M) for adults, and 0.0008 (Pre-M) and negligible (0.0000 Post-M) for children. While these values suggest minimal noncarcinogenic risks, As is a well-established Group I human carcinogen, and no exposure level can be considered completely safe. Chronic low-level exposure contributes to skin lesions, vascular diseases, and cancers of the skin, lung, and bladder. The reduction in children’s exposure during the Post-M highlights the diluting effect of seasonal recharge.
Pb shows negligible CDI values in adults (0.0000 in both seasons) and only trace levels in children (0.0001 in both Pre-M and Post-M), well below the RfD of 0.0035 mg/kg/day. However, Pb is a neurotoxin with no safe threshold, particularly for children, where even trace exposure is linked to developmental neurotoxicity, learning disabilities, and reduced IQ. Although the current data indicate low Pb-related risks, continuous monitoring remains essential given its cumulative nature and severe health consequences. For Zn, the RfD is relatively high at 0.3000 mg/kg/day, and the CDI values are significantly lower, both for adults (0.0135 Pre-M; 0.0041 Post-M) and children (0.0305 Pre-M; 0.0094 Post-M). These values indicate that Zn exposure is well within safe limits and does not pose a health risk. As Zn is an essential micronutrient required for enzymatic function, immune regulation, and growth, its presence in permissible concentrations is beneficial. High Zn uptake may lead to abdominal pain, nausea, diarrhoea, and copper deficiency (Plum et al., 2010). The observed decrease in Post-M CDI values reflects seasonal dilution processes in groundwater.
For Cr, with an RfD of 0.0003 mg/kg/day, the CDI values are negligible (0.0000 for both adults and children across seasons). The low CDI values suggest no immediate noncarcinogenic health risks from Cr exposure in the study area. Cr(III) is an essential nutrient at trace levels; Cr(VI) is highly toxic and carcinogenic. The absence of detectable CDI values suggests limited contamination, but given the hazardous nature of Cr(VI), even minor future increases could have significant health implications. Overall, the results reveal that Fe and Cd are the most critical contaminants, as their CDI values exceed the RfD, especially in children, indicating significant noncarcinogenic risks. As and Pb, although present below their respective RfDs, remain toxicologically significant due to their carcinogenic and neurotoxic properties. Zn levels are safe and nutritionally beneficial, while Cr appears negligible in the present context. Seasonal variation suggests that post-monsoon dilution reduces exposure levels for most metals; however, the reduction is insufficient to mitigate the risks associated with Fe and Cd. These findings underscore the importance of continuous groundwater quality monitoring, risk-based water management strategies, and the development of targeted intervention programs to protect vulnerable populations, particularly children, from long-term exposure to heavy metals.
4.6.2 Noncarcinogenic risk
4.6.2.1 Hazard quotient (HQ)
Table 3 presents the Hazard Quotient (HQ) values of selected heavy metals (Fe, Cd, As, Pb, Zn, Cr) for adults and children during Pre-M and Post-M seasons. HQ is a widely used noncarcinogenic risk assessment parameter that compares the Chronic Daily Intake (CDI) of a contaminant to its corresponding Reference Dose (RfD). An HQ value greater than 1 indicates potential noncarcinogenic health risks, whereas values below 1 suggest negligible risk. The results demonstrate significant variability across metals, population groups, and seasons.
For Fe, the HQ values for adults are 1.252 (Pre-M) and 1.216 (Post-M), both of which exceed the threshold of 1. For children, the HQ values are even higher (2.830 Pre-M; 2.749 Post-M), underscoring their greater vulnerability. Although Fe is an essential nutrient, chronic exposure beyond physiological limits can cause oxidative stress, liver damage, and gastrointestinal disorders. The consistently elevated HQ values for Fe in both seasons highlight its role as a persistent contaminant of concern in the groundwater system, particularly for children. Cd poses an even greater threat, with HQ values far exceeding 1. In adults, HQ is 1.725 (Pre-M) and 1.056 (Post-M), both indicating potential health risks, although the risk decreases slightly in the post-monsoon season due to dilution effects. For children, the HQ values are alarmingly high (3.899 Pre-M; 2.386 Post-M), suggesting severe noncarcinogenic risks. Cd exposure is strongly associated with renal dysfunction, skeletal deformities, and chronic toxicity, and the present findings confirm that Cd is one of the most hazardous contaminants in the study area.
For As, HQ values remain below 1 across both seasons and age groups (0.138–0.312). This suggests that the noncarcinogenic risks associated with As exposure are within acceptable limits. However, arsenic’s carcinogenic potential cannot be overlooked, as chronic exposure, even at levels yielding HQ < 1, can contribute to increased cancer risk. Seasonal differences indicate slightly higher HQ values during Pre-M, likely due to reduced groundwater dilution. Pb exhibits very low HQ values for both adults (0.010 Pre-M; 0.007 Post-M) and children (0.023 Pre-M; 0.016 Post-M), all of which are well below 1. Although these values suggest negligible noncarcinogenic risk, Pb is a neurotoxin with no safe exposure threshold, particularly for children. Even trace levels can cause irreversible neurological and developmental damage, implying that Pb exposure, despite its low HQ values, should not be disregarded. For Zn, HQ values are also low (0.045–0.102 across all groups), reflecting safe exposure levels relative to the RfD. Since Zn is an essential micronutrient, these concentrations are not only non-hazardous but may also be beneficial for physiological functions such as enzymatic activity, immune defence, and growth. Seasonal variations indicate a reduction in HQ values during the Post-M period, likely due to groundwater dilution. Cr exhibits very low HQ values in both adults (0.002 Pre-M; 0.010 Post-M) and children (0.005 Pre-M; 0.022 Post-M), all of which are below the threshold of 1, indicating negligible noncarcinogenic risks. However, the toxicological significance of Cr lies in its speciation. While Cr(III) is an essential nutrient at trace levels, Cr(VI) is highly toxic and carcinogenic. The observed HQ values suggest that Cr does not currently pose a significant noncarcinogenic risk, although its potential carcinogenic risks cannot be entirely ruled out.
Overall, the HQ analysis reveals that Fe and Cd are the most critical contaminants, with HQ values exceeding 1, particularly in children, indicating significant health risks. As, Pb, Zn and Cr show HQ values below the critical threshold, indicating limited noncarcinogenic risk in the present context. However, the carcinogenic potential of As and Cr, and the neurotoxic nature of Pb, emphasise the need for cautious interpretation. Seasonal trends indicate that post-recharge generally reduces exposure levels, although risks from Fe and Cd persist above safe limits.
4.6.2.2 Carcinogenic risk (CR)
The box plots for carcinogenic risk (CR) in adults and children (Figure 11) depict the seasonal and age-dependent variations in cancer risk associated with selected heavy metals like Cd, As, Pb, and Cr in groundwater during the Pre-M and Post-M periods. The CR values are compared against the USEPA acceptable risk threshold of 1 × 10⁻⁶ (negligible risk) to 1 × 10⁻⁴ (tolerable risk range), beyond which carcinogenic risks are considered unacceptable. For adults, the CR values show that As contributes the highest carcinogenic risk, with both Pre-M and Post-M values falling within the range of 10−4 to 10−3, thus exceeding the acceptable threshold. The high CR values indicate a significant long-term cancer risk associated with As ingestion, consistent with its classification as a Group 1 carcinogen. Seasonal variation is evident, with pre-monsoon values slightly higher, likely due to reduced dilution and concentration effects during dry months. Cd also exhibits elevated CR values in adults, around 10−4, which exceeds the tolerable limit, highlighting its role as another major contributor to carcinogenic risk. In contrast, Pb and Cr exhibit negligible CR values, remaining below 10−5, indicating minimal cancer-related risks under current exposure levels.
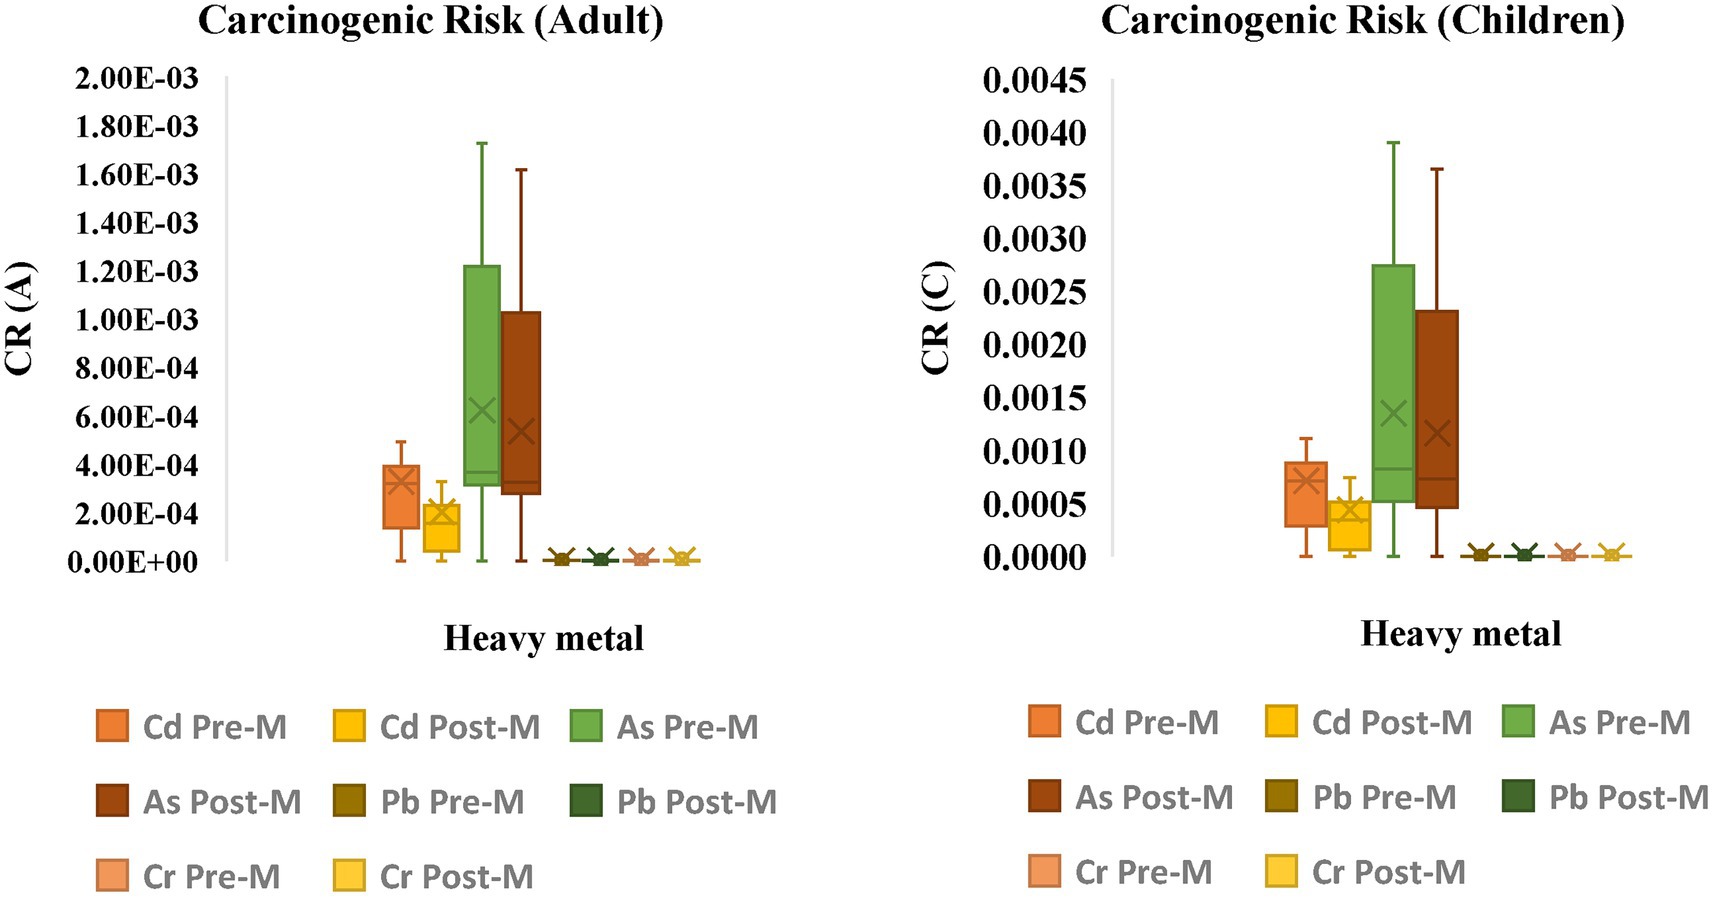
Figure 11. Graph showing cancer risk (CR) for adults and children in Mirzapur district.
In the case of children, the CR values are consistently higher than those observed in adults, reflecting their greater susceptibility due to higher intake-to-body-weight ratios. As again poses the most severe risk, with CR values reaching nearly 4 × 10⁻³ during the Pre-M season, far exceeding the acceptable risk threshold. The Post-M season shows slightly lower values, but the risk remains well above the permissible limit. Similarly, Cd exhibits CR values in the range of 10−4 to 10−3, with Pre-M exposures being more critical. The elevated CR values for both As and Cd in children emphasise their disproportionate vulnerability to groundwater contamination.
On the other hand, Pb and Cr remain far below the risk threshold, indicating negligible contributions to carcinogenicity. The seasonal patterns observed in both adults and children indicate that Pre-M conditions intensify the carcinogenic risks, most likely due to groundwater concentration effects resulting from reduced recharge and dilution. Conversely, Post-M recharge reduces contaminant concentrations, thereby lowering CR values, although not enough to bring them within safe levels for As and Cd. Overall, the CR analysis confirms that As and Cd are the primary carcinogenic threats in the study area, with risks that significantly exceed the permissible limits set by international standards. The risks are more severe for children than adults, highlighting the urgent need for remedial interventions and safe drinking water alternatives. Pb and Cr, while present, contribute minimally to carcinogenic risks.
A study by Alidadi et al. (2019) in Northeast Iran (Mashhad) evaluating exposure to As and heavy metals via both ingestion and dermal contact, the study found the TCR averaged 7.38 × 10⁻⁵ for adults and 1.33 × 10⁻⁴ for children, values that hover near or exceed the US EPA safety threshold of 1 × 10⁻⁴, indicating borderline to significant carcinogenic concern. Another study by Zhang et al. (2019) in Shaanxi Province, China (Jinghui irrigation district), reported that the carcinogenic risk from As exposure via groundwater reached 3.50 × 10⁻⁴ for adults, which was well above the accepted guideline limit of 1.00 × 10⁻⁴, affirming an elevated cancer risk primarily through ingestion. Baneh et al. (2024) assessed the heavy metals in rural areas of Kurdistan Province, Iran. Among assessed metals (Pb, As, Ni, Cd, Cr), the lowest individual carcinogenic risk was for Cd at 2.29 × 10⁻⁶, while Pb posed the highest at 7.3 × 10⁻³, far exceeding safety limits. Total combined carcinogenic risk ranged between 7.4 × 10⁻³ and 7.5 × 10⁻³, indicating extremely high risk levels. Aswal et al. (2023) assessed multiple heavy metals in Upper Garhwal Himalaya, India and observed that for As, ingestion-based carcinogenic risk (CRing) for adults ranged from 0.34 to 1.00 (i.e., 3.4 × 10⁻¹ to 1.0). For Cr, risks were 0.234 to 0.688. These magnitudes represent extraordinarily high risks.
4.7 Limitations of the study
The present study provides valuable insight into the spatial distribution of heavy metals and the associated health risks in the groundwater of Mirzapur district; however, there are certain limitations. The groundwater samples (n = 50) collected during two sampling events were relatively limited due to inaccessibility caused by rugged terrain, which may restrict the spatial representativeness of the findings. Despite these logistical challenges, an effort was made to ensure that all major land use categories were represented. The field blanks were not included during sampling, which could have helped assess potential contamination during the sample collection and transportation. However, the sampling bottles were properly sealed, and samples were acidified by using nitric acid, a standard procedure adopted to prevent any change in the heavy metal concentration during storage and transportation (Varma et al., 2025).
5 Conclusion and recommendation
The hydrogeochemical assessment of groundwater in Mirzapur district highlights critical environmental and public health concerns, with As and Cd emerging as the primary contaminants of concern. Spatial and seasonal analyses identified persistent contamination hotspots, driven by both geogenic sources (e.g., weathering of As and Cd-bearing minerals) and anthropogenic activities, including industrial discharges, agricultural runoff, and inadequate waste management. Metal pollution indices and pollution load assessments confirmed that a substantial proportion of groundwater samples exceeded permissible limits for both drinking and irrigation purposes. Health risk assessment further indicated alarming noncarcinogenic risks (Hazard Index > 1) and carcinogenic risks (TCR > 10–4), particularly in children, who are disproportionately affected due to their higher water intake-to-body mass ratio and physiological vulnerability. Seasonal variations suggest that while monsoonal recharge may slightly mitigate Cd levels, As remains persistently elevated, posing a long-term threat to groundwater safety.
Given these findings, urgent and coordinated interventions are required. In the short term, provision of safe drinking water alternatives, such as piped supply or community-managed treated water, alongside point-of-use treatment technologies (e.g., activated alumina filters, reverse osmosis units), should be prioritised in affected households. For long-term management, establishing a comprehensive groundwater monitoring network is essential to track contamination trends, supported by land-use controls that regulate industrial discharges and agrochemical applications in vulnerable zones. In-situ remediation approaches, including permeable reactive barriers and phytoremediation (e.g., Pteris vittata for As uptake), show promise in reducing heavy metal concentrations. Equally important are community awareness and education programs that empower local populations to adopt safer water practices and participate in remediation initiatives. Integrating these strategies within a broader Integrated Water Resources Management (IWRM) framework will be vital for ensuring the sustainable use of groundwater resources and safeguarding public health in the Mirzapur district.
Data availability statement
The original contributions presented in the study are included in the article/Supplementary material, further inquiries can be directed to the corresponding author.
Author contributions
PT: Conceptualization, Data curation, Formal analysis, Methodology, Writing – original draft, Writing – review & editing. KV: Formal analysis, Investigation, Methodology, Writing – review & editing. VS: Data curation, Formal analysis, Methodology, Writing – review & editing. ND: Data curation, Formal analysis, Methodology, Writing – review & editing. PJ: Conceptualization, Methodology, Supervision, Validation, Writing – original draft, Writing – review & editing.
Funding
The author(s) declare that no financial support was received for the research and/or publication of this article.
Acknowledgments
The authors thank the University Grants Commission (UGC) for providing fellowships to Piyush Tripathi and Vaishali Srivastava. The authors thank the Department of Science & Technology (DST) and the Indian Council of Cultural Relations (ICCR) for providing fellowships to Kriti Varma and Nkululeko Sabelo Dlamini. The authors also thank the NABL-accredited laboratory of Bharat Oil and Waste Management Ltd., Kanpur, for providing the AAS facility. The authors thank the University of Allahabad for providing the necessary facilities.
Conflict of interest
The authors declare that the research was conducted in the absence of any commercial or financial relationships that could be construed as a potential conflict of interest.
Generative AI statement
The author(s) declare that no Gen AI was used in the creation of this manuscript.
Any alternative text (alt text) provided alongside figures in this article has been generated by Frontiers with the support of artificial intelligence and reasonable efforts have been made to ensure accuracy, including review by the authors wherever possible. If you identify any issues, please contact us.
Publisher’s note
All claims expressed in this article are solely those of the authors and do not necessarily represent those of their affiliated organizations, or those of the publisher, the editors and the reviewers. Any product that may be evaluated in this article, or claim that may be made by its manufacturer, is not guaranteed or endorsed by the publisher.
Supplementary material
The Supplementary material for this article can be found online at: https://www.frontiersin.org/articles/10.3389/frwa.2025.1694963/full#supplementary-material
References
Abed, M. F., Zarraq, G. A., and Ahmed, S. H. (2022). Assessment of groundwater pollution using aqueous geo-environmental indices, Baiji Province, Salah Al-din, Iraq. Iraqi Geol. J., 94–104. doi: 10.46717/igj.55.1B.9Ms-2022-02-25
Ahmed, M. S., Bhuyan, P., Sarkar, S., and Hoque, R. R. (2022). Seven-year study of monsoonal rainwater chemistry over the mid-Brahmaputra plain, India: assessment of trends and source regions of soluble ions. Environ. Sci. Pollut. Res. 29, 25276–25295. doi: 10.1007/s11356-021-17385-7
Akhtar, N., Syakir Ishak, M. I., Bhawani, S. A., and Umar, K. (2021). Various natural and anthropogenic factors responsible for water quality degradation: a review. Water 13:2660. doi: 10.3390/w13192660
Akram, M. W., Rahman, F., Khan, D., and Ahmad, S. (2024). Assessment of groundwater quality for drinking purposes of Malda District, India: using WQI and GIS technique. World Water Policy 10, 796–820. doi: 10.1002/wwp2.12187
Alidadi, H., Tavakoly Sany, S. B., Zarif Garaati Oftadeh, B., Mohamad, T., Shamszade, H., and Fakhari, M. (2019). Health risk assessments of arsenic and toxic heavy metal exposure in drinking water in Northeast Iran. Environ. Health Prev. Med. 24:59. doi: 10.1186/s12199-019-0812-x
Ansari, A. A., Singh, I. B., and Tobschall, H. J. (2000). Importance of geomorphology and sedimentation processes for metal dispersion in sediments and soils of the ganga plain: identification of geochemical domains. Chem. Geol. 162, 245–266. doi: 10.1016/S0009-2541(99)00073-X
APHA (2017). Standard methods for examination of water and wastewater : American Public Health Association (APHA).
Aswal, R. S., Prasad, M., Patel, N. K., Srivastav, A. L., Egbueri, J. C., Kumar, G. A., et al. (2023). Occurrences, sources and health hazard estimation of potentially toxic elements in the groundwater of Garhwal Himalaya, India. Sci. Rep. 13:13069. doi: 10.1038/s41598-023-40266-7
Baneh, P. Y., Ahmadi, B., Salehzadeh, H., Mohammadi, H., Shahmoradi, B., and Ghaderi, B. (2024). Assessment of heavy metal contamination in groundwater of rural areas of Kurdistan Province Iran: a comprehensive study. Heliyon 10, 1–11. doi: 10.1016/j.heliyon.2024.e39833
Central Groundwater Board Aquifer mapping and ground water management plan Mirzapur district, Uttar Pradesh. Prayagraj: River Development and Ganga Rejuvenation Government of India. (2022).
Devi, N. L., and Yadav, I. C. (2018). Chemometric evaluation of heavy metal pollutions in Patna region of the Ganges alluvial plain, India: implication for source apportionment and health risk assessment. Environ. Geochem. Health 40, 2343–2358. doi: 10.1007/s10653-018-0101-4
Dheeraj, V. P., Singh, C. S., Sonkar, A. K., and Kishore, N. (2024). Heavy metal pollution indices estimation and principal component analysis to evaluate the groundwater quality for drinking purposes in coalfield region, India. Sustain. Water Resour. Manag. 10:31. doi: 10.1007/s40899-023-01013-y
Dinkar, G. K., Farooqui, S. A., Singh, V. K., Verma, A. K., and Prabhat, P. (2019). Geology of south and southwest part of Uttar Pradesh and its mineral significance. J. Geosci. Eng. Environ. Technol. 4, 51–59. doi: 10.25299/jgeet.2019.4.2-2.3554
Domingos, R. F., Gélabert, A., Carreira, S., Cordeiro, A., Sivry, Y., and Benedetti, M. F. (2015). Metals in the aquatic environment—interactions and implications for the speciation and bioavailability: a critical overview. Aquat. Geochem. 21, 231–257. doi: 10.1007/s10498-014-9251-x
Ghani, J., Ullah, Z., Nawab, J., Iqbal, J., Waqas, M., Ali, A., et al. (2022). Hydrogeochemical characterisation, and suitability assessment of drinking groundwater: application of geostatistical approach and geographic information system. Front. Environ. Sci. 10:874464. doi: 10.3389/fenvs.2022.874464
Ghosh, S., and Guchhait, S. K. (2020). Laterites of the Bengal Basin: Characterisation, geochronology and evolution. Basel, Switzerland: Springer.
Howladar, M. F., Hossain, M. N., Anju, K. A., and Das, D. (2021). Ecological and health risk assessment of trace metals in water collected from Haripur gas blowout area of Bangladesh. Sci. Rep. 11:15573. doi: 10.1038/s41598-021-94830-0
Islam, M. Z., and Mostafa, M. G. (2024). Iron, manganese, and lead contamination in groundwater of Bangladesh: a review. Water Pract. Technol. 19, 745–760. doi: 10.2166/wpt.2024.030
Jha, P. K., and Tripathi, P. (2021). Arsenic and fluoride contamination in groundwater: a review of global scenarios with special reference to India. Groundw. Sustain. Dev. 13:100576. doi: 10.1016/j.gsd.2021.100576
Kamali Maskooni, E., Naseri-Rad, M., Berndtsson, R., and Nakagawa, K. (2020). Use of heavy metal content and modified water quality index to assess groundwater quality in a semiarid area. Water 12:1115. doi: 10.3390/w12041115
Kanel, S. R., Das, T. K., Varma, R. S., Kurwadkar, S., Chakraborty, S., Joshi, T. P., et al. (2023). Arsenic contamination in groundwater: geochemical basis of treatment technologies. ACS Environ. 3, 135–152. doi: 10.1021/acsenvironau.2c00053
Maliqi, E., Jusufi, K., and Singh, S. K. (2020). Assessment and spatial mapping of groundwater quality parameters using metal pollution indices, graphical methods and geoinformatics. Anal. Chem. Lett. 10, 152–180. doi: 10.1080/22297928.2020.1764384
Michael, Z. A. (2020). Water quality assessment and impact of monsoon on the Holy River Ganges at Mirzapur and Varanasi districts of Uttar Pradesh (doctoral dissertation) : Department of Soil Science and Agricultural Chemistry Institute of Agricultural Sciences Banaras Hindu University Varanasi.
Mishra, S., Bharagava, R. N., More, N., Yadav, A., Zainith, S., Mani, S., et al. (2019). Heavy Metal Contamination: An Alarming Threat to Environment and Human Health. In Environmental Biotechnology: For Sustainable Future. eds. R. Sobti, N. Arora, and R. Kothari (Springer, Singapore). doi: 10.1007/978-981-10-7284-0_5
Mishra, S., Kumar, A., Yadav, S., and Singhal, M. K. (2018). Assessment of heavy metal contamination in water of Kali River using principle component and cluster analysis, India. Sustain. Water Resour. Manag. 4, 573–581. doi: 10.1007/s40899-017-0141-4
Mishra, A., Rai, A., Mishra, P. K., and Rai, S. C. (2023). Evaluation of hydro-chemistry in a phreatic aquifer in the Vindhyan region, India, using entropy weighted approach and geochemical modelling. Acta Geochim. 42, 648–672. doi: 10.1007/s11631-023-00610-0
Naseem, S., Hamza, S., Nawaz-ul-Huda, S., Bashir, E., and ul-Haq, Q. (2014). Geochemistry of cd in groundwater of winder, Balochistan and suspected health problems. Environ. Earth Sci. 71, 1683–1690. doi: 10.1007/s12665-013-2572-z
Ohiagu, F. O., Chikezie, P. C., Ahaneku, C. C., and Chikezie, C. M. (2022). Human exposure to heavy metals: toxicity mechanisms and health implications. Mat. Sci. Eng. Int. J. 6, 78–87. doi: 10.15406/mseij.2022.06.00183
Panda, D. K., Tiwari, V. M., and Rodell, M. (2022). Groundwater variability across India, under contrasting human and natural conditions. Earths Fut. 10:e2021EF002513. doi: 10.1029/2021EF002513
Panday, D. P., Kumari, A., and Kumar, M. (2025). Alkalinity-salinity-sustainability: decadal groundwater trends and its impact on agricultural water quality in the Indian peninsula. Sci. Total Environ. 978:179459. doi: 10.1016/j.scitotenv.2025.179459
Pandey, A., and Mishra, N. K. (2024). “Approach of Hydrogeomorphological mapping for groundwater resource Management in Mirzapur District, Uttar Pradesh” in Big data, artificial intelligence, and data analytics in climate change research: For sustainable development goals. eds. G. Tripathi, A. Shakya, S. Singh, S. K. Singh, and P. K. Rai (Singapore: Springer Nature Singapore), 269–290. doi: 10.1007/978-981-97-1685-2
Plum, L. M., Rink, L., and Haase, H. (2010). The essential toxin: impact of zinc on human health. Int. J. Environ. Res. Public Health 7, 1342–1365. doi: 10.3390/ijerph7041342
Rahman, F., Akram, M. W., and Khan, D. (2024). Evaluating monsoon season heavy metal contamination in groundwater of Uttar Dinajpur district using pollution indices and principal component analysis. Geomatica 76:100029. doi: 10.1016/j.geomat.2024.100029
Ravi, N. K., Jha, P. K., Varma, K., Tripathi, P., Gautam, S. K., Ram, K., et al. (2023). Application of water quality index (WQI) and statistical techniques to assess water quality for drinking, irrigation, and industrial purposes of the Ghaghara River, India. Total Environ. Res. Themes 6:100049. doi: 10.1016/j.totert.2023.100049
Sanad, H., Moussadek, R., Dakak, H., Zouahri, A., Oueld Lhaj, M., and Mouhir, L. (2024). Ecological and health risk assessment of heavy metals in groundwater within an agricultural ecosystem using GIS and multivariate statistical analysis (MSA): a case study of the Mnasra region, Gharb plain, Morocco. Water 16:2417. doi: 10.3390/w16172417
Shaikh, M., and Birajdar, F. (2024). Groundwater and ecosystems: understanding the critical interplay for sustainability and conservation. EPRA Int. J. Multidiscipl. Res. 10, 181–186. doi: 10.36713/epra16111
Shakoor, M. B., Niazi, N. K., Bibi, I., Murtaza, G., Kunhikrishnan, A., Seshadri, B., et al. (2016). Remediation of arsenic-contaminated water using agricultural wastes as biosorbents. Crit. Rev. Environ. Sci. Technol. 46, 467–499. doi: 10.1080/10643389.2015.1109910
Sharafi, S., and Salehi, F. (2025). Comprehensive assessment of heavy metal (HMs) contamination and associated health risks in agricultural soils and groundwater proximal to industrial sites. Sci. Rep. 15:7518. doi: 10.1038/s41598-025-91453-7
Sharma, L., Singh, S., Das, P., Gupta, P., Tiwary, N. K., and Oraon, S. (2025). Micro-level assessment of agricultural vulnerability to climate variability in Mirzapur district, Uttar Pradesh. Theor. Appl. Climatol. 156, 1–19. doi: 10.1007/s00704-025-05624-7
Singh, N., Chauhan, S., Singh, K., Saud, T., Saxena, M., Daya Soni, D., et al. (2010). Determination of arsenic and mercury metals in suspended particulate matter by flame/flameless atomic absorption spectrometer. Atmos. Pollut. Res. 1, 112–117. doi: 10.5094/APR.2010.014
Srivastava, V., Jha, P. K., and Kumar, A. (2025). Heavy metal pollution assessment of groundwater and associated health risks around the coal mining area, Singrauli, Madhya Pradesh, India. Environ. Monit. Assess. 197, 1–25. doi: 10.1007/s10661-025-14398-4
Tripathi, P., Kumar, M., Bhagat, C., and Jha, P. K. (2023). Assessment of hydrochemical shift in riverine aquifers of the mid-Gangetic plain of Uttar Pradesh, India. Groundw. Sustain. Dev. 22:100965. doi: 10.1016/j.gsd.2023.100965
Varma, K., Tripathi, P., Upadhyaya, S., Srivastava, A., Ravi, N. K., Singhal, A., et al. (2022). Assessment of mass bathing event (Kumbh-2019) impact on the river water quality by using multivariate analysis and water quality index (WQI) techniques at Sangam (Prayagraj), India. Groundw. Sustain. Dev. 17:100750. doi: 10.1016/j.gsd.2022.100750
Verma, A. (2025). “Ecology-social and solidarity economy model (ESSE) for sandstone Mining in Mirzapur, Uttar Pradesh” in The solidarity approach in geography: Cases from the Indian subcontinent (Cham: Springer Nature Switzerland), 541–554.
Varma, K., Saxena, A., Jha, P. K., Tripathi, P., and Kumar, M. (2025). Geogenic Weathering, Spatial/Seasonal Variability, and Nonpoint Pollution Govern the Aquatic Ionic Probability Exceedance and Associated Health Risks in the Ganga and Yamuna Rivers. ACS EST Water 5, 3129–3146. doi: 10.1021/acsestwater.5c00026
WHO, (2017). Guidelines for drinking-water quality, fourth edition incorporating the first addendum. Geneva: World Health Organization. Available online at: http://www.who.int/water_sanitation_health/water-quality/guidelines/en/
Wu, H., Wang, X., Ren, H., Gao, M., Cai, J., and Cheng, J. (2024). Groundwater heavy metal pollution characteristics and health risk assessment in typical industrial parks in Southwest China. Water 16:3435. doi: 10.3390/w16233435
Zhang, H., Lu, L., Liu, Y., and Liu, W. (2015). Spatial sampling strategies for the effect of interpolation accuracy. ISPRS Int. J. Geo Inf. 4, 2742–2768. doi: 10.3390/ijgi4042742
Keywords: heavy metal pollution index, ecological risk, hazard quotient, carcinogenic risk, Nemerow index
Citation: Tripathi P, Varma K, Srivastava V, Dlamini NS and Jha PK (2025) Heavy metal contamination and associated health risk assessment in groundwater of Mirzapur, Uttar Pradesh. Front. Water. 7:1694963. doi: 10.3389/frwa.2025.1694963
Edited by:
Saranga Diyabalanage, University of Sri Jayewardenepura, Sri LankaReviewed by:
Sushmitha Baskar, Indira Gandhi National Open University (IGNOU), IndiaDanish Khan, Aligarh Muslim University, India
Copyright © 2025 Tripathi, Varma, Srivastava, Dlamini and Jha. This is an open-access article distributed under the terms of the Creative Commons Attribution License (CC BY). The use, distribution or reproduction in other forums is permitted, provided the original author(s) and the copyright owner(s) are credited and that the original publication in this journal is cited, in accordance with accepted academic practice. No use, distribution or reproduction is permitted which does not comply with these terms.
*Correspondence: Pawan Kumar Jha, cGtqaGFAYWxsZHVuaXYuYWMuaW4=; ZmluZHBhd2FuQGdtYWlsLmNvbQ==