 Dimitra G. Georgopoulou
 Orestis Stavrakidis-Zachou1,2
 Nikos Papandroulakis
- 1Hellenic Center for Marine Research, AquaLabs, Institute of Marine Biology, Biotechnology and Aquaculture, Heraklion, Greece
- 2Department of Biology, University of Crete, Heraklion, Greece
Monitoring and understanding fish behavior is crucial for achieving precision in everyday husbandry practices (i.e. for optimizing farm performance), and for improving fish welfare in aquaculture. Various intelligent monitoring and control methods, using mathematical models, acoustic methods and computer vision, have been recently developed for this reason. Here, a tracking algorithm based on computer vision that extracts short trajectories of individual European seabass in both recirculating aquaculture systems and sea cages was developed using videos from network cameras. Using this methodology, parameters such as instantaneous normalized speed, travel direction and preference for the tank surface by European seabass could be quantified. When testing the sensitivity of this algorithm for detecting fish swimming variations under different husbandry scenarios, we found that the algorithm could detect variations in all of the abovementioned parameters and could potentially be a useful tool for monitoring the behavioral state of European seabass.
Introduction
Fish can display a wide spectrum of behavioral patterns that emerge from complex interactions with their conspecifics and their environment (Brown, 2015; Macaulay et al., 2021a). Understanding how and why these behaviors arise is important and could be useful in different fields. For example, the use of inherent behaviors and the encouragement of new behaviors through learning regimes could improve fisheries management and yield, improve conservation practices, facilitate husbandry, improve precision in aquaculture, i.e., improve monitoring, control, and the documentation of biological processes in fish farms (Føre et al., 2018; Antonucci and Costa, 2020), and positively impact fish welfare (Macaulay et al., 2021a).
In aquaculture, changes in behavior can result from different environmental or physiological conditions and these could be used as an indicator of fish welfare. For example, fish may respond to unfavorable conditions by adopting different swimming speeds and using different regions of a tank or cage (Stien et al., 2007; Trygonis et al., 2016; Alfonso et al., 2020; Schmidt and Schletterer, 2020). Anti-predatory behaviors are spotted frequently in open cage aquaculture systems (Smith, 2000), and antiparasitic behaviors occur over fine or broad spatiotemporal scales in many host-parasite systems (Behringer et al., 2018). Feeding processes in aquaculture could also impact behavioral patterns (Carr et al., 1996; Volkoff and Peter, 2006; Li et al., 2020a). For example, underfeeding could result in aggressive behaviors, and excess feeding results in behaviors related to unfavorable environments, particularly in closed systems, i.e., increased nitrogen or decreased oxygen levels (Magnuson, 1962; Benhaïm et al., 2012; Bergqvist and Gunnarsson, 2013; Li et al., 2020b). Other types of behavioral responses could be linked to husbandry practices, such as the presence/absence of people on the rearing sites (Sánchez-Suárez et al., 2020; Seibel et al., 2020). A set of easily observed measurements known as operational welfare indicators (OWIs) were recently adopted to monitor fish behavior and welfare in a non-destructive form (Noble et al., 2018), of which, swimming behavior is of particular importance for all aquaculture systems.
Serious attempts have been made to monitor fish swimming behavior in aquaculture using a wide range of technological equipment (Føre et al., 2011, 2017, 2018; Pautsina et al., 2015; Lindseth and Lobel, 2018; Li et al., 2020a; Schmidt and Schletterer, 2020; Macaulay et al., 2021b). Traditional and time-consuming ways include the use of personal experience and the visual assessment of fish from the surface or subsurface cameras to monitor how a sub-sample of the stock behave. Echosounders can provide information on the daily variations of the vertical fish distribution (Trygonis et al., 2016; Schmidt and Schletterer, 2020). Implanted or externally positioned individual tags (data storage tags, transmitter tags, etc.) can collect behavioral data such as the location of fish in three dimensions, swimming trajectory, acceleration, pressure or muscular activity, swimming depth, body temperature, and acceleration (Pittman et al., 2014; Føre et al., 2017; Macaulay et al., 2021b). Moreover, progress is being made in the development of automatic methodologies that collect and analyze data from a wide range of camera systems, e.g., single or stereo cameras that can exploit different spectra of light such as the visible or infrared (Joseph et al., 2017; Saberioon et al., 2017; An et al., 2021; Zhao et al., 2021). Intelligent monitoring and control methods using mathematical models and computer vision have been developed as a result (Killen et al., 2017; Føre et al., 2018; Zhou et al., 2018; Awalludin et al., 2020; An et al., 2021; Zhao et al., 2021).
Camera-based methodologies for aquatic monitoring have been drawing increasing attention as they enable a non-extractive and non-lethal approach to studying fish behavior (Papadakis et al., 2012; Liu et al., 2014; Wei et al., 2014; Pautsina et al., 2015; Zhou et al., 2017; Måløy et al., 2019; Pawar and Attar, 2019; Li et al., 2020a; An et al., 2021; Barreiros et al., 2021; Yang et al., 2021) and could be vital for the development of intelligent control methods or systems with efficient monitoring and decision-feedback tools. For example, infrared imaging has been used to track fish and study feeding behavior (Pautsina et al., 2015; Zhou et al., 2017). Stereo cameras have been used for fish detection (Torisawa et al., 2011) and individual tracking (Chuang et al., 2015). Single cameras on the visible spectrum have also been used to detect fish, classify behavior, and track fish in both recirculating aquaculture systems (RAS) and sea cages (see review of Li et al., 2020a). For example, Måløy et al. (2019) used submerged cameras in sea cage systems and convolutional neural networks to detect feeding activity in Atlantic salmon (Salmo salar). Qian et al. (2016) used a single camera system and computer vision techniques to track individual fish movement in tanks. A thorough presentation of methodologies can be found in the reviews of Zhou et al. (2018), An et al. (2021), and Yang et al. (2021). Although these methodologies are useful, they usually require specific technological equipment or are species-specific so they lack wide-range applicability.
Single-camera monitoring and movement analysis can be performed using global and local approaches (Zhou et al., 2018; Li et al., 2020a). The first includes methodologies that extract group-level behavioral features. For example, the use of optical flow analysis can provide information on swimming behavior by extracting group-level speeds and directions (Ye et al., 2016; Måløy et al., 2019). In addition, classification algorithms can use group level features, e.g., different spatial patterns that result from different swimming behaviors, to categorize the shoal into distinctive states. The second approach includes methodologies that are capable of explicitly identifying individual features (such as individual swimming speeds, heading directions, accelerations, etc.), and from them group-level behaviors can be inferred (Papadakis et al., 2012; Dell et al., 2014; Qian et al., 2014, 2016; Wang et al., 2017; Georgopoulou et al., 2021; Lopez-Marcano et al., 2021).
Individual-level movement analysis can be achieved following a three-step process (Li et al., 2020a; An et al., 2021; Zhao et al., 2021): the detection of the fish, the association of the positions of the detected fish between consecutive frames (fish tracking), and the extraction of swimming feature parameters such as speed, direction, etc. Fish detection is challenging because of the inconsistent illumination in the aquaculture systems, the low contrast between the fish and the background, the low signal-to-noise ratio, the image deformation that results from the scattering and absorption of different wavelengths of light due to particles in the water, the frequent occlusions, and the dynamic background of the aquatic environments (Spampinato et al., 2008). Challenges in the fish association step include the partial or total occlusion of the fish by other individuals, and the appearance and disappearance in the image of individuals (Zhou et al., 2018; An et al., 2021; Yang et al., 2021).
The aims of the current study were to: (a) develop automated routines that can track European seabass (Dicentrarchus labrax) (i.e., extract fish trajectories of a short time length) with individual-level approaches in RAS and sea cages using single cameras; (b) extract feature parameters that could be used for the detection of variations in swimming behavior; and (c) provide application examples of the developed methodology using different husbandry scenarios. Specifically, daily (morning and afternoon) variations in swimming speed are calculated and presented for both rearing systems. In addition, variations of the group direction in the sea cages, daily differences in the vertical distribution of the fish in tanks and, specifically, their presence close to the tank surface are also presented.
Methodology
Experimental Procedures
A. Recirculating Aquaculture System
The experimental fish were kept at the AquaLab facility of the HCMR, a certified laboratory for fish rearing (EL91-BIOexp-04) in accordance with legal regulations (EU Directive 2010/63) and after approval by the Ethics Committee of the IMBBC and the relevant veterinary authorities (Ref Number 255,344). A group of 50 E. seabass juveniles of ~200 g and total length L = 25.1 ± 0.94 cm was kept in a cylindroconical tank of 2 m3 volume and 1.5 m diameter at a thermoregulated marine RAS (see Figures 1A,B) under typical rearing conditions for the species (T = 24°C, pH = 8.0, salinity = 37 psu, and a 12 h L:12 h D photoperiod cycle). The group was monitored using network cameras (HIKVISION DS-2CD1623G0-IZS) capturing at 6 fps for a period of two months (May and June 2019), from 08:00 to 19:30. The cameras were positioned over the tanks, pointing downwards (Figure 1C) and were calibrated using a chessboard pattern and OPENCV library (see details below). During normal weekdays, fish were fed twice a day (~08:40 and ~14:40). On Saturdays, fish were fed in the mornings (~08:40) while on Sundays they fasted. In addition, there was human presence in the facility between 08:00 and 15:00 every day except Sundays. Fish were left to acclimate for a month, and the data for the month of June 2019 was analyzed for three-time windows representing different husbandry practices: one normal feeding day (Wednesday), one day when no feeding took place (Sunday) and a day when feeding took place a day after fasting (Monday).
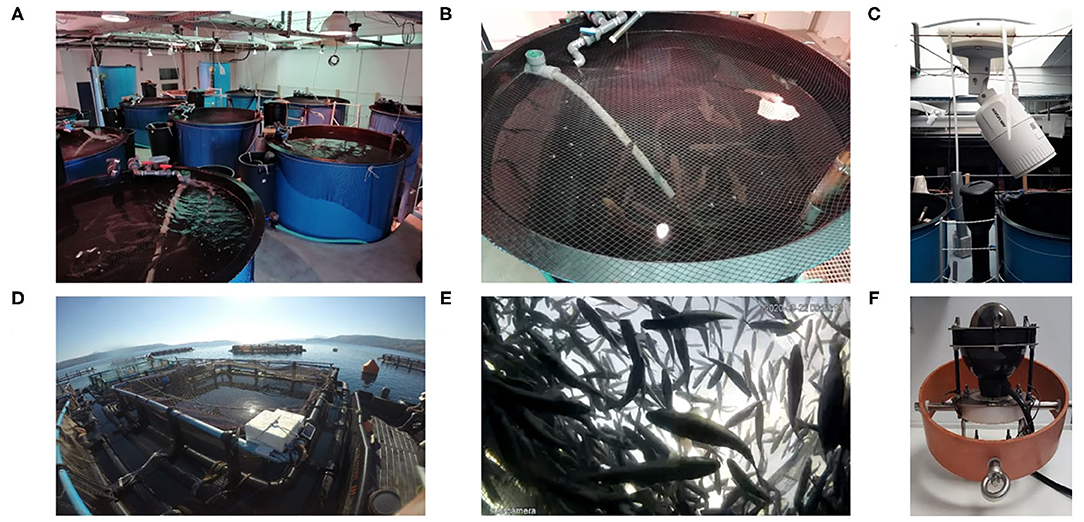
Figure 1. The RAS (A–C) and sea cage (D–F) aquaculture facilities and network cameras (C,F) used at HCMR.
B. Cages
A group of E. seabass fish of 220 ± 30 g body weight at a stocking density of 5.2 kg m−3 was reared in a 6 × 6 × 8 m rectangular cage (Figures 1D,E; T = 19.5 oC, DO = 85%, salinity = 30 g/L) located at the pilot scale netpen cage farm of HCMR (certified as an aquaculture facility from the national veterinary authority; code GR94FISH0001). A submerged network camera (Fyssalis v3.1; Figure 1F) capturing at 10 fps was used for monitoring and video recording during daylight hours. The camera was positioned at 4 m depth using a gyroscopic gimbal stabilizer to ensure it pointed upwards. Feeding was performed with an automatic feeder, starting from 08:30 to 15:00 at a frequency of 15 min. Husbandry practices taking place close to the cage included boat movements and human presence (daily), while other factors that could influence fish behavior were the predators (such as tuna and seals) found in the area. Video recordings of 30 days in total (selected from a 2-month period, i.e., from November to December 2019) were used and analyzed to detect daily changes in the swimming speed (morning before feeding and afternoon after feeding).
Camera Calibration
Single camera calibration involves the estimation of intrinsic parameters (focal length, optical center or principal point, pixel size) to correct lens distortion and sea water refraction (Gruen and Huang, 2001). Geometrical calibration was applied using a pattern with known distances (chessboard). The calibration was conducted above water for the tanks and underwater for the cages after capturing a sufficient number of chessboard images. The cameras were calibrated using OPENCV library in Python and the resulting parameters were used to correct the extracted videos.
Tracking Methodology—Tanks and Cages
An automated routine (based on OPENCV/Python; OPENCV 4.0, Python 3.8) that automatically tracks the fish in tanks and sea cages for a short time is developed (see Figure 2). The tracking routine consists of three steps: (1) the pre-processing step, where the images are denoised and prepared for analysis; (2) the fish detection step, where the background is subtracted and the objects are filtered out to select the most appropriate ones; and (3) the association step, where each detected object is associated with an object or a predicted centroid position. All steps are identical for both tanks and cages, except for the fish detection step as described below.
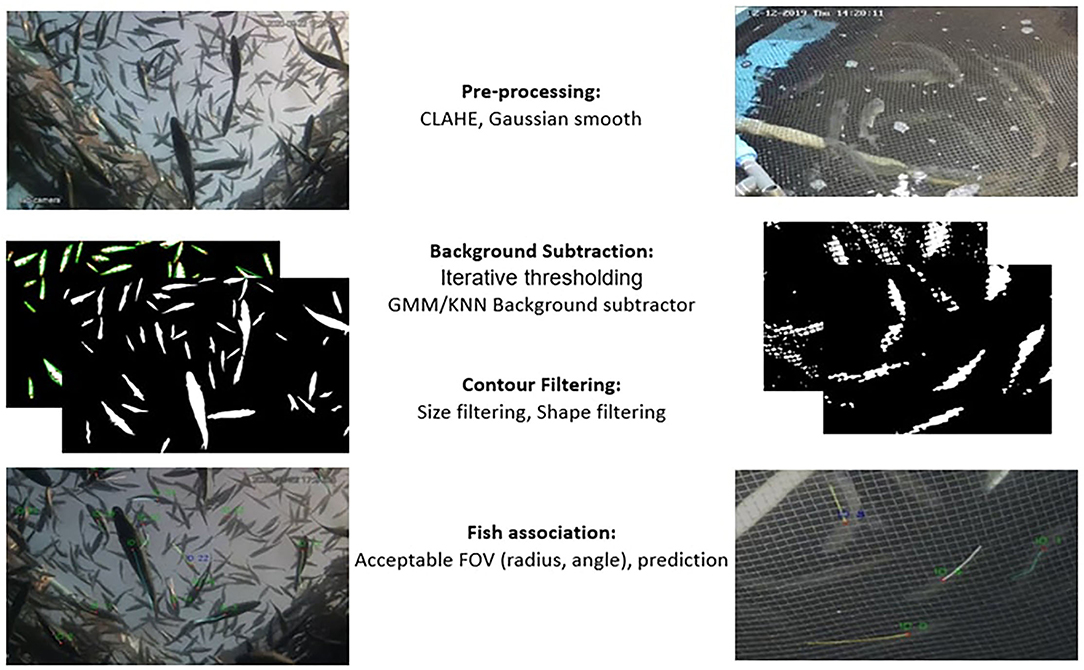
Figure 2. Schematic representation of the steps followed for the extraction of individual trajectories.
Pre-processing
The image frame is converted to grayscale, and contrast limited adaptive histogram equalization (CLAHE) is applied to smooth the effect of lighting on the image and achieve local contrast enhancement. Consequently, a Gaussian filter is applied to eliminate noise and damp tonalities. In tanks, net edges are further removed by applying a median filter.
Background Subtraction
For the tanks, the background removal is achieved using the GMM/KNN background subtractor from OPENCV library (Van Rossum and Drake, 1995; Itseez, 2015) which implements the K-nearest neighbors' background subtraction described in Zivkovic and Van Der Heijden (2006). The method also detects as foreground any significant background motion caused by sudden light variation or the irrelevant motion of air bubbles or organic particles. To filter out this falsely detected foreground and keep only the true fish objects, morphological operations, and contour analysis (shape and size filtering) are applied (see contour analysis section). Finally, a morphological opening is applied to the resulting foreground image to merge foreground objects that have split (see Figure 3). For the cages, a simple threshold is applied in an iterative way for the detection of the fish objects (i.e., iterating over all consecutive intensity threshold values T), and the foreground objects are filtered out according to the size and shape at each iteration (i.e., only objects with a fish-like oval shape are accepted). More specifically, at each iteration, each pixel's i value (I(i)) in the original image is replaced according to Equation 1 and a binary foreground image is extracted.
The detected foreground is further filtered out using contour analysis, as described in the following section.
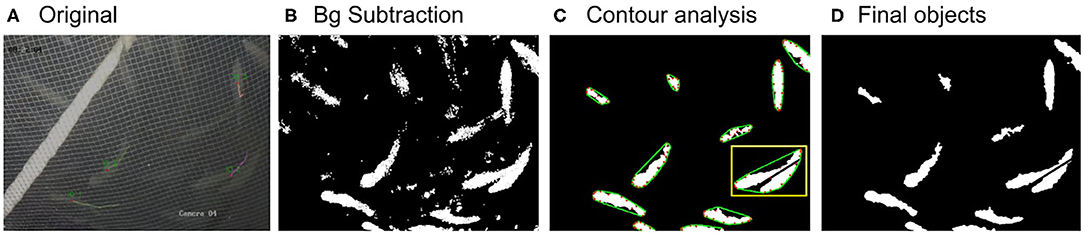
Figure 3. Images showing the original image frame (A), the extracted foreground image (B), the image after filtering out noise and running contour analysis (C), and the final image with the detected objects (D). In image (C), the defect points are shown in red and the convex line in green. The yellow rectangle indicates a case of two overlapping fish and their separation.
Contour Analysis
To remove noise such as air bubbles in RAS, the foreground objects are processed using contour analysis. Fish contours tend to have specific geometry and intensity attributes. They have an elongated shape (see Figures 3A,B) and an area of > 400 pixels; the mean intensity values of each RGB channel is around 120–180 and the variance between channels is minimal. For this reason, contours (C) within acceptable range values for contour size, geometry, and intensity profile are counted as fish objects. More specifically, the foreground objects are filtered out and accepted if the following conditions are met (Equation 2):
where carea(C(i)) is the area of the bounding circle of contour i. All the threshold values and value ranges are chosen and fine-tuned after careful examination of the typical values of the fish. For the cages, all contours (C) are detected using contour analysis and their attributes (i.e., their area, their convex hull and their bounding ellipse) are calculated. For the contours to be accepted as foreground, the following conditions must be met (Equation 3):
where ma(C(i)) and MA(C(i)) are the minor and major axis length, respectively, of the bounding ellipse of contour i (measured in pixels) and solidity is defined as the ratio (where areaHull(C(i)) is the area of the convex hull of contour i). In addition, a method to separate touching/overlapping objects is developed for both RAS and cages by considering the objects' defects. First, all the defect points P (red dots in Figure 3C) and their corresponding convex hull edges AC (green lines in Figure 3C) are determined. Second, the distance (d) between the defect point P and the midpoint of its edge, B, is calculated for each defect pair. If d > 35 pxls, a black line starting from point B with direction to point P is extended until it reaches the end of the contour (see yellow rectangle in Figure 3C).
After filtering out noise and merging fragmented objects and separating overlapping ones, a unique ID is assigned to each of the foreground objects. For each object, the following features are extracted: the center of the object, the area, the perimeter, the major and minor axis length, the mean and standard deviation of the red, green, blue channel intensity values, and the direction relative to the x-axis. The fish length is the length of the object's major axis.
Fish Association
To associate a new centroid to a previously detected centroid (of the focal fish), a search area containing all possible locations of the focal fish at the new time frame is estimated (see final search area in Figure 4). At each frame, this area is defined as the minor circular sector centered at the position of the previous frame (Pt−1, Figure 4), with the radius equal to the body-length of the fish and the central angle as the mean heading angle of the fish (averaged over the last 4 directions) ± 30°.
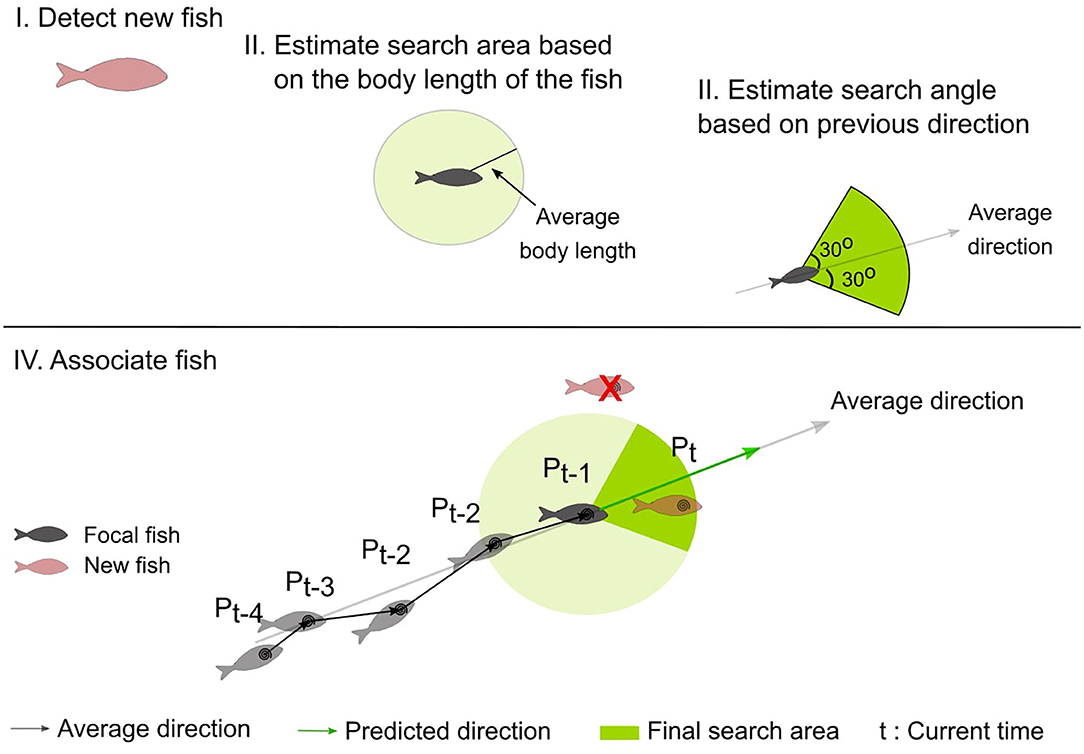
Figure 4. Schematic representation of the steps followed to estimate the search area (shown as a circular sector shaded in green), and to associate the fish (see text for details). (I) the fish of the current frame are detected (new fish), (II) the maximum distance the focal fish has traveled is calculated based on the body-length of the fish, (III) the direction the focal fish has moved is calculated based on the heading directions of the previous frames, (IV) The focal fish is associated with a newly detected fish that is located within the search area.
Once the search area is estimated, the distance between each pair of the previous centroid of the focal fish and the new centroids is computed, and the number of newly detected fish located within the search area is calculated. If there are more than two fish within the search area, the fish with the minimum distance are selected. In case of occlusions or disappearance, the focal fish is not detected and there are no candidate centroids within the search area. In this case, the new centroid position of the focal fish is predicted considering the history of the object's motion. More specifically, in this case, the new centroid position is at a step equal to the previous step of the focal fish and at a direction that is the average of the four previous heading directions of the focal fish. If a new centroid is a candidate centroid for multiple fish, a selection process takes place to solve the assignment problem. For each fish, the position is predicted and compared to the new centroid. The predicted position that is closest in distance and direction to the detected centroid is accepted. The centroids of the remaining fish are then predicted. If an object is predicted for 4 consecutive time frames, then the object is considered as disappeared and is removed from the list of the detected fish.
To further deal with the appearance/disappearance of the fish in the image and the potential tracking errors caused by this, the methodology is designed to track fish only for a short time, i.e., the fish are tracked for a few time frames (the time length can be defined by the user). This means that every few frames, fish IDs are deleted, and the detection process is reinitialized. The chances of detecting each individual fish multiple times (and therefore add bias in the sampling method) is minuscule because of the large number of fish in the RAS and cage systems. In the current work, the fish were tracked for 15 consecutive timeframes in the cages and for 7 consecutive timeframes in RAS.
Preference for the Tank Surface
The cylindroconical tank studied here was of a dark color, resulting in very low contrasted images (see Figures 1, 2). For this reason, only fish close to the surface could be detected. Thus, it was reasonable to assume that the area covered by the fish in the processed image was proportional to the number of fish that were approaching the surface and indicative of the fish preference to be at the surface. Therefore, the preference for the tank surface is calculated as the percentage area covered by the fish on the image, i.e., the sum of the white pixels of the foreground image divided by the total number of pixels in the image. Low values indicate that most fish remained at the bottom of the tank, while high values indicated a preference of the group to be on the surface.
Data Extraction and Analysis
The extracted trajectories are smoothed using a Savitzky-Golay filter (time window = 5 frames and power = 2), and three behavioral features are accessed: the linear normalized instantaneous speed (both systems), the direction, i.e., the angle in degrees relative to the x-axis (sea cages), and the preference of the fish to be on the tank surface (RAS). The first is calculated as the Euclidean distance between two consecutive frames divided by the estimated fish length to give the normalized speed values. In sea cages, speed is averaged every 15 frames to filter out any background oscillatory movement of the camera (caused by the currents). The direction of the fish was calculated as the angle between the velocity vector (starting from the centroid position at the previous time frame and ending at the centroid position at the current time frame) and the horizontal positive x-axis of the image. To estimate the preference for the tank surface, the sum of the foreground (white) pixels in the image is divided by its total number of pixels. This value shows the normalized area in the image that is covered by the fish.
Four different measures were used to evaluate the presented methodology: the precision in fish detection, the precision in speed estimation, the error of the length estimation, and the percent of correctly tracked objects in time. The precision of fish detection was estimated as the total number of correctly detected positions divided by the total number of estimated positions. To calculate it, fish from five videos were manually tracked to compare the result with the automatically extracted trajectories. Fish length was also manually extracted and compared to the automatically measured fish length. The error was defined as the median difference between the manual and the automatically estimated fish length and the deviation was the inter-quantile range. The values were divided by the fish length in pixels to be comparable between the RAS and the sea cages. The speed precision was defined as the mean and standard deviation of the difference between the manually and automatically extracted speed.
To test the proposed methodology for its sensitivity in detecting behavioral changes in European seabass, we estimated the swimming speed, the direction, and the preference for the tank surface at different times of the day and for different human presence/absence and feeding scenarios. To detect significant (significance level: α = 0.05) changes between morning and afternoon speeds in both RAS and sea cage systems, repeated measures ANOVA tests were applied (AnovaRM StatsModels Python library). ANOVA tests were applied after verifying that the assumptions of the test were met (normality was tested using the Shapiro-Wilk test).
Results
Evaluation of the Methodology
In RAS, the total number of detected and tracked objects at the first frame varies between 2 and 20. The percent of the detected objects in time decreases, as is shown in Figure 5B, with 30–60% of the initially detected fish remaining detected and tracked after seven frames. This shows that in each frame, there is at least one or two tracked objects. The centroid detection precision, i.e., the total number of correctly detected positions divided by the total number of estimated positions, is 0.85 ± 0.11. The length estimation error is 46.07 ± 17.29 pxls or 0.60 ±0.46 if normalized, i.e. if the error is divided by the total length in pixels. Figure 5A shows that the algorithm estimates a constant fish length. In addition, the accuracy of the speed estimations is shown in Figures 5C,D. The precision of the speed estimation is 0.045±0.03 bd/s. The figures show the manual (Figure 5C) and the estimated from the algorithm (Figure 5D) normalized speed distributions for different times using violin plots. The current methodology can successfully capture small daily variations in speed as the speed decreases from 08:20 till 10:50, increases suddenly at 12:10, and decreases again until 14:20. However, the methodology tends to slightly overestimate speed values.
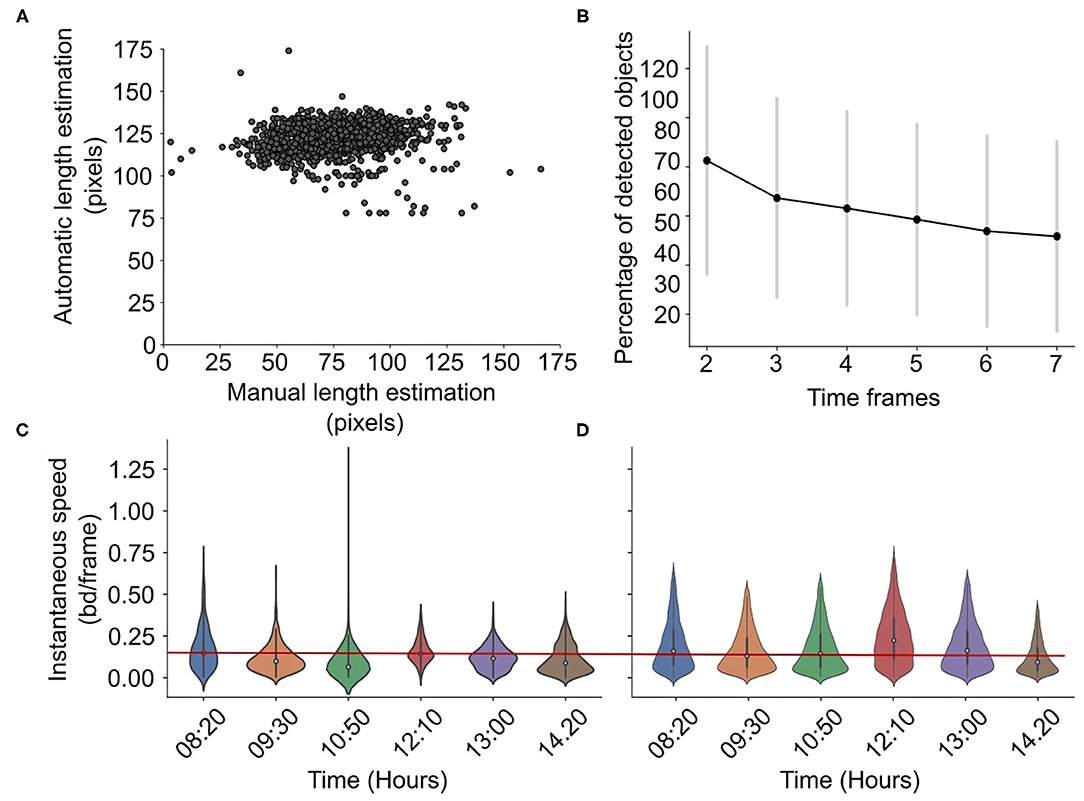
Figure 5. Accuracy in RAS. Scatterplot showing the manual vs. automatic length estimation (A) and the percentage of detected objects for different time frames (B). Violin plots showing the manual (C) vs. automatically (D) estimated speed distribution for different hours in a day in RAS, with a reference red line for easier comparison. The speed is normalized, i.e., it is expressed in body-lengths per frame.
In cages, the total number of detected objects in the first frame varied between 30 and 50 individuals. The percent of the detected objects in time decreased, as is shown in Figure 6B, with 20% of the initially detected fish remaining after 15 frames. This indicates that, on average, a minimum of three individuals were tracked at all time frames. The centroid detection precision is 0.89 ± 0.07. The algorithm tends to underestimate the length of the very large fish, i.e., the fish that are very close to the camera (Figure 6A). The error of length estimation is 25.8 ± 27.1 pxls and 0.43 ±0.46 if normalized. The precision of the speed estimation is 0.015±0.009 bd/s. The accuracy of the normalized speed estimation in the cages is shown in Figures 6C,D where the daily variations in the normalized speed extracted from both the manual (Figure 6C) and the automatic algorithm (Figure 6D) are presented. Again, the algorithm captures the slight temporal changes but overestimates the speed magnitude.
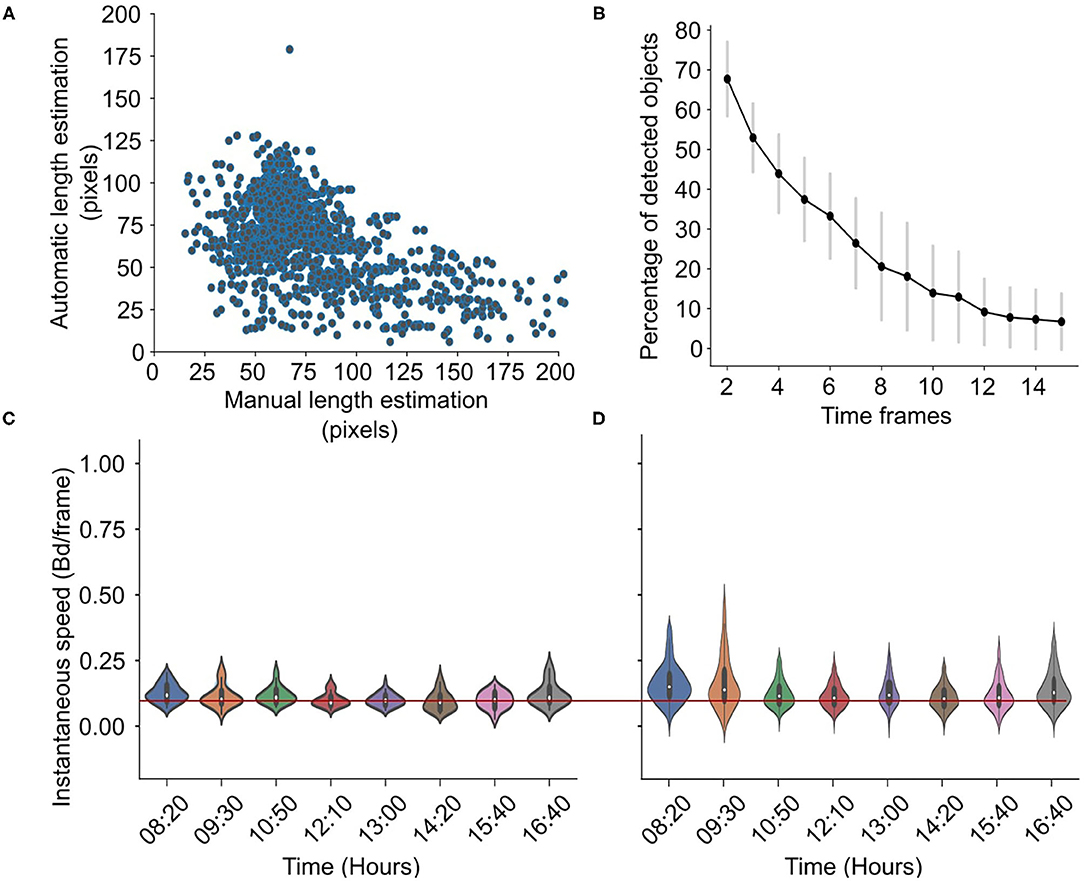
Figure 6. Accuracy in cages. Scatterplot showing the manual vs. automatic length estimation (A) and the percentage of detected objects for different time frames (B). Violin plots showing the manual (C) vs. automatically (D) estimated speed distribution for different hours in a day in cages, with a reference red line for easier comparison. The speed is the normalized speed, i.e., it is expressed in body-lengths per frame.
Swimming Analysis
Fish speed showed a significant decrease between morning and afternoon, from 0.48 ± 0.09 to 0.27 ± 0.09 Bd per frame in RAS (Sunday:F−statistic 0.11, P−value = 0.77; Monday: F−statistic = 10.91, P−value = 0.05; Wednesday: F−statistic = 13.79 P−value = 0.03, Figure 7). On Sundays, the speed remained at the same level in the morning and in the afternoon (0.45 ± 0.15 and 0.38 ± 0.15 Bd per frame, respectively). In contrast, during normal feeding days, the speed in the morning (0,46 ± 0,05 Bd per frame) was at the same level as on Sunday (Morning:F−statistic 0.32, P−value = 0.74; Afternoon:F−statistic 0.29, P−value = 0.76) but decreased significantly in the afternoon (0.31 ± 0.03 bd/frame).
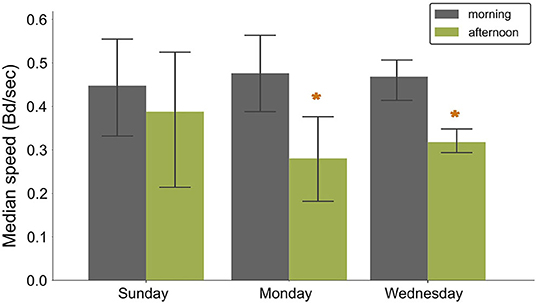
Figure 7. Bar plots showing the variation of the normalized speed (bd/frame) for different feeding and husbandry scenarios in RAS. Bars indicate mean values and whiskers the standard deviation. Sunday= fasting, Monday = feeding after fasting, Wednesday = normal feeding day. Asterisks show statistically significant differences.
Furthermore, Figure 8 shows how the preference of the fish to be at the surface of the tank changes during Sundays, Mondays and Wednesdays. On Sundays, the fish show a constant preference to be at the surface (Figure 8A). In contrast, during normal days, the preference varies, with the fish avoiding the surface until late in the afternoon (Figures 8B,C), a period associated with a human presence.
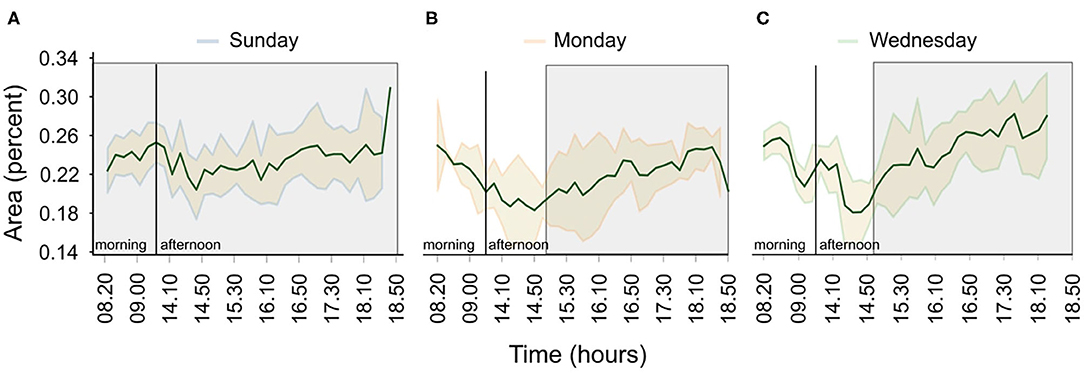
Figure 8. Variations in the tank surface preference for the three scenarios; (A) no feeding/no human presence, (B) feeding after fasting/human presence, and (C) normal feeding/human presence. Shaded areas show the standard error of the mean and green solid lines the average area covered by the fish (in percent) over a period of a month. The gray shaded rectangles indicate periods of human absence.
In cages, fish show a similar pattern in the daily speed variation. During the morning they have a significantly higher speed (1.31 ± 0.60 Bd per second) that decreases in the afternoon (0,83 ± 0.26 Bd per second), (F-statistic: 20.58; P < 0.001, Figures 9A,B). In addition, when there is a human presence and during human activities close to the cage, the average speed of the fish increases (close to 1 Bd per frame), which is further exacerbated when people are right on the cage (Figures 9C,D).
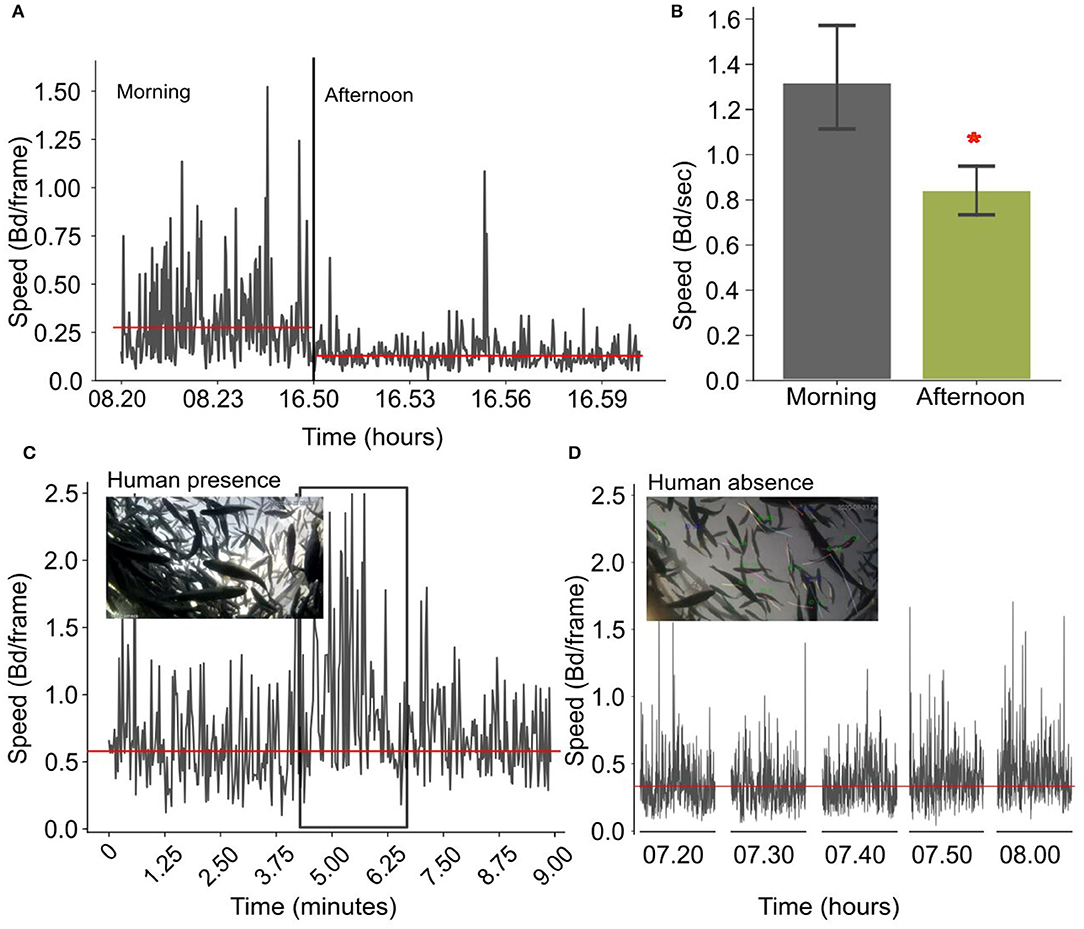
Figure 9. (A) Time-series showing the variation of the normalized speed in the morning and in the afternoon for one example day. The reference line is the average speed in the morning and in the afternoon. (B) Bar plots showing the variation of the normalized speed (bd/frame) for the morning and the afternoon averaged over 30 days (the asterisk shows a statistical significance); (C) Instantaneous speed changes when there is a human presence in the cages. (D) Speed variations when there is no human presence in the cages. Horizontal lines indicate the average instantaneous speed.
The distribution of individual swimming directions is shown in Figure 10 for different movement patterns in sea cages. Figure 10A shows fish moving freely in an asynchronized way, where the swimming directions are widely spread between 0 and 360 degrees. In contrast, when fish show a polarized motion either due to a perceived threat or when anticipating feeding, the distribution of the swimming directions narrows, and all angles are around the main directional component of the group motion (Figure 10B). As the methodology could not track more than two to three individuals per frame in RAS systems group, presenting direction distribution in RAS was not possible.
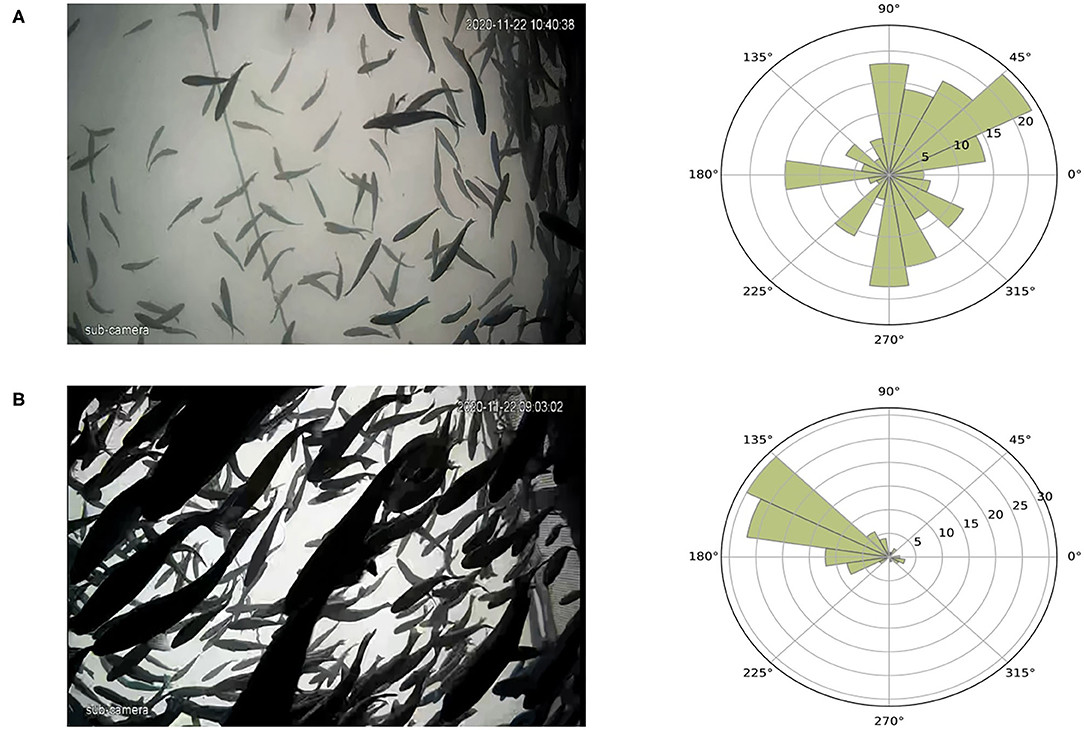
Figure 10. Variations of fish swimming direction according to different motion patterns, an example. (A) Fish swim in an asynchronized way and the rose diagram shows how the angles are distributed. (B) Fish swim in a polarized way during a perceived threat and the spread of the angles is small. The reference system for the image and the rose diagram differs (for images it is clockwise and for the rose diagram it is counter-clockwise).
Discussion
In the current work, a novel methodology that can automatically monitor and track E. seabass for short times in both RAS and sea cages is presented. Feature parameters such as the instantaneous normalized speed, the swimming direction and the preference for the tank surface are extracted and their daily variations are presented as test examples. All features show variability under different scenarios, i.e., under variable feeding and husbandry practices, suggesting a potential indicator of different behavioral states for the species. To our knowledge, methodologies that automatically monitor and track European seabass and extract swimming features in any of the RAS or sea cages are scarce. The current study, therefore, contributes to the field by providing a new tool that facilitates the monitoring of the swimming behavior of the species.
The methodology developed and presented here can be adapted for real-time monitoring and easily modified to track different fish species. The detection step is based on recognizing the outline of the bottom or the top of the fish, i.e., their oval shape and, thus, slight modifications of the parameters used for the detection, e.g., the size and the shape parameters, can result in the tracking of different fish species. Preliminary tests for the tracking of the greater amberjack (Seriola dumerili) and the gilthead seabream (Sparus aurata) showed positive results.
The methodology can work well for a reasonably dense population, but it may not distinguish individuals under extremely crowded conditions. For example, during feeding or during a threatening situation, the population is agglomerated and appears as a single solid object so the individuals are indistinguishable. In these cases, the algorithm can only follow individuals that are at the edge of the group or distant from the shoal. At these moments, estimating individual speed is inefficient, and other global-level methodologies, such as classification methods that can classify swimming behaviors based on the group's spatial characteristics (Li et al., 2020a), are needed to extract behavioral attributes.
The evaluation of the suggested methodology is based on four criteria: the precision of fish detection, the precision of speed estimation, the error of the length estimation, and the percent of correctly tracked objects in time. The fish detection precision is high (0.85 ± 0.11 in RAS and 0.89 ± 0.07 in cages) and the swimming speed error is low in both rearing systems (0.06 bd/s precision in RAS and 0.02 bd/s in cages). Regarding fish length, the method overestimates the fish length in RAS. In sea cages, the length estimation is more accurate, but the methodology tends to underestimate the fish length of the very large fish, i.e., the fish very close to the camera. More specifically, the error of length estimation is 25.8±27.1 pxls (0.43 ±0.46, normalized) for cages and 46.07 ± 17.29 pxls (0.60 ±0.46, normalized) for RAS indicating a better estimation in the former. Improving fish length estimation, e.g., by applying machine learning techniques in the fish detection step, is crucial for the improved performance of the methodology. Finally, the methodology consecutively tracks 20–30% of the initially detected fish for all the 7 and 15 frames in RAS and cages, respectively. This corresponds to a minimum of two fish per minute for the RAS and 10 fish per minute for the cages, suggesting that with this methodology group-level studies are more appropriate for cages than for RAS.
Methodologies that combine both, the detection and tracking of fish, have been developed and presented in only a handful of studies. Moreover, the environmental conditions and camera systems reported in these studies differ greatly from the ones used here (Qian et al., 2014; Chuang et al., 2015; Wang et al., 2017; Lopez-Marcano et al., 2021). For example, Wang et al. (2017) used small tanks with a few individuals and detected the fish heads using CNNs. Qian et al. (2014) presented a methodology that can track the positions of multiple fish using head detection; however, they applied it in very controlled RAS systems. Therefore, these methodologies are not easily applicable for underwater systems. Other methodologies, such as that of Chuang et al. (2015), have been developed for analyzing videos of stereo cameras and thus cannot be applied to single-camera videos. In addition, only a few methodologies that use single cameras have used European seabass for monitoring swimming behavior (Papadakis et al., 2012; Alfonso et al., 2020) and they are focused on RAS systems. Pinkiewicz et al. (2011) developed a similar methodology to monitor swimming behavior but used a different fish species, the Atlantic salmon. Their methodology could more accurately estimate the fish length but had a lower accuracy on the speed estimation (0.1 ±0.39 bd/s) when compared with the precision of our methodology (0.045 ±0.03 and 0.015±0.009 bd/s for the RAS and the cages, respectively). Our methodology can, therefore, facilitate the automatic real-time monitoring of Mediterranean species.
With the current methodology, swimming features such as instantaneous normalized speed, swimming direction, and the preference for the tank surface are estimated. The normalized speed shows a sensitivity to husbandry practices and, particularly, feeding. Specifically, speed shows consistent daily variations, with decreasing speeds on weekday afternoons and no changes in speed at the weekend. The decreased speed in the afternoon during normal feeding days is seen in both RAS and sea cage systems. This decrease could be related to feeding and could serve as an indicator of satiation levels. Alternatively, it could be linked to the presence or absence of human activities close to the reared fish groups. Swimming speed shows high variability on Sunday afternoons after a fasting day in RAS. This variation could be explained either by the small sample used for the analysis (i.e., only four measurements) and could decrease with the acquisition of more data. Further studies, which are now feasible with the presented method, are required in order to establish associations between the speed and feeding or other husbandry practices.
To our knowledge there are only a few studies presenting how speed varies in aquaculture species (Martins et al., 2012) and these, like our findings, suggest that speed is a good indicator of behavior. Studies on the variations of the swimming speed of Atlantic salmon are presented in the recent papers of Andrew et al. (2002) and Hvas et al. (2017, 2021). Arechavala-Lopez et al. (2020) studied the optimal swimming speed of the gilthead seabream. Other studies focus on the behavioral changes of fish under different feeding scenarios or using different features, as, for example, Andrew et al. (2002), who showed that fish increase their swimming speeds during feeding under normal feeding practices. In addition, Pinkiewicz et al. (2011) found that the swimming speed of Atlantic salmon increased during the 08:00 h feeding, decreased slowly throughout most of the morning and early afternoon then began to rise again as the feeding finished around 14:00 h, after which it continued to increase until the end of the recording.
Human observation indicates that fish preference for the tank surface varies according to the existing physicochemical and husbandry conditions (Stien et al., 2007; Saberioon and Cisar, 2016; Alfonso et al., 2020), which points to the usefulness of studying vertical tank distribution as an indicator of different behavioral states. In our study, during normal working/feeding days, the fish avoided the surface of the tank in the morning but preferred it in the afternoon. On Sundays, however, their surface preference did not vary at all. This indicates that fish could be affected by the presence of people and the activities taking place during working days. Thus, this feature could be used as an indicator of the behavioral state of the European seabass. Further feature-specific experiments are required in order to associate swimming speed to specific husbandry practices and determine optimal range values.
The distribution of swimming directions is also a feature that shows daily variations, and specifically detects changes from a random to polarized motion in sea cages. Pinkiewicz et al. (2011) also showed how swimming direction can be sensitive to feeding or time in their study of the Atlantic salmon. Their analysis indicated that the swimming direction of the individuals after feeding in the afternoon showed a deviation by 40°. European seabass show strong polarization under perceived threat, i.e., when predator fish surround the cages, or when facility operations take place close to the fish (such as boat engines starting up, etc.). Detecting the occurrence and frequency of such stressful situations may help farmers to better understand fish behavior and improve the welfare of the reared stocks.
The focus of the current work was to develop and provide a methodology for monitoring swimming behavior in different aquaculture setups. The presented methodology can successfully track European seabass individuals in aquaculture systems and facilitate automatic video processing and behavioral analysis. In accordance with previous studies, the current work demonstrates the sensitivity of some individual swimming features to variations in group behaviors. Future steps include increasing the accuracy of the fish length estimation and a separate analysis of the behavioral differences presented during the experiment using the present (or an improved version) tool. In addition, obtaining and exploring other behavioral features, such as swimming depth, cohesion, and acceleration, may further improve the presented method. These features are essential for real-time monitoring and the detection of changes in fish behavior.
Data Availability Statement
The raw data supporting the conclusions of this article will be made available by the authors, without undue reservation.
Ethics Statement
The animal study was reviewed and approved by the Ethics Committee of the IMBBC and the relevant veterinary authorities (Ref Number 255,344) and was conducted in certified laboratories (EL91-BIOexp-04) in accordance with legal regulations (EU Directive 2010/63).
Author Contributions
DG, OS-Z, and NP conceived and designed the study. OS-Z, NP, and NM run the experiments. Tracking methodology was designed by DG and NP. DG developed the methodology, run the analyses, produced the figures, and wrote the first draft. All authors contributed to the final version of the manuscript.
Funding
This work was funded by the EU Horizon 2020 iFishIENCi project (818036).
Conflict of Interest
The authors declare that the research was conducted in the absence of any commercial or financial relationships that could be construed as a potential conflict of interest.
Publisher's Note
All claims expressed in this article are solely those of the authors and do not necessarily represent those of their affiliated organizations, or those of the publisher, the editors and the reviewers. Any product that may be evaluated in this article, or claim that may be made by its manufacturer, is not guaranteed or endorsed by the publisher.
Acknowledgments
The authors would like to thank Dimitris Voskakis for the fruitful discussions on the methodology section, Marlene deWilde for proofreading the manuscript and improving its appearance, and the three reviewers for their constructive comments.
References
Alfonso, S., Sadoul, B., Cousin, X., and Bégout, M. L. (2020). Spatial distribution and activity patterns as welfare indicators in response to water quality changes in European sea bass, Dicentrarchus labrax. Appl. Anim. Behav. Sci. 226:104974. doi: 10.1016/j.applanim.2020.104974
An, D., Hao, J., Wei, Y., Wang, Y., and Yu, X. (2021). Application of computer vision in fish intelligent feeding system—a review. Aquac. Res. 52, 423–437. doi: 10.1111/are.14907
Andrew, J. E., Noble, C., Kadri, S., Jewell, H., and Huntingford, F. A. (2002). The effect of demand feeding on swimming speed and feeding responses in Atlantic salmon Salmo salar L., gilthead sea bream Sparus aurata L. and European sea bass Dicentrarchus labrax L. in sea cages. Aquac. Res. 33, 501–507. doi: 10.1046/j.1365-2109.2002.00740.x
Antonucci, F., and Costa, C. (2020). Precision aquaculture: a short review on engineering innovations. Aquac. Int. 28, 41–57. doi: 10.1007/s10499-019-00443-w
Arechavala-Lopez, P., Nazzaro-Alvarez, J., Jardí-Pons, A., Reig, L., Carella, F., Carrassón, M., et al. (2020). Linking stocking densities and feeding strategies with social and individual stress responses on gilthead seabream (Sparus aurata). Physiol. Behav. 213:112723. doi: 10.1016/j.physbeh.2019.112723
Awalludin, E. A., Arsad, T. N. T., and Wan Yussof, W. N. J. H. (2020). A review on image processing techniques for fisheries application. J. Phys. Conf. Ser. 1529:052031. doi: 10.1088/1742-6596/1529/5/052031
Barreiros, M., Dantas, D., de, O., Silva, L. C., de, O., Ribeiro, S., and Barros, A. K. (2021). Zebrafish tracking using YOLOv2 and Kalman filter. Sci. Rep. 11:3219. doi: 10.1038/s41598-021-81997-9
Behringer, D. C., Karvonen, A., and Bojko, J. (2018). Parasite avoidance behaviours in aquatic environments. Philos. Trans. R. Soc. B Biol. Sci. 373:20170202. doi: 10.1098/rstb.2017.0202
Benhaïm, D., Bégout, M. L., Péan, S., Brisset, B., Leguay, D., and Chatain, B. (2012). Effect of fasting on self-feeding activity in juvenile sea bass (Dicentrarchus labrax). Appl. Anim. Behav. Sci. 136, 63–73. doi: 10.1016/j.applanim.2011.11.010
Bergqvist, J., and Gunnarsson, S. (2013). Finfish aquaculture: animal welfare, the environment, and ethical implications. J. Agric. Environ. Ethics 26, 75–99. doi: 10.1007/s10806-011-9346-y
Brown, C.. (2015). Fish intelligence, sentience and ethics. Anim. Cogn. 18, 1–17. doi: 10.1007/s10071-014-0761-0
Carr, W. E. S., Netherton, J. C., Gleeson, R. A., and Derby, C. D. (1996). Stimulants of feeding behavior in fish: analyses of tissues of diverse marine organisms. Biol. Bull. 190, 149–160. doi: 10.2307/1542535
Chuang, M. C., Hwang, J. N., Williams, K., and Towler, R. (2015). Tracking live fish from low-contrast and low-frame-rate stereo videos. IEEE Trans. Circuits Syst. Video Technol. 25, 167–179. doi: 10.1109/TCSVT.2014.2357093
Dell, A. I., Bender, J. A., Branson, K., Couzin, I. D., Polavieja, G. G., de Polavieja, G. G., et al. (2014). Automated image-based tracking and its application in ecology. Trends Ecol. Evol. 29, 417–428. doi: 10.1016/j.tree.2014.05.004
Føre, M., Alfredsen, J. A., and Gronningsater, A. (2011). Development of two telemetry-based systems for monitoring the feeding behaviour of Atlantic salmon (Salmo salar L.) in aquaculture sea-cages. Comput. Electron. Agric. 76, 240–251. doi: 10.1016/j.compag.2011.02.003
Føre, M., Frank, K., Dempster, T., Alfredsen, J. A., and Høy, E. (2017). Biomonitoring using tagged sentinel fish and acoustic telemetry in commercial salmon aquaculture: a feasibility study. Aquac. Eng. 78, 163–172. doi: 10.1016/j.aquaeng.2017.07.004
Føre, M., Frank, K., Norton, T., Svendsen, E., Alfredsen, J. A., Dempster, T., et al. (2018). Precision fish farming: a new framework to improve production in aquaculture. Biosyst. Eng. 173, 176–193. doi: 10.1016/j.biosystemseng.2017.10.014
Georgopoulou, D. G., King, A. J., Brown, R. M., and Fürtbauer, I. (2021). Emergence and repeatability of leadership and coordinated motion in fish shoals. Behav. Ecol. arab108. doi: 10.1093/beheco/arab108
Gruen, A., and Huang, T. S. (2001). Calibration and Orientation of Cameras in Computer Vision. Berlin: Springer Science & Business Media. doi: 10.1007/978-3-662-04567-1
Hvas, M., Folkedal, O., and Oppedal, F. (2021). Fish welfare in offshore salmon aquaculture. Rev. Aquac. 13, 836–852. doi: 10.1111/raq.12501
Hvas, M., Folkedal, O., Solstorm, D., Vågseth, T., Fosse, J. O., Gansel, L. C., et al. (2017). Assessing swimming capacity and schooling behaviour in farmed Atlantic salmon Salmo salar with experimental push-cages. Aquaculture 473, 423–429. doi: 10.1016/j.aquaculture.2017.03.013
Itseez (2015). Open Source Computer Vision Library. Available online at: https://github.com/itseez/opencv
Joseph, J., Torney, C., Kings, M., Thornton, A., and Madden, J. (2017). Applications of machine learning in animal behaviour studies. Anim. Behav. 124, 203–220. doi: 10.1016/j.anbehav.2016.12.005
Killen, S. S., Marras, S., Nadler, L., and Domenici, P. (2017). The role of physiological traits in assortment among and within fish shoals. Philos. Trans. R. Soc. London. Ser. B, Biol. Sci. 372:20160233. doi: 10.1098/rstb.2016.0233
Li, D., Wang, Z., Wu, S., Miao, Z., Du, L., and Duan, Y. (2020a). Automatic recognition methods of fish feeding behavior in aquaculture: a review. Aquaculture 528:735508. doi: 10.1016/j.aquaculture.2020.735508
Li, X., Zhang, Y., and Fu, S. (2020b). Effects of short-term fasting on spontaneous activity and excess post-exercise oxygen consumption in four juvenile fish species with different foraging strategies. Biol. Open 9, 1–10. doi: 10.1242/bio.051755
Lindseth, A. V., and Lobel, P. S. (2018). Underwater soundscape monitoring and fish bioacoustics: a review. Fishes 3:36. doi: 10.3390/fishes3030036
Liu, Z., Li, X., Fan, L., Lu, H., Liu, L., and Liu, Y. (2014). Measuring feeding activity of fish in RAS using computer vision. Aquac. Eng. 60, 20–27. doi: 10.1016/j.aquaeng.2014.03.005
Lopez-Marcano, S.L, Jinks, E., Buelow, C. A., Brown, C. J., Wang, D., et al. (2021). Automatic detection of fish and tracking of movement for ecology. Ecol. Evol. 11, 8254–8263. doi: 10.1002/ece3.7656
Måløy, H., Aamodt, A., and Misimi, E. (2019). A spatio-temporal recurrent network for salmon feeding action recognition from underwater videos in aquaculture. Comput. Electron. Agric. 167:105087. doi: 10.1016/j.compag.2019.105087
Macaulay, G., Bui, S., Oppedal, F., and Dempster, T. (2021a). Challenges and benefits of applying fish behaviour to improve production and welfare in industrial aquaculture. Rev. Aquac. 13, 934–948. doi: 10.1111/raq.12505
Macaulay, G., Warren-Myers, F., Barrett, L. T., Oppedal, F., Føre, M., and Dempster, T. (2021b). Tag use to monitor fish behaviour in aquaculture: a review of benefits, problems and solutions. Rev. Aquac. 13, 1565–1582. doi: 10.1111/raq.12534
Magnuson, J. J.. (1962). An analysis of aggressive behavior, growth, and competition for food and space in medaka (ORYZIAS LATIPES (PISCES, CYPRINODONTIDAE)). Can. J. Zool. 40, 313–363. doi: 10.1139/z62-029
Martins, C. I. M., Galhardo, L., Noble, C., Damsgård, B., Spedicato, M. T., Zupa, W., et al. (2012). Behavioural indicators of welfare in farmed fish. Fish Physiol. Biochem. 38, 17–41. doi: 10.1007/s10695-011-9518-8
Noble, C., Gismervik, K., Iversen, M. H., Kolarevic, J., Jonatan, N. H., et al. (2018). Welfare Indicators for Farmed Atlantic Salmon: Tools for Assessing Fish Welfare. Tromsø: Nofima.
Papadakis, V. M., Papadakis, I. E., Lamprianidou, F., Glaropoulos, A., and Kentouri, M. (2012). A computer-vision system and methodology for the analysis of fish behavior. Aquac. Eng. 46, 53–59. doi: 10.1016/j.aquaeng.2011.11.002
Pautsina, A., Císa,r, P., Štys, D., Terjesen, B. F., and Espmark, Å. M. O. (2015). Infrared reflection system for indoor 3D tracking of fish. Aquac. Eng. 69, 7–17. doi: 10.1016/j.aquaeng.2015.09.002
Pawar, K., and Attar, V. (2019). Deep learning approaches for video-based anomalous activity detection. World Wide Web 22, 571–601. doi: 10.1007/s11280-018-0582-1
Pinkiewicz, T. H., Purser, G. J., and Williams, R. N. (2011). A computer vision system to analyse the swimming behaviour of farmed fish in commercial aquaculture facilities: a case study using cage-held Atlantic salmon. Aquac. Eng. 45, 20–27. doi: 10.1016/j.aquaeng.2011.05.002
Pittman, S. J., Monaco, M. E., Friedlander, A. M., Legare, B., Nemeth, R. S., Kendall, M. S., et al. (2014). Fish with chips: Tracking reef fish movements to evaluate size and connectivity of Caribbean marine protected areas. PLoS One 9:e96028. doi: 10.1371/journal.pone.0096028
Qian, Z. M., Cheng, X. E., and Chen, Y. Q. (2014). Automatically Detect and track multiple fish swimming in shallow water with frequent occlusion. PLoS ONE 9:e106506. doi: 10.1371/journal.pone.0106506
Qian, Z. M., Wang, S. H., Cheng, X. E., and Chen, Y. Q. (2016). An effective and robust method for tracking multiple fish in video image based on fish head detection. BMC Bioinformatics 17:251. doi: 10.1186/s12859-016-1138-y
Saberioon, M., Gholizadeh, A., Cisar, P., Pautsina, A., and Urban, J. (2017). Application of machine vision systems in aquaculture with emphasis on fish: state-of-the-art and key issues. Rev. Aquac. 9, 369–387. doi: 10.1111/raq.12143
Saberioon, M. M., and Cisar, P. (2016). Automated multiple fish tracking in three-Dimension using a structured light sensor. Comput. Electron. Agric. 121, 215–221. doi: 10.1016/j.compag.2015.12.014
Sánchez-Suárez, W., Franks, B., and Torgerson-White, L. (2020). From land to water: taking fish welfare seriously. Animals 10, 1–11. doi: 10.3390/ani10091585
Schmidt, M. B., and Schletterer, M. (2020). Hydroakustik zur Analyse von Fischbeständen und Fischverhalten – Fallstudien aus Österreich. Österreichische Wasser- und Abfallwirtschaft 72, 213–222. doi: 10.1007/s00506-020-00670-z
Seibel, H., Weirup, L., and Schulz, C. (2020). Fish welfare – between regulations, scientific facts and human perception. Food Ethics 5, 1–11. doi: 10.1007/s41055-019-00063-3
Smith, V. J.. (2000). Fisheries Society of the British Isles (FSBI). Fish Shellfish Immunol. 10, 213–214. doi: 10.1006/fsim.1999.0251
Spampinato, C., Chen-Burger, Y. H., Nadarajan, G., and Fisher, R. B. (2008). “Detecting, tracking and counting fish in low quality unconstrained underwater videos”, in VISAPP 2008 - Proceedings of the Third International Conference on Computer Vision Theory and Applications- Vol. 2. (Madeira), 514–519.
Stien, L. H., Bratland, S., Austevoll, I., Oppedal, F., and Kristiansen, T. S. (2007). A video analysis procedure for assessing vertical fish distribution in aquaculture tanks. Aquac. Eng. 37, 115–124. doi: 10.1016/j.aquaeng.2007.03.002
Torisawa, S., Kadota, M., Komeyama, K., Suzuki, K., and Takagi, T. (2011). A digital stereo-video camera system for three-dimensional monitoring of free-swimming Pacific bluefin tuna, Thunnus orientalis, cultured in a net cage. Aquat. Living Resour. 24, 107–112. doi: 10.1051/alr/2011133
Trygonis, V., Georgakarakos, S., Dagorn, L., and Brehmer, P. (2016). Spatiotemporal distribution of fish schools around drifting fish aggregating devices. Fish. Res. 177, 39–49. doi: 10.1016/j.fishres.2016.01.013
Van Rossum, G., and Drake Jr, F. L. (1995). Python Tutorial. Amsterdam: Centrum voor Wiskunde en Informatica.
Volkoff, H., and Peter, R. E. (2006). Feeding behaviour and its control. Zebrafish 3, 131–140. doi: 10.1089/zeb.2006.3.131
Wang, S. H., Zhao, J. W., and Chen, Y. Q. (2017). Robust tracking of fish schools using CNN for head identification. Multimed. Tools Appl. 76, 23679–23697. doi: 10.1007/s11042-016-4045-3
Wei, Y. Y., Zheng, D., Hu, L. Y., and Zhan, J. M. (2014). Research on intelligent bait casting method based on machine vision technology. Adv. Mater. Res. 1073–1076, 1871–1874. doi: 10.4028/www.scientific.net/AMR.1073-1076.1871
Yang, L., Liu, Y., Yu, H., Fang, X., Song, L., Li, D., et al. (2021). Computer vision models in intelligent aquaculture with emphasis on fish detection and behavior analysis: A review. Arch. Computat. Methods Eng. 28, 2785–2816. doi: 10.1007/s11831-020-09486-2
Ye, Z. Y., Zhao, J., Han, Z. Y., Zhu, S. M., Li, J. P., Lu, H. D., et al. (2016). Behavioral characteristics and statistics-based imaging techniques in the assessment and optimization of tilapia feeding in a recirculating aquaculture system. Trans. ASABE 59, 345–355. doi: 10.13031/trans.59.11406
Zhao, S., Zhang, S., Liu, J., Wang, H., Zhu, J., Li, D., et al. (2021). Application of machine learning in intelligent fish aquaculture: A review. Aquaculture 540:736724. doi: 10.1016/j.aquaculture.2021.736724
Zhou, C., Xu, D., Lin, K., Sun, C., and Yang, X. (2018). Intelligent feeding control methods in aquaculture with an emphasis on fish: a review. Rev. Aquac. 10, 975–993. doi: 10.1111/raq.12218
Zhou, C., Zhang, B., Lin, K., Xu, D., Chen, C., Yang, X., et al. (2017). Near-infrared imaging to quantify the feeding behavior of fish in aquaculture. Comput. Electron. Agric. 135, 233–241. doi: 10.1016/j.compag.2017.02.013
Keywords: precision farming, fish monitoring method, fish swimming variations, computer vision, fish behavior, welfare
Citation: Georgopoulou DG, Stavrakidis-Zachou O, Mitrizakis N and Papandroulakis N (2021) Tracking and Analysis of the Movement Behavior of European Seabass (Dicentrarchus labrax) in Aquaculture Systems. Front. Anim. Sci. 2:754520. doi: 10.3389/fanim.2021.754520
Received: 06 August 2021; Accepted: 16 November 2021;
Published: 09 December 2021.
Edited by:
Jeroen Brijs, University of Hawaii at Manoa, United StatesReviewed by:
Murat Yigit, Çanakkale Onsekiz Mart University, TurkeyTiago Bresolin, University of Wisconsin-Madison, United States
Harkaitz Eguiraun, University of the Basque Country, Spain
Copyright © 2021 Georgopoulou, Stavrakidis-Zachou, Mitrizakis and Papandroulakis. This is an open-access article distributed under the terms of the Creative Commons Attribution License (CC BY). The use, distribution or reproduction in other forums is permitted, provided the original author(s) and the copyright owner(s) are credited and that the original publication in this journal is cited, in accordance with accepted academic practice. No use, distribution or reproduction is permitted which does not comply with these terms.
*Correspondence: Dimitra G. Georgopoulou, ZC5nZW9yZ29wb3Vsb3VAaGNtci5ncg==