 Megan M. Woodrum Setser
 Heather W. Neave
 Eric Vanzant
 Joao H. C. Costa
- 1Department of Animal and Food Science, University of Kentucky, Lexington, KY, United States
- 2AgResearch Ltd., Ruakura Research Centre, Hamilton, New Zealand
- 3Department of Animal Science, Aarhus University, Tjele, Denmark
The use of an isolation box test (IBT) to characterize personality traits has been used in non-bovine species with success. We aimed to develop an IBT for dairy calves and determine if the behavioral responses to an IBT were associated with personality traits found from traditional tests (novel person, novel object, and a startle tests) and average daily gain (ADG; Kg/d) through weaning. Calf movement while in the IBT was measured via accelerometers attached to 5 locations on the exterior of the box. A total movement index (TMI) was calculated based on accelerometer readings during the IBT. We performed a principal component analysis on the traditional tests and identified 3 influential factors that we labeled as “fearful,” “bold,” and “active.” Calves were weighed biweekly to track liveweight ADG. Factor scores and ADG were regressed against TMI. A significant negative association was found between the TMI and the factor “active,” indicating the validity of IBT as a tool for assessing some personality traits of dairy calves. Furthermore, TMI had a positive association with ADG through the entire experimental period and thus has potential to help predict performance through weaning. IBT has potential to be used as a personality test in research scenarios. Further development is needed to produce an IBT that would be appropriate to measure animals' responses reliably in production settings. An automated test that can accommodate a wide range of ages and developing a computer learning model to interpret output from the IBT would be a possible option to do so.
Introduction
Personality expressed by animals, like other phenotypes, is a product of the interaction between the environment, experiences, and the genetics of the individual. The ability to characterize animals based on personality has many practical applications in animal production such as management ease, genetic selection, and welfare implications for animals (Koolhaas and Van Reenen, 2016). Herein, we use the term “personality traits” to refer to stable differences in behavioral tendencies across a population of animals (Wolf and Weissing, 2012), where an individual may express different personality traits such as boldness, fearfulness, aggressiveness, or sociability that together make up their overall personality. However, across the research fields of behavior and personality in non-human animals, there is a lack of consensus in terminology use. For example, behavioral ecology literature uses the term “behavioral syndrome” to refer to a collection of related behaviors consistently expressed across context and time (Sih et al., 2004), and the animal science field often uses the term “temperament” with an emphasis on fearfulness, but this also refers to the stable individual behavioral differences (Réale et al., 2007; Stamps and Groothuis, 2010). As personality traits, and personality itself, refer to a broader range of traits expressed by an individual, we use this terminology throughout, which also aligns with recent work in livestock (Koolhaas and Van Reenen, 2016; Neave et al., 2020). To measure and utilize personality traits in a population there must be variance in traits across the population (Kaiser and Müller, 2021). In cattle personality traits such as “fear” (Forkman et al., 2007), “boldness” (Foris et al., 2018), “exploratory” (Neave et al., 2020), “sociability” (Lecorps et al., 2018) and coping style in response to stress (Van Reenen et al., 2005) are related to stable individual characteristics that can be reliably measured.
The individual differences for these personality traits can impact how cows and calves handle the many transitions and stressors that they experience on a commercial dairy farm and relate to overall performance. For example, dairy cows that were calmer during a novel object test produced more milk and kicked less in the milking parlor (Hedlund and Løvlie, 2015). Additionally, dairy calves that were categorized as more “exploratory-active” during a novel environment test were shown to have a higher ADG and improved starter intake through weaning when compared with contemporaries (Neave et al., 2018). Beef cattle with a slower exit velocity when released from restraint in a chute had higher ADG (Bruno et al., 2016), steers that were easier to catch in a chute had increased marbling, and steers with a slow first exit velocity had higher meat quality (Hall et al., 2011). Together these studies support the concept that cattle differ in how they handle novel or stressful situations, and these differences relate to performance of these animals.
For a test to be sufficient to categorize animals based on personality traits, measured behavioral responses must vary among individuals in a population and be consistent through time and across situations (Kaiser and Müller, 2021). The most common tests used to measure personality traits in dairy calves are novelty tests which include a novel environment test, novel person test, and novel object test. Novelty tests have been shown to be consistent over time from the pre-weaning period through the first lactation in dairy cattle, with an exception at the onset of puberty (Neave et al., 2020). A startle (surprise) test has been shown to correlate with other personality tests that measure fear responses in heifers, such as novel environment and novel object tests (Boissy and Bouissou, 1995). In adult dairy cows, a puff of air used to startle the cow was shown to elicit reactions that were consistent through time (Schrader, 2002). The use of these standardized tests meets the requirements for characterizing personality traits in dairy cattle, but currently they are very intensive and not practical for on-farm use.
The isolation box test may be an alternative test that could quickly and efficiently categorize animals based on personality differences. Previously, the isolation box test was used to score sheep based on reactivity within a 1.5 m3 enclosed box by using a agitation meter to measure movement and counting vocalizations over a 1 min test period to assign agitation scores (Blache and Ferguson, 2005). The use of an isolation box test for sheep was shown to be highly repeatable and was successfully utilized to breed and select sheep based on personality trait classification (Blache and Ferguson, 2005). Additionally, the isolation box test was shown to be consistent across situations, with sheep that were more active within an isolation box test also being classified as more “active” during a motivation conflict test with a person between the sheep and their flock mates (Beausoleil et al., 2008). Highly reactive sheep in an isolation box had greater feed efficiency than less reactive sheep (Amdi et al., 2010). Dairy ewes that were more calm in an isolation box produced more milk (Murray et al., 2006, 2009), but there is conflicting evidence whether calmer ewes also produce more milk protein (Sart et al., 2004; Murray et al., 2009). The isolation box test is a valuable tool for producers to determine personality traits and select animals based on these traits (Blache and Ferguson, 2005) and relates to important measures of productivity. There may be potential to adapt this test for use in dairy calves to provide a quick and reliable test for personality traits.
Personality tests that are already established for use in dairy calves have demonstrated relationships between personality traits and both feed intake and growth through weaning (Neave et al., 2018). These measures are of particular importance to producers as both feed intake (Heinrichs and Heinrichs, 2011) and weight gain (Chester-Jones et al., 2017) through weaning have been shown to be positively associated with milk production later in life. A new personality test for dairy calves should also relate to these important production characteristics in early life to provide useful information about the individual. Thus, the relationship between a prototypal personality test—the isolation box test—and growth is worthy of investigation.
The objectives of this study were to develop and evaluate a test suitable for on-farm use to characterize personality traits of dairy calves. More specifically, we aimed to (1) characterize the distribution of individual behavioral responses in dairy calves measured using an isolation box test, (2) evaluate relationships between behaviors measured in an isolation box test and behavioral responses and personality traits derived from novel person, novel object, and startle tests, and (3) determine whether personality trait(s) derived from the isolation box test are related to growth through weaning.
Materials and Methods
All Holstein calves (n = 27) born at the University of Kentucky Coldstream Dairy were enrolled in the experiment at 4 d of age between January and December 2020 under the approval of the University of Kentucky's Institutional Animal Care and Use Committee (IACUC #: 2019-3374). Calves were excluded from enrollment if they were born with birth defects, were a triplet, or were born as a free martin.
Calf Management
Calves were removed from their dams within 6 h of birth and moved into a sawdust-bedded neonatal pen (3 × 3 m) within the calf barn for 4 d. Birth weights for all calves were recorded within 24 h of discovery. Within this period, calves received either maternal colostrum or colostrum replacer, standard vaccines, had their navel dipped in an iodine solution and received an ear tag. Also within this period calves were assessed via jugular venipuncture for passive immunoglobulin transfer with successful passive transfer defined as BRIX ≥ 8.4% (Deelen et al., 2014). At 4 d of age, calves were moved to a 4.6 × 10.6 m group pen bedded with wood shavings for the experimental period with 6 ± 3 other calves. The group pens were emptied, disinfected, and re-bedded with sawdust every 2 weeks. Calves placed in the group pen had an automatic milk and solid feed feeder system (CF100, Forster-Technik, Engen, Germany) where calves were fed their first meal with human assistance and were assisted twice daily (0900 and 1,700 h) until independent consumption was observed. The automatic feeder system recorded daily milk replacer and starter consumption through weaning. Calves were allotted up to 14 L (140 g/L) milk replacer/d (Cow's Match Cold Front; Land O' Lakes Animal Milk Products Co., Shoreview, MN) from the automated milk feeder until 45 d of age, reduced to 50% allotment for 14 d, and then reduced to 20% allotment for an additional 7 d until complete weaning at 67 d of age. Calves completed the study 2 weeks post-weaning, at 81 d of age. Both the automated milk feeder and the calf starter feeder were calibrated weekly according to manufacturer instructions. All calves had ad libitum access to an automated waterer and chopped alfalfa hay in troughs.
Calf starter and chopped alfalfa hay were sampled weekly and immediately frozen at −20°C. Later, the feed samples were weighed, dried in a forced air oven (Tru-Temp, Hotpack Corp., Philadelphia, PA) for 48 h at 55°C, and weighed again to calculate % dry matter. Dry samples were ground through a 1 mm sieve screen (Standard Model 3 Wiley Mill, Arthur H. Thomas Co., Philadelphia, PA), composited into monthly samples, and sent to a commercial laboratory (Rock River Lab, Watertown, WI) to determine nutrient composition (Supplementary Table 1). Briefly, starch was analyzed using the acetate buffer only method as validated by Hall (2009). Crude protein was analyzed according to the Dumas method with a N analyzer (FP-528; LECO, St. Joseph, MI, USA; Wiles et al., 1998). Crude fat, ash-free NDF, and ADF were calculated using Ankom Technology (Macedon, NY, USA). Crude fat was analyzed using high temperature ether extraction (Ramos, 2005). The ash-free NDF and ADF were analyzed using the cell wall fractionation method as described in detail by Surendra et al. (2018). The ME kcal/kg was calculated from chemical composition according to the equation TDN x 0.04409 x 0.82 (OARDC/NRC, 2001).
Performance Measures
Health examinations were performed daily at ~0830 h from 4 d of age until 2 weeks post-weaning following Cantor et al. (2021). Briefly, calves had rectal temperature taken and were assigned a score for respiratory disease and diarrhea during the daily health examination. If illness was detected according to the health scores, calves received treatment per standard procedures developed with the farm veterinarian and antibiotic treatments were recorded. Health information was utilized to control for disease in analyses regarding performance measures.
Weights were taken twice weekly from birth to 2 weeks post-weaning using an electronic scale (Brecknell PS1000, Avery Weigh-Tronix, LLC Brand, Fairmont, MN, USA). Average daily gain (ADG) was used as our main performance measure, which was calculated for the full milk allowance period (day of enrollment until day 45 of age; Pre-weaning ADG), stepdown milk period (day 46 until day 66 of age; Weaning ADG), no milk allowance period (day 67 until day 81 of age; Post-weaning ADG), and for the total experimental period from enrollment to 81 d of age (Total ADG).
Standardized Personality Tests
Calves were subjected to three traditional personality tests (novel person, novel object, and startle tests) and the isolation box test at 24 ± 3 d of age. The novel person and novel object tests were selected because they are commonly used to assess fear (Forkman et al., 2007), or exploration (Perals et al., 2017) in dairy cattle, and the startle test was selected to target a fear response to a sudden stimulus, which has previously been used in calves (Lauber et al., 2006). All behaviors from the novelty and startle tests were recorded via a camera (EXiR Turret Network Camera, Hangzhou Hikvision Digital Technology Co., CA, USA) mounted above the test arena. The test arena (4.88 m wide, 4.88 m long, 1.8 m tall), located in the calf barn, was an enclosed space with solid plywood walls, and bedded with wood shavings (Figure 1). During all tests, an observer sat outside the test arena out of sight of the calf and manually counted and recorded all audible vocalizations. Calves experienced all tests in a single day in the same order, with a 30-min rest period in their home pen in between each test.
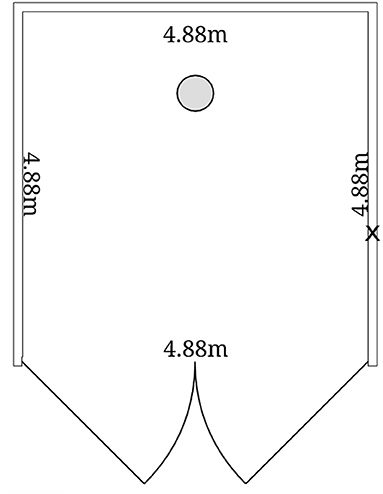
Figure 1. Diagram and dimensions of the test arena which is an enclosed space with solid plywood walls bedded with wood shaving located in the calf barn. The circle in the diagram represents the location of the novel person and novel object. The X in the diagram represents where the umbrella is located during the startle test. The doors to the test arena are seen open at the bottom of the diagram, with the entrance in the middle of the walls.
Novel Person and Novel Object Tests
Before the start of the personality tests, calves were given a solo 30 min habituation period in the test arena where no person or object was present. Calves were first subjected to a novel person test, where the calf was walked from the home pen to the test arena for a 10-min test period with an unfamiliar person dressed in a navy coveralls and wearing a navy baseball hat with their hands placed in their pockets and looking forward toward the entrance of the test arena. The novel person was positioned 1.22 m from the rear and centered between the left and right walls of the test arena (Figure 1). The novel person did not engage with the calf throughout the test period. At the end of the 10-min period the calf was walked back to the home pen for the rest period between tests. Calves were next subjected to the 10-min novel object test in the test arena; the novel object was a 94 L black bucket placed in the same position as the novel person. At the end of the 10-min period the calf was returned to the home pen for the rest period. The 10-min length of these tests was selected to allow as much time as possible for calves to choose to approach the human or object, but within practicalities of conducting several tests on multiple calves each day.
Video observations were recorded throughout each of these test periods. Additionally, an observer sat outside the test arena and manually counted and recorded audible vocalizations during the test period. The behaviors measured from the video were latency to approach novel person or novel object, time spent touching person or object, inactive, resting, attentive, playing, grooming, exploring the environment, and frequency of bucking, withdrawals and urination/defecation (see Table 1 for the ethogram).
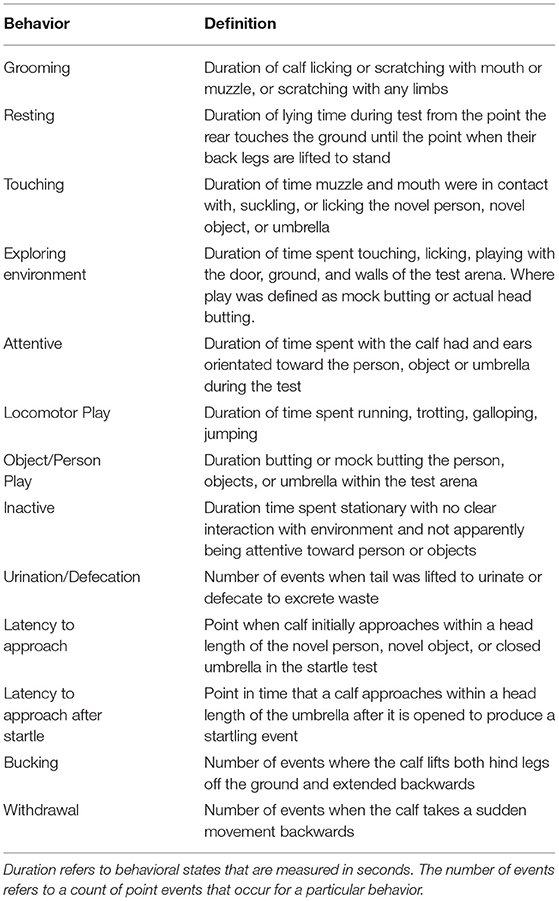
Table 1. Ethogram of behaviors recorded from the video of the standardized personality tests (novel person, novel object and startle tests) from calves (n = 27) tested individually at 24 ± 3 d of age.
Startle Test
The third test that calves were subjected was the startle test where a red umbrella was placed through a hole in the right wall of the test arena (Figure 1). The umbrella remained closed until the calf approached the umbrella or once 5 min elapsed without approach. Approach was defined as the calf being within a head length of the umbrella. After the umbrella was opened, calves were observed for a further 5 min which allowed the calf the opportunity to re-approach the umbrella, or approach for the first time if they failed to do so before the umbrella was opened.
Video observations were recorded throughout the startle test period. Additionally, an observer sat outside the test arena and manually counted and recorded audible vocalizations during the test period. Continuous sampling strategy was used on the calf of interest throughout the test period to record behaviors based on video observations. The behaviors that were measured from the video were latency to approach closed umbrella and after startle, time spent touching umbrella, time spent inactive, resting, attentive, playing, grooming, exploring the environment, and frequency of bucks, withdrawals and urination/defecation (Table 1). Only latency to approach the umbrella was recorded before the umbrella was opened to ensure that the behavioral measures were for the same test period length across all calves. If a calf did not approach the umbrella before it was opened at 5 min, then latency to approach was recorded as 5 min. If calves did not re-approach the umbrella after it was opened, this latency was recorded as 5 min from the time the umbrella was opened.
Video recordings from the novelty and startle tests were watched by a single observer using an ethogram to record the respective behaviors described above. Behaviors were observed using behavioral coding software (The Observer XT 14, Noldus Information Technology, Wageningen, and The Netherlands).
Isolation Box Test Procedures
After the startle test, calves were subjected to the final test in the series, an isolation box test. The isolation box was a metal frame enclosed in plywood and sealed with insulator foam to block out the light. The design and implementation of the isolation box test was based on the traditional box tests used in sheep (Murphy et al., 1994) with modifications to make appropriate for use with calves and to operate within our facilities. The frame of the isolation box was supported by two legs in the front of the box and wheels at the rear (Figure 2). The internal compartment of the box was 1 m high, 1.4 m long, and 0.6 m wide. A door on the front of the isolation box allowed the calf to enter and exit. To record movements of the calf within the isolation box, five 3-axis g-force accelerometers (HOBO Pendant® G Data Logger, ONSET, Bourne, MA, USA) were affixed to the back, left, right, top-front and top-back exterior surfaces of the box (Figure 2).
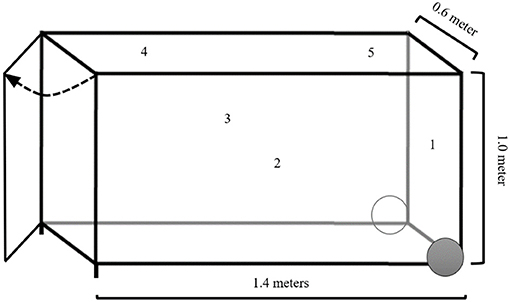
Figure 2. Diagram and the dimensions of the isolation box and the location of the accelerometers on the outside of the box. The positions on the outside of the isolation box for the accelerometers are (1) back, (2) left, (3) right, (4) top-front, and (5) top-back.
At the time of testing, calves were moved from their home pen to the isolation box where their rear was faced toward the door of the isolation box. The isolation box was then shaken as a start signal for the accelerometers fixed to the isolation box. The calf was pushed backwards into the isolation box and a 5-min timer was started with the close of the isolation box door. During the test, the observer manually counted and recorded all vocalizations. Additionally, the observer recorded any incidence of urination or defecation by checking the floor of the box at the end of the test. At the end of 5 min, the door to the isolation box was opened and the calf was permitted to exit and assisted by the observer if necessary. The isolation box was shaken a second time as a stop signal at the end of the test. The raw data from the accelerometers utilized for the isolation box test were plotted to check for irregularities (such as any shift of the axes) and to identify the start and stop signal that marked the test period. The start time of the isolation box observations was immediately after the start signal of the test and after loading of the calf into the box was completed. Only the 480 observations (240 s) immediately following the start signal of the test period for each accelerometer were included for analysis; this was to ensure the number of observations were consistent across calves and to trim any movement caused by removing the calf from the isolation box.
Statistical Analysis
All statistical analyses were performed with SAS (version 9.4; SAS Inst. Inc., Cary, NC) with the calf as the experimental unit. Additionally, R (version 4.1.0; https://www.R-project.org/) was utilized to create graphs and visualizations (package: ggplot2). The data were scrutinized using the UNIVARIATE procedure and probability distribution plots in SAS.
Before analysis, duration and frequencies of behaviors [grooming, resting, touching (person, object, umbrella), exploring the environment, attentive (person, object, umbrella), playing, inactive, urination/defecation, withdrawals, bucking] were summed across the novel person, novel object and startle tests, with the exception of variables measuring latencies. All variables were transformed to achieve normality if required (either log10 or square root transformations that achieved an adequate normal distribution). The variable resting was removed from the analysis because it was rarely observed and not able to achieve normality as a variable. Frequencies of urination/defecation, bucking, and withdrawals were too few to be meaningfully included for analysis.
We chose a correlational multivariate analysis approach (principal component analysis; PCA) to explore and extract common sets of behaviors across the different personality tests, following Costa et al. (2020). The PCA included 9 input variables: time exploring environment, time touching, time attentive, time playing, time inactive, and latency to approach the object, person, closed umbrella and open umbrella after the startle. The variables walking and inactive measured opposite traits and so only time spent inactive was retained in the PCA because we predicted it would reflect freezing/inactive behavior within the isolation box test. To achieve a sampling adequacy of 0.50 (Kaiser-Meyer-Olkin Measure of Sampling Adequacy test), the variable time spent grooming was removed due to a low communality estimate (<0.30). The correlational matrix was computed, and Eigenvalues >1 and following scree plot evaluation were retained. Orthogonal (varimax) rotation was applied to the factors to aid in interpretation of the high loadings on each principal component, referred to as factors (considered as ≥ ± 0.63; Comrey and Lee, 2013). Subjective interpretation of the meaning of these correlated sets of behaviors was guided by literature to assign labels to these sets of behaviors, which were meant to assist in interpretation of personality traits for dairy calves. Factor scores for each calf were extracted using the regression method and utilized for further analysis. The analysis and reporting guidelines for the PCA followed Budaev (2010).
To characterize behavioral responses of calves during the isolation box test from the accelerometers attached to the isolation box, the mode of acceleration measures for each axis of the 5 accelerometers was found for each calf to determine the baseline position for each axis. The area under the curve was calculated by subtracting the mode from the acceleration of each observation. These values were then squared to account for the negative values to only look at the magnitude of movements, and all values from axes from all accelerometer positions on the box were summed to create a total movement index (TMI) for each calf. Data for 3 calves were removed from the analysis due to malfunctions with the accelerometers; tests were performed with and without the malfunctioned accelerometers data and results were similar.
The purpose of this study was to develop a new personality test; thus, it was of interest to see how the isolation box TMI related to behaviors expressed in the traditional personality tests. To examine these relationships, Pearson's correlations were performed between the TMI and behaviors that were retained in the PCA for the traditional tests. Correlation coefficients were categorized following Dancey and Reidy (2007) as 0.00 to 0.30 = weak; 0.30 to 0.60 = moderate; 0.60 to 1.0 = strong.
To determine whether factor scores from the traditional tests could be used to predict scores in the isolation box test, a linear regression was performed (PROC MIXED); scores on each factor from the PCA were the explanatory variables, and TMI from the isolation box test was the response variable. Birth weight, sex, age of calf on test day, test day weight, and BRD score on test day were initially included as fixed effects but were removed from the model using backwards elimination if P > 0.3. The F-value and P-value for each model for the explanatory factors are reported. This statistical approach allowed us to determine whether the isolation box test measured the same behavior expressed in other contexts, a requirement of a personality test in animals.
To investigate the relationship between performance during rearing (ADG) and scores in the isolation box test and traditional tests, linear regressions were performed (PROC MIXED); the TMI or factor scores from the traditional tests were the explanatory variables, and ADG at each period (total ADG, pre-weaning ADG, weaning ADG, and post-weaning ADG) were the response variables. Birth weight, sex, age of calf on test day, and BRD score on test day were included as fixed effects. Additionally, prior treatment with antibiotics (yes or no) was included as a fixed effect in this model as a control for incidence of disease through weaning. Fixed effects were removed from the model using backwards elimination if P > 0.3. All findings were considered significant if P < 0.05. Additionally, the test statistics are reported as Fdegrees of freedom.
Results
Principal Component Analysis
The behavioral responses of calves across the novel person, novel object, and startle tests are presented in Table 2 and the loading of the behaviors for each factor are given in Table 3. Factor 1 explained 25.4% of total variance and had high positive loadings for time spent attentive, latency to approach novel person, latency to approach umbrella after startle, and a moderate negative loading for time spent touching the person, object or umbrella. Calves that loaded highly for factor 1 were labeled “fearful.” Factor 2 explained 21.0% of total variance and had high negative loadings for latency to approach the novel object, had a high positive loading for time spent playing with person, object, and umbrella, and a moderate positive loading for time spent touching the person, object, and umbrella. Calves that loaded highly for factor 2 were labeled “bold.” Factor 3 explained 15.6% of total variance and had high positive loadings for time interacting with the environment, and high negative loadings for time inactive. Calves that loaded highly for factor 3 were labeled “active.”
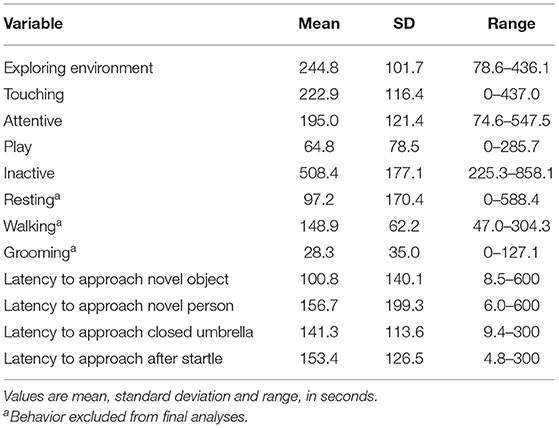
Table 2. Time spent performing each behavior measured in the traditional personality tests (novel person, novel object and startle test).
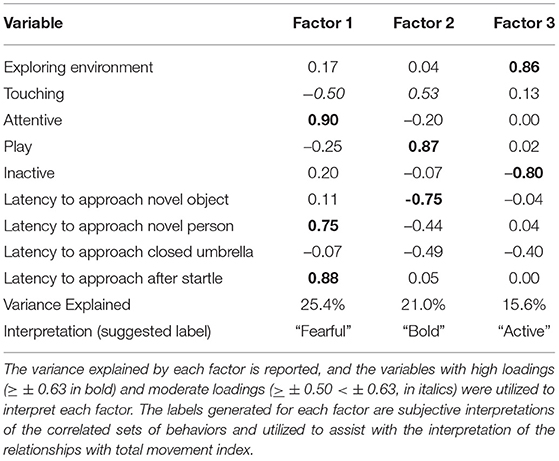
Table 3. Coefficient loadings of each variable on the 3 factors extracted from the principal component analysis of behavioral responses in the traditional personality tests.
Comparing Isolation Box Test and Traditional Personality Tests
The distribution of the individual TMI scores ranged from 2.34 to 53.8 TMI and can be found in Figure 3. The TMI score was found to be moderately positively skewed (0.94) and to show a platykurtic tailed distribution (mean kurtosis, MK = −0.42). The correlations between the TMI and the time individuals spent performing each of the behaviors scored in the 3 traditional personality tests can be found in Table 4. TMI had a relationship with specific behaviors expressed during the traditional personality tests; TMI had a moderate negative correlation with time spent exploring during the traditional tests, and a moderate positive correlation with the time spent inactive (Table 4), indicating that a calf that had a high TMI (more active in responses to the isolation box test) spent less time exploring the environment during traditional standardized tests, and spent more time stationary and not attentive to the person, object or umbrella. There were no significant correlations between other recorded behaviors in the traditional personality tests and TMI.
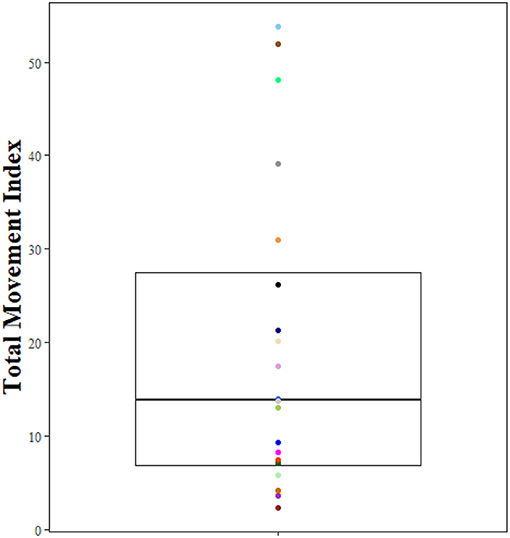
Figure 3. Boxplot showing the median (line) and interquartile range (box) of the distribution of the total movement index calculated for each calf from the isolation box test. Each color represents an individual calf.
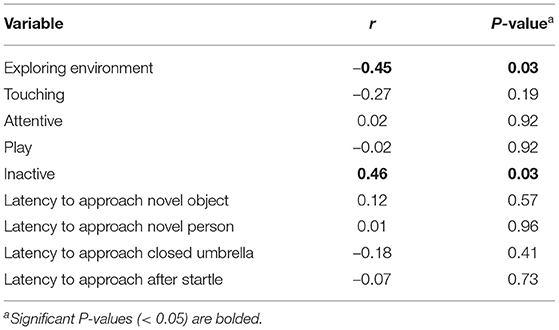
Table 4. Pearson's correlations between behavioral variables measured in each of the traditional personality tests (novel person, novel object and startle test) and total movement index measured in the isolation box test.
TMI was also able to reflect personality traits interpreted from a PCA from the traditional personality tests. The distribution of individual TMI from the isolation box test are plotted against each factor score from the traditional personality tests (Figure 4). TMI had a significant negative association with factor 3 (“active”) (F1,20 = 4.91; P = 0.04), indicating that calves who were more active in the isolation box spent less time exploring the test arena during the traditional standardized tests, and more time was spent inactive. There were no significant associations between TMI and factor 1 (“fearful”) (F1,20 = 0.37; P = 0.55), or factor 2 (“bold”) (F1,20 = 1.49; P = 0.24).
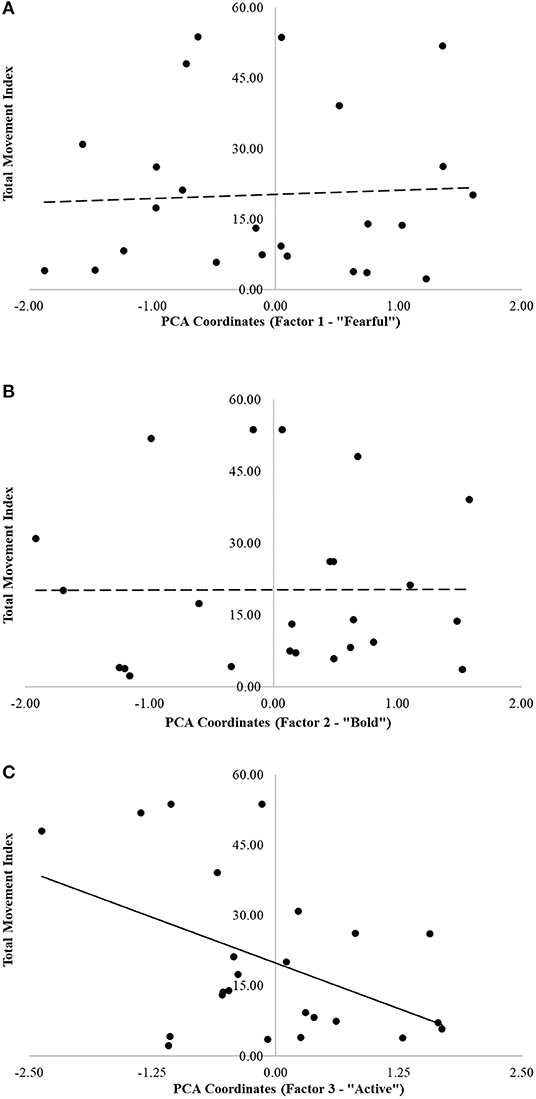
Figure 4. (A–C) Distribution of individual calf total movement index from the isolation box test plotted against each factor of the principal component analysis of the traditional personality tests: (A) Factor 1 (“Fearful”), (B) Factor 2 (“Bold”), and (C) Factor 3 (“Active”). The linear regression trendline is presented for each plot (solid black line = significant regression, P < 0.05; dashed line = non-significant regression, P > 0.05).
Personality and Performance Measures
The ADG over the total experiment varied widely among individual calves (mean total ADG of 0.89 ± 0.29 kg); variability for each of the pre-weaning, weaning and post-weaning periods can be found in Figure 5. Individual total ADG was plotted against the TMI scores from the isolation box test and each factor of the traditional personality tests PCA in Figures 6, 7, respectively. The relationships between the TMI from the isolation box test, and the factor scores for calves with the ADG in the four periods can be found in Table 5. There were significant positive linear associations between TMI and both Pre-weaning and Total ADG. Factor 1 (“fearful”) had a positive linear association with the Pre-weaning ADG. Factor 2 (“bold”) had positive linear association with Weaning and Total ADG. Finally, Factor 3 (“active”) had negative linear associations with Pre-weaning ADG, Weaning ADG, and the Total ADG.
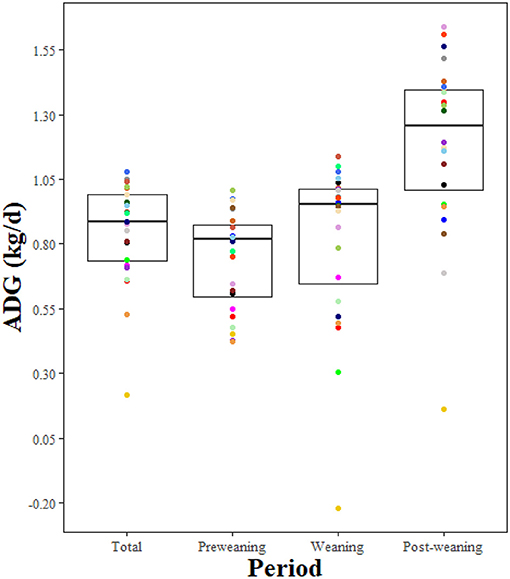
Figure 5. Boxplots showing the median (line) and interquartile range (box) of the average daily gain (ADG) for all calves for each rearing period: enrollment in the study to unenrollment (Total), the full milk allowance period (Pre-weaning ADG), the stepdown milk period (Weaning), and the no milk allowance period (Post-weaning). Each color represents an individual calf.
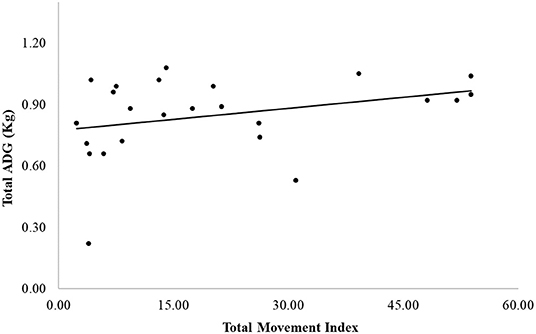
Figure 6. Distribution of individual calf average daily gain (ADG) from birth until 2-weeks after weaning (Total ADG) plotted against each the total movement index from the isolation box test. The linear regression trendline is presented for the plot (solid black line = significant regression, P < 0.05; dashed line = non-significant regression, P > 0.05).
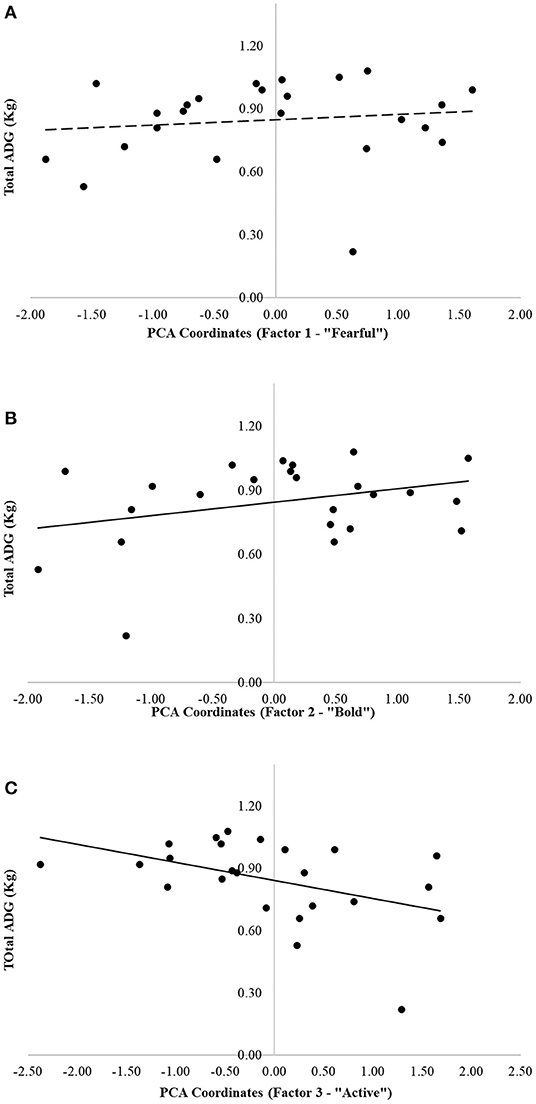
Figure 7. (A–C) Distribution of individual calf average daily gain (ADG) from birth until 2-weeks after weaning (Total ADG) plotted against each factor from the principal component analysis of the traditional personality tests: (A) Factor 1 (“Fearful”), (B) Factor 2 (“Bold”), and (C) Factor 3 (“Active”). The linear regression trendline is presented for each plot (solid black line = significant regression, P < 0.05; dashed line = non-significant regression, P > 0.05).
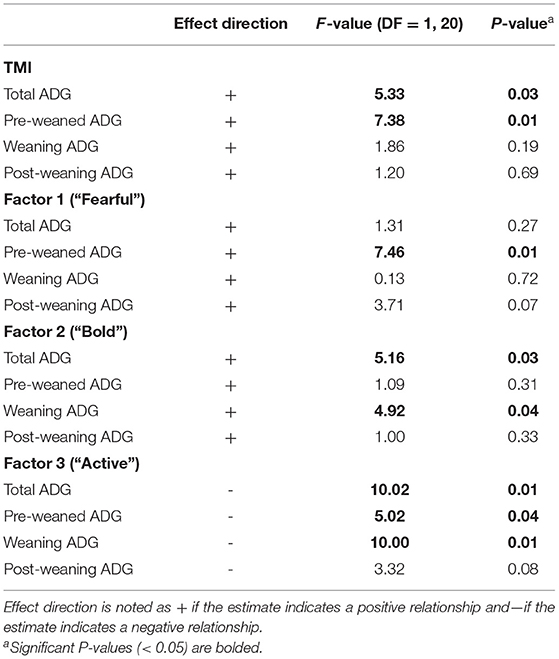
Table 5. Relationship between ADG for each rearing period with total movement index (TMI) from the isolation box test and the factor scores extracted from the principal component analysis (containing behaviors from the standardized personality tests: novel person, novel object, and startle tests).
Discussion
The study aims were to investigate the use of an isolation box test to characterize personality traits of dairy calves, to determine if behavioral measures from an isolation box test reflected personality traits measured with a novel person, novel object, and startle tests, and to identify potential relationships between measures of personality and ADG. Individual variation in movement of calves within the isolation box, as quantified by our total movement index (TMI), was negatively associated with the PCA factor labeled “active” from novel person, novel object, and startle tests. Additionally, calves with a higher TMI had higher ADG during the pre-weaning period and across the total experimental period. Our results indicate that an isolation box test is practical for use with dairy calves and can measure the expression of a personality trait labeled as “active.” Furthermore, measures of behaviors within an isolation box were related to growth performance through weaning indicating potential value of this relatively simple test for predicting personality-related variation in production responses.
Isolation Box Test
Isolation box tests have been utilized in sheep for decades to measure individual variation in response to isolation and restraint (Murphy, 1999; Beausoleil et al., 2008). The first requirement of a personality test is that it permits measurement of individual differences in behavioral response in a population (Kaiser and Müller, 2021). Regarding this criterion, we saw considerable variation in the TMI of calves in response to the isolation box test. Individual variation in response to a form of restraint is seen in other tests in cattle, including for subjective chute scores of beef and dairy cattle (Hoppe et al., 2010; Gibbons et al., 2011) and objective chute scores utilizing the coefficient of variation of weight on a scale to measure beef cattle movement (Bruno et al., 2016). The variation in the response to the isolation box test is due to differences in how calves respond to isolation and restraint in a dark enclosed space. Also, we found a moderately positively skewed distribution of TMI. We can argue that it indicates that the distribution of movement of the calves with greater movement is accentuated in comparison to the one with little movement. Although the personality trait measured with the isolation box tests must still be defined, it was negatively related to our “active” personality trait determined from PCA analysis of results from standard personality tests. Further studies should investigate other characteristics of the TMI and its distribution.
A second requirement for a personality test to be valid is that it agrees with other tests intended to measure the same personality traits, and therefore is measuring a personality trait consistently across contexts (Carter et al., 2013; Kaiser and Müller, 2021). The comparison between traditional personality tests and the isolation box test should aid interpretation of the personality trait being measured by this new application of a personality test for dairy calves. The other personality tests utilized in this study included novel person, novel object, and startle tests that were expected to measure exploration, fearfulness, and activity in individuals (Forkman et al., 2007; Réale et al., 2007; Yuen et al., 2017). In sheep, there have been associations found between the isolation box test and other standardized personality tests. Sheep that were more active in an isolation box also were more active within an arena test and investigated a stationary person sooner when compared to their less active counterparts (Beausoleil et al., 2008). Therefore, we expected that calves that were more active in the isolation box test would be more active within the traditional standardized personality tests and would have shorter latencies to approach the novel person. In our study, we indeed saw an association between the TMI and factor 3, “active.” This association between the isolation box test and the traditional personality tests suggests that the same behavior is expressed between contexts, and that the tests measure an underlying personality trait that we interpreted as “active.” However, contrary to our hypothesis and the findings of Beausoleil et al. (2008) with sheep, there was a negative association between TMI and “active” for calves in the present study. Calves that had a higher TMI (were more active within the box) spent less time exploring the environment and more time inactive. This finding is supported by the positive correlation between TMI and time inactive and the negative correlation between TMI and time spent exploring the environment. This may indicate that calves that were highly reactive to the isolation box (i.e., showed greater movement when in a very confined space) were those that reacted to novelty and a startle by limiting their movement (i.e., more inactive).
The differences seen between our study and Beausoleil et al. (2008) may be due to differences in the behavioral measures of activity and in the tests administered. Factor 3 in our study was interpreted as “active” as the general level of activity in the presence of novelty (person or object), which could influence the response of these animals. Calves that scored highly on factor 3 spent more time interacting with the ground and walls of the test arena and less time stationary. Beausoleil et al. (2008) interpreted activity level of sheep in the arena test as zones crossed, which was not recorded during our tests. Thus, differences in the test construction and methods of assessment likely had some influence on detected relationships between isolation box activity levels and other measures of “active” behavior. However, it seems unlikely that these differences would have resulted in a complete reversal of the nature of the relationship.
A more likely reason for the study differences may be due to species differences, as similar outcomes to ours have been seen in beef cattle. In beef cattle assessed for objective chute scores (coefficient of variation of weight readings by a scale while steers were restrained in a chute), steers with higher objective chute score (more active) were less active within their home pen as measured by ear-tag mounted accelerometers (Bruno et al., 2016). These results, coupled with results of the present study, suggest an inverse relationship between activity expressed in response to restraint and activity expressed in open environments in cattle.
The lack of significant relationship between TMI and the other two factors (“fearful” and “bold”) in our study reveals that the isolation box test may not be measuring a fear response. Both factor 1 (“fearful”) and factor 2 (“bold”) have high loadings for behaviors that relate to how calves interact with novelty, specifically regarding calf latencies to approach and time spent interacting with the novel person, novel object, and umbrella from the startle tests. Unlike Beausoleil et al. (2008), we did not see a relationship between the latency to approach the human with the outcomes of the isolation box test. Additionally, the novel person, novel object, and startle tests are commonly considered fear tests in cattle (Boissy and Bouissou, 1995; Forkman et al., 2007). Our findings suggest that the isolation box test is related to activity and exploration of dairy calves in novel situations but perhaps not to a fear response.
Our study was limited in its ability to test the consistency of the isolation box test through time, which is another key requirement of a personality test (Carter et al., 2013; Kaiser and Müller, 2021). The isolation box we used was too restrictive for a weaned calf. Future research with a box designed to accommodate calves throughout their development period would permit determination of repeatability with this test. However, the requirements that the isolation box test shows individual variation and consistency across contexts was met in this study. While determination of repeatability is necessary to confirm the isolation box test to be a valid personality test, the relationship between a single isolation box measure and productivity of the individual at a single time point remains of most value for application on-farm.
Performance of Dairy Calves
Beyond testing the validity of the isolation box test as a personality test for dairy calves, we wanted to determine if the responses were related to performance through weaning. Although the meal allowance and feed availability were consistent across all enrolled calves, there was large variation in the weight gains of calves. As seen in other studies we still found a great variation of ADG after taking into account the influence of feed intake and meal plans (de Passillé et al., 2011; Neave et al., 2018). A myriad of factors are associated with variation in ADG of dairy calves, including genetic potential (Coffey et al., 2006), disease (Buczinski et al., 2021), passive transfer of immunity (Elsohaby et al., 2019), and milk and starter availability (Rosenberger et al., 2017). An association of particular interest is the relationship between the personality and ADG in dairy calves: calves that were more “exploratory-active” within standardized personality tests had greater ADG during the period of milk reduction for weaning and overall testing period (Neave et al., 2018, 2019). We predicted that personality measured from the new isolation box test or the traditional standardized personality tests could be associated with the performance of the calves. Indeed, a positive association between ADG and TMI from the isolation box test was found. A similar result was found in beef steers, where ADG was greater in animals that scored a higher objective score in the chute (i.e., greater movement, interpreted as greater reactivity, during restraint; Bruno et al., 2018). However, these findings with the objective chute score are not typical of relationships seen between subjective chute scores and ADG (Voisinet et al., 1997; Turner et al., 2011; Bates et al., 2014). The relationship between TMI and performance likely represents complex relationships between personality traits and the calves' experiences and ability to learn where, how and what to eat.
The positive relationship found between ADG and TMI in the isolation box, a measure of activity during restraint, may be due to stable individual differences in energy expenditure and feeding behaviors that would contribute to growth. We did not measure feed intake or feed efficiency in this study, but we examined how TMI in the isolation box (a movement index) was related to another measure of activity. Contrary to expectation, TMI was negatively associated with factor 3 (“active”) measured in the traditional personality tests. In other studies, we observed that calves that were less active in novel environment, novel object, and novel person tests had increased consumption of novel feed (Costa et al., 2020), and that less active calves in these tests had improved feed efficiency (Neave et al., 2019). Future work should investigate how activity measured in different contexts has differing relationships with growth, feeding behavior, and nutrient utilization.
Associations between ADG and the factors derived from the PCA of the traditional personality tests were also found. Calves that loaded highly for factor 1 (“fearful”) had greater ADG during the pre-weaning period. Calves that loaded highly for factor 2 (“bold”) had greater total ADG and during the period of milk stepdown. Both factor 1 and factor 2 describe the interaction of the calf with novelty, and together appear to represent the shy-bold personality trait spectrum (Réale et al., 2007). Factor 1 (“fearful”) from our study includes many of the same (but inversed) behaviors as the first factor “interactive” from Neave et al. (2018), indicating that our relationship between the expression of fearfulness/interactivity in the face of novelty agrees with the relationship found by Neave et al. (2018). Additionally, we found that calves that loaded highly for Factor 3 (“active”) had a lower ADG overall, during full milk allowance and during milk stepdown. Neave et al. (2018) also found that calves that were more inactive had a greater ADG during milk stepdown. This relationship may arise due to conserved energy expenditure allowing for improved growth, similar to our suggestion regarding the relationship between TMI and ADG. Alternatively, Müller and von Keyserlingk (2006) demonstrated a negative correlation between time inactive in a social isolation test (similar to an open field test) and ADG in beef heifers.
Activity in other studies has often been measured by looking at the number of quadrants/zones crossed, typically in an open field or novel environment test (Müller and von Keyserlingk, 2006; Beausoleil et al., 2008; Neave et al., 2018). However, our study did not include a novel environment test which limits our interpretation of activity outcomes from our study. The differences in behaviors recorded and personality tests administered may explain some of the discrepancies seen between our study and existing research. A key difference is that in Neave et al. (2018) the “inactivity” measure loaded on a different factor from the exploration measure (while these two measures loaded together on the same factor in our study). Importantly, our measure of exploration and inactivity was derived from behavioral responses during the novel object and novel human tests, while exploration in Neave et al. (2018) was measured during the novel environment test only. This result suggests that relationship between ADG and exploration is related to the context in which exploration is measured. Regardless, both their study and ours demonstrate an association between personality and growth in dairy calves. This relationship was able to be measured with the isolation box test in dairy calves.
There is potential to measure a personality trait that is associated with performance in dairy calves using an isolation box test. With more development, this simplified test could be useful for on-farm use by producers. Future research should focus on the consistency of the isolation box test TMI scores through time, as we were unable to verify this during our study due to the restrictive size of the box for older individuals. Finally, future research should examine computer learning models to accompany the isolation box test to assign TMI, allowing the findings to be more useful to producers without knowledge of statistical software.
Conclusion
An isolation box test was able to measure variation in the behavioral response of dairy calves to restraint and isolation. The total movement index for calves calculated from the isolation box test was associated with personality trait scores related to activity which were derived from novel person, novel object, and startle tests. These results suggest that the isolation box test has potential to be utilized as a personality test in dairy calves. Additionally, outcomes from the isolation box tests were associated with growth of calves through weaning, indicating that the isolation box tests could be a useful tool for producers. This is an initial exploration of a new personality test that with further research may become a tool for producers to select calves on the basis of personality and possible associations with another phenotypical traits.
Data Availability Statement
The datasets presented in this study can be found in online repositories. The names of the repository/repositories and accession number(s) can be found at: 10.17632/6gsrdyv48d.1.
Ethics Statement
The animal study was reviewed and approved by University of Kentucky's Institutional Animal Care and Use Committee (IACUC #: 2019-3374).
Author Contributions
MW and JC: conceptualization, writing—original draft preparation, and methodology. MW: writing original draft and investigation. MW, HN, EV, and JC: review and editing. MW, HN, and JC: formal analysis and visualization. JC: resources, project administration, and supervision. All authors contributed to the article and approved the submitted version.
Funding
The research for this study was funded by a United States Department of Agriculture NIFA Hatch Grant Project KY007100 at the University of Kentucky.
Conflict of Interest
HN was employed by AgResearch Ltd., a crown research institute that conducts scientific research for the benefit of New Zealand, with no commercial or financial interest in the study.
The remaining authors declare that the research was conducted in the absence of any commercial or financial relationships that could be construed as a potential conflict of interest.
Publisher's Note
All claims expressed in this article are solely those of the authors and do not necessarily represent those of their affiliated organizations, or those of the publisher, the editors and the reviewers. Any product that may be evaluated in this article, or claim that may be made by its manufacturer, is not guaranteed or endorsed by the publisher.
Acknowledgments
We would like to start by thanking the staff at the University of Kentucky's Coldstream Dairy Research Farm (Lexington, KY) especially Matt Collins, Chris French, and Paden Tackett that provided care for the calves. Next, we would like to thank the students who volunteered their time to assist conducting personality tests and health scores throughout this study: Jason Simmons, Madison Snedigar, Emily Michalski, Abby Varney, and Kennedy Edwards. A special thanks to the other members of this research group who were a large part in making this study possible: Gustavo Mazon, Melissa Cantor, and Emily Rice.
Supplementary Material
The Supplementary Material for this article can be found online at: https://www.frontiersin.org/articles/10.3389/fanim.2022.770755/full#supplementary-material
References
Amdi, C., Williams, A., Maloney, S., Tauson, A., Knott, S., and Blache, D. (2010). Relationship between behavioural reactivity and feed efficiency in housed sheep. Animal Production Sci. 50, 683–687. doi: 10.1071/AN09142
Bates, K. E., Weaber, R. L., Bormann, J. M., Moser, D. W., Salak-Johnson, J., Chase, C., et al. (2014). Temperament can be an indicator of feedlot performance and carcass merit in beef cattle. In: Cattlemen's Day, Manhattan, KS, 7 March. 2014. Kansas State Univ. Agric. Exp. Stn. Coop. Ext. Serv. 2014, 34–38. doi: 10.4148/2378-5977.1458
Beausoleil, N. J., Blache, D., Stafford, K. J., Mellor, D. J., and Noble, A. D. (2008). Exploring the basis of divergent selection for 'temperament' in domestic sheep. Appl. Animal Behav. Sci. 109, 261–274. doi: 10.1016/j.applanim.2007.03.013
Blache, D., and Ferguson, D. (2005). Increasing Sheep Meat Production Efficiency and Animal Welfare by Selection for Temperament. Part A. Final report to Meat and Livestock Australia on Project SHGEN. North Sydney: Meat & Livestock Australia Limited.
Boissy, A., and Bouissou, M.-F. (1995). Assessment of individual differences in behavioural reactions of heifers exposed to various fear-eliciting situations. Appl. Animal Behav. Sci. 46, 17–31. doi: 10.1016/0168-1591(95)00633-8
Bruno, K., Vanzant, E., Vanzant, K., Altman, A., Kudupoje, M., and McLeod, K. (2018). Relationship between quantitative measures of temperament and other observed behaviors in growing cattle. Appl. Animal Behav. Sci. 199, 59–66. doi: 10.1016/j.applanim.2017.10.009
Bruno, K., Vanzant, E., Vanzant, K., and McLeod, K. (2016). Relationships of a novel objective chute score and exit velocity with growth performance of receiving cattle. J. Animal Sci. 94, 4819–4831. doi: 10.2527/jas.2016-0438
Buczinski, S., Achard, D., and Timsit, E. (2021). Effects of calfhood respiratory disease on health and performance of dairy cattle: A systematic review and meta-analysis. J. Dairy Sci. 104, 8214–8227. doi: 10.3168/jds.2020-19941
Budaev, S. V. (2010). Using principal components and factor analysis in animal behaviour research: caveats and guidelines. Ethology 116, 472–480. doi: 10.1111/j.1439-0310.2010.01758.x
Cantor, M. C., Renaud, D., and Costa, J. H. (2021). Nutraceutical intervention with colostrum replacer: Can we reduce disease hazard, ameliorate disease severity, and improve performance in pre-weaned dairy calves? J. Dairy Sci. 104, 7168–7176. doi: 10.3168/jds.2020-19654
Carter, A. J., Feeney, W. E., Marshall, H. H., Cowlishaw, G., and Heinsohn, R. (2013). Animal personality: what are behavioural ecologists measuring? Biol. Rev. 88, 465–475. doi: 10.1111/brv.12007
Chester-Jones, H., Heins, B., Ziegler, D., Schimek, D., Schuling, S., Ziegler, B., et al. (2017). Relationships between early-life growth, intake, and birth season with first-lactation performance of Holstein dairy cows. J. Dairy Sci. 100, 3697–3704. doi: 10.3168/jds.2016-12229
Coffey, M., Hickey, J., and Brotherstone, S. (2006). Genetic aspects of growth of Holstein-Friesian dairy cows from birth to maturity. J. Dairy Sci. 89, 322–329. doi: 10.3168/jds.S0022-0302(06)72097-5
Comrey, A. L., and Lee, B. L. (2013). A First Course in Factor Analyis. New York, NY: Psychology Press. doi: 10.4324/9781315827506
Costa, J. H., Neave, H. W., Weary, D. M., and von Keyserlingk, A. M. (2020). Use of a food neophobia test to characterize personality traits of dairy calves. Sci. Rep. 10, 1–11. doi: 10.1038/s41598-020-63930-8
Dancey, C. P., and Reidy, J. (2007). Statistics Without Maths for Psychology. Harlow: Pearson/Prentice Hall.
de Passillé, A. M., Borderas, T. F., and Rushen, J. (2011). Weaning age of calves fed a high milk allowance by automated feeders: Effects on feed, water, energy intake behavioral signs of hunger, weight gains. J. Dairy Sci. 94, 1401–1408. doi: 10.3168/jds.2010-3441
Deelen, S. M., Ollivett, T. L., Haines, D. M., and Leslie, K. E. (2014). Evaluation of a Brix refractometer to estimate serum immunoglobulin G concentration in neonatal dairy calves. J. Dairy Sci. 97, 3838–3844. doi: 10.3168/jds.2014-7939
Elsohaby, I., Cameron, M., Elmoslemany, A., McClure, J., and Keefe, G. (2019). Effect of passive transfer of immunity on growth performance of pre-weaned dairy calves. Canadian. J. Vet. Res. 83, 90–96.
Foris, B., Zebunke, M., Langbein, J., and Melzer, N. (2018). Evaluating the temporal and situational consistency of personality traits in adult dairy cattle. PLoS ONE 13, e0204619. doi: 10.1371/journal.pone.0204619
Forkman, B., Boissy, A., Meunier-Salaün, M.-C., Canali, E., and Jones, R. B. (2007). A critical review of fear tests used on cattle, pigs, sheep, poultry and horses. Physiol. Behav. 92, 340–374. doi: 10.1016/j.physbeh.2007.03.016
Gibbons, J. M., Lawrence, A. B., and Haskell, M. J. (2011). Consistency of flight speed and response to restraint in a crush in dairy cattle. Appl. Animal Behav. Sci. 131, 15–20. doi: 10.1016/j.applanim.2011.01.009
Hall, M. B. (2009). Determination of starch, including maltooligosaccharides, in animal feeds: Comparison of methods and a method recommended for AOAC collaborative study. J. J. AOAC Int. 92, 42–49. doi: 10.1093/jaoac/92.1.42
Hall, N. L., Buchanan, D. S., Anderson, V. L., Ilse, B. R., Carlin, K. R., and Berg, E. P. (2011). Working chute behavior of feedlot cattle can be an indication of cattle temperament and beef carcass composition and quality. Meat Sci. 89, 52–57. doi: 10.1016/j.meatsci.2011.03.020
Hedlund, L., and Løvlie, H. (2015). Personality and production: Nervous cows produce less milk. J. Dairy Sci. 98, 5819–5828. doi: 10.3168/jds.2014-8667
Heinrichs, A. J., and Heinrichs, B. (2011). A prospective study of calf factors affecting first-lactation and lifetime milk production and age of cows when removed from the herd. J. Dairy Sci. 94, 336–341. doi: 10.3168/jds.2010-3170
Hoppe, S., Brandt, H. R., König, S., Erhardt, G., and Gauly, M. (2010). Temperament traits of beef calves measured under field conditions and their relationships to performance1. J. Animal Sci. 88, 1982–1989. doi: 10.2527/jas.2008-1557
Kaiser, M. I., and Müller, C. (2021). What is an animal personality? Biol. Philosophy 36, 1–25. doi: 10.1007/s10539-020-09776-w
Koolhaas, J., and Van Reenen, C. (2016). Animal behavior and well-being symposium: Interaction between coping style/personality, stress, and welfare: Relevance for domestic farm animals. J. Animal Sci. 94, 2284–2296. doi: 10.2527/jas.2015-0125
Lauber, M. C. Y., Hemsworth, P. H., and Barnett, J. L. (2006). The effects of age and experience on behavioural development in dairy calves. Appl. Animal Behav. Sci. 99, 41–52. doi: 10.1016/j.applanim.2005.10.009
Lecorps, B., Kappel, S., Weary, D. M., and von Keyserlingk, M. A. (2018). Dairy calves' personality traits predict social proximity and response to an emotional challenge. Sci. Rep. 8:16350. doi: 10.1038/s41598-018-34281-2
Müller, R., and von Keyserlingk, M. A. (2006). Consistency of flight speed and its correlation to productivity and to personality in Bos taurus beef cattle. Appl. Animal Behav. Sci. 99, 193–204. doi: 10.1016/j.applanim.2005.05.012
Murphy, P., Purvis, I., Lindsay, D., Le Neindre, P., Orgeur, P., and Poindron, P. (1994). “Measures of temperament are highly repeatable in Merino sheep and some are related to maternal behaviour,” in In 20th Biennial Conference of Australian Society of Animal Production, Vol. 20 (Perth: Australian Society of Animal Production), 247–250.
Murphy, P. M. (1999). Maternal Behaviour and Rearing Ability of Merino Ewes Can Be Improved by Strategic Feed Supplementation During Late Pregnancy and Selection for Calm Temperament. Dissertation. University of Western Australia.
Murray, T., Blache, D., and Bencini, R. (2006). Calm Dairy Ewes Produce More Milk Than Nervous Dairy Ewes. School of Animal Biology, The University of Western Australia, Stirling Highway, Crawley WA.
Murray, T., Blache, D., and Bencini, R. (2009). The selection of dairy sheep on calm temperament before milking and its effect on management and milk production. Small Ruminant Res. 87, 45–49. doi: 10.1016/j.smallrumres.2009.10.005
Neave, H. W., Costa, J. H., Benetton, J., Weary, D. M., and von Keyserlingk, A. M. (2019). Individual characteristics in early life relate to variability in weaning age, feeding behavior, and weight gain of dairy calves automatically weaned based on solid feed intake. J. Dairy Sci. 102, 10250–10265. doi: 10.3168/jds.2019-16438
Neave, H. W., Costa, J. H., Weary, D. M., and von Keyserlingk, A. M. (2018). Personality is associated with feeding behavior and performance in dairy calves. J. Dairy Sci. 101, 7437–7449. doi: 10.3168/jds.2017-14248
Neave, H. W., Costa, J. H., Weary, D. M., and von Keyserlingk, A. M. (2020). Long-term consistency of personality traits of cattle. R. Soc. Open Sci. 7:191849. doi: 10.1098/rsos.191849
Perals, D., Griffin, A. S., Bartomeus, I., and Sol, D. (2017). Revisiting the open-field test: what does it really tell us about animal personality? Anim. Behav. 123, 69–79. doi: 10.1016/j.anbehav.2016.10.006
Ramos, A. A. (2005). Rapid Determination of Oil/Fat Utilizing High Temperature Solvent Extraction. Champagne, IL: American Oil Chemists Society (AOCS).
Réale, D., Reader, S. M., Sol, D., McDougall, P. T., and Dingemanse, N. J. (2007). Integrating animal temperament within ecology and evolution. Biol. Rev. 82, 291–318. doi: 10.1111/j.1469-185X.2007.00010.x
Rosenberger, K., Costa, J. H. C., Neave, H. W., von Keyserlingk, M. A. G., and Weary, D. M. (2017). The effect of milk allowance on behavior and weight gains in dairy calves. J. Dairy Sci. 100, 504–512. doi: 10.3168/jds.2016-11195
Sart, S., Bencini, R., Blache, D., and Martin, G. (2004). Calm ewes produce milk with more protein than nervous ewes. Anim. Soc. Prod. Sci. 25, 307.
Schrader, L. (2002). Consistency of individual behavioural characteristics of dairy cows in their home pen. Appl. Animal Behav. Sci. 77, 255–266. doi: 10.1016/S0168-1591(02)00075-8
Sih, A., Bell, A. M., Johnson, J. C., and Ziemba, R. E. (2004). Behavioral syndromes: an integrative overview. Q. Rev. Biol. 79, 241–277. doi: 10.1086/422893
Stamps, J., and Groothuis, T. G. (2010). The development of animal personality: relevance, concepts and perspectives. Biol. Rev. 85, 301–325. doi: 10.1111/j.1469-185X.2009.00103.x
Surendra, K., Ogoshi, R., Zalesk, H. M., Hashimoto, A. G., and Khanal, S. K. (2018). High yielding tropical energy crops for bioenergy production: Effects of plant components, harvest years and locations on biomass composition. Bioresour. Technol. 251, 218–229. doi: 10.1016/j.biortech.2017.12.044
Turner, S., Navajas, E., Hyslop, J., Ross, D., Richardson, R., Prieto, N., et al. (2011). Associations between response to handling and growth and meat quality in frequently handled Bos taurus beef cattle. J. Animal Sci. 89, 4239–4248. doi: 10.2527/jas.2010-3790
Van Reenen, C. G., O'Connell, N. E., Van der Werf, J. T., Korte, S. M., Hopster, H., Jones, R. B., et al. (2005). Responses of calves to acute stress: individual consistency and relations between behavioral and physiological measures. Physiol. Behav. 85, 557–570. doi: 10.1016/j.physbeh.2005.06.015
Voisinet, B., Grandin, T., Tatum, J., O'connor, S., and Struthers, J. (1997). Feedlot cattle with calm temperaments have higher average daily gains than cattle with excitable temperaments. J. Animal Sci 75, 892–896. doi: 10.2527/1997.754892x
Wiles, P. G., Gray, I. K., Delahanty, C., Evers, J., Greenwood, K., Grimshaw, K., et al. (1998). Routine analysis of proteins by Kjeldahl and Dumas methods: review and interlaboratory study using dairy products. J. AOAC Int. 81, 620–632. doi: 10.1093/jaoac/81.3.620
Wolf, M., and Weissing, F. J. (2012). Animal personalities: consequences for ecology and evolution. Trends Ecol. Evol. 27, 452–461. doi: 10.1016/j.tree.2012.05.001
Keywords: temperament, behavioral characterization, individual differences, coping style, welfare
Citation: Woodrum Setser MM, Neave HW, Vanzant E and Costa JHC (2022) Development and Utilization of an Isolation Box Test to Characterize Personality Traits of Dairy Calves. Front. Anim. Sci. 3:770755. doi: 10.3389/fanim.2022.770755
Received: 04 September 2021; Accepted: 10 January 2022;
Published: 09 February 2022.
Edited by:
Rafael Freire, Charles Sturt University, AustraliaReviewed by:
Hayley Randle, Charles Sturt University, AustraliaCourtney L. Daigle, Texas A&M University, United States
Copyright © 2022 Woodrum Setser, Neave, Vanzant and Costa. This is an open-access article distributed under the terms of the Creative Commons Attribution License (CC BY). The use, distribution or reproduction in other forums is permitted, provided the original author(s) and the copyright owner(s) are credited and that the original publication in this journal is cited, in accordance with accepted academic practice. No use, distribution or reproduction is permitted which does not comply with these terms.
*Correspondence: Joao H. C. Costa, Y29zdGFAdWt5LmVkdQ==