 Zhenshuang Tang1,2
 Jingya Xu1,2
 Lilin Yin1,2
 Dong Yin1,2
 Mengjin Zhu1,2
 Mei Yu1,2Xinyun Li1,2
 Shuhong Zhao1,2
 Xiaolei Liu1,2*
- 1Key Laboratory of Agricultural Animal Genetics, Breeding and Reproduction, Ministry of Education & College of Animal Science and Technology, Huazhong Agricultural University, Wuhan, China
- 2Key Laboratory of Swine Genetics and Breeding, Ministry of Agriculture, Huazhong Agricultural University, Wuhan, China
Improvement of the growth rate is a challenge in the pig industry, the Average Daily Gain (ADG) and Days (AGE) to 100 kg are directly related to growth performance. We performed genome-wide association study (GWAS) and genetic parameters estimation for ADG and AGE using the genomic and phonemic from four breed (Duroc, Yorkshire, Landrace, and Pietrain) populations. All analyses were performed by a multi-loci GWAS model, FarmCPU. The GWAS results of all four breeds indicate that five genome-wide significant SNPs were associated with ADG, and the nearby genomic regions explained 4.08% of the genetic variance and 1.90% of the phenotypic variance, respectively. For AGE, six genome-wide significant SNPs were detected, and the nearby genomic regions explained 8.09% of the genetic variance and 3.52% of phenotypic variance, respectively. In total, nine candidate genes were identified to be associated with growth and metabolism. Among them, TRIB3 was reported to associate with pig growth, GRP, TTR, CNR1, GLP1R, BRD2, HCRTR2, SEC11C, and ssc-mir-122 were reported to associate with growth traits in human and mouse. The newly detected candidate genes will advance the understanding of growth related traits and the identification of the novel variants will suggest a potential use in pig genomic breeding programs.
Introduction
Growth rate is a vital economic trait and significantly affected pig production (Fontanesi et al., 2014; Ding et al., 2018). It is usually measured by Average Daily Gain (ADG), which is average daily weight gain within a certain period as well as Age (AGE) that adjusted to a certain weight. ADG and AGE are directly related to the pig growth and commonly used in pig breeding. Both traits are in moderate heritability and can be efficiently selected by modern breeding techniques (Hoque et al., 2007).
Many growth traits relevant candidate genes were identified since the development of sequencing technology. Up to now, 609 Quantitative Trait Loci (QTLs) were reported that associated with ADG and AGE (Hu et al., 2016). Previous researches have shown a series of candidate genes of ADG and AGE. XIRP2 and MC4R gene were reported that associated with both ADG and residual feed intake (RFI) in pure Duroc population (Onteru et al., 2013; Do et al., 2014). The SOGA1 gene and ZFPM2 gene were identified to associate with both ADG and AGE in pure Duroc population (Do et al., 2014; Meng et al., 2017). The IGSF3 and IGF2 gene were detected to associated with ADG in an Italian Large White pig population (Van Laere et al., 2003; Fontanesi et al., 2014).
The genetic architectures of growth traits are usually complex and generally controlled by multiple gene. With the developments of cost effective genotyping technology, Genome-wide association study (GWAS) has been widely used for mapping candidate genes of complex traits (Cantor et al., 2010; Korte and Farlow, 2013). Mixed linear model (MLM), which simultaneously incorporates principal components as fixed effects and individual additive effects as random effects, has become one of the most popular models used in GWAS (Yu et al., 2006). Multiple algorithms have been developed to boost both the computational efficiency and statistical power of MLM methods (Kang et al., 2008; Zhou and Stephens, 2012). However, previous studies indicated that the confounding problem decreased the power of MLM for detecting candidate genes that associated with population structure, especially in a population with explicit population structure. Many GWAS analyses for growth traits were carried out in single breed with limited sample size (Ding et al., 2018). Therefore, the candidate genes that contributed to the variation among breeds were always missed. Our previous study introduced FarmCPU method, which is a multiple loci model and split the MLM into separated fixed effect model and random effect model and iteratively uses above two models (Liu et al., 2016). A series of studies in both livestock and plant indicated that FarmCPU detected more candidate genes by solving the confounding problem (Kaler et al., 2017; Kusmec et al., 2017; Meng et al., 2017; Wang et al., 2018).
In this study, GWAS was conducted in a population of 4,865 pigs composed of four pure breeds (Duroc, Yorkshire, Landrace, and Pietrain) for mapping candidate genes underlying ADG and AGE traits. Estimation of genetic parameters, such as heritability was also carried out. The detected candidate genes, potential breeding markers, and the better understanding on genetic architectures of ADG and AGE will benefit breeding programs.
Materials and Methods
Animals and Phenotypes
Animals used in this study were from two isolated farms, and composed of four pure breeds, including Duroc, Yorkshire, Landrace, and Pietrain (Supplementary Table S1). ADG and AGE were measured from 70 to 115 kg, and then adjusted to 100 kg. AGE was adjusted to 100 kg using formula below:
where correction factors are different for sire and dam, and the formulas are shown below:
ADG was calculated by following equation:
In total, 31,173 phenotypic observations from farm 1 and 24,374 phenotypic observations from farm 2 were recorded. Tail and ear tissue samples were collected and preserved with 75% alcohol and were stored in −20°C freezers.
Genotyping, Imputation, and Quality Control
Genomic DNA was extracted from frozen collected ear tissue samples using Tecan Freedom EVO NGS workstation and TIANGEN magnetic animal tissue genomic DNA kit. DNA samples with concentration ≥40ng/μl, quantity ≥ 1 μg, and passed gel electrophoresis test were used for genotyping. A total of 4,865 DNA samples, including 1,595 samples from farm 1 and 3,270 samples from farm 2 were genotyped by Illumina PorcineSNP50 Bead Chip, which includes 50,697 SNPs, and all SNP markers were mapped to Sus scrofa genome build 11.1 (Ramos et al., 2009). The data in PLINK binary format is available at https://figshare.com/articles/pig-growth-data_zip/7533020.
Missing genotype data were fully imputed by FImpute version 2.2 (Sargolzaei et al., 2014). Data quality control was performed by PLINK and G2P software before and after imputation (Chang et al., 2015; Tang and Liu, 2019). The data was filtered by genotype call rate >0.9, Minor Allele Frequency (MAF) < 0.01, and individuals with SNP marker call rate <0.9 and missing phenotypic records were also removed. The remaining data was used for the subsequent analysis (Supplementary Table S1).
Estimation of Genetic Parameters
Genetic parameters, including genetic variance, residual variance, and heritability were estimated using Average Information - Restricted Maximum Likelihood algorithm (AI-REML) in an R procedure (Gilmour et al., 1995). The parameters were estimated by three methods, including pedigree-based Best Linear Unbiased Prediction (aBLUP), genomic BLUP (gBLUP), and single-step BLUP (ssBLUP) (Henderson, 1975; VanRaden, 2008; Aguilar et al., 2010). All BLUP models can be written as:
where y is a vector of phenotypic observations; b and u represent fixed effects and breeding values, respectively; X and Z were design matrices for b and u, respectively; e represents the residual error vector with a normal distribution of , where I was an identity matrix and is residual variance. In aBLUP model, , in which is additive genetic variance and A is an additive genetic relationship matrix that derived from pedigree records; In gBLUP model, A is replaced by G and , G is derived from genomic information and can be constructed by VanRaden method:
where M is a m×n standardized genotype matrix, m is the marker size and n is the number of genotyped individuals, pi is the minor allele frequency of the ith genetic marker; In ssBLUP method, and the relationship matrix H is derived from both pedigree records and genomic information simultaneously using the following equation:
Individuals are assigned to different groups based on available information. The group with footer 1 represents individuals that only have pedigree information and group with footer 2 represents individuals that have both pedigree and genomic information. The A11 and A22 represent the relationship among individuals within group 1 and group 2, respectively, A12 represents the relationship among individuals between group 1 and group 2 and A21 is the transpose of A12, α is the ratio for combing G and A22 matrix and set to 0.05 in this study.
Genome-Wide Association Study
Association tests were performed by a multi loci model, FarmCPU (Liu et al., 2016). FarmCPU model iteratively uses fixed effect model and random effect model. The top three columns of principal components, sex, farm effects, and pseudo QTNs (Quantitative Trait Nucleotides) were added as covariates in the fixed effect model for association tests and the model can be written as:
where y is phenotypic observation vector; P is a matrix of fixed effects, including top three principal components, sex, and farm effects; Mt is the genotype matrix of t pseudo QTNs that used as fixed effects; bp and bt are the relevant design matrices for P and Mt, respectively; Si is the ith marker to be tested and dj is the corresponding effect; e is the residual effect vector and . Random effect model is used for selecting the most appropriate pseudo QTNs. The model is written as:
where y and e stay the same as in fixed effect model; u is the genetic effect and , in which K is the relationship matrix that defined by pseudo QTNs.
The Bonferroni correction threshold for multiple tests was used for detecting the genome-wide significant SNPs, which defined as α/K (α = 0.05 and K is the number of SNPs) (Nicodemus et al., 2005).
Variance Explained by Candidate Regions
Candidate region is defined as the genomic region that located within 1 Mb upstream and downstream of the genome-wide significant SNPs. The proportion of genetic variance and phenotypic variance explained by candidate regions are estimated in a mixed linear model with multiple random effects. The model can be written as:
where y, Xb, and e are the same as described in 2.3. ui represents the ith random effect and , in which ki and represent the variance covariance matrix and variance of the ith random effect, respectively.
In this study, k1 is a relationship matrix that defined by all SNPs within the candidate regions and k2 is constructed by the rest of SNPs. The ratio between and the sum of and is defined as the proportion of genetic variance explained by candidate regions. The proportion of phenotypic variance explained by candidate regions can be calculated as the ratio between and the phenotypic variance. Additionally, the variance explained by randomly selected genomic regions was recognized as null distribution and compared with the variance explained by the candidate regions.
Identification of Candidate Genes
The candidate genes nearby the genome-wide significant SNPs were identified by Ensembl database using the gene annotation information of Sus scrofa genome version v11.1 (www.ensembl.org/biomart/). The genomic locations were downloaded from https://www.animalgenome.org/pig/ and genes within the candidate region are considered as candidate genes.
Results
Summary Information of Phenotype Data, Genotype Data, and Population Structure
Summary statistics of both ADG and AGE were analyzed and shown in Table 1 and Supplementary Table S2. Both traits followed normal distribution and phenotypic distribution is plotted in Supplementary Figure S1. The genotype data of the four breeds includes 4,260 individuals with 47,157 SNPs and SNP density plot of each chromosome is shown in Supplementary Figure S2. Principal component analysis (PCA) was carried out and the scatterplot of the first two principal components are displayed in Supplementary Figures S3, S4.
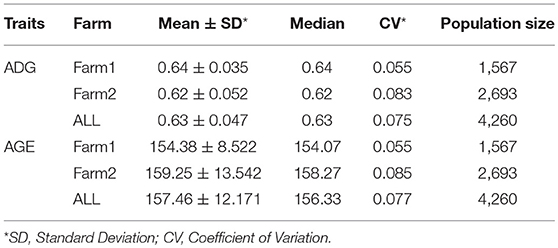
Table 1. Summary statistics of ADG and AGE that adjusted to 100 kg for all breeds.
Estimation of Genetic Parameters
Genetic variance, residual variance, and heritability of ADG and AGE that adjusted to 100 kg on two farms were estimated by AI-REML using three models for data of all four breeds. Heritability was calculated by dividing genetic variance with the sum of genetic variance and residual variance. All estimated genetic parameters are shown in Table 2. The heritability estimations by the three methods are ranged between 0.408 and 0.562, and 0.444 and 0.572 for ADG and AGE, respectively. The results indicate that the heritabilities of ADG and AGE in two farms are similar and Farm2 has higher phenotypic variation compared with Farm1.
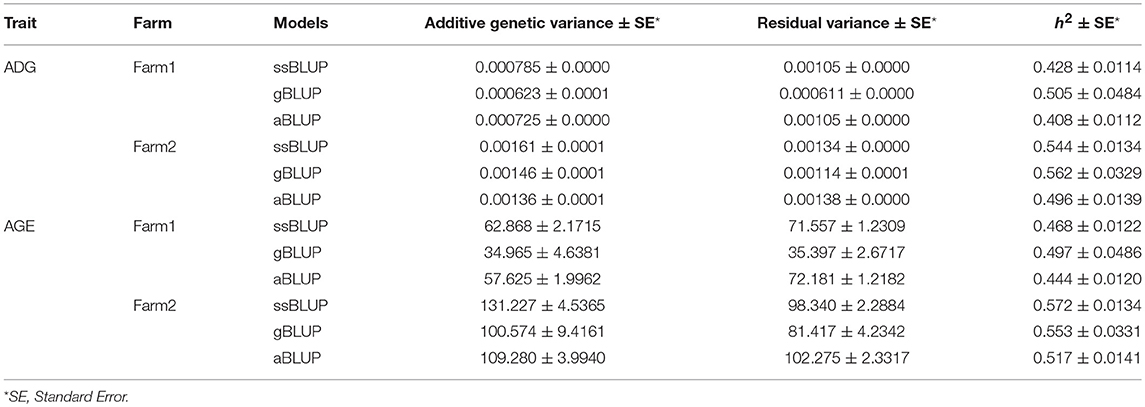
Table 2. Estimation of genetic parameters for ADG and AGE that adjusted to 100 kg.
GWAS Results of ADG and AGE for All Breeds
For ADG trait, 5 genome-wide significant SNPs were detected and the candidate regions are located on chromosome 1, 3, 6, 10, and 13 (Figure 1). Linkage disequilibrium (LD) analysis was conducted using pooling data of the four breeds and the LD decay is shown in Supplementary Figure S5. The results indicate that LD decay tends to be stable when the distance is 1Mb. Therefore, genes that located within 1 Mb nearby the significant SNPs are defined as candidate genes. The detailed information of top ten significant SNPs, including SNP ID, Chromosome (Chr), Physical positions, P-value, and candidate genes are provided in Table 3.
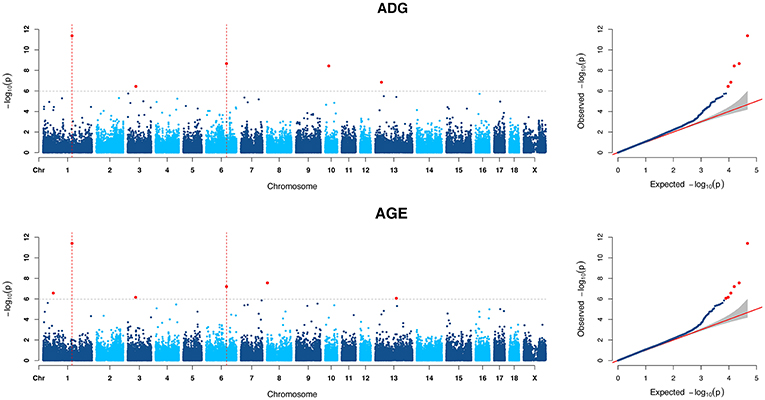
Figure 1. Manhattan plots and Quantile-Quantile (QQ) plots of both ADG and AGE traits for all breeds. The points of genome-wide significant SNPs are colored in red. There are two SNPs that detected in both traits are marked with dotted lines.
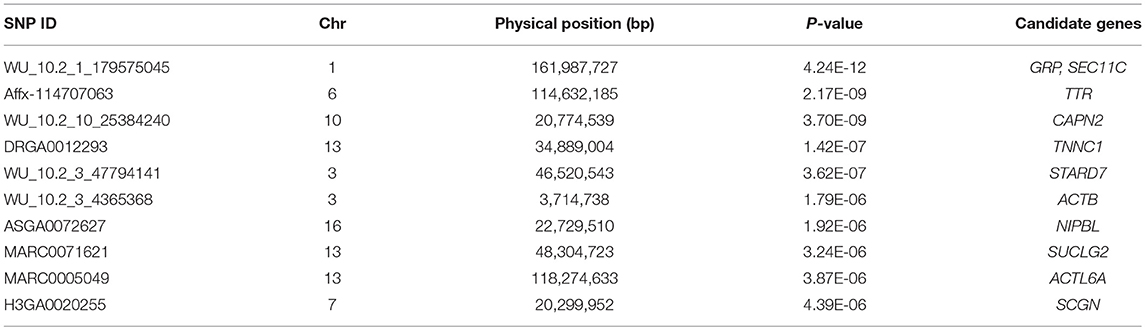
Table 3. Summary information of top 10 significant SNPs for ADG trait.
We consider the genomic region that located within 1 Mb distance on either side of the significant SNPs as candidate region. For ADG, the five candidate regions explained 4.08 and 1.90% of the genetic and phenotypic variance, respectively. In contrast, a randomly selected five regions across the whole genome repeated for 50 times, on average, five randomly selected genomic regions could only explain 0.663 and 0.311% of the genetic and phenotypic variance, respectively. The detailed information is shown in Table 4.
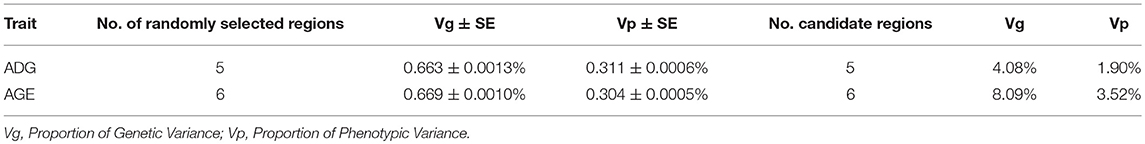
Table 4. The proportion of genetic variance and phenotypic variance explained by candidate regions.
Six genome-wide significant SNPs were detected in AGE trait and detailed information of top ten significant SNPs is shown in Table 5. These candidate genomic regions explained 8.09 and 3.52% of the total genetic and phenotypic variance for AGE, respectively. In comparison, a randomly selected six regions across the whole genome repeated for 50 times, on average, can only explained 0.669 and 0.304% of the genetic variance and phenotypic variance (Table 4), respectively. Due to the genetic correlation between ADG and AGE, two SNPs that located on chromosome 1 and chromosome 6 are detected in both traits and marked with dotted line in Figure 1.
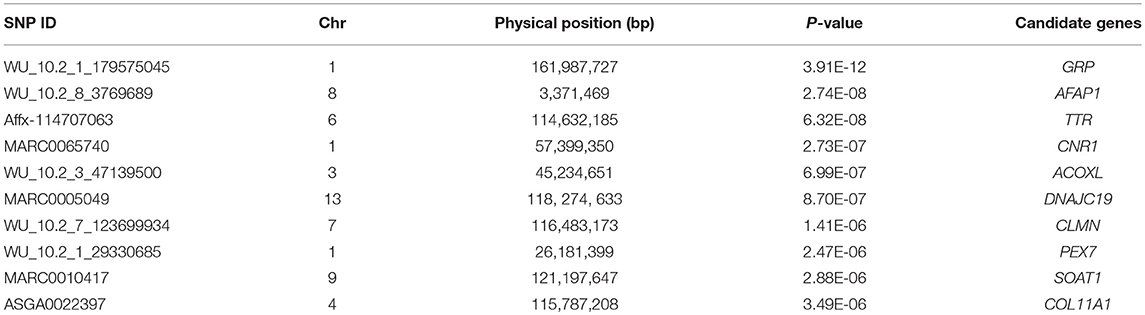
Table 5. Summary information of top ten significant SNPs for AGE trait.
GWAS Results of ADG and AGE for Single Breed
GWAS analyzes for single breed were also carried out. Six genome-wide significant SNPs were detected for both ADG and AGE traits by Duroc population (Figure 2, Supplementary Table S3). Among the significant SNPs detected by Duroc population, there are two signals are consistent with the genome-wide significant SNPs detected by the data of all breeds. GWAS results of Landrace, Yorkshire, and Pietrain are displayed in Figures 3–5. The detailed information of top ten significant SNPs detected by the single breed population are shown in Supplementary Tables S4–S6.
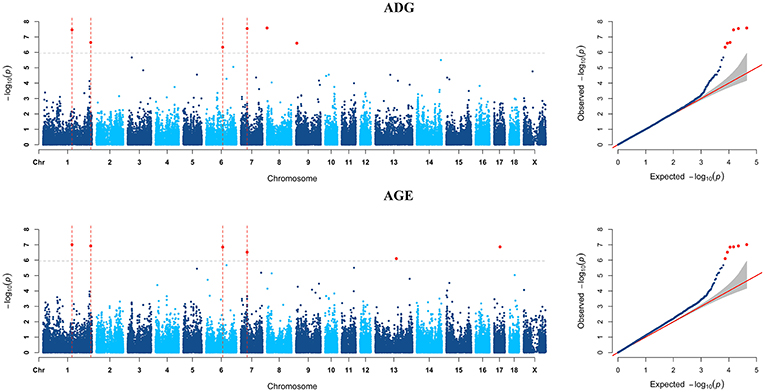
Figure 2. Manhattan plots and Quantile-Quantile (QQ) plots for both ADG and AGE traits of Duroc breed. The signals of genome-wide significant SNPs are colored in red. There are four SNPs that detected in both traits are marked with dotted lines.
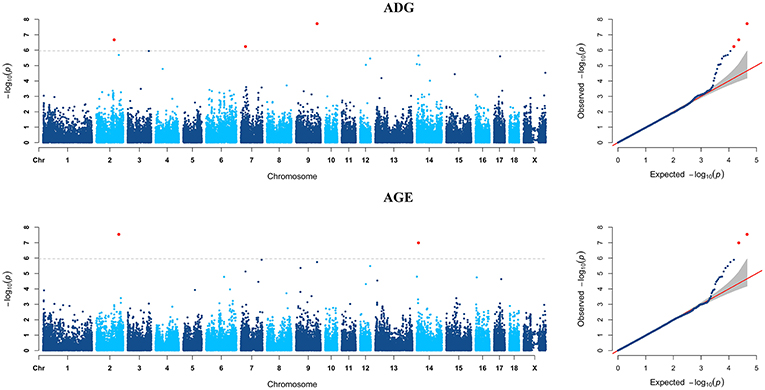
Figure 3. Manhattan plots and Quantile-Quantile (QQ) plots for both ADG and AGE traits of Landrace breed. The signals of genome-wide significant SNPs are colored in red.
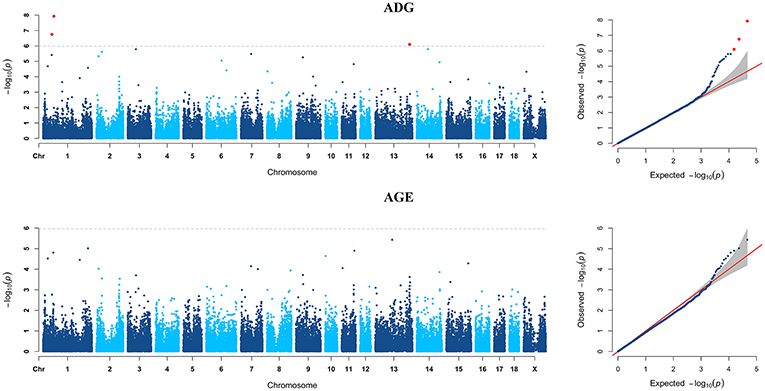
Figure 4. Manhattan plots and Quantile-Quantile (QQ) plots for both ADG and AGE traits of Yorkshire breed. The signals of genome-wide significant SNPs are colored in red.
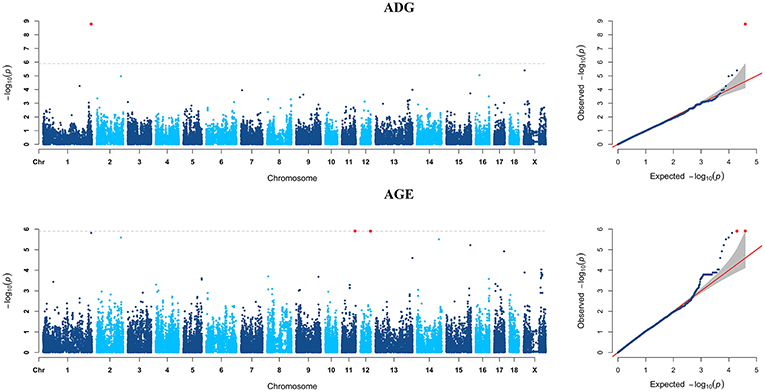
Figure 5. Manhattan plots and Quantile-Quantile (QQ) plots for both ADG and AGE traits of Pietrain breed. The signals of genome-wide significant SNPs are colored in red.
Discussion
Most target economic traits in livestock are quantitative traits and usually with a complex genetic architectures. Therefore, revealing the candidate genes underlying these traits is always the attractive area of research in livestock genetics and breeding (Goddard and Hayes, 2009; Hou and Zhao, 2013). Since the GWAS research on age-related macular degeneration of the retina was published, GWAS has become one of the most popular method for identifying candidate genes that associated with target traits (Klein et al., 2005). With the developments of commercialized high density SNP Chips for multiple livestock species, the GWAS has been widely used in livestock research and breeding (Zhang et al., 2012; Wang et al., 2017). In this study, the ADG and AGE traits of pigs from two separated farms were obtained. A population of 5,000 individuals of four pure breeds were genotyped by 50K SNP Chip. For all breeds, a total of 4,260 individuals with 47,157 SNPs were used for association tests using the FarmCPU method, which is a multi-loci GWAS model. For both ADG and AGE, nine genome-wide significant SNPs were detected using data of all four breeds, including two common detected signals. The candidate regions were evaluated in a mixed linear model with multiple random effects for the variance contribution and explained about 4–8% of the genetic variance and 2–3% of the phenotypic variance.
ADG and AGE are perfectly correlated after take the log transformation. A trait and its inverse values or log transformation values take different assumptions for the genetic architectures. For a trait with complex genetic architecture, common used hypothesis assume that the effects of genes are linear. However, there exist some restrictions of the phenotype and some genes that don't directly affect the trait may also restrict its maximum or minimum. The effects of genes are not always equally contributed to every level of the trait and the effects of genes are non-linear sometimes. The linear assumption fits perfectly near the average value of traits, but it may lose its fitness near the boundary of the trait. The non-linear assumption utilizes the information near boundary more effectively. Due to the inverse relationship of ADG and AGE, the analyzes on both traits seem like to use different modeling way to detect the candidate genes underlying the pig growth rate. From the results, we can also see that ADG and AGE have some common detected signals and some disagreements were also found as well.
The heritabilities of both ADG and AGE traits were estimated by three models including aBLUP, gBLUP and ssBLUP using the pooling data of the four breeds. The heritabilities of ADG and AGE traits are 0.41~0.56 and 0.44~0.57, respectively. Previous research also reported that ADG is a moderate heritability trait and its heritability is approximately 0.45~0.49 in a Duroc population (Gilbert et al., 2007; Hoque et al., 2009). Comparing the heritabilities that estimated by three models, the standard error of gBLUP model is higher than the other two models because of the small genotyped population size (Gutierrez et al., 2018). The ssBLUP method utilizes the pedigree and genomic information simultaneously and the estimated genetic parameters are theoretically more accurate (Meuwissen et al., 2016).
Using data of all breeds, there are two SNPs detected in both ADG and AGE traits, which are WU_10.2_1_179575045 on chromosome 1 and Affx-114707063 on chromosome 6. GRP, SEC11C (SEC11 homolog C), and ssc-mir-122 were identified in the nearby candidate regions on chromosome 1. GRP is a regulatory neuropeptide that stimulates gastric G cells to release gastrin and regulate gastric acid secretion and intestinal movement, which affects the food intake and may lead to anorexia, bulimia, and obesity if lacked of the genes (Merali et al., 1999). SEC11C is a homolog of SEC11, which is the only essential factor for signal peptide processing and plays an important role in protein processing, localization, and secretion. The lack of SEC11 will cause serious growth defects (Bohni et al., 1988). The ssc-mir-122 is a highly evolutionarily conserved miRNA and it is an important regulator of lipid metabolism (Esau et al., 2006). A previous experiment shows that the weight and cholesterol levels are increased with the decreased expression of ssc-mir-122 by feeding high-level cholesterol feed to mini pigs (Cirera et al., 2010). Previous published researches also verified that MC4R and GTF3C5 that located on chromosome 1, are candidate genes for growth traits (Onteru et al., 2013; Quan et al., 2018). For Affx-114707063 SNP on chromosome 6, the identified nearby candidate gene is TTR, which is the main carrier of thyroid hormone (T4) and plays an important role on growth and energy metabolism (Richardson et al., 2007). The concentration of TTR in the blood can be used to assess nutritional status. Because of its short half-life, the concentration can better reflect the nutritional levels of recent dietary intake (Shenkin, 2006). Some researches verified that PGM1 (Phosphoglucomutase-1) and FTO (Fat mass and obesity-associated protein) that located on chromosome 6 significantly affected muscle development and obesity, respectively (Onteru et al., 2013; Fontanesi et al., 2014).
The CNR1 gene located on chromosome 1, which next to the significant SNP MARC0065740, is an appetite-related gene and appetite is one of the important factors influencing growth rate. CNR1 is the major receptor of anandamide that inhibits gastrointestinal activity (Mathison et al., 2004). The CNR1 receptor inverse agonist rimonabant has been proved to reduce the food intake in both human and mouse. In addition, when the stomach is in contraction, which is a relatively active state, CNR1 will promote the release of ghrelin, which increases the palatability of food, and it is the origin of the appetite stimulating effect (De Luca et al., 2012).
The SNP density limits the interpretation of GWAS hits due to the different LD between SNP and QTLs in various breeds. Therefore, GWAS was carried out on data of four breeds separately as well. Two signals that detected in Duroc population were consisted with GWAS results of all breeds and explained the variability of the traits among breeds and within Duroc breed. In addition, several genome-wide significant SNPs were detected and contributed to the variability of traits within breeds. For Duroc breed, the GLP1R gene is identified nearby the genome-wide significant SNP MARC0015804. It is a member of the glucagon receptor family and controls the blood sugar level (Brubaker and Drucker, 2002), in addition, it is also expressed in the brain and has a role in appetite control (Kinzig et al., 2002). The TRIB3 gene, which is identified nearby the M1GA0027226 marker on chromosome 17, was reported to be associated with meat production traits in Italian heavy pigs (Fontanesi et al., 2010). For Landrace breed, BRD2 and HCRTR2 genes were identified nearby M1GA0027226 SNP on chromosome 7. The knockout of BRD2 gene will cause obesity in mouse and HCRTR2 is a kind of orexin receptor, which plays a vital important role in feeding behavior and balance of energy metabolism (Spinazzi et al., 2006; Belkina and Denis, 2012).
Conclusions
In this study, we performed GWAS on approximately 5,000 purebred pigs that composed of four breeds from two separated farms. All samples were genotyped by 50K SNP Chip. GWAS was performed on ADG and AGE that adjusted to 100 kg using FarmCPU model. A total of 27 genome-wide significant SNPs were detected and two of them were detected in both traits using the data of all breeds and Duroc breed. Nine candidate genes were detected within 1 Mb nearby the genome-wide significant SNPs. Among them, TRIB3 on chromosome 17 was reported to be associated with meat production traits in pigs; GRP, CNR1, SEC11C, and ssc-mir-122 on chromosome 1, TTR on chromosome 6 and GLP1R, BRD2, and HCRTR2 gene on chromosome 7 were reported to be associated with growth traits in human and mouse. The newly detected significant SNPs and newly identified candidate genes in this study can be applied to pig breeding and the information could be also incorporated in genomic selection for ADG and AGE traits to achieve faster growth.
Ethics Statement
This study was carried out in accordance with the guidelines of the science ethics committee of the Huazhong Agricultural University (HZAU). The science ethics committee of the HZAU approved all the animal experiments that conducted in this study.
Author Contributions
XiaL, SZ, and XinL conceived the study. ZT, LY, and JX wrote the codes and did the data analysis. XiaL and ZT drafted the manuscript and all authors contributed to finalizing the writing.
Funding
The research is supported by the National Natural Science Foundation of China [31702087, 31730089, 31790414], the Fundamental Research Funds for the Central Universities [0900201564], and the National Swine Industry Technology System [CARS-35].
Conflict of Interest Statement
The authors declare that the research was conducted in the absence of any commercial or financial relationships that could be construed as a potential conflict of interest.
Acknowledgments
We gratefully acknowledge that Guanjun Ma, Dengdeng Ye, Qing Zhang, Quanshun Mei, Guangliang Zhou, Yilong Chen, Jiuhong Nan, Mengfen Wang, Ali Liu, Shuailei Yan, Xiao Peng, Haoyuan Zhang, Hailong Liu, Yinlong Liao, Xiaolong Qi, and Binxu Yin for help on collecting sample tissues and extracting DNA.
Supplementary Material
The Supplementary Material for this article can be found online at: https://www.frontiersin.org/articles/10.3389/fgene.2019.00302/full#supplementary-material
References
Aguilar, I., Misztal, I., Johnson, D. L., Legarra, A., Tsuruta, S., and Lawlor, T. J. (2010). Hot topic: a unified approach to utilize phenotypic, full pedigree, and genomic information for genetic evaluation of Holstein final score. J. Dairy Sci. 93, 743–752. doi: 10.3168/jds.2009-2730
Belkina, A. C., and Denis, G. V. (2012). BET domain co-regulators in obesity, inflammation and cancer. Nat. Rev. Cancer 12, 465–477. doi: 10.1038/nrc3256
Bohni, P. C., Deshaies, R. J., and Schekman, R. W. (1988). SEC11 is required for signal peptide processing and yeast cell growth. J. Cell. Biol. 106, 1035–1042.
Brubaker, P. L., and Drucker, D. J. (2002). Structure-function of the glucagon receptor family of G protein-coupled receptors: the glucagon, GIP, GLP-1, and GLP-2 receptors. Receptors Channels 8, 179–188. doi: 10.1080/10606820213687
Cantor, R. M., Lange, K., and Sinsheimer, J. S. (2010). Prioritizing GWAS results: a review of statistical methods and recommendations for their application. Am. J. Hum. Genet. 86, 6–22. doi: 10.1016/j.ajhg.2009.11.017
Chang, C. C., Chow, C. C., Tellier, L. C., Vattikuti, S., Purcell, S. M., and Lee, J. J. (2015). Second-generation PLINK: rising to the challenge of larger and richer datasets. Gigascience 4:7. doi: 10.1186/s13742-015-0047-8
Cirera, S., Birck, M., Busk, P. K., and Fredholm, M. (2010). Expression profiles of miRNA-122 and its target CAT1 in minipigs (Sus scrofa) fed a high-cholesterol diet. Comp. Med. 60, 136–141.
De Luca, M. A., Solinas, M., Bimpisidis, Z., Goldberg, S. R., and Di Chiara, G. (2012). Cannabinoid facilitation of behavioral and biochemical hedonic taste responses. Neuropharmacology 63, 161–168. doi: 10.1016/j.neuropharm.2011.10.018
Ding, R., Yang, M., Wang, X., Quan, J., Zhuang, Z., Zhou, S., et al. (2018). Genetic architecture of feeding behavior and feed efficiency in a Duroc pig population. Front. Genet. 9:220. doi: 10.3389/fgene.2018.00220
Do, D. N., Strathe, A. B., Ostersen, T., Pant, S. D., and Kadarmideen, H. N. (2014). Genome-wide association and pathway analysis of feed efficiency in pigs reveal candidate genes and pathways for residual feed intake. Front. Genet. 5:307. doi: 10.3389/fgene.2014.00307
Esau, C., Davis, S., Murray, S. F., Yu, X. X., Pandey, S. K., Pear, M., et al. (2006). miR-122 regulation of lipid metabolism revealed by in vivo antisense targeting. Cell Metab. 3, 87–98. doi: 10.1016/j.cmet.2006.01.005
Fontanesi, L., Colombo, M., Scotti, E., Buttazzoni, L., Bertolini, F., Dall'Olio, S., et al. (2010). The porcine tribbles homolog 3 (TRIB3) gene: identification of a missense mutation and association analysis with meat quality and production traits in Italian heavy pigs. Meat Sci. 86, 808–813. doi: 10.1016/j.meatsci.2010.07.001
Fontanesi, L., Schiavo, G., Galimberti, G., Calo, D. G., and Russo, V. (2014). A genomewide association study for average daily gain in Italian Large White pigs. J. Anim. Sci. 92, 1385–1394. doi: 10.2527/jas.2013-7059
Gilbert, H., Bidanel, J. P., Gruand, J., Caritez, J. C., Billon, Y., Guillouet, P., et al. (2007). Genetic parameters for residual feed intake in growing pigs, with emphasis on genetic relationships with carcass and meat quality traits. J. Anim. Sci. 85, 3182–3188. doi: 10.2527/jas.2006-590
Gilmour, A. R., Thompson, R., and Cullis, B. R. (1995). Average information REML: an efficient algorithm for variance parameter estimation in linear mixed models. Biometrics 51, 1440–1450. doi: 10.2307/2533274
Goddard, M. E., and Hayes, B. J. (2009). Mapping genes for complex traits in domestic animals and their use in breeding programmes. Nat. Rev. Genet. 10, 381–391. doi: 10.1038/nrg2575
Gutierrez, A. P., Matika, O., Bean, T. P., and Houston, R. D. (2018). Genomic selection for growth traits in pacific oyster (Crassostrea gigas): potential of low-density marker panels for breeding value prediction. Front. Genet. 9:391. doi: 10.3389/fgene.2018.00391
Henderson, C. R. (1975). Best linear unbiased estimation and prediction under a selection model. Biometrics 31, 423–447.
Hoque, M. A., Kadowaki, H., Shibata, T., Oikawa, T., and Suzuki, K. (2009). Genetic parameters for measures of residual feed intake and growth traits in seven generations of Duroc pigs. Livestock Sci. 121, 45–49. doi: 10.1016/j.livsci.2008.05.016
Hoque, M. A., Suzuki, K., Kadowaki, H., Shibata, T., and Oikawa, T. (2007). Genetic parameters for feed efficiency traits and their relationships with growth and carcass traits in Duroc pigs. J. Anim. Breed Genet. 124, 108–116. doi: 10.1111/j.1439-0388.2007.00650.x
Hou, L., and Zhao, H. (2013). A review of post-GWAS prioritization approaches. Front. Genet. 4:280. doi: 10.3389/fgene.2013.00280
Hu, Z. L., Park, C. A., and Reecy, J. M. (2016). Developmental progress and current status of the Animal QTLdb. Nucleic Acids Res. 44, D827–D833. doi: 10.1093/nar/gkv1233
Kaler, A. S., Ray, J. D., Schapaugh, W. T., King, C. A., and Purcell, L. C. (2017). Genome-wide association mapping of canopy wilting in diverse soybean genotypes. Theor. Appl. Genet. 130, 2203–2217. doi: 10.1007/s00122-017-2951-z
Kang, H. M., Zaitlen, N. A., Wade, C. M., Kirby, A., Heckerman, D., Daly, M. J., et al. (2008). Efficient control of population structure in model organism association mapping. Genetics 178, 1709–1723. doi: 10.1534/genetics.107.080101
Kinzig, K. P., D'Alessio, D. A., and Seeley, R. J. (2002). The diverse roles of specific GLP-1 receptors in the control of food intake and the response to visceral illness. J. Neurosci. 22, 10470–10476. doi: 10.1523/jneurosci.22-23-10470.2002
Klein, R. J., Zeiss, C., Chew, E. Y., Tsai, J. Y., Sackler, R. S., Haynes, C., et al. (2005). Complement factor H polymorphism in age-related macular degeneration. Science 308, 385–389. doi: 10.1126/science.1109557
Korte, A., and Farlow, A. (2013). The advantages and limitations of trait analysis with GWAS: a review. Plant Methods 9:29. doi: 10.1186/1746-4811-9-29
Kusmec, A., Srinivasan, S., Nettleton, D., and Schnable, P. S. (2017). Distinct genetic architectures for phenotype means and plasticities in Zea mays. Nat. Plants 3, 715–723. doi: 10.1038/s41477-017-0007-7
Liu, X., Huang, M., Fan, B., Buckler, E. S., and Zhang, Z. (2016). Iterative usage of fixed and random effect models for powerful and efficient genome-wide association studies. PLoS Genet. 12:e1005767. doi: 10.1371/journal.pgen.1005767
Mathison, R., Ho, W., Pittman, Q. J., Davison, J. S., and Sharkey, K. A. (2004). Effects of cannabinoid receptor-2 activation on accelerated gastrointestinal transit in lipopolysaccharide-treated rats. Br. J. Pharmacol. 142, 1247–1254. doi: 10.1038/sj.bjp.0705889
Meng, Q., Wang, K., Liu, X., Zhou, H., Xu, L., Wang, Z., et al. (2017). Identification of growth trait related genes in a Yorkshire purebred pig population by genome-wide association studies. Asian-Australas J. Anim. Sci. 30, 462–469. doi: 10.5713/ajas.16.0548
Merali, Z., McIntosh, J., and Anisman, H. (1999). Role of bombesin-related peptides in the control of food intake. Neuropeptides 33, 376–386. doi: 10.1054/npep.1999.0054
Meuwissen, T., Hayes, B., and Goddard, M. (2016). Genomic selection: a paradigm shift in animal breeding. Anim. Front. 6, 6–14. doi: 10.2527/af.2016-0002
Nicodemus, K. K., Liu, W., Chase, G. A., Tsai, Y. Y., and Fallin, M. D. (2005). Comparison of type I error for multiple test corrections in large single-nucleotide polymorphism studies using principal components versus haplotype blocking algorithms. BMC Genet. 6 (Suppl. 1):S78. doi: 10.1186/1471-2156-6-S1-S78
Onteru, S. K., Gorbach, D. M., Young, J. M., Garrick, D. J., Dekkers, J. C., and Rothschild, M. F. (2013). Whole genome association studies of residual feed intake and related traits in the pig. PLoS ONE 8:e61756. doi: 10.1371/journal.pone.0061756
Quan, J., Ding, R., Wang, X., Yang, M., Yang, Y., Zheng, E., et al. (2018). Genome-wide association study reveals genetic loci and candidate genes for average daily gain in Duroc pigs. Asian-Australas J. Anim. Sci. 31, 480–488. doi: 10.5713/ajas.17.0356
Ramos, A. M., Crooijmans, R. P., Affara, N. A., Amaral, A. J., Archibald, A. L., Beever, J. E., et al. (2009). Design of a high density SNP genotyping assay in the pig using SNPs identified and characterized by next generation sequencing technology. PLoS ONE 4:e6524. doi: 10.1371/journal.pone.0006524
Richardson, S. J., Lemkine, G. F., Alfama, G., Hassani, Z., and Demeneix, B. A. (2007). Cell division and apoptosis in the adult neural stem cell niche are differentially affected in transthyretin null mice. Neurosci. Lett. 421, 234–238. doi: 10.1016/j.neulet.2007.05.040
Sargolzaei, M., Chesnais, J. P., and Schenkel, F. S. (2014). A new approach for efficient genotype imputation using information from relatives. BMC Genomics 15, 478–478. doi: 10.1186/1471-2164-15-478
Shenkin, A. (2006). Serum prealbumin: is it a marker of nutritional status or of risk of malnutrition? Clin. Chem. 52, 2177–2179. doi: 10.1373/clinchem.2006.077412
Spinazzi, R., Andreis, P. G., Rossi, G. P., and Nussdorfer, G. G. (2006). Orexins in the regulation of the hypothalamic-pituitary-adrenal axis. Pharmacol. Rev. 58, 46–57. doi: 10.1124/pr.58.1.4
Tang, Y., and Liu, X. (2019). G2P: a genome-wide-association-study simulation tool for genotype simulation, phenotype simulation, and power evaluation. Bioinformatics. 1–3. doi: 10.1093/bioinformatics/btz126
Van Laere, A. S., Nguyen, M., Braunschweig, M., Nezer, C., Collette, C., Moreau, L., et al. (2003). A regulatory mutation in IGF2 causes a major QTL effect on muscle growth in the pig. Nature 425, 832–836. doi: 10.1038/nature02064
VanRaden, P. M. (2008). Efficient methods to compute genomic predictions. J. Dairy Sci. 91, 4414–4423. doi: 10.3168/jds.2007-0980
Wang, Y., Ding, X., Tan, Z., Ning, C., Xing, K., Yang, T., et al. (2017). Genome-wide association study of piglet uniformity and farrowing interval. Front. Genet. 8:194. doi: 10.3389/fgene.2017.00194
Wang, Y. Y., Li, Y. Q., Wu, H. Y., Hu, B., Zheng, J. J., Zhai, H., et al. (2018). Genotyping of soybean cultivars with medium-density array reveals the population structure and QTNs underlying maturity and seed traits. Front. Plant Sci. 9:610. doi: 10.3389/fpls.2018.00610
Yu, J., Pressoir, G., Briggs, W. H., Vroh Bi, I., Yamasaki, M., Doebley, J. F., et al. (2006). A unified mixed-model method for association mapping that accounts for multiple levels of relatedness. Nat. Genet. 38, 203–208. doi: 10.1038/ng1702
Zhang, H., Wang, Z., Wang, S., and Li, H. (2012). Progress of genome wide association study in domestic animals. J. Anim. Sci. Biotechnol. 3:26. doi: 10.1186/2049-1891-3-26
Keywords: GWAS, pig, growth traits, ADG, AGE
Citation: Tang Z, Xu J, Yin L, Yin D, Zhu M, Yu M, Li X, Zhao S and Liu X (2019) Genome-Wide Association Study Reveals Candidate Genes for Growth Relevant Traits in Pigs. Front. Genet. 10:302. doi: 10.3389/fgene.2019.00302
Received: 31 December 2018; Accepted: 19 March 2019;
Published: 05 April 2019.
Edited by:
Robert J. Schaefer, University of Minnesota Twin Cities, United StatesReviewed by:
Wen Huang, Michigan State University, United StatesBertrand Servin, Institut National de la Recherche Agronomique de Toulouse, France
Copyright © 2019 Tang, Xu, Yin, Yin, Zhu, Yu, Li, Zhao and Liu. This is an open-access article distributed under the terms of the Creative Commons Attribution License (CC BY). The use, distribution or reproduction in other forums is permitted, provided the original author(s) and the copyright owner(s) are credited and that the original publication in this journal is cited, in accordance with accepted academic practice. No use, distribution or reproduction is permitted which does not comply with these terms.
*Correspondence: Xiaolei Liu, eGlhb2xlaWxpdUBtYWlsLmh6YXUuZWR1LmNu