 Seiichi Omura1,2
 Fumitaka Sato1,2
 Ah-Mee Park1
 Mitsugu Fujita1
 Sundar Khadka1
 Yumina Nakamura1
 Aoshi Katsuki1
 Kazuto Nishio3
 Felicity N. E. Gavins4,5
 Ikuo Tsunoda1,2*
- 1Department of Microbiology, Kindai University Faculty of Medicine, Osaka, Japan
- 2Department of Microbiology and Immunology, Louisiana State University Health Sciences Center-Shreveport, Shreveport, LA, United States
- 3Department of Genome Biology, Kindai University Faculty of Medicine, Osaka, Japan
- 4Department of Molecular and Cellular Physiology, Louisiana State University Health Sciences Center-Shreveport, Shreveport, LA, United States
- 5Department of Biosciences, College of Health and Life Sciences, Brunel University London, Uxbridge, United Kingdom
Virus infections have been associated with acute and chronic inflammatory central nervous system (CNS) diseases, e.g., acute flaccid myelitis (AFM) and multiple sclerosis (MS), where animal models support the pathogenic roles of viruses. In the spinal cord, Theiler's murine encephalomyelitis virus (TMEV) induces an AFM-like disease with gray matter inflammation during the acute phase, 1 week post infection (p.i.), and an MS-like disease with white matter inflammation during the chronic phase, 1 month p.i. Although gut microbiota has been proposed to affect immune responses contributing to pathological conditions in remote organs, including the brain pathophysiology, its precise role in neuroinflammatory diseases is unclear. We infected SJL/J mice with TMEV; harvested feces and spinal cords on days 4 (before onset), 7 (acute phase), and 35 (chronic phase) p.i.; and examined fecal microbiota by 16S rRNA sequencing and CNS transcriptome by RNA sequencing. Although TMEV infection neither decreased microbial diversity nor changed overall microbiome patterns, it increased abundance of individual bacterial genera Marvinbryantia on days 7 and 35 p.i. and Coprococcus on day 35 p.i., whose pattern-matching with CNS transcriptome showed strong correlations: Marvinbryantia with eight T-cell receptor (TCR) genes on day 7 and with seven immunoglobulin (Ig) genes on day 35 p.i.; and Coprococcus with gene expressions of not only TCRs and IgG/IgA, but also major histocompatibility complex (MHC) and complements. The high gene expression of IgA, a component of mucosal immunity, in the CNS was unexpected. However, we observed substantial IgA positive cells and deposition in the CNS, as well as a strong correlation between CNS IgA gene expression and serum anti-TMEV IgA titers. Here, changes in a small number of distinct gut bacteria, but not overall gut microbiota, could affect acute and chronic immune responses, causing AFM- and MS-like lesions in the CNS. Alternatively, activated immune responses would alter the composition of gut microbiota.
Introduction
Virus infections can induce tissue damage either by direct virus replication/killing of infected cells (viral pathology) or by immune-mediated tissue damage (immunopathology) (1, 2). Virus infections have been associated with acute and chronic inflammatory central nervous system (CNS) diseases, including acute flaccid myelitis (AFM) and multiple sclerosis (MS) (3, 4). Although inflammation of the spinal cord has been observed in both AFM and MS, lesions localize in the gray matter in AFM and in the white matter in MS.
Recently, there have been increased reports of patients with AFM, a disease of acute limb weakness, with magnetic resonance imaging (MRI) abnormalities in the gray matter of the spinal cord (5) and pleocytosis in the cerebrospinal fluid (CSF) (3, 6). AFM has been associated with infections of viruses that belong to the family Picornaviridae, including enteroviruses (4, 6, 7). We do not know the precise pathomechanism of human AFM, partly because there are few autopsy reports (8). Although the establishment of mouse models for AFM, using enterovirus D68 (EV-D68), has been reported (5, 9–11), the models may not replicate the human disease, because of the usage of neonatal/suckling mice and non-natural pathogen of mice. In addition, although viral pathology appears to cause CNS damage in the EV-D68 model, the different susceptibility to the EV-D68 model depending on mouse strains (11) as well as rare isolation of virus from the CSF in human AFM (4, 6) suggested a role of host factors including immunopathology in AFM (12).
MS is a chronic inflammatory demyelinating disease in the CNS, involving mainly the white matter of multiple regions, including the optic nerve, the cerebrum, and the spinal cord (13, 14). Although the precise etiology of MS remains unknown, autoimmune responses and environmental factors, particularly virus infections, have been associated with the pathogenesis of MS; autoimmune and viral etiologies have been supported by their animal models experimentally (15).
Gut microbiota has been shown to interact with the immune system. When the activation of the immune system is appropriate, this contributes to the elimination/regulation of microbes. Dysbiosis, an altered state of bacterial community, has been associated with health conditions and diseases (16, 17). Dysbiosis could lead to excessive activation of the immune system; uncontrolled immune responses can cause immunopathology, particularly in the gastrointestinal tract. For example, inflammatory bowel diseases (IBD), including ulcerative colitis and Crohn's disease, are considered to reflect inappropriate interactions between microbes and the host (18, 19). Dysbiosis has also been suggested to affect distant anatomical sites, including the CNS, which modulates CNS diseases (20).
Although dysbiosis can affect AFM by changing systemic and/or mucosal immune responses, in theory, the precise role of gut microbiota in AFM is currently unknown. On the other hand, changes of gut microbiota have been reported in MS patients, in which uncontrolled T-cell and antibody responses enhanced by dysbiosis may exacerbate CNS inflammation (13, 20, 21). However, we do not know precisely what microbial changes are associated with the uncontrolled immune responses in MS.
Theiler's murine encephalomyelitis virus (TMEV) is a natural enteric pathogen of mice and belongs to the family Picornaviridae (22). Experimentally, TMEV infection induces a biphasic disease: an AFM-like disease with gray matter inflammation during the acute phase, about 1 week post infection (p.i.), and an MS-like disease with white matter inflammation, which is confined in the spinal cord, during the chronic phase, 1 month p.i. During both acute and chronic phases of TMEV infection, inflammatory cells mainly composed of T-cells and macrophages have been observed in the spinal cords (23) with upregulation of adhesion molecules on inflammatory cells and blood vessels (24, 25). Immunologically, T-cell and antibody responses have been shown to play a beneficial anti-viral role during the acute phase, but play a detrimental role that induces immunopathology during the chronic phase (26, 27).
The TMEV model is a unique experimental system where one can examine how one single pathogen can induce two distinct lesions in the spinal cord: gray matter inflammation (poliomyelitis) and white matter inflammatory demyelination. Although the latter has been extensively used as a viral model for MS, the former has not been studied, despite being once used as a mouse model for poliomyelitis in the 1940s (28–30). In this study, we hypothesized that dysbiosis would be associated with acute and chronic inflammation in the spinal cord induced by TMEV. By comparing and contrasting AFM- and MS-like diseases induced by a single natural pathogen of mice, TMEV, we investigated the interactions between altered microbiome and CNS transcriptome, which would give an insight into the pathophysiology of AFM and MS.
We examined fecal microbiome and CNS transcriptome during the acute phase (day 7) and chronic phase (day 35) in TMEV infection. Although TMEV infection neither increased microbial diversities nor resulted in distinct microbiome patterns, it increased the genus Marvinbryantia on days 7 and 35 and the genus Coprococcus on day 35. The abundance of genus Marvinbryantia was correlated with eight T-cell receptor (TCR) genes on day 7 and with seven immunoglobulin (Ig) genes on day 35. On day 35, abundance of the genus Coprococcus was also correlated with gene expressions of major histocompatibility complex (MHC) and complements as well as TCRs, IgG isotypes, and IgA, which were distinct from the genes identified with the genus Marvinbryantia. Although the high gene expression of IgA, a component of mucosal immunity, in the CNS was unexpected, substantial IgA positive cells and IgA deposition were observed in the spinal cord. IgA gene expression was correlated with serum anti-TMEV IgA titers, although we found no cross-reactivity between TMEV and Coprococcus antigens. This is the first report suggesting that acute myelitis and chronic neuroinflammation with IgA responses could be influenced by the changes in bacterial abundance in a limited number of bacteria, but not overall gut microbiota changes or dysbiosis. However, one must not rule out an alternative scenario in which the activated immune responses themselves alter the composition of gut microbiota.
Materials and Methods
Ethics Statement
All animal experiments were approved by the Louisiana State University Health Sciences Center-Shreveport (LSUHSC-S, LA) and the Kindai University Faculty of Medicine (Osaka, Japan) Institutional Animal Care and Use Committee (IACUC) guidelines and followed the National Research Council's Guide for the Care and Use of Laboratory Animals, the Institute of Laboratory Animal Resources (ILAR), and the guideline “Fundamental Guidelines for Proper Conduct of Animal Experiment and Related Activities in Academic Research Institutions” from the Ministry of Education, Culture, Sports, Science and Technology, Japan.
Animal Experiments
Female 5-week-old SJL/J mice (Jackson Laboratory, Bar Harbor, ME) were inoculated intracerebrally (i.c.) with 2 × 10⁵ plaque-forming units (PFU) of the Daniels (DA) strain of TMEV (31). Control mice were injected i.c. with phosphate-buffered saline (PBS). On days 4, 7, and 35 after i.c. injection, we harvested spinal cords and feces from TMEV-infected and control mice (n = 5 per group at each time point, between 8:00 a.m. and 10:00 a.m.). Since TMEV can be transmitted by the fecal–oral route, control and TMEV-infected mice were not co-housed. We determined the mouse number per group by power analysis (32, 33) as well as the published guidelines (34, 35) and IACUC protocols of Kindai University and LSUHSC-S. All mice were maintained under specific pathogen-free conditions in our animal care facility at LSUHSC-S or Kindai University.
RNA Sequencing
We extracted total RNA from spinal cords by the RNeasy Mini Kit (Qiagen, Valencia, CA), according to the manufacturer's instructions. DNase treatment was conducted with the RNase-Free DNase Set (Qiagen). All samples were purified to an absorbance ratio (A260/A280) between 1.9 and 2.1.
We conducted RNA sequencing and data processing as described previously (24). Briefly, we processed 100 ng of total RNA to mRNA library and sequenced on the Illumina NextSeq™ 500 system (Illumina, San Diego, CA), according to the manufacturer's instructions. Raw sequence data were mapped on reference genome and counted. The read count data were normalized with DESeq2 package in R version 3.6.0 (36, 37). Transcriptome data have been deposited into the Gene Expression Omnibus (GEO) at the National Center for Biotechnology Information (NCBI, Bethesda, MD; accession no. GSE120041, https://www.ncbi.nlm.nih.gov/geo/query/acc.cgiacc=GSE120041).
16S rRNA Sequencing
We extracted DNA from feces of TMEV-infected and control mice, using the QIAamp® Fast DNA Stool Mini Kit (Qiagen), according to the manufacturer's instructions. DNA was amplified by PCR, using a primer set for V3 and V4 region of 16S rRNA. The primer sequences are as follows: forward primer = 5′-TCGTCGGCAGCGTCAGATGTGTATAAGAGACAGCCTACGGGNGGCWGCAG-3′; reverse primer = 5′-GTCTCGTGGGCTCGGAGATGTGTATAAGAGACAGGACTACHVGGGTATCTAATCC-3′. Amplified DNA samples were purified and attached with dual indices and sequencing adapters, using the Nextera® XT Index Kit (Illumina). DNA libraries were validated by the 2100 Bioanalyzer DNA 100 chip (Agilent Technologies, Santa Clara, CA), quantified by the Quant-iTTM Picogreen® dsDNA Assay Kit (Thermo Fisher Scientific, Waltham, MA), and sequenced by the MiSeq® System (Illumina). Raw sequence data were denoised, demultiplexed, aligned, and visualized by QIIME 2 (38). Microbiome data have been deposited into the Sequence Read Archive (SRA) at NCBI (Bioproject accession no. PRJNA561088; Biosample accession no. SAMN12607114-SAMN12607143).
Bioinformatics Analyses
Heat Map
A heat map was drawn to determine the expression patterns of top 30 upregulated and top 20 downregulated genes on day 35 (Figure 1) or at each time point (Supplemental Figure 1) in the spinal cord of TMEV-infected mice, and compared the expression levels with those on the other two time points, using R and the packages “gplots” and “genefilter.” We obtained the logarithmic fold-change data of each TMEV-infected mouse, compared with controls, using regulated-logarithm transformation (rlog) function, which added pseudocount “1” to all count data, in DESeq2 (37).
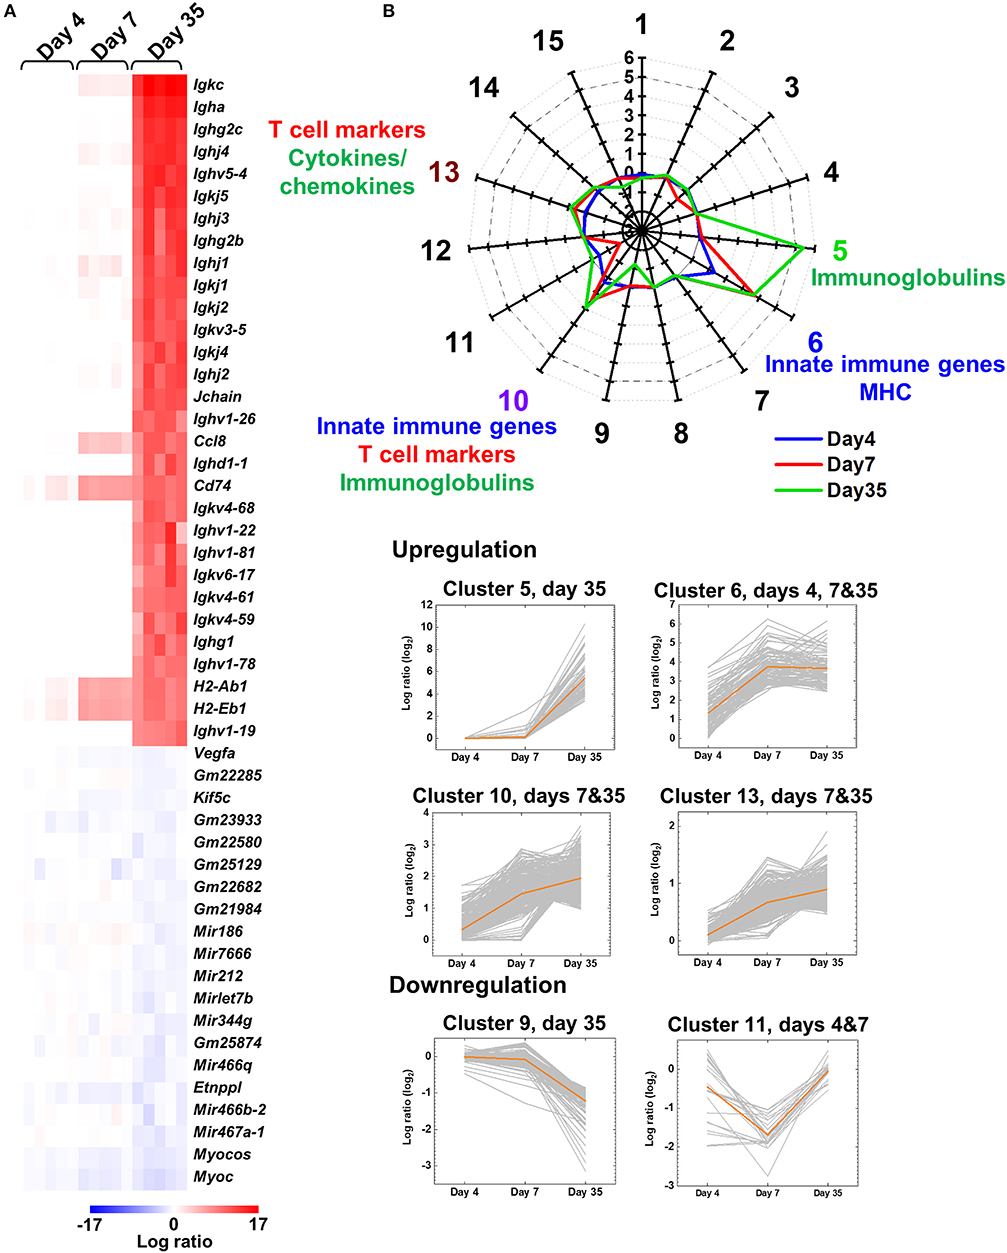
Figure 1. Central nervous system (CNS) transcriptome data of mice infected with Theiler's murine encephalomyelitis virus (TMEV). (A) We harvested the spinal cord from five TMEV-infected mice per day and analyzed the gene expression patterns compared with five control mice. We drew the heat map of the top 30 genes up- or the 20 genes downregulated in the spinal cord of TMEV-infected mice on day 35 compared with those on days 4 and 7 by the R packages “gplots” and “genefilter.” Red, blue, and white indicate upregulation, downregulation, and no change, respectively. Humoral immunity-related genes, including immunoglobulin (Ig) heavy (Igh), light [kappa (Igk) and lambda (Igl)], and J (Jchain) chains, were highly upregulated in TMEV-infected mice on day 35. Lists of significantly up and downregulated genes in TMEV-infected mice were shown in Supplemental Table 2 and Supplemental Figure 1. (B) Radar chart of cluster centers calculated by k-means clustering. K-means clustering, using an R package “cclust,” divided the genes into 15 clusters based on the expression patterns. Genes in cluster 5 were upregulated on day 35, which included Igs. Genes in cluster 6 were upregulated at all time points, which included innate immunity and major histocompatibility complex (MHC) genes. Genes in clusters 10 and 13 were upregulated on days 7 and 35; Cluster 10 included innate immunity genes, CD3 γ chain, and Igs. Cluster 13 included cytokines, chemokines, and T-cell-related genes. In contrast, genes in clusters 9 and 11 were downregulated on days 35 and 7, respectively. The numbers along the axis (−3 to 6) are log ratios, compared with controls. Lists of all genes classified into each cluster were shown in Supplemental Table 3.
Principal Component Analysis (PCA)
PCA was conducted to compare the microbiome among the samples, using an R function “prcomp,” as we described previously (39). A graph of PCA with ellipses of an 80% confidence interval was drawn, using R packages “dplyr” and “ggplot2.” Factor loading for principal component (PC) 2 was used to rank a set of genes correlated with PC2 values.
Alpha Diversity
We determined alpha diversity of microbiome of fecal samples from TMEV-infected and control groups on days 4, 7, and 35 (n = 5 per group), using QIIME 2. To compare the number of genera, evenness, and the combination of them between groups, we used Faith's phylogenic diversity index, Pielou's evenness index, and Shannon index, respectively (40).
K-Means Clustering
K-means clustering was conducted to classify the genes based on their expression patterns, using an R package “cclust” (41). Davies-Bouldin index was used to determine the optimum number of clusters (Supplemental Figure 2) (42).
Pattern Matching
To evaluate the association between gut microbiota and CNS gene expressions, we conducted pattern matching by R (26) to identify correlations between spinal cord gene expressions (with statistical differences between TMEV-infected and control groups, P < 0.05) and relative abundance of the genus Dorea (day 4), the genus Marvinbryantia (days 7 and 35), or the genus Coprococcus (day 35) in fecal samples (n = 10 on days 4 and 7; n = 8 on day 35). We considered significantly strong positive or negative correlations when genes' correlation coefficients (r) were more than 0.8 or less than −0.8, respectively (calculated by R) with P < 0.05 (calculated by functions of Microsoft Excel, Microsoft Corporation, Redmond, WA).
Enzyme-Linked Immunosorbent Assay (ELISA)
Anti-TMEV Antibody Isotype Determination
When the mice were killed, blood was collected from the heart of TMEV-infected mice. The levels of serum anti-TMEV isotype antibodies were assessed by ELISA as described previously (43). Ninety-six-well flat-bottom Nunc-Immuno plates, MaxiSorp surface (Thermo Fisher Scientific) were coated with TMEV antigen at 4°C overnight. After blocking with 10% fetal bovine serum (FBS) and 0.2% Tween 20 in PBS, 27- or 211-fold diluted serum samples were plated. Horseradish peroxidase (HRP)-conjugated anti-mouse IgG1 (Thermo Fisher Scientific), IgG2b (Thermo Fisher Scientific), IgG2c (SouthernBiotech, Birmingham, AL), or IgA (Thermo Fisher Scientific) was used to detect binding anti-TMEV isotype antibodies. The reaction was developed by adding o-phenylenediamine dihydrochloride (FUJIFILM Wako Pure Chemical Corporation, Osaka, Japan), and stopped with 1N HCl. Absorbance was read at 490 nm on a Model 680 Microplate Reader (Bio-Rad Laboratories, Hercules, CA).
Anti-Coprococcus Antibody
To investigate antibody responses to Coprococcus, we obtained Coprococcus sp. (RD014227) from the Culture Collection Division, Biological Resource Center, National Institute of Technology and Evaluation (NITE, Chiba, Japan) and cultured bacteria in modified Gifu Anaerobic Medium Broth (Nissui Pharmaceutical, Tokyo, Japan) with 1% glucose at 37°C for 3 days under an anaerobic condition, using the anaerobic cultivation set, AnaeroPack® (Mitsubishi Gas Chemical, Tokyo, Japan). We centrifuged cultured bacteria at 3,000g for 10 min, washed with PBS, and suspended the bacteria pellet in PBS [optical density (OD)600nm = 8.0]. We sensitized mice with the bacterial solution (44) in PBS (200 μg bacterial protein/1 × 109 bacterial cells/200 μL/mouse) intraperitoneally (i.p.) or with emulsified the bacterial solution in complete Freund's adjuvant (CFA) (final concentration: 200 μg bacterial protein/1 × 109 bacterial cells/200 μL/mouse) subcutaneously, followed with a second bacterial i.p. injection 6 days after the first sensitization. Three days after the second challenge, we harvested the sera from the sensitized mice and used the sera as positive controls for anti-Coproccocus antibody ELISA. To prepare Coprococcus ELISA antigen, we centrifuged the bacterial solution, washed with PBS twice, and sonicated the pellet suspended in carbonate-bicarbonate buffer (pH 9.5) with 1% TritonX-100. Then, following centrifugation at 20,000g for 10 min, we collected the supernatant and used it as ELISA antigen. We coated Maxisorp F8 stripes (Thermo Fisher Scientific) with Coprococcus antigen (5 μg/well) overnight and added diluted mouse sera (1:10, 100 μL/well) from naive, TMEV-infected, or Coprococcus-sensitized mice. We detected anti-Coprococcus antibodies with HRP-conjugated goat anti-mouse IgG (H+L) (Thermo Fisher Scientific). We used the TMB substrate reagent set (BD Bioscience, Franklin Lakes, NJ) and measured absorbance at 450 nm.
Competitive ELISAs
Competitive ELISAs were performed as described previously (45, 46). Briefly, our standard anti-TMEV antibody ELISA was performed as described above with the following modifications: We incubated diluted sera from TMEV-infected mice with TMEV antigen, Coprococcus antigen, Helicobacter pylori antigen (47), or myelin oligodendrocyte glycoprotein (MOG)35−55 peptide (United BioSystems, Herndon, VA) (48) (final concentration of antigen, 20 μg/120 μL) in PBS containing 10% FBS and 0.2% Tween 20 at 4°C overnight. The mixtures were centrifuged at 10,000 rpm (7,707g) for 5 min, and the supernatants were reacted with TMEV antigen-coated wells.
Histology
We perfused mice with PBS, followed by a phosphate-buffered 4% paraformaldehyde (FUJIFILM Wako Pure Chemical Corporation) solution, and harvested the spinal cord. We stained 4-μm paraffin sections with Luxol fast blue (Solvent blue 38; MP Biomedicals, Irvine, CA) for myelin visualization, as described previously (49). For IgA detection, we incubated the sections with rat anti-mouse IgA monoclonal antibody (1:200 dilution, clone 11-44-2, Beckman Coulter, Brea, CA) and anti-rat IgG-peroxidase (Nichirei Bioscience, Tokyo, Japan). We visualized the antibody/antigen complexes using 3,3'-diaminobenzidine (DAB, FUJIFILM Wako Pure Chemical Corporation). As negative and positive controls for spinal cord inflammatory demyelinating lesions, we used sections from naive mice or mice with experimental autoimmune encephalomyelitis (EAE) induced with myelin proteolipid protein (PLP) 139−151 peptide in CFA as described previously (49).
Statistics
Statistical analyses were conducted by calculating the Student t-test or analysis of variance (ANOVA), using the OriginPro 2018b (OriginLab Corporation, Northampton, MA). P < 0.05 was considered as a significant difference.
Results
Distinct Upregulation of TCR and Ig Genes During the Acute and Chronic Phases of TMEV Infection
TMEV has been known to induce a biphasic disease in the CNS: acute polioencephalomyelitis in the gray matter around 1 week p.i. and chronic inflammatory demyelinating disease in the white matter during the chronic phase, around 1 month p.i. Although the lesion distributions of the two phases differ (gray matter vs. white matter), it is unclear what factors could contribute to the difference. We determined the gene expression profiles in the CNS of TMEV-infected mice during the time course by RNA sequencing (24).
Prior to disease onset, on day 4, innate immunity-related genes, including chemokines and interferon (IFN)-induced genes, were upregulated in TMEV-infected mice (Supplemental Figure 1A and Supplemental Tables 1, 2A). During the acute phase, on day 7, in addition to continuous upregulation of innate immunity-related genes, T-cell-related genes, including TCRβ chain (Trb), were upregulated (Supplemental Figure 1B and Supplemental Table 2B). In contrast, during the chronic phase, on day 35, the heat map showed that most highly upregulated genes were humoral immunity-related genes, including Ig heavy (Igh) chains (IgA, IgG1, IgG2b, and IgG2c), light chains [kappa (Igk) and lambda (Igl)], and J (Jchain) chain (Figure 1A, Supplemental Figure 1C, and Supplemental Table 2C).
To classify the genes based on time-course expressions, we conducted k-means clustering (Figure 1B). K-means clustering of the CNS transcriptome data divided the genes into 15 clusters whose number was determined by Davies-Bouldin index (Supplemental Figures 2, 3). A radar chart of k-means clustering showed that genes in cluster 5 were upregulated on day 35, genes in cluster 6 were upregulated at all time points, and genes in clusters 10 and 13 were upregulated on days 7 and 35. Cluster 5 included a large number of Igs, such as Igkc, Igha, and Ighg2c. Cluster 6 included innate immune genes, such as IFN-induced proteins with tetratricopeptide repeats (Ifit1 and Ifit3) and IFN regulatory factor 7 (Irf7), and MHCs, such as H2-Q6, H2-K1, and H2-Ab1 (Supplemental Table 3). Cluster 10 included IFN-inducible genes, such as radical S-adenosyl methionine domain containing 2 (Rsad2), Ifi44 and MX dynamin-like GTPases (Mx1 and Mx2), CD3 γ chain (Cd3g), and Igs, such as Igkj3, Igkv14-111, and Ighd4-1. Cluster 13 included cytokines (e.g., Il10, Il17ra, and Tnf ), chemokines (e.g., Ccl3, Ccl6, and Ccr1), and T-cell-related genes (e.g., Cd3d, Cd4, and Cd8a). In contrast, genes in clusters 9 and 11 were downregulated in the TMEV-infected group on days 35 and 7, respectively. Representative genes in these clusters were as follows: cluster 9, mitochondrially encoded cytochrome c oxidases (mt-Co1, 2, and 3), myelin proteolipid protein 1 (Plp1), and glycoprotein m6b (Gpm6b); cluster 11, microRNA (Mir6236), myelin protein zero (Mpz), and mitochondrial leucyl-tRNA synthetase (Lars2).
No Changes in Overall Microbiome Patterns Among the TMEV-Infected and Control Groups
To determine whether TMEV infection changes gut microbiota, we conducted 16S rRNA sequencing, using fecal samples. First, we compared overall microbiome patterns among the samples by conducting PCA of microbiome data from the TMEV-infected and control groups at all time points. Although all samples from the TMEV-infected group on day 35 had low PC1 and PC2 values, PCA did not separate any groups as a distinct population among the samples, suggesting no overall microbiota changes among the groups (Figure 2A). We also conducted PCA comparing the following sets of fecal microbiome data: (1) the control groups on days 4, 7, and 35 (Supplemental Figure 4A); (2) the TMEV-infected and control groups on day 4 (Supplemental Figure 4B); (3) the TMEV-infected and control groups on day 7 (Supplemental Figure 4C); and (4) the TMEV-infected and control groups on day 35 (Supplemental Figure 4D). We found that all control samples on days 4, 7, and 35 had similar PC1 and PC2 values and that TMEV samples were not separated as a distinct population at any time points by PCA.
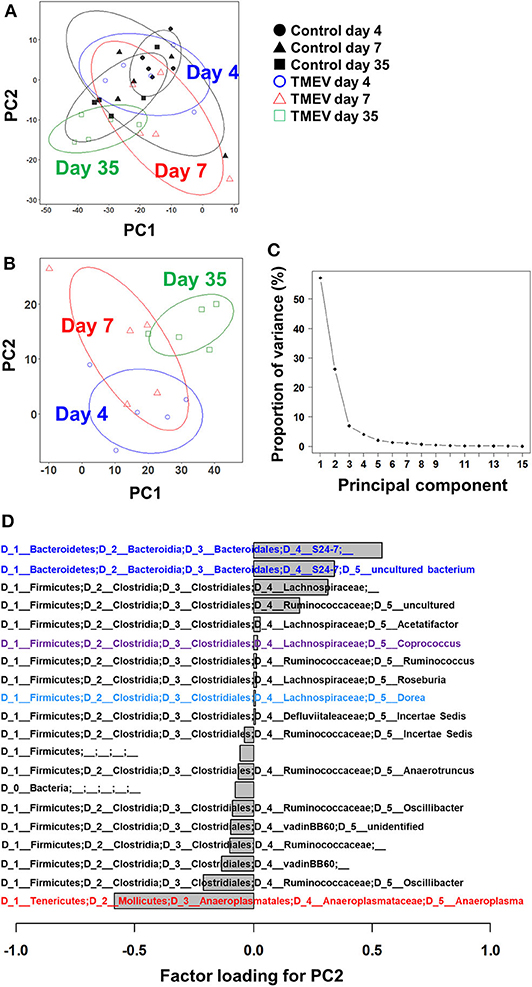
Figure 2. Principal component analysis (PCA) of fecal microbiome data from the TMEV-infected and control groups. (A) When PCA was conducted using all samples from TMEV-infected and control groups on days 4, 7, and 35, PCA did not separate any sample groups as a distinct population, although TMEV-infected group on day 35 had low principal component (PC) 1 and PC2 values. Ellipses indicated an 80% confidence interval of each group. (B) When PCA was conducted using only samples from TMEV-infected groups, PC2 values increased over the time course from day 4 to day 35. (C) Proportion of variance showed that PC1 and PC2 explained 56 and 25% of variance among the samples, respectively. (D) Factor loading showed the correlations between relative abundance of each bacterial taxon to PC2 values. Increased bacteria belong to the family S24-7 and decreased bacteria belong to the genus Anaeroplasma correlated with PC2 values. We conducted PCA of fecal sample data (n = 5 per group at each time point), using an R function “prcomp.” Graphs with ellipses were drawn, using R packages “dplyr” and “ggplot2”.
Next, we conducted PCA using all microbiome data (days 4, 7, and 35) from the TMEV-infected groups. We found that PC2 values increased over the time course from day 4 to day 35 (Figure 2B) and that proportion of variance of PC1 and PC2 was 56% and 25% of variance among the samples, respectively (Figure 2C). Thus, PC2 values seemed to reflect the presence of inflammation in the CNS among the TMEV-infected groups. We calculated factor loading to rank which bacteria in microbiota could contribute to PC2 values (Figure 2D). At the genus level, we found that abundance of two taxa of bacteria that belong to the family S24-7 correlated with PC2 values positively and that of the genus Anaeroplasma correlated with PC2 values negatively.
No Decrease in Bacterial Diversity in TMEV Infection
To compare the fecal microbial diversities among the TMEV-infected and control groups, we determined alpha diversity using three indices. In Faith's phylogenetic diversity index comparing the richness (the number of bacterial genera), we did not find significant differences between the TMEV-infected and control groups, but only between the control groups on days 4 vs. 35 (Figure 3A). In Pielou's evenness index comparing the evenness of amounts of bacterial genera, the index was increased significantly in the TMEV-infected group on day 35, compared with the other groups (P < 0.05, Figure 3B). In Shannon index comparing overall changes of diversity among the groups, we found increases in the indices in the TMEV-infected groups over the time course, but no statistical difference between the groups (P = 0.35, the TMEV-infected vs. control groups on day 35, Figure 3C).
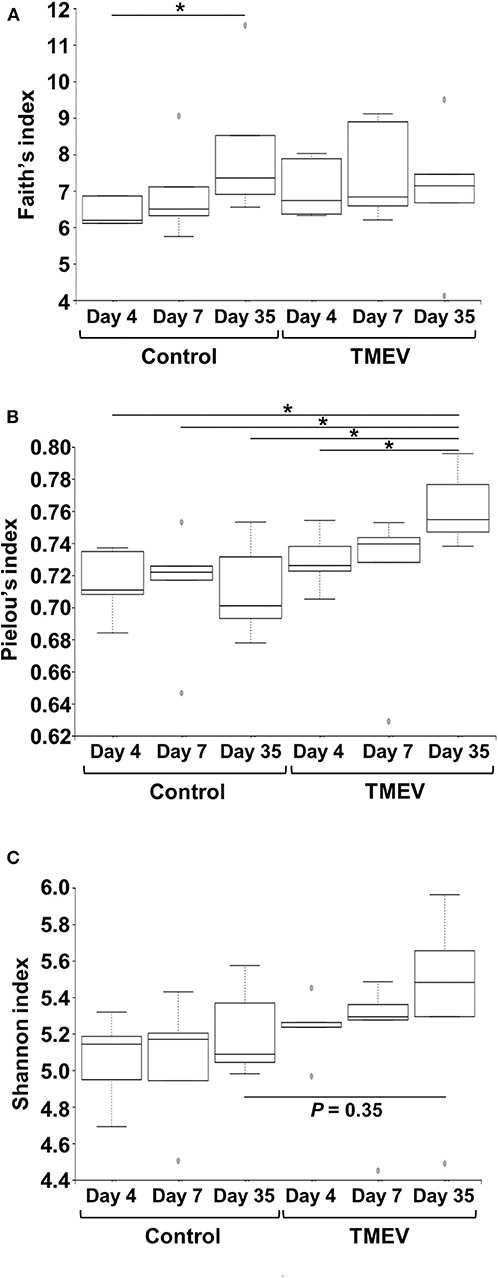
Figure 3. Time course analyses of bacterial alpha diversities of microbiome among TMEV-infected and control groups. Using QIIME 2, we compared the number of genera, evenness, and the combination of them between the groups (n = 5) by Faith's phylogenetic diversity index (A), Pielou's evenness index (B), and Shannon index (C), respectively. (A) The numbers of bacterial genera differed significantly only between control groups days 4 and 35 (*P < 0.05, ANOVA). (B) We found significantly increased evenness in the TMEV-infected group on day 35 compared with all the other groups (*P < 0.05, ANOVA). (C) We found increased Shannon indices in TMEV-infected groups over the time course, but no statistical differences between the groups (P = 0.35, control vs. TMEV groups on day 35).
Three Bacterial Genera Changed in TMEV Infection
We drew a cumulative bar plot for relative abundance of microbiome in each sample. At the phylum level, although the phylum Bacteroidetes (Figure 4A, blue) and the phylum Tenericutes (Figure 4A, red) were upregulated and downregulated in TMEV-infected mice on day 35, respectively, the changes were not statistically significant. We also did not find significant changes in bacterial abundance at the order level in any groups (Supplemental Figure 5). At the genus level, although two taxa that belong to the family S24-7, phylum Bacteroidetes (Figure 4B, blue), and one genus Anaeroplasma (Figure 4B, red) that belongs to the phylum Tenericutes were increased and decreased in the TMEV-infected groups, respectively, the changes were not statistically significant. On the other hand, the TMEV-groups had significant differences in abundance of three distinct genera compared with the control group: a decrease in Dorea on day 4 (P < 0.01) (Figures 4B, 5, light blue); an increase in Marvinbryantia on days 7 and 35 (P < 0.05) (Figures 4B, 5, magenta); and an increase in Coprococcus on day 35 (P < 0.05) (Figures 4B, 5, purple).
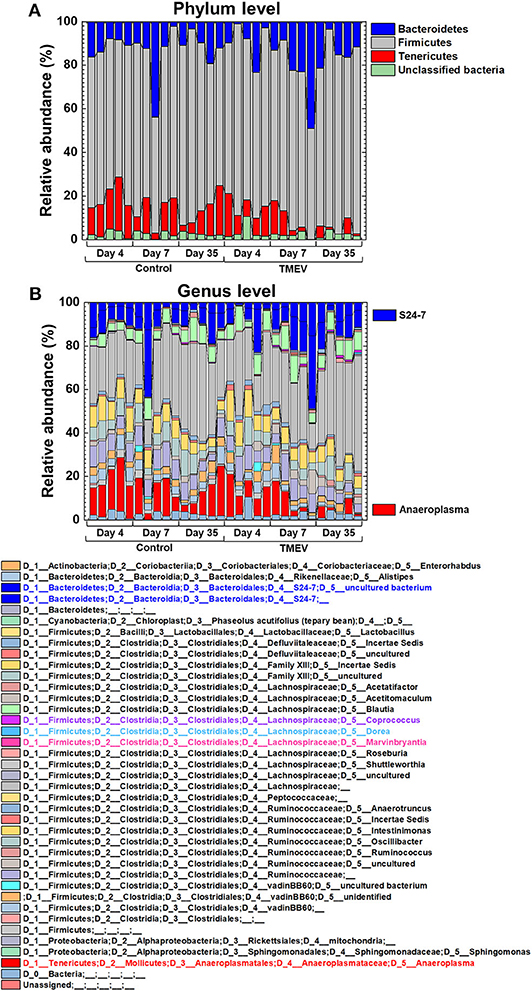
Figure 4. Relative abundance of fecal bacteria in the TMEV-infected and control groups. Fecal DNA was extracted and analyzed the microbiome by 16S rRNA sequencing. (A) At the phylum level, Bacteroidetes (blue) and Tenericutes (red) seemed to be increased and decreased in the TMEV-infected groups, respectively, without statistical differences. (B) At the genus level, on day 35, two taxa of the family S24-7 (blue) and the genus Anaeroplasma (red) seemed to be increased and decreased in the TMEV-infected group, respectively, without statistical differences.
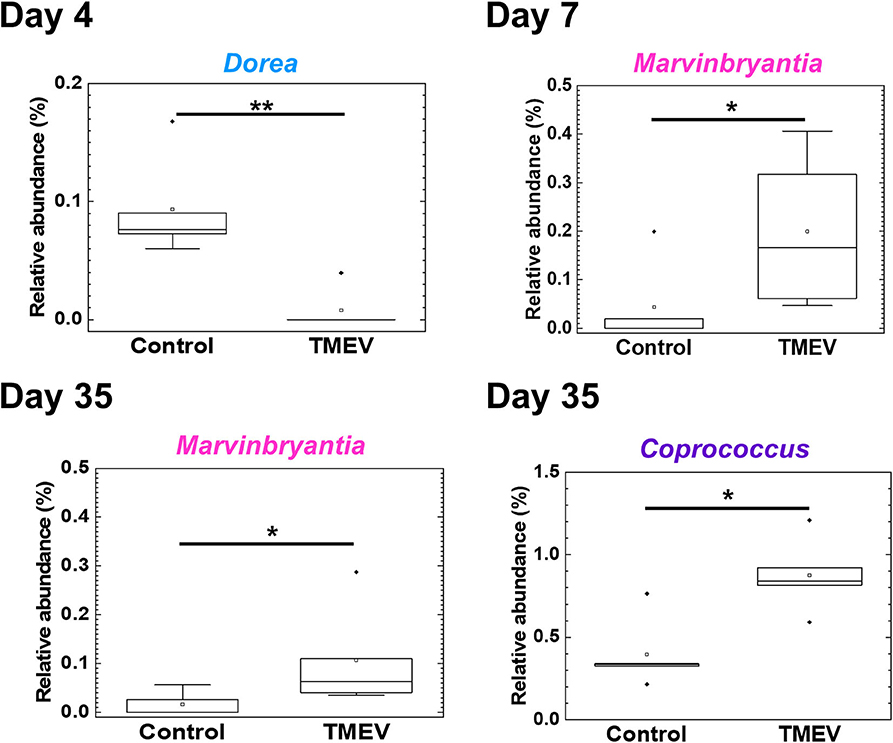
Figure 5. Three bacterial genera changed their relative abundance in the TMEV-infected group, compared with controls. Following the TMEV infection, the genus Dorea was decreased on day 4 (**P < 0.01) and the genus Marvinbryantia was increased on days 7 and 35 (*P < 0.05). The genus Coprococcus was increased on day 35 (*P < 0.05). We compared relative abundance of fecal microbes at the genus level using five fecal samples per group between TMEV-infected and control groups and determined the statistical differences using Student's t-test.
Correlations of Abundance of Three Bacterial Genera With Distinct Immune Gene Expressions in the CNS
To determine whether the changes in fecal microbiome were associated with gene expressions in the CNS, we conducted pattern matching between relative abundance of the three bacterial genera and CNS transcriptome data (Figure 6 and Supplemental Table 4). On day 4, abundance of the genus Dore correlated with 525 genes (193 upregulated and 332 downregulated genes), including CD109, in the CNS (Figure 6). On day 7, abundance of the genus Marvinbryantia correlated with 129 genes (91 upregulated and 38 downregulated genes); among immune genes, we found strong correlations with eight TCR genes, including TCR δ chain (Trdj1) and one IgA gene (Igha) (Figure 6). On the other hand, on day 35, abundance of the genus Marvinbryantia correlated with 43 genes (30 upregulated and 13 downregulated genes), which included only one TCR gene (Traj48) and seven genes of variable regions of Ig light or heavy chains. Additionally, on day 35, an abundance of the genus Coprococcus correlated with 3,632 genes (2,501 upregulated and 1,131 downregulated genes); we found strong correlations with 19 TCR genes and 93 Ig genes, which consisted of six constant region genes, including Igha, Ighg1, and Ighg2c and 87 variable regions of heavy and light chains (Figure 6). Most of these TCR and Ig genes were correlated with the genus Coprococcus only, although Igha and Iglv2 expressions were also correlated with the genus Marbinbryantia on days 7 and 35, respectively. The abundance of the genus Coprococcus also correlated with other immune genes, particularly genes related to MHC class I and class II, complements, and toll-like receptors (TLRs) (Figure 6, list).
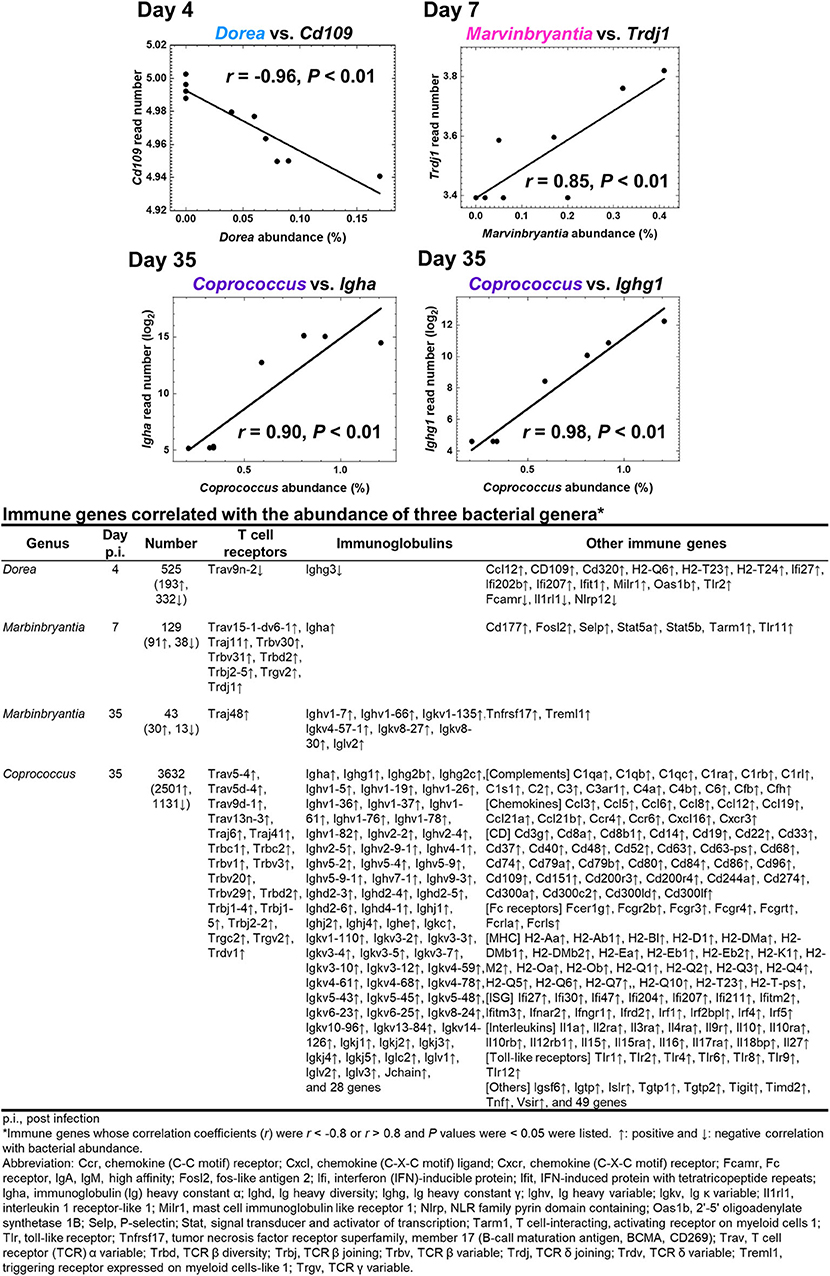
Figure 6. Correlations of relative abundance of three fecal bacterial genera with CNS gene expressions. The correlations were determined by pattern matching between fecal microbiome and CNS transcriptome data. (Top) Representative genes correlated with bacterial relative abundance: day 4, Dorea, negative correlation with Cd109; day 7, Marvinbrynantia positive correlation with TCRδ (Trd); and day 35, Coprococcus positive correlation with Ig heavy chain α gene (Igha) and Ig heavy chain γ1 (Ighg1). (Bottom) A list of representative genes correlated with relative abundance of three genera positively (↑, r > 0.8), or negatively (↓, r < −0.8); complete gene lists were shown in Supplemental Table 4. We calculated correlation coefficients between bacterial relative abundance vs. CNS gene expressions that were significantly different between control and TMEV groups by R and listed the correlated genes whose P values < 0.05.
Antibody Isotype Responses in TMEV Infection
The RNA-seq data of immune-related genes, including TCR and Ig, during the acute and chronic phases of TMEV infection were consistent with the findings previously reported using various methods, such as ELISA, flow cytometry, and immunohistochemistry in TMEV research (15, 50). We have validated representative RNA-seq data, using real-time PCR, including gene expressions of Ig heavy chains of IgG1, IgG2b, IgG2c, IgA, J chains, and TCRs (Supplemental Figure 6). Since TMEV-specific IgG-positive B and plasma cells have been demonstrated in TMEV infection (51), we anticipated upregulation of heavy chains (IgG1, G2b, and G2c) and κ light chain. On the other hand, the gene expression of IgA and J chain, reflecting the production of IgA dimers, components of mucosal immunity, was not anticipated in the CNS of TMEV infection.
We tested whether the expression data of Ig genes could correlate with serum anti-TMEV IgG1, IgG2b, IgG2c, and IgA antibody titers (Figure 7). We found that all Ig isotype titers were correlated significantly with the gene expression data, suggesting that increased TMEV-specific Ig isotype responses explain the upregulation of Ig isotype gene expressions in the CNS. Thus, anti-TMEV antibody-producing cells seemed to infiltrate in the CNS, preferentially.
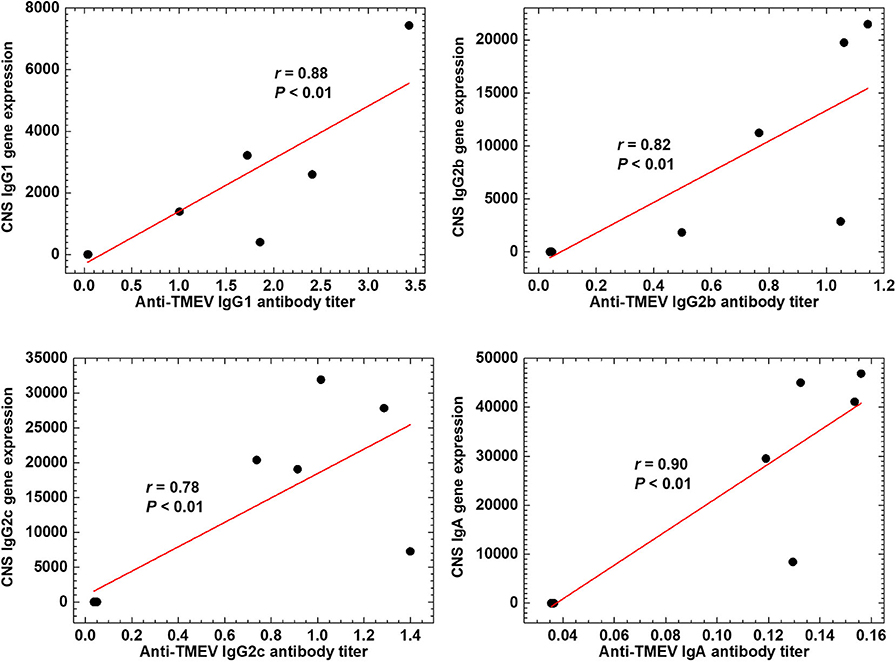
Figure 7. Anti-TMEV antibody isotype responses. Correlations between CNS Ig isotype expressions and serum anti-TMEV isotype antibody titers. During the chronic phase of TMEV infection, gene expression levels of constant regions of heavy chains of IgG1 (Ighg1), IgG2b (Ighg2b), IgG2c (Ighg2c), and IgA (Igha) were correlated with their anti-TMEV antibody isotype titers, significantly (P < 0.01, n = 10). We quantified the gene expression levels and anti-TMEV antibody titers by RNA-seq and enzyme-linked immunosorbent assays (ELISA, absorbance at 490 nm), respectively.
IgA Deposition in the Spinal Cord During the Chronic Phase of TMEV Infection
Although infiltration of T-cells and IgG-positive B cells in the CNS has been known during the acute and chronic phases of TMEV infection (15, 50), IgA responses have never been investigated in TMEV infection, since IgA response, in general, has been associated with mucosal immunity, not neuroinflammation. We investigated the localization of IgA-producing cells as well as IgA deposition using immunohistochemistry with sections of the intestine and spinal cord from uninfected control mice as positive and negative controls. In control mice, IgA-positive cells were present in the lamina propria of the intestine (Figure 8A), but absent in the spinal cord (Figure 8B). During the chronic phase of TMEV infection, we observed demyelinating lesions in the white matter of the spinal cord with perivascular cuffing (i.e., inflammation) and meningitis (Figure 8C). In the demyelinating lesions, we detected a substantial number of intense IgA-positive small round cells and larger cells with abundant cytoplasm, which were present in the meninges and perivascular cuffing, and infiltrating in the parenchyma (Figures 8D,G,H). We also detected extracellular IgA deposition in the demyelinating lesions. During the acute phase, TMEV induced inflammation in the gray matter and meninges, where IgA staining was not evident (data not shown). We also tested whether IgA positive cells could be seen in chronic inflammatory demyelinating lesions of the autoimmune model for MS, EAE induced with PLP sensitization in SJL/J mice. Although we observed inflammatory demyelinating lesions in the spinal cord of EAE mice, comparable to TMEV-induced demyelination (Figure 8E), IgA staining was undetectable in the EAE lesions (Figures 8F,I,K).
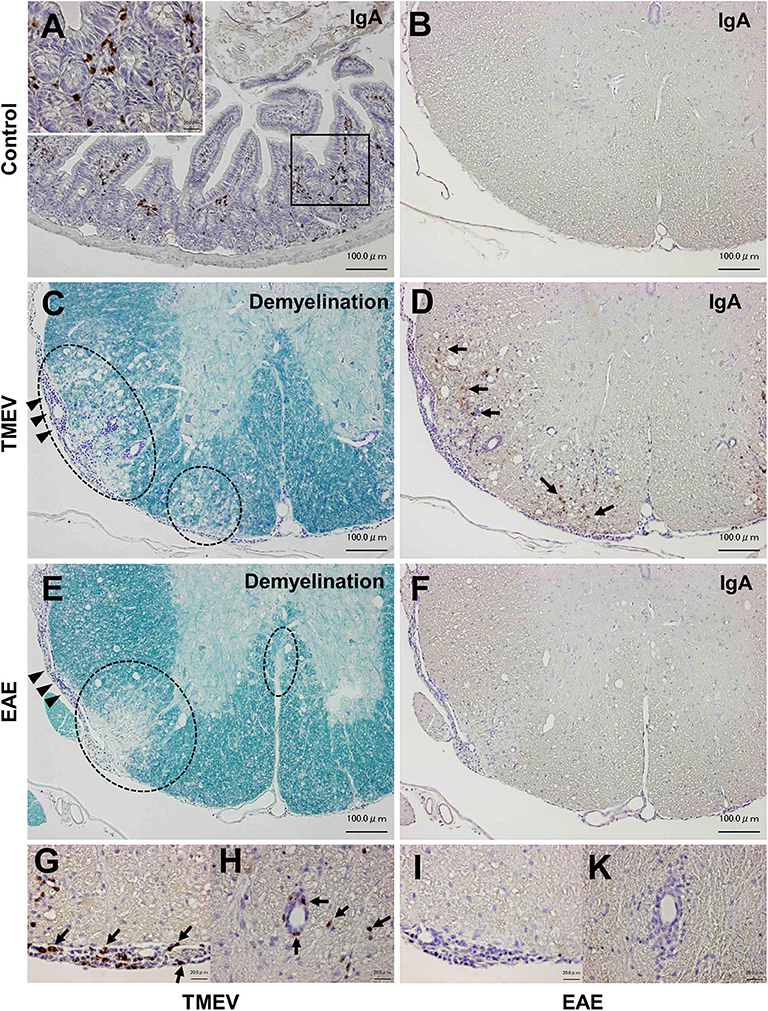
Figure 8. IgA immunohistochemistry in inflammatory demyelinating lesions in two models for multiple sclerosis. (A) We used IgA-producing cells in the lamina propria of the small intestine from uninfected control mice as positive controls for IgA immunohistochemistry. (B) In control mice, we did not detect IgA-positive cells in the spinal cord. (C,D) During the chronic phase of TMEV infection, inflammatory demyelinating lesions were present in the white matter of the spinal cord, where IgA strongly positive cells (arrows) were present in demyelinating parenchyma (D), meningitis (G), and perivascular cuffing (H). IgA deposition was also observed in demyelinating lesions (D). (E,F) Chronic inflammatory demyelinating lesions in the white matter of the spinal cord in experimental autoimmune encephalomyelitis (EAE) induced with myelin proteolipid protein (PLP). Despite the presence of inflammatory demyelination, there was no IgA immunoreactivity in the parenchymal (F), meningeal (I), or perivascular (K) inflammatory lesion of the spinal cord. Scale bar = 100 μm (A–F) and 20 μm (G–K). (A,B,D,F–K), IgA immunohistochemistry. (C,E), Luxol fast blue stain. Dotted lines, demyelinating lesions. Arrowheads, meningitis. These sections are representative of naive, TMEV-infected, or EAE mice (n = 3–5 per group).
No Cross-Reactive Antibody Isotype Responses to Coprococcus in TMEV Infection
Coprococcus, a component of human fecal microbiota, has been shown to potentially associate with humoral immune responses. Antibody responses to Coprococcus have been reported to differ in patients with IBD, compared with controls. Coprococcus has also been reported to interact with immunoglobulin in vitro. Since the gene expressions of several Ig heavy chain isotypes were correlated with Coprococcus abundance during the chronic phase of TMEV infection, we investigated how Coprococcus could affect antibody responses in TMEV infection. First, we established the ELISA system to detect anti-Coprococcus antibody, using sera from Coprococcus-sensitized mice as positive controls (44). We found that, although some sera from TMEV-infected mice seemed to react Coprococcus antigens weakly, we did not observe significant anti-Coprococcus antibody responses in sera from TMEV-infected mice (Figure 9A). Next, we tested whether anti-TMEV antibodies could cross-react with Coprococcus antigen. We incubated sera from TMEV-infected mice with Coprococcus antigen, positive control TMEV antigen, or two negative control antigens: H. pylori antigen or MOG peptide. Following overnight incubation, we conducted anti-TMEV isotype antibody ELISA to see whether adsorption with these antigens could decrease serum TMEV isotype antibody responses. Only the adsorption of TMEV antigen decreased anti-TMEV antibody isotype responses (IgG1, Figure 9B; IgG2c, Figure 9C; and IgA, data not shown). Thus, anti-TMEV antibodies did not cross-react with Coprococcus antigen in vitro.
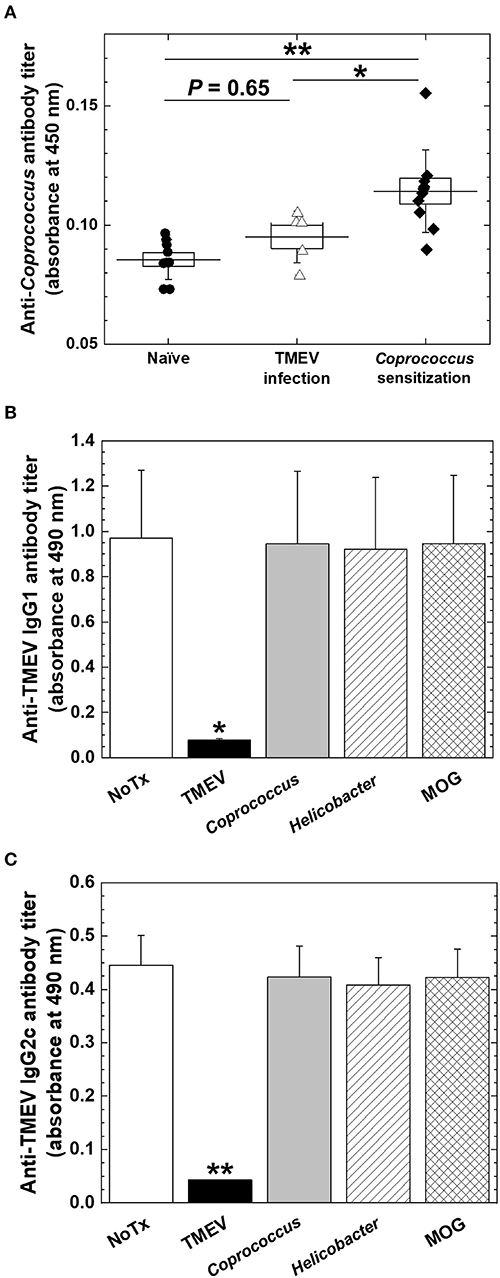
Figure 9. Anti-Coprococcus antibody responses in TMEV infection. (A) Using ELISA plates coated with Coprococcus antigen, we titrated serum anti-Coprococcus antibody responses in naive mice (n = 7), chronically TMEV-infected mice (n = 5), and Coprococus-sensitized mice (n = 10). We did not find significantly increased anti-Coprococcus antibody responses in TMEV infection (P = 0.65, ANOVA, compared with naive mice). *P < 0.05, **P < 0.01, ANOVA, compared with Coprococcus-sensitized mice. (B,C) We conducted anti-TMEV IgG1 (B) and IgG2c (C) isotype antibody ELISAs using sera in chronic TMEV infection. We incubated the sera overnight in the absence (None, white bar) or the presence of TMEV antigen (black bar), Coprococcus antigen (gray bar), Helicobacter pylori antigen (hatched bar), or myelin oligodendrocyte glycoprotein (MOG) peptide (cross-hatched bar). Only the adsorption of TMEV antigen decreased anti-TMEV antibody isotype responses. Shown are mean + SE of antibody titers of five sera per group.
Discussion
In the current study, we first demonstrated distinct gene expression patterns on days 4, 7, and 35, using TMEV-infected CNS transcriptome data by k-means clustering with a radar chart (Figure 1). We found that T-cell-related genes, including TCR genes during the acute phase and Ig-related genes during the chronic phase, were highly upregulated, comprising distinct clusters 13 and 5, respectively. Next, we investigated that changes in overall gut microbiome (i.e., dysbiosis) could be associated with these unique gene expression patterns during the time course of TMEV infection, using PCA and alpha diversity indices.
Although overall changes in microbiome patterns by PCA have been demonstrated in many diseases having associations of microbiota with pathophysiology, we did not identify samples from TMEV-infected groups as distinct population by PCA (Figure 2). We found increased PC2 values over the time course by PCA of only TMEV microbiome data; the PC2 values might reflect the presence of CNS inflammation. The PC2 values were correlated with increased two taxa of the family S24-7 and decreased Anaeroplasma genus. The family S24-7, which belongs to the phylum Bacteroidetes, is anaerobic, non-motile, Gram-negative bacteria and present within the human gut (52). The genus Anaeroplasma, which belongs to the phylum Tenericutes, is anaerobic, non-motile, and Gram-negative bacteria (53). The analysis of relative abundance of bacteria at the genus level also showed increased S24-7 and decreased Anaeroplasma genera over the course of TMEV infection (Figure 2B). However, since there were no statistical differences in relative abundance of these bacteria among TMEV and control groups, the pathogenic roles of S24-7 and Anaeroplasma could be limited, although they might play a minor role in CNS inflammation following TMEV infection.
We observed no significant changes in alpha diversity of microbiome by Shannon index in TMEV-infected mice, although we found increases in evenness by Pielou's index over the time course (Figure 3). In most microbiota-associated diseases and health conditions, such as IBD and obesity, alpha diversity has been reported to be decreased (54, 55). In TMEV infection, one research group also reported the decreased diversity in fecal microbiota (56, 57). Although the difference between our results and others might be due to the environment and location of mouse breeding such as diet and stress (58), our results were consistent with findings in human MS by Miyake et al. (59), in which the diversity did not show significant difference in the feces of MS patients. In human AFM, two research groups examined microbial flora, using nasopharyngeal swabs or CSF samples to find the pathogens to cause AFM, rather than to characterize microbiome (60, 61), where no consistent changes in microbiota were observed because of a limited number and amount of samples. Breitwieser et al. (60) identified potential involvement of Haemophilus influenzae and Staphylococcus aureus in one swab sample each and discussed that bacterial infections or their immune responses may trigger pathogenic processes.
Since overall changes in gut microbiome seemed not to contribute to TMEV pathophysiology, we tested whether relative abundance of distinct bacterial genera could be associated with TMEV-induced neuroinflammation. During the time course of TMEV infection, we identified the significant changes of abundance of three bacterial genera, Dorea, Marvinbryantia, and Coprococcus in TMEV-infected group (Figure 5). All the three genera, which were isolated from human feces, are anaerobic, non-motile and non-spore-forming Gram-positive bacteria and belong to the family Lachnospiraceae (62–65). Using pattern matching (Figure 6), we found strong correlations between relative abundance of the three bacterial genera and CNS gene expressions, including immune-related genes. On day 4, decreased Dorea correlated with expressions of several immune-related genes, including CD109 (66). Abundance of the genus Marvinbryantia correlated with eight TCR genes, including α, β, γ, and δ chains, only one Ig gene on day 7, and with only one TCR gene and seven Ig genes on day 35. These results were consistent with the heat map and k-means clustering data, where TCR and Ig genes were most highly upregulated in the CNS on days 7 and 35, respectively. Except for Igha, all TCR and Ig genes correlated with Marvinbryantia abundance were variable regions of TCR and Ig genes. It will be interesting to test whether these TCR and Ig genes could be used to recognize Marvinbryantia and, if so, whether the TCRs and Igs could also recognize TMEV antigens by molecular mimicry between bacterial and viral antigens (67).
Although the genus Marvinbryantia correlated mainly with a limited number of TCR and Ig genes, abundance of the genus Coprococcus correlated strongly with a larger number of TCR and Ig genes: 19 TCR genes and 93 Ig genes including IgA and J chains. Most of the TCR and Ig genes were correlated with the genus Coprococcus only, although Igha and Iglv2 expressions were also correlated with the genus Marbinbryantia on days 7 and 35, respectively. Marbinbryantia abundance was related to mostly variable regions of a small number of TCR or Ig genes. On the other hand, Coprococcus abundance correlated with both variable and constant regions of Ig; increased Coprococcus may be associated with polyclonal activation of B cells. In addition, we found significant associations of Coprococcus abundance with other immune genes, including MHC class I and II and complements as well as chemokines, cytokines, and TLRs (Figure 6, bottom list). Thus, increased Coprococcus may be linked to a more general pro-inflammatory condition involving not only T and B cells, but also other immune components including antigen presenting cells.
The upregulated immune genes in the CNS were likely TMEV-specific, since upregulation of TMEV-specific T-cell and antibody responses have been demonstrated in the CNS during the acute and chronic phases of TMEV infection (15, 50). Consistent with previous findings, we found that the upregulated IgG-isotype gene expressions were highly correlated with TMEV-specific IgG isotype titers (Figure 7). For the first time, we demonstrated that increased IgA gene expression was correlated with anti-TMEV IgA titer. Using immunohistochemistry, we found that IgA-positive cells and IgA deposition were observed in and around inflammatory demyelinating lesions (Figure 8). Currently, we do not know whether IgA in the lesions plays a protective or pathogenic role in the CNS of TMEV infection. In EAE, an autoimmune model for MS, recirculating intestinal IgA-producing cells have been demonstrated to regulate neuroinflammation (68).
Although we do not know how certain bacteria in the gut can influence the gene expressions in the CNS, one straightforward explanation is that gut bacteria affect mucosal immunity, resulting in the activation of systemic immune cells, which leads to CNS infiltration. Among the three bacteria with altered abundance in the gut microbiota in TMEV infection, the physiological and pathogenic roles of Dorea and Marvinbryantia genera are largely unknown. On the other hand, the genus Coprococcus is a component of human fecal microbiota (69, 70), and their increased abundance was observed in patients with neuromyelitis optica (NMO), but not in MS, compared with healthy controls (71, 72). NMO is an inflammatory demyelinating disease, in which autoantibody against the water channel protein aquoaporin-4 has been associated with pathogenesis. In NMO, other bacteria including Clostridium perfringens were also significantly increased in feces, where several immunoregulatory roles of the bacteria have been proposed, although the role of the genus Coprococcus is unknown.
To clarify the role of Coprococcus in TMEV infection, we were not able to use standard approaches using germ-free (GF) mice or antibiotic cocktail treatment (73–77), since (1) GF mice and antibody treatment have been shown to increase blood–brain barrier (BBB) permeability (78); (2) GF mice have several immunological abnormalities even in naive mice, for example, TLR responses and T helper (Th) 17 responses which have been shown to play a key role in TMEV infection (43, 79); (3) depletion of microbiota by antibiotic cocktail have been shown to be lethal in TMEV infection (56); and (4) mono-colonization of GF mice with the non-spore-forming anaerobic Coprococcous is technically difficult. Thus, we decided to take a different approach by investigating antibody responses to Coprococcus.
Previously, agglutinating antibodies to Coprococcus have been found more frequently in sera of patients with Crohn's disease (44, 80, 81). Sera from Crohn's disease had not only specific Coprococcus binding of IgG through Fab portion, but also non-specific Coprococcus binding through Fc portions, the latter of which was similar to Staphylococcus aureus protein A (80). Thus, Coprococcus potentially has unique interactions with antibodies. Here, we tested whether (1) anti-TMEV isotype antibodies could cross-react with Coprococcus and (2) sera from TMEV-infected mice contained anti-Coprococcus antibody titers. In the current experiments, however, we found neither cross-reactivities between anti-TMEV vs. anti-Coprococcus antibodies nor induction of anti-Coprococcus antibody responses in TMEV infection, although these negative results could be attributed to technical difficulties in extraction of Coproccoccus antigen (44). Thus, we do not know how increased Coprococcus could be associated with antibody responses. Coprococcus might have a function to increase antibody isotype responses, particularly IgA production, which have been reported in other gut bacteria including Clostridia and segmented filamentous bacteria, previously (76). In EAE, a two-phase scenario of neuroinflammation has been proposed, where (1) gut microbiota initiates/expands autoimmune Th17 responses in gut-associated lymphatic tissue (GALT), then, (2) this leads to Th17-cell infiltration into the CNS (73). Similarly, in TMEV infection, distinct gut microbiota might initiate/expand IgA-producing cells in GALT, leading to IgA-producing cell infiltration and IgA deposition in the CNS.
Other than alterations of immune responses by microbiota, there are several possibilities that microbiota can affect viral diseases. For example, bacterial components, including lipopolysaccharide, have been shown to promote enteric virus replication and systemic pathogenesis (82). In addition, different enzymes from various bacteria have been shown to enhance virus infectivity and pathogenicity in vivo (83, 84). We performed predictive metagenome profiling, using microbiome data of TMEV-infected groups by PICRUSt. We were able to predict the changes in two pathways, arachidonic acid metabolism and ether lipid metabolism; we identified sets of bacteria that belong to the order Clostridiales were involved in the two pathways (Supplemental Figure 7). Currently, however, we do not know how these pathway changes in the gut microbiota could affect neuroinflammation in TMEV infection, although it is intriguing that changes in arachidonic and lipid metabolism in the CNS have been reported in MS ant the TMEV model (85–89).
In conclusion, we found changes of a limited number of distinct bacterial genera in feces during the acute and chronic phases of TMEV infection. Each bacterial genus identified was associated with upregulation of different TCR and IgG/IgA gene expressions in the spinal cord (Figure 10). This is the first report suggesting that a limited number of gut bacteria could be associated with distinct TCR and Ig gene expressions and influence the inflammatory events, particularly IgA upregulation, which were observed in AFM-like and MS-like diseases in the spinal cord. However, we cannot rule out an alternative scenario for our findings in which activated immune responses could be altering the composition of the gut microbiota. Future experiments will further tease out these time-dependent communications between certain gut bacteria and the immune system, providing possible therapeutic strategies for the management and treatment of inflammation associated with AFM and MS-like diseases.
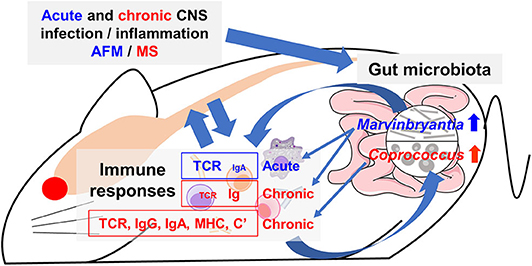
Figure 10. Working hypothesis of communication between the CNS and gut microbiota mediated by immune system. Acute or chronic CNS infection TMEV results in inflammation of the gray matter or white matter of the spinal cord, leading to diseases mimic acute flaccid myelitis (AFM) or multiple sclerosis (MS), respectively. Alteration of a limited number of distinct bacteria in gut microbiota was associated with different immune gene expressions during the acute and chronic phases. The genus Marvinbryantia abundance correlated with gene expressions of distinct T-cell receptors (TCR) and immunoglobulin (Ig) A during the acute phase and those of Igs during the chronic phase. The genus Coprococcus abundance was associated not only TCR and Ig (IgG isotypes and IgA) but also other immune related genes, including major histocompatibility complex (MHC) and complements (C'). Here, alteration of a small number of gut bacteria may affect distinct immune responses and then lesions in the CNS, although we do not know the precise pathophysiology, particularly the CNS upregulation of IgA, which is a component of mucosal immunity. Alternatively, activated immune response would alter composition of gut microbiota.
Data Availability Statement
The datasets generated for this study can be found in the Gene Expression Omnibus (GEO) at the National Center for Biotechnology Information (NCBI, Bethesda, MD, USA; accession no. GSE120041, https://www.ncbi.nlm.nih.gov/geo/query/acc.cgiacc=GSE120041) and the Sequence Read Archive (SRA) at NCBI (Bioproject accession no. PRJNA561088; Biosample accession no. SAMN12607114-SAMN12607143).
Ethics Statement
All animal experiments were approved by the Louisiana State University Health Sciences Center-Shreveport (LSUHSC-S, LA, USA) and the Kindai University Faculty of Medicine (Osaka, Japan) Institutional Animal Care and Use Committee (IACUC) guidelines and followed the National Research Council's Guide for the Care and Use of Laboratory Animals, the Institute of Laboratory Animal Resources (ILAR), and the guideline ‘Fundamental Guidelines for Proper Conduct of Animal Experiment and Related Activities in Academic Research Institutions' from the Ministry of Education, Culture, Sports, Science and Technology, Japan.
Author Contributions
IT, KN, and FG conceived and supervised the project. FS, SK, YN, AK, and IT designed and conducted immunological experiments. SO and MF conducted bioinformatics analyses. A-MP conducted immunohistochemistry and Coprococcus experiments. SO and IT wrote the manuscript. All authors read and approved the final manuscript.
Funding
This work was supported by grants from the National Institute of General Medical Sciences COBRE Grant (8P20 GM 103433, IT), the KAKENHI from the Japan Society for the Promotion of Science [Grant-in-Aid for Scientific Research (C) KAKENHI (SO, JP19K08569; IT, JP20K07455; and FS, JP20K07433) and a Grant-in-Aid for Scientific Research on Innovative Areas Frontier Research on Chemical Communications (No 17H06400 and 17H06404, IT)], Research Program on Emerging and Re-emerging Infectious Diseases from the Japan Agency for Medical Research and Development (AMED) under grant number 20fk0108084h0802 (IT), The Royal Society Wolfson Fellowship, UK (RSWF\R3\183001, FG), and Novartis Pharma Research Grants (IT and SO).
Conflict of Interest
The authors declare that the research was conducted in the absence of any commercial or financial relationships that could be construed as a potential conflict of interest.
Acknowledgments
We appreciate Dr. Shiro Tochitani, Suzuka University of Medical Science, and Dr. Hideki Noguchi, Joint Support-Center for Data Science Research, Research Organization of Information and Systems, for helpful comments in bioinformatics analyses. We also thank Shantel A. Vital, Dr. Hilary A. Seifert, Paula Polk, Dr. Felicia Lindeberg, and Namie Sakiyama for their excellent technical help.
Supplementary Material
The Supplementary Material for this article can be found online at: https://www.frontiersin.org/articles/10.3389/fimmu.2020.01138/full#supplementary-material
References
1. Tsunoda I, Omura S, Sato F, Kusunoki S, Fujita M, Park A-M, et al. Neuropathogenesis of Zika virus infection: potential roles of antibody-mediated pathology. Acta Med Kinki Univ. (2016) 41:37–52.
2. Griffin DE. Alphavirus encephalomyelitis: mechanisms and approaches to prevention of neuronal damage. Neurotherapeutics. (2016) 13:455–60. doi: 10.1007/s13311-016-0434-6
3. Messacar K, Asturias EJ, Hixon AM, Van Leer-Buter C, Niesters HGM, Tyler KL, et al. Enterovirus D68 and acute flaccid myelitis—evaluating the evidence for causality. Lancet Infect Dis. (2018) 18:e239–47. doi: 10.1016/S1473-3099(18)30094-X
4. Morens DM, Folkers GK, Fauci AS. Acute flaccid myelitis: something old and something new. mBio. (2019) 10:e00521-19. doi: 10.1128/mBio.00521-19
5. Hixon AM, Yu G, Leser JS, Yagi S, Clarke P, Chiu CY, et al. A mouse model of paralytic myelitis caused by enterovirus D68. PLoS Pathog. (2017) 13:e1006199. doi: 10.1371/journal.ppat.1006199
6. McKay SL, Lee AD, Lopez AS, Nix WA, Dooling KL, Keaton AA, et al. Increase in acute flaccid myelitis — United States, 2018. Morb Mortal Wkly Rep. (2018) 67:1273–75. doi: 10.15585/mmwr.mm6745e1
7. Blinkova O, Kapoor A, Victoria J, Jones M, Wolfe N, Naeem A, et al. Cardioviruses are genetically diverse and cause common enteric infections in South Asian children. J Virol. (2009) 83:4631–41. doi: 10.1128/JVI.02085-08
8. Kreuter JD, Barnes A, McCarthy JE, Schwartzman JD, Oberste MS, Rhodes CH, et al. A fatal central nervous system Enterovirus 68 infection. Arch Pathol Lab Med. (2011) 135:4. doi: 10.1043/2010-0174-CR.1
9. Hixon AM, Clarke P, Tyler KL. Evaluating treatment efficacy in a mouse model of enterovirus D68–associated paralytic myelitis. J Infect Dis. (2017) 216:1245–53. doi: 10.1093/infdis/jix468
10. Zhang C, Zhang X, Dai W, Liu Q, Xiong P, Wang S, et al. A mouse model of enterovirus D68 infection for assessment of the efficacy of inactivated vaccine. Viruses. (2018) 10:58. doi: 10.3390/v10020058
11. Sun S, Bian L, Gao F, Du R, Hu Y, Fu Y, et al. A neonatal mouse model of enterovirus D68 infection induces both interstitial pneumonia and acute flaccid myelitis. Antiviral Res. (2019) 161:108–115. doi: 10.1016/j.antiviral.2018.11.013
12. Chong PF, Kira R, Mori H, Okumura A, Torisu H, Yasumoto S, et al. Clinical features of acute flaccid myelitis temporally associated with an Enterovirus D68 outbreak: results of a nationwide survey of acute flaccid paralysis in Japan, August–December (2015). Clin Infect Dis. (2018) 66:653–64. doi: 10.1093/cid/cix860
13. Cignarella F, Cantoni C, Ghezzi L, Salter A, Dorsett Y, Chen L, et al. Intermittent fasting confers protection in CNS autoimmunity by altering the gut microbiota. Cell Metab. (2018) 27:1222–35.e6. doi: 10.1016/j.cmet.2018.05.006
14. Kira J. Genetic and environmental backgrounds responsible for the changes in the phenotype of MS in Japanese subjects. Mult Scler Relat Disord. (2012) 1:188–95. doi: 10.1016/j.msard.2012.05.003
15. Sato F, Omura S, Martinez NE, Tsunoda I. Chapter 3: Animal models of multiple sclerosis. In: Minagar A, editor. Neuroinflammation. 2nd ed. Burlington, MA: Elsevier (2018). p. 37–72.
16. Park A-M, Omura S, Fujita M, Sato F, Tsunoda I. Helicobacter pylori and gut microbiota in multiple sclerosis versus Alzheimer's disease: 10 pitfalls of microbiome studies. Clin Exp Neuroimmunol. (2017) 8:215–32. doi: 10.1111/cen3.12401
17. Tsunoda I. Lymphatic system and gut microbiota affect immunopathology of neuroinflammatory diseases, including multiple sclerosis, neuromyelitis optica and Alzheimer's disease. Clin Exp Neuroimmunol. (2017) 8:177–9. doi: 10.1111/cen3.12405
18. Hansen JJ. Immune responses to intestinal microbes in inflammatory bowel diseases. Curr Allergy Asthma Rep. (2015) 15:61. doi: 10.1007/s11882-015-0562-9
19. Mondot S, Kang S, Furet JP, Aguirre de Carcer D, McSweeney C, Morrison M, et al. Highlighting new phylogenetic specificities of Crohn's disease microbiota. Inflamm Bowel Dis. (2011) 17:185–92. doi: 10.1002/ibd.21436
20. Forbes JD, Van Domselaar G, Bernstein CN. The gut microbiota in immune-mediated inflammatory diseases. Front Microbiol. (2016) 7:1081. doi: 10.3389/fmicb.2016.01081
21. Budhram A, Parvathy S, Kremenchutzky M, Silverman M. Breaking down the gut microbiome composition in multiple sclerosis. Mult Scler. (2017) 23:628–36. doi: 10.1177/1352458516682105
22. Boros Á, Orlovácz K, Pankovics P, Szekeres S, Földvári G, Fahsbender E, et al. Diverse picornaviruses are prevalent among free-living and laboratory rats (Rattus norvegicus) in Hungary and can cause disseminated infections. Infect Genet Evol. (2019) 75:103988. doi: 10.1016/j.meegid.2019.103988
23. Tsunoda I, Iwasaki Y, Terunuma H, Sako K, Ohara Y. A comparative study of acute and chronic diseases induced by two subgroups of Theiler's murine encephalomyelitis virus. Acta Neuropathol. (1996) 91:595–602. doi: 10.1007/s004010050472
24. Omura S, Kawai E, Sato F, Martinez NE, Minagar A, Al-Kofahi M, et al. Theiler's virus-mediated immunopathology in the CNS and heart: roles of organ-specific cytokine and lymphatic responses. Front Immunol. (2018) 9:2870. doi: 10.3389/fimmu.2018.02870
25. Ransohoff RM, Kivisäkk P, Kidd G. Three or more routes for leukocyte migration into the central nervous system. Nat Rev Immunol. (2003) 3:569–81. doi: 10.1038/nri1130
26. Omura S, Sato F, Martinez NE, Park A-M, Fujita M, Kennett NJ, et al. Bioinformatics analyses determined the distinct CNS and peripheral surrogate biomarker candidates between two mouse models for progressive multiple sclerosis. Front Immunol. (2019) 10:516. doi: 10.3389/fimmu.2019.00516
27. Sato F, Kawai E, Martinez NE, Omura S, Park A-M, Takahashi S, et al. T-bet, but not Gata3, overexpression is detrimental in a neurotropic viral infection. Sci Rep. (2017) 7:10496. doi: 10.1038/s41598-017-10980-0
28. Olitsky PK. Certain properties of Theiler's virus, especially in relation to its use as model for poliomyelitis. Proc Soc Exp Biol Med. (1945) 58:77–81. doi: 10.3181/00379727-58-14849
29. Olitsky PK, Schlesinger RW. Histopathology of CNS of mice infected with virus of Theiler's disease (spontaneous encephalomyelitis.). Proc Soc Exp Biol Med. (1941) 47:79–83. doi: 10.3181/00379727-47-13045
30. Theiler M. Encephalomyelitis of mice: I. characteristics and pathogenesis of the virus. J Exp Med. (1940) 72:49–67. doi: 10.1084/jem.72.1.49
31. Daniels JB, Pappenheimer AM, Richardson S. Observations on encephalomyelitis of mice (DA strain). J Exp Med. (1952) 96:517–30. doi: 10.1084/jem.96.6.517
32. Xia Y, Sun J, Chen DG. Chapter 5: Power sample size calculations for microbiome data. In: J. Chen D, Chen G, editors. Statistical analysis of microbiome data with R ICSA Book Series in Statistics. Singapore: Springer Singapore (2015). p. 129–66.
33. Gentleman R, Carey V, Huber W, Irizarry R, Dudoit S, editors. Bioinformatics and Computational Biology Solutions Using R and Bioconductor. 1st ed. New York, NY: Springer (2005).
34. Richardson BA, Overbaugh J. Basic statistical considerations in virological experiments. J Virol. (2005) 79:669–76. doi: 10.1128/JVI.79.2.669-676.2005
35. National Research Council of the National Academies. Guide For The Care And Use Of Laboratory Animals. 8th ed. Washington, DC: The National Academies Press (2011).
36. R Core Team. R: A Language and Environment for Statistical Computing. Vienna: R Foundation for Statistical Computing. (2018). Available online at: https://www.R-project.org/
37. Love MI, Huber W, Anders S. Moderated estimation of fold change and dispersion for RNA-seq data with DESeq2. Genome Biol. (2014) 15:550. doi: 10.1186/s13059-014-0550-8
38. Bolyen E, Rideout JR, Dillon MR, Bokulich NA, Abnet CC, Al-Ghalith GA, et al. Reproducible, interactive, scalable and extensible microbiome data science using QIIME 2. Nat Biotechnol. (2019) 37:852–7. doi: 10.1038/s41587-019-0209-9
39. Chaitanya GV, Omura S, Sato F, Martinez NE, Minagar A, Ramanathan M, et al. Inflammation induces neuro-lymphatic protein expression in multiple sclerosis brain neurovasculature. J Neuroinflammation. (2013) 10: doi: 10.1186/1742-2094-10-125
40. Jost L. The relation between evenness and diversity. Diversity. (2010) 2:207–32. doi: 10.3390/d2020207
41. Omura S, Kawai E, Sato F, Martinez NE, Chaitanya GV, Rollyson PA, et al. Bioinformatics multivariate analysis determined a set of phase-specific biomarker candidates in a novel mouse model for viral myocarditis. Circ Cardiovasc Genet. (2014) 7:444–54. doi: 10.1161/CIRCGENETICS.114.000505
42. Davies DL, Bouldin DW. A cluster separation measure. IEEE Trans Pattern Anal Mach Intell. (1979) 1:224–7. doi: 10.1109/TPAMI.1979.4766909
43. Martinez NE, Sato F, Kawai E, Omura S, Takahashi S, Yoh K, et al. Th17-biased RORγt transgenic mice become susceptible to a viral model for multiple sclerosis. Brain Behav Immun. (2015) 43:86–97. doi: 10.1016/j.bbi.2014.07.008
44. Hazenberg MP, Pennock-Schröder AM, van de Merwe JP. Culturing and extraction of Coprococcus comes, absorption of serumagglutinins by soluble fractions and relation between agglutinins and antibodies in sera of patients with Crohn's disease. Med Microbiol Immunol. (1986) 175:299–306. doi: 10.1007/BF02126051
45. Wang LY, Fujinami RS. Enhancement of EAE and induction of autoantibodies to T-cell epitopes in mice infected with a recombinant vaccinia virus encoding myelin proteolipid protein. J Neuroimmunol. (1997) 75:75–83. doi: 10.1016/S0165-5728(96)00235-4
46. Peterson LK, Tsunoda I, Masaki T, Fujinami RS. Polyreactive myelin oligodendrocyte glycoprotein antibodies: implications for systemic autoimmunity in progressive experimental autoimmune encephalomyelitis. J Neuroimmunol. (2007) 183:69–80. doi: 10.1016/j.jneuroim.2006.11.024
47. Park A-M, Hagiwara S, Hsu DK, Liu F-T, Yoshie O. Galectin-3 plays an important role in innate immunity to gastric infection by helicobacter pylori. Infect Immun. (2016) 84:1184–93. doi: 10.1128/IAI.01299-15
48. Fernando V, Omura S, Sato F, Kawai E, Martinez NE, Elliott SF, et al. Regulation of an autoimmune model for multiple sclerosis in Th2-biased GATA3 transgenic mice. Int J Mol Sci. (2014) 15:1700–18. doi: 10.3390/ijms15021700
49. Tsunoda I, Tolley ND, Theil DJ, Whitton JL, Kobayashi H, Fujinami RS. Exacerbation of viral and autoimmune animal models for multiple sclerosis by bacterial DNA. Brain Pathol. (1999) 9:481–93. doi: 10.1111/j.1750-3639.1999.tb00537.x
50. Tsunoda I, Fujinami RS. Neuropathogenesis of Theiler's murine encephalomyelitis virus infection, an animal model for multiple sclerosis. J Neuroimmune Pharmacol. (2010) 5:355–69. doi: 10.1007/s11481-009-9179-x
51. Tsunoda I, Fujinami RS. Theiler's murine encephalomyelitis virus (TMEV). In: Ahmed R, Chen ISY, editors. Persistent Viral Infections. Chichester, West Sussex: John Wiley & Sons, Ltd. (1999). p. 517–36.
52. Ormerod KL, Wood DLA, Lachner N, Gellatly SL, Daly JN, Parsons JD, et al. Genomic characterization of the uncultured Bacteroidales family S24-7 inhabiting the guts of homeothermic animals. Microbiome. (2016) 4:36. doi: 10.1186/s40168-016-0181-2
53. Robinson IM, Freundt EA. Proposal for an amended classification of anaerobic Mollicutes. Int J Syst Bacteriol. (1987) 37:78–81. doi: 10.1099/00207713-37-1-78
54. Muñiz Pedrogo DA, Chen J, Hillmann B, Jeraldo P, Al-Ghalith G, Taneja V, et al. An increased abundance of Clostridiaceae characterizes arthritis in inflammatory bowel disease and rheumatoid arthritis: a cross-sectional study. Inflamm Bowel Dis. (2019) 25:902–13. doi: 10.1093/ibd/izy318
55. Turnbaugh PJ, Hamady M, Yatsunenko T, Cantarel BL, Duncan A, Ley RE, et al. A core gut microbiome in obese and lean twins. Nature. (2009) 457:480–4. doi: 10.1038/nature07540
56. Carrillo-Salinas FJ, Mestre L, Mecha M, Feliú A, del Campo R, Villarrubia N, et al. Gut dysbiosis and neuroimmune responses to brain infection with Theiler's murine encephalomyelitis virus. Sci Rep. (2017) 7:44377. doi: 10.1038/srep44377
57. Mestre L, Carrillo-Salinas FJ, Mecha M, Feliú A, Espejo C, Álvarez-Cermeño JC, Villar LM, et al. Manipulation of gut microbiota influences immune responses, axon preservation, and motor disability in a model of progressive multiple sclerosis. Front Immunol. (2019) 10:1374. doi: 10.3389/fimmu.2019.01374
58. Tannock GW, Savage DC. Influences of dietary and environmental stress on microbial populations in the murine gastrointestinal tract. Infect Immun. (1974) 9:591–8. doi: 10.1128/IAI.9.3.591-598.1974
59. Miyake S, Kim S, Suda W, Oshima K, Nakamura M, Matsuoka T, et al. Dysbiosis in the gut microbiota of patients with multiple sclerosis, with a striking depletion of species belonging to clostridia XIVa and IV clusters. PLOS ONE. (2015) 10:e0137429. doi: 10.1371/journal.pone.0137429
60. Breitwieser FP, Pardo CA, Salzberg SL. Re-analysis of metagenomic sequences from acute flaccid myelitis patients reveals alternatives to enterovirus D68 infection. F1000Res. (2019) 4:180. doi: 10.12688/f1000research.6743.2
61. Bowers JR, Valentine M, Harrison V, Fofanov VY, Gillece J, Delisle J, et al. Genomic analyses of acute flaccid myelitis cases among a cluster in Arizona provide further evidence of Enterovirus D68 role. mBio. (2019) 10:e02262-18. doi: 10.1128/mBio.02262-18
62. Lawson PA, Blaut M, Simmering R, Collins MD, Taras D. Reclassification of Eubacterium formicigenerans Holdeman and Moore 1974 as Dorea formicigenerans gen. nov., comb. nov., and description of Dorea longicatena sp. nov., isolated from human faeces. Int J Syst Evol Microbiol. (2002) 52:423–428. doi: 10.1099/00207713-52-2-423
63. Wolin MJ, Miller TL, Lawson PA. Proposal to replace the illegitimate genus name Bryantella Wolin et al. 2004VP with the genus name Marvinbryantia gen. nov. and to replace the illegitimate combination Bryantella formatexigens Wolin et al. 2004VP with Marvinbryantia formatexigens comb. nov. Int J Syst Evol Microbiol. (2008) 58:742–4. doi: 10.1099/ijs.0.65850-0
64. Wolin MJ, Miller TL, Collins MD, Lawson PA. Formate-dependent growth and homoacetogenic fermentation by a bacterium from human feces: description of Bryantella formatexigens gen. nov., sp.‘ nov. Appl Environ Microbiol. (2003) 69:6321–6. doi: 10.1128/AEM.69.10.6321-6326.2003
65. Holdeman LV, Moore WEC. New genus, Coprococcus, twelve new species, and emended descriptions of four previously described species of bacteria from human feces. Int J Syst Bacteriol. (1974) 24:260–77. doi: 10.1099/00207713-24-2-260
66. Zhang H, Carnevale G, Polese B, Simard M, Thurairajah B, Khan N, et al. CD109 restrains activationof cutaneous IL-17-producing γδ T cells by commensal microbiota. Cell Rep. (2019) 29:391–405.e5. doi: 10.1016/j.celrep.2019.09.003
67. Tsunoda I, Fujinami RS. TMEV neuroantigens: Myelin genes proteins, molecular mimicry, epitope spreading autoantibody-mediated remyelination. In: Lavi E, Constantinescu CS, editors. Experimental Models of Multiple Sclerosis. New York, NY: Springer (2005). p. 593–616.
68. Rojas OL, Pröbstel A-K, Porfilio EA, Wang AA, Charabati M, Sun T, et al. Recirculating intestinal IgA-producing cells regulate neuroinflammation via IL-10. Cell. (2019) 176:610–24.e18. doi: 10.1016/j.cell.2018.11.035
69. Benno Y, Endo K, Mizutani T, Namba Y, Komori T, Mitsuoka T. Comparison of fecal microflora of elderly persons in rural and urban areas of Japan. Appl Environ Microbiol. (1989) 55:1100–5. doi: 10.1128/AEM.55.5.1100-1105.1989
70. Ai D, Pan H, Li X, Gao Y, Liu G, Xia LC. Identifying gut microbiota associated with colorectal cancer using a zero-inflated lognormal model. Front Microbiol. (2019) 10:826. doi: 10.3389/fmicb.2019.00826
71. Zamvil SS, Spencer CM, Baranzini SE, Cree BAC. The gut microbiome in neuromyelitis optica. Neurotherapeutics. (2018) 15:92–101. doi: 10.1007/s13311-017-0594-z
72. Cree BAC, Spencer CM, Varrin-Doyer M, Baranzini SE, Zamvil SS. Gut microbiome analysis in neuromyelitis optica reveals overabundance of Clostridium perfringens. Ann Neurol. (2016) 80:443–7. doi: 10.1002/ana.24718
73. Berer K, Mues M, Koutrolos M, Rasbi ZA, Boziki M, Johner C, et al. Commensal microbiota and myelin autoantigen cooperate to trigger autoimmune demyelination. Nature. (2011) 479:538–41. doi: 10.1038/nature10554
74. Geva-Zatorsky N, Sefik E, Kua L, Pasman L, Tan TG, Ortiz-Lopez A, et al. Mining the human gut microbiota for immunomodulatory organisms. Cell. (2017) 168:928–43.e11. doi: 10.1016/j.cell.2017.01.022
75. Kennedy EA, King KY, Baldridge MT. Mouse microbiota models: comparing germ-free mice and antibiotics treatment as tools for modifying gut bacteria. Front Physiol. (2018) 9:1534. doi: 10.3389/fphys.2018.01534
76. Umesaki Y. Use of gnotobiotic mice to identify and characterize key microbes responsible for the development of the intestinal immune system. Proc JPN Acad Ser B Phys Biol Sci. (2014) 90:313–332. doi: 10.2183/pjab.90.313
77. van den Hoogen WJ, Laman JD, 't Hart BA. Modulation of multiple sclerosis and its animal model experimental autoimmune encephalomyelitis by food and gut microbiota. Front Immunol. (2017) 8:1081. doi: 10.3389/fimmu.2017.01081
78. Braniste V, Al-Asmakh M, Kowal C, Anuar F, Abbaspour A, Tóth M, et al. The gut microbiota influences blood-brain barrier permeability in mice. Sci Transl Med. (2014) 6:263ra158. doi: 10.1126/scitranslmed.3009759
79. Sato F, Omura S, Kawai E, Martinez NE, Acharya MM, Reddy PC, et al. Distinct kinetics of viral replication, T cell infiltration, and fibrosis in three phases of myocarditis following Theiler's virus infection. Cell Immunol. (2014) 292:85–93. doi: 10.1016/j.cellimm.2014.10.004
80. Van de Merwe JP, Stegeman JH. Binding of Coprococcus comes to the Fc portion of IgG. A possible role in the pathogenesis of Crohn's disease? Eur J Immunol. (1985) 15:860–3. doi: 10.1002/eji.1830150823
81. Bull K, Matthews N, Rhodes J. Antibody response to anaerobic coccoid rods in Crohn's disease. J Clin Pathol. (1986) 39:1130–4. doi: 10.1136/jcp.39.10.1130
82. Kuss SK, Best GT, Etheredge CA, Pruijssers AJ, Frierson JM, Hooper LV, et al. Intestinal microbiota promote enteric virus replication and systemic pathogenesis. Science. (2011) 334:249–52. doi: 10.1126/science.1211057
83. Tashiro M, Ciborowski P, Klenk H-D, Pulverer G, Rott R. Role of Staphylococcus protease in the development of influenza pneumonia. Nature. (1987) 325:536–7. doi: 10.1038/325536a0
84. Scheiblauer H, Reinacher M, Tashiro M, Rott R. Interactions between bacteria and influenza A virus in the developmentof influenza pneumonia. J Infect Dis. (1992) 166:783–91. doi: 10.1093/infdis/166.4.783
85. Palumbo S. Pathogenesis progression of multiple sclerosis: the role of arachidonic acid–mediated neuroinflammation. In: Zagon IS, McLaughlin PJ, editors. Multiple Sclerosis: Perspectives in Treatment Pathogenesis. Brisbane, QLD: Codon Publications (2009). p. 111–23.
86. Braverman NE, Moser AB. Functions of plasmalogen lipids in health and disease. Biochim Biophys Acta. (2012) 1822:1442–52. doi: 10.1016/j.bbadis.2012.05.008
87. Carlson NG, Hill KE, Tsunoda I, Fujinami RS, Rose JW. The pathologic role for COX-2 in apoptotic oligodendrocytes in virus induced demyelinating disease: Implications for multiple sclerosis. J Neuroimmunol. (2006) 174:21–31. doi: 10.1016/j.jneuroim.2006.01.008
88. Palumbo S, Bosetti F. Alterations of brain eicosanoid synthetic pathway in multiple sclerosis and in animal models of demyelination: role of cyclooxygenase-2. Prostaglandins Leukot Essent Fatty Acids. (2013) 89:273–8. doi: 10.1016/j.plefa.2013.08.008
Keywords: fecal microbiome, dysbiosis, viral model for multiple sclerosis, pattern matching, predictive metagenome analysis, PICRUSt, RNA-Seq, gene expression profiles
Citation: Omura S, Sato F, Park A-M, Fujita M, Khadka S, Nakamura Y, Katsuki A, Nishio K, Gavins FNE and Tsunoda I (2020) Bioinformatics Analysis of Gut Microbiota and CNS Transcriptome in Virus-Induced Acute Myelitis and Chronic Inflammatory Demyelination; Potential Association of Distinct Bacteria With CNS IgA Upregulation. Front. Immunol. 11:1138. doi: 10.3389/fimmu.2020.01138
Received: 06 March 2020; Accepted: 11 May 2020;
Published: 07 July 2020.
Edited by:
Alessio Fasano, Harvard Medical School, United StatesReviewed by:
Zhengxiang He, Icahn School of Medicine at Mount Sinai, United StatesYogesh Singh, Tübingen University Hospital, Germany
Copyright © 2020 Omura, Sato, Park, Fujita, Khadka, Nakamura, Katsuki, Nishio, Gavins and Tsunoda. This is an open-access article distributed under the terms of the Creative Commons Attribution License (CC BY). The use, distribution or reproduction in other forums is permitted, provided the original author(s) and the copyright owner(s) are credited and that the original publication in this journal is cited, in accordance with accepted academic practice. No use, distribution or reproduction is permitted which does not comply with these terms.
*Correspondence: Ikuo Tsunoda, itsunoda@med.kindai.ac.jp