 Melissa M. Rohde
 Julie Granger
 Daniel M. Sigman
 Moritz F. Lehmann
- 1Department of Earth and Ocean Sciences, University of British Columbia, Vancouver, BC, Canada
- 2Department of Marine Sciences, University of Connecticut Avery Point, Groton, CT, USA
- 3Geosciences Department, Princeton University, Princeton, NJ, USA
- 4Department of Environmental Sciences, University of Basel, Basel, Switzerland
The stable nitrogen (N) and oxygen (O) isotope ratios (15N/14N and 18O/16O, respectively) of nitrate (NO−3) were measured during incubations of freshly collected seawater to investigate the effect of light intensity on the isotope fractionation associated with nitrate assimilation and possible co-occurring regeneration and nitrification by in situ plankton communities. Surface seawater was collected off the coast of Vancouver, Canada in late fall and in late summer and was incubated under different laboratory light conditions for 10 and 30 days, respectively. In the late summer experiments, parallel incubations were supplemented with 15NH+4 and H218O tracers to monitor co-occurring nitrification. Differences in irradiance in the fall incubations resulted in slightly reduced nitrate consumption at low light but had no distinguishable impact on the N isotope effect (15ε) associated with NO−3 assimilation, which ranged between 5 and 8‰. The late-summer community incubations, in contrast, showed significantly reduced growth rates at low light and more elevated 15ε of 11.9 ± 0.4‰, compared to 8.4 ± 0.3‰ at high-light conditions. The seasonal differences could reflect physiological adaptations of the fall plankton community to reduced irradiance, such that their incubation at low light did not elicit the increase in proportional cellular nitrate efflux required to raise the isotope effect. In both the fall and summer incubations, the ratio of the coincident rises in the δ15N and δ18O of NO−3 was comparable to previous monoculture phytoplankton experiments, with a Δδ18O:Δδ15N of ~1, regardless of light level. A decoupling of Δδ18O:Δδ15N is expected if nitrification occurs concomitantly with nitrate assimilation. The lack of such decoupling is best explained by the absence of significant nitrification in any of our study's treatments, an interpretation supported by our inability to identify any tracer 15N and 18O uptake into the NO−3 pool in the late-summer community incubations.
Introduction
The naturally occurring stable isotope ratios of nitrogen (N) and oxygen (O) in nitrate (NO−3), 15N/14N and 18O/16O, are important tools for understanding the marine N cycle. The utility of the N and O isotopes of NO−3 derives from the effects of biological transformations on the isotope ratios of the ambient NO−3 pool in the marine environment (reviewed by Sigman et al., 2009b). During biochemical reactions, substrate molecules bearing the heavier isotopologues of the elements tend to react more slowly than lighter isotopologues. As a result, in sunlit surface waters, the 15N/14N and 18O/16O ratios of NO−3 increase as the NO−3 pool is progressively consumed during photosynthesis by phytoplankton (e.g., Casciotti et al., 2002). Isotope ratios of NO−3 are expressed here in delta (δ) notation in units of per mil (‰), where δ15N is [(15N/14N)sample/(15N/14N)air − 1] × 1000, with “air” referring to atmospheric N2, and δ18O is [(18O/16O)sample/(18O/16O)VSMOW − 1] × 1000, with “VSMOW” referring to Vienna Mean Standard Ocean Water.
With the appropriate background information, the isotopic ratios of NO−3 can provide integrative constraints on the relative importance of various biogeochemical and physical transformations in the natural environment. For the isotopes of NO−3 to be used in this way, the isotope systematics of NO−3 production and consumption must be known or determinable from environmental data. In the case of NO−3 assimilation, the amplitude of isotope fractionation is quantified by the kinetic isotope effect ε, a measure of the ratio of reaction rate constants (k) of heavy and light isotopologues: 15ε = (14k/15k – 1) × 1000 (expressed in units of per mil, ‰) for the N isotopologues of NO−3, and 18ε = (16k/18k – 1) × 1000 for the O isotopologues of NO−3 (Mariotti et al., 1981). The 15ε and 18ε associated with NO−3 assimilation are a critical aspect of the systematics needed to use these isotopes as a constraint on the extent of NO−3 consumption in the upper ocean, today and in the past.
Ocean field studies suggest that the 15ε (and 18ε) associated with NO−3 assimilation is frequently 5–6‰ (Sigman et al., 1999; DiFiore et al., 2009), but with variation skewed toward higher values. For example, isotope effect estimates upwards of 8–9‰ are observed for the Subantarctic Zone (SAZ, ~40–52°S) of the Southern Ocean (Karsh et al., 2003; DiFiore et al., 2006). Phytoplankton mono-culture indicate that 15ε can cover a broad range, from 0 to 20‰ (Montoya and McCarthy, 1995; Waser et al., 1998a,b; Needoba et al., 2003; Granger et al., 2004), with most estimates ranging between 5 and 10‰. While the causes of the variability in 15ε are not completely understood, light intensity has been identified as a potential environmental driver of 15ε variations (Needoba and Harrison, 2004; Needoba et al., 2004; DiFiore et al., 2010). Phytoplankton cultures, particularly diatoms, display higher 15ε when grown under low-light conditions (Wada and Hattori, 1978; Needoba and Harrison, 2004; Needoba et al., 2004). This dynamic appears to be manifested in the Southern Ocean, where a regional variation in 15ε has been inferred from the relationship between surface nitrate δ15N and ambient nitrate concentrations. The apparent 15ε in the deeply mixed SAZ (40–52°S) is ~8–9‰, significantly higher than the 15ε of ~5‰ observed in the Polar Antarctic Zone (PAZ, ~66°S) surface, where the summertime mixed layer is significantly shallower (often 20 m or less; DiFiore et al., 2010).
The sensitivity of 15ε to light intensity might thus be used as a tool for identifying, and perhaps quantifying, light limitation on phytoplankton growth in the modern ocean. This dynamic, however, complicates the interpretation of N isotope data from sediment records intended to reconstruct past changes in nitrate consumption. For example, in the SAZ of the Southern Ocean, elevated δ15N has been measured in diatom frustule-bound nitrogen and foraminifera-bound nitrogen from the last glacial maximum, which has been interpreted as indication of more complete NO−3 consumption compared to the current interglacial period (Robinson et al., 2005; Martínez-García et al., 2014). This change was apparently coupled with higher export production in the SAZ, raising the possibility of ice age iron fertilization in the SAZ, which could partly explain the lower atmospheric CO2 concentration during ice ages (Martin et al., 1990; Martínez-García et al., 2014). However, this interpretation of the N isotope record relies on the assumption that there have not been large changes in the isotope effect of NO−3 assimilation. A better understanding of the effect of light and other processes on the amplitude of the isotope effect during NO−3 assimilation by indigenous communities in the surface ocean is required in order to improve our understanding of modern surface ocean N dynamics and our ability to reconstruct NO−3 consumption in the surface waters of the past ocean.
The isotopes of NO−3 may also be affected by internal N cycling within the euphotic zone. As with the amplitude of the isotope effects of NO−3 assimilation, such effects may provide new constraints on N cycling in the modern ocean, while at the same time they are likely to represent a complication in the use of the δ15N of sediment and sedimentary components to reconstruct past nutrient consumption changes. The recycling of N within the euphotic zone by the remineralization of particulate organic nitrogen (PON) to NH+4 and its subsequent re-assimilation by phytoplankton has long been argued to impact the δ15N of suspended particles (Altabet, 1988; Fawcett et al., 2011; Treibergs et al., 2014). Furthermore, the partial conversion of NH+4 to NO−3 during nitrification in the surface ocean may also affect the δ15N and δ18O of NO−3, thereby altering the isotopic link between NO−3 assimilation and N export. Although nitrification is believed to be inhibited by light, it has been observed at the base of the euphotic zone (0.1–1% light level; Ward, 1987) and may contribute a significant source of NO−3 within the euphotic zone (Ward et al., 1989; Dore and Karl, 1996; Bianchi et al., 1997), adding to the input of NO−3 from the ocean interior.
The O isotopes of NO−3 hold the potential to provide constraints on the degree of nitrification in the mixed layer, offering insight into whether the upper ocean NO−3 in a given region is supplied via upper ocean recycling or solely mixing with the underlying deep ocean (Granger et al., 2004; Wankel et al., 2007; Bourbonnais et al., 2009; Smart et al., 2015). An identical enrichment in 15N- and 18O- bearing NO−3 is expected during both NO−3 assimilation and denitrification such that 15ε ≈ 18ε (Δδ18O ≈ δ15N) (Granger et al., 2004, 2008, 2010). It has been hypothesized that if NO−3 is being regenerated within the mixed layer, then a deviation from the expected 1:1 Δδ18O:Δδ15N ratio of NO−3 reduction should manifest (Granger et al., 2004; Sigman et al., 2005; Wankel et al., 2007; DiFiore et al., 2009). This hypothesis is based on the expectation (Casciotti et al., 2002) and growing evidence (Sigman et al., 2009a; Buchwald et al., 2012) that the δ18O of newly nitrified NO−3 has a δ18O similar to that of ambient H2O, such that newly nitrified NO−3 has a higher δ18O-NO−3 than that of the NO−3 lost during assimilatory NO−3 reduction, given an assimilatory isotope effect of 5–10‰ and a δ18O-NO−3 for the deep NO−3 supply to the euphotic zone of ~2‰. In contrast, the δ15N of newly nitrified NO−3 is expected to be similar to, or lower than, that of the NO−3 pool for most assumptions regarding isotope fractionation during remineralization and nitrification (DiFiore et al., 2009; Smart et al., 2015). The dual N and O isotopes of NO−3 may thus provide a means to quantify the fraction of NO−3 in the euphotic zone deriving from in situ nitrification. Application of this approach has found substantial evidence of euphotic zone nitrification in open ocean off of Monterey Bay (Wankel et al., 2007) and in the wintertime Antarctic Zone (Smart et al., 2015) but no evidence for it along the summertime Antarctic margin (DiFiore et al., 2009).
Here we investigate the impact of light limitation on the N and O isotope fractionation of NO−3 during its assimilation by a natural marine plankton community. We aimed to: (1) determine whether the amplitude of the N and O isotope effect is sensitive to irradiance, as has been observed in mono-specific cultures (Wada and Hattori, 1978; Needoba and Harrison, 2004; Needoba et al., 2004) and inferred for regions of the upper ocean (DiFiore et al., 2010); and (2) assess whether the δ18O and δ15N rise in a 1:1 proportion as NO−3 is assimilated, and/or if nitrification would lead to a deviation from this 1:1 Δδ18O:Δδ15N relationship when nitrification is promoted under low-light conditions.
Materials and Methods
Incubation Experiments
Natural phytoplankton community assemblages were collected from surface waters (~3 m depth) on two separate occasions. Water for a first set of incubations was collected off a public peer at Jericho Beach in Vancouver in November (“late fall”) of 2005. A second set of incubations was initiated with surface water collected in the Strait of Georgia, a semi-enclosed estuary located between the Canadian mainland of British Columbia and Vancouver Island near the mouth of the Fraser River in September (“late summer”) 2006. Zooplankters were removed from the community assemblage using cheesecloth (#40, 24 × 20 threads per inch) on both occasions. Late fall water from Jericho Beach was collected in a 10-L acid-washed polypropylene carboy and reallocated into 9 transparent acid-washed 4 L polycarbonate bottles. Late summer water from the Strait of Georgia was collected in an acid-washed polycarbonate 60-L carboy and reallocated into acid-washed 4-L bottles, 12 transparent polycarbonate bottles and 3 opaque polypropylene bottles. Each incubation bottle was supplemented with 175 μM (fall) or 100 μM (summer) sodium nitrate (NaNO3), 100 μM silicic acid (SiO4), 10 μM potassium phosphate (K3PO4), and f/2 vitamins (Guillard, 1975). The relatively elevated nutrient additions were intended to increase the dynamic range of observed nitrate isotope ratios during the nitrate drawdown, in order to clearly distinguish differences in isotope effect amplitudes among light treatments and potential deviations in the Δδ18O:Δδ15N ratio of ~1 from coincident nitrification. Initial sub-samples were collected for the analysis of NO−3 concentrations for both incubations, as well as NO−2 and NH+4 concentrations (for the summer incubations only) prior to their placement in an incubator set with different irradiance treatments.
Late-fall incubations were subjected to three irradiance treatments, which were monitored using a light meter (Biospherical Instruments Inc. Model QSL-100): 3 bottles (A–C) were incubated under high light (~140 μmol quanta m−2 s−1), 3 bottles (A–C) under medium light (~70 μmol quanta m−2 s−1), and 3 bottles in low light (~25 μmol quanta m−2 s−1). The irradiance conditions in the fall incubations correspond to respective light levels of 56%, 28%, and 10% of surface photosynthetically active light (PAR) during the highest incident solar radiation experienced in July (250 μmol quanta m−2 s−1; Masson and Peña, 2009) when assuming a vertical attenuation coefficient (K) of 0.55 m−1 that is pertinent to the study area (Stockner et al., 1979). For comparison, K values of 0.02 m−1 and 2 m−1 represent light conditions in clear oligotrophic and turbid eutrophic regions, respectively. The high- and medium-simulated light levels were, however, both higher than the measured surface light level for Jericho Beach during our initial sample collection in November (~45 μmol quanta m−2 s−1), whereas the low-light level (~25 μmol quanta m−2 s−1) corresponds to ~50% of actual surface PAR. Experimental light levels were adjusted with black meshed screening. Self-shading due to increasing algal biomass was not accounted for in this first set of incubations. Incubations were placed in a 12°C incubator with constant illumination and monitored for 10 days.
For the summer incubations, 6 bottles (A–C and G–I) were incubated under high-light (~130 μmol quanta m−2 s−1), 6 bottles (D–F and J–L) under low light (~ 25 μmol quanta m−2 s−1), and the 3 opaque bottles (M–O) with no light (0 μmol quanta m−2 s−1). The irradiances in the late summer incubations correspond to light levels of 52% and 10% of PAR, respectively, during the highest incident solar radiation experienced in July in the Strait of Georgia (also 250 μmol quanta m−2 s−1 (Masson and Peña, 2009) using a K value of 0.73 m−1 (Stockner et al., 1979). The late summer incubations have a larger K value than the late fall incubations due to the presence of suspended particulate matter from the Fraser River effluent, which results in the high-light level (~130 μmol quanta m−2 s−1) corresponding to ~75% of ambient surface PAR during our collection in September, while the light low-light treatment (~25 μmol quanta m−2 s−1) was ~15% of ambient surface PAR. Light levels in the illuminated treatments were continually re-adjusted with black meshed screening throughout the length of the incubations to account for progressive self-shading due to increasing algal biomass. Incubations were placed in a 12°C incubator with constant illumination overnight.
One day after sampling of the late summer experiment (on Day 1), 100 μL of 95% H218O and of 100 nM 10% atom 15NH+4 were added to triplicates of each set of the light treatments (high light: G–I and low light: J–L) and to the three dark bottles (M–O), in order to detect nitrification rates in parallel to the un-amended triplicates of the light treatments (high-light: bottles A–C and low-light: bottles D–F). The resulting δ15N values of the NH+4 pool in the spiked bottles were different among treatments, given overnight changes from an initial NH+4 concentration of 370 ± 6 nM among all treatments on Day 0, compared to 44 ± 28 nM, 287 ± 76 nM and 807± 19 nM on Day 1 in the high, low and no light treatments, respectively. These resulted in calculated δ15N of NH+4 of approximately 18,050‰, 6720‰, and 2870‰, assuming a δ15N of 0‰ for ambient NH+4. The δ18O of H2O in the spiked bottles was 237‰, compared to ≤0‰ in the ambient Strait of Georgia water. The summer incubations were monitored for 30 days.
Sample Collection
During the fall incubations, subsamples were collected at discrete time intervals throughout the 15-day experiment. Approximately 30 mL aliquots were collected and pre-filtered with a 25 mm pre-combusted glass fiber filter (GF/F), and the filtrate was stored frozen for analysis of [NO−3] and its N and O isotope ratios. Samples for microscopic identification of plankton populations were also collected on day 1 and day 9 of the incubations, and preserved with Lugol's solution.
During the summer incubations, subsamples were collected throughout the experiment for inorganic nitrogen concentrations (NO−3, NO−2 and NH+4), N and O isotopes of NO−3, and chlorophyll-a concentrations. Aliquots were collected from each treatment bottle and filtered through a 13-mm diameter GF/F filter mounted on a Swinnex cartridge to collect chlorophyll. Filters were immediately frozen and stored. The filtrate was recovered in an acid-washed polypropylene bottle. NO−2 concentrations in the filtrate were analyzed immediately upon collection, and the remaining filtrates for each of the samples were then frozen and stored for NO−3 concentrations and isotope analyses at the end of the experiment. Samples collected simultaneously for NH+4 analysis were not filtered to avoid contamination, and NH+4 concentrations were measured immediately upon collection. Samples of the phytoplankton consortium were collected at two time points during the incubations and preserved with Lugol's solution for microscopic identification of the algal population.
Nutrient Analyses
NO−3 (plus NO−2) concentrations were measured by reduction to nitric oxide (NO) in a hot vanadium-III solution followed by chemiluminescence detection (Braman and Hendrix, 1989) on an Antek 1750 NO−3/NO−2 analyzer. Samples collected for NH+4 were immediately analyzed using the fluorometric NH+4 method (Holmes et al., 1999) on a Turner Design 700 fluorometer, for which our detection limit was 10 nM. NO−2 concentrations were measured colorimetrically by reaction with Greiss reagents (sulfanilamide and NNED: N-1-naphthyleneethylenediamine), and measurement of absorbance at 543 nm. The detection limit was 0.1 μM. Any NO−2 detected was subsequently removed prior to NO−3 isotope analysis with ascorbate, and the resultant NO gas was purged with an inert gas stream (Granger et al., 2006).
Chlorophyll-a Analyses
To monitor phytoplankton growth, chlorophyll on the frozen filters was extracted with acetone, and the chlorophyll-a concentrations were determined by fluorescence (Turner 10-AU fluorometer). Growth rates and their associated statistical errors were calculated by determining the exponential phase slope of both chlorophyll-a and NO−3 using a type-I regression model, which minimizes the normal deviates for the y-coordinate1. Chlorophyll-a concentrations were monitored for up to 30 days (in the summer incubations only), at which point fluorescence had ceased to increase among the illuminated summer treatments.
NO−3 N and O Isotope Ratio Measurements
N and O isotope ratios of NO−3 were measured using the “denitrifier method” (Sigman et al., 2001; Casciotti et al., 2002), where NO−3 is reduced to nitrous oxide (N2O) by denitrifying bacteria that lack the N2O reductase enzyme. Normalization of the measured 15N/14N and 18O/16O to N2 in air and VSMOW, respectively, was done using the international potassium nitrate reference material IAEA-N3, with an assigned δ15N of +4.7‰ (Gonfiantini et al., 1995) and a δ18O of 25.6‰ (Révész et al., 1997; Silva et al., 2000; Böhlke et al., 2003). The O isotope data were corrected for exchange with oxygen atoms from water during reduction of NO−3 to N2O (Casciotti et al., 2002), which is quantified by analysis of IAEA-N3 in 18O-enriched water and was 5% or less for the analyses reported here. The reproducibility of the replicate isotope values in this study was within one standard deviation of 0.3‰ for δ15N and 0.5‰ for δ18O.
N and O isotope effects (15ε and 18ε, respectively) were determined for each treatment by plotting the δ15N and δ18O against the natural logarithm of the residual NO−3 or of the residual substrate fraction (f) according to Mariotti et al. (1981), where the slope of the linear regression line (Rayleigh linearization) approximates ε :
δ15Ninitial is the isotopic composition of the NO−3 at the begin of the incubations and the δ15Nreactant refers to the isotopic composition of the remaining NO−3 concentration after some period of consumption (Mariotti et al., 1981). Regression slopes and the associated statistical errors for both the isotope effects and Δδ18O:Δδ15N ratio were determined by a type-II least squares cubic regression model that minimizes the normal deviates of both the weighted x and y coordinates1.
Results
Growth Rates and Inorganic Nitrogen Dynamics
Late Fall Incubations
In the fall incubations, NO−3 consumption by Day 15 appeared to be most pronounced in the high-light incubations, with a NO−3 drawdown of 104 ± 13 μM among replicates, compared to 87 ± 8 μM and 76 ± 5 μM for the medium- and low-light treatments, respectively (Figure 1). The differences in total nitrate drawdown were statistically different (p = 0.03, One-Way ANOVA; Supplementary Table 1). The exponential growth rates determined from the NO−3 drawdown ranged between 0.3 and 0.4 day−1 from the low- to high-light treatments, but were not statistically distinguishable among treatments (Table 1A; p = 0.46, One-Way ANOVA; Supplementary Table 1).
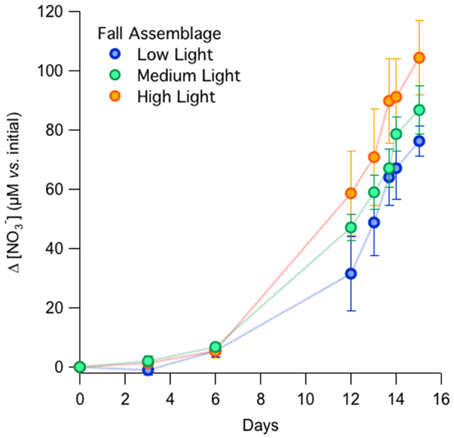
Figure 1. Net NO−3 consumption among light treatments in the fall incubations.
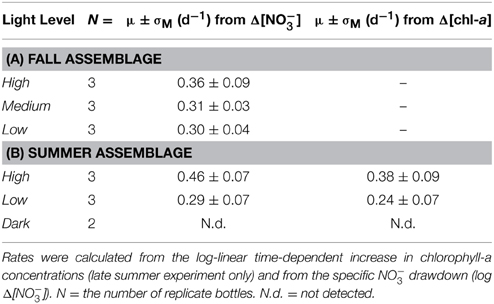
Table 1. Mean specific growth rates, μ, and standard errors of the means (σM), of the (A) late fall and (B) late summer plankton incubations.
Microscopic identification of the preserved samples indicated that the phytoplankton in the late-fall experiment was largely comprised of the diatom Skeletonema spp., which is a common dominant phytoplankton species native to the Strait of Georgia (Harrison et al., 1983; Spies and Parsons, 1985). NO−2 and NH+4 concentrations were not measured in the fall incubations.
Late Summer Incubations
During the summer incubations, chlorophyll-a concentrations increased fastest in the high-light treatment and not measurably in the dark treatment (Figure 2A; chl-a in the dark treatment incubations was measured only in bottle M). The chlorophyll-a increase in the high-light bottles was roughly exponential for the first 8 days, after which it reached a plateau to a variable mean. The chlorophyll-a increase in the low-light treatment was roughly exponential for the first 15 days, after which it appeared to slowdown. Phytoplankton growth in bottle F (low-light, unlabeled) was noticeably lower than in parallel low-light replicates.
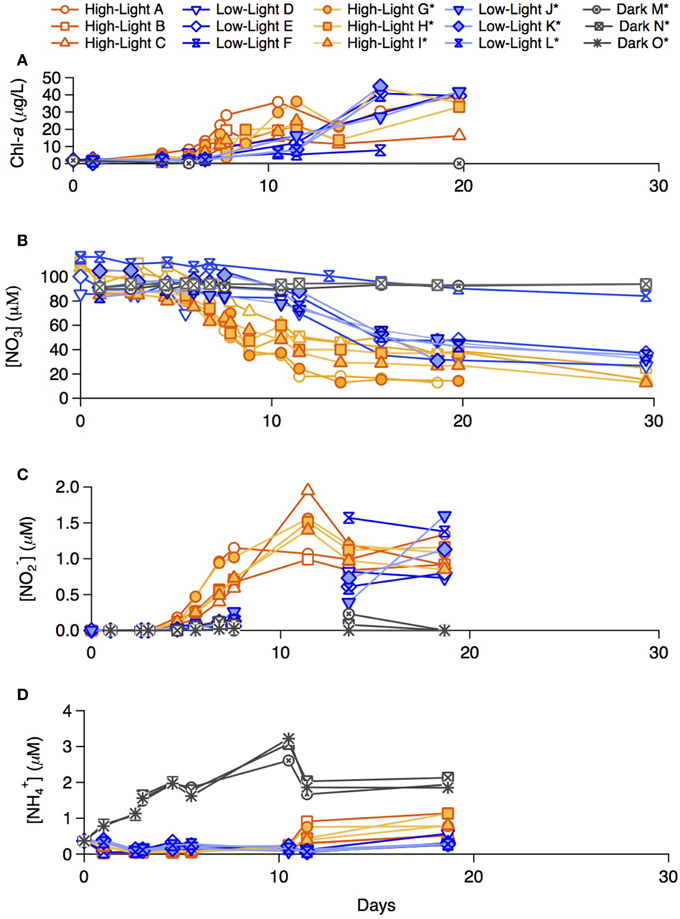
Figure 2. Late summer incubation concentrations of (A) chlorophyll-a, (B) NO−3, (C) NO−2, (D) NH+4 for both the labeled and un-labeled treatments incubated under high-light, low-light, and dark conditions.
In both the high- and low-light treatments, NO−3 decreased over the 30 incubation days (Figure 2B). The overall rate of NO−3 consumption was fastest in the high-light treatment, with a total drawdown of ~70–85 μM. A measurable NO−3 drawdown was detectable after 5 days and a NO−3 concentration plateau was reached around Day 10, consistent with the plateauing of chlorophyll-a concentration in the incubation. The onset of the NO−3 drawdown in the low-light treatment began around Day 8, after which NO−3 concentration decreased gradually, yielding a total drawdown of ~62–74 μM at the end of the incubation. Bottle F (low-light, unlabeled) displayed only a modest net decrease in NO−3 concentration of 20 μM. In the dark treatment bottles (M and N bottles) of the incubations, NO−3 remained at its initial concentration of ~100 μM throughout the incubation period (within measurement error). Nitrate was not measured for the dark “O” treatment.
Exponential growth rates were computed from the initial exponential increase in chlorophyll-a for the high- and low-light treatments, respectively, and were verified against the exponential decrease in NO−3 concentrations (Table 1B). Exponential rates determined by chlorophyll-a were on the order 0.38 ± 0.07 day−1 among the high-light treatment bottles, and 0.24 ± 0.07 day−1 for the low-light treatment. Similarly, exponential rates determined from the specific NO−3 drawdown (Figure 2B; Table 1B) were 0.46 ± 0.07 day−1 for the high-light treatment and 0.29 ± 0.07 day−1 at low light. Growth rates differed significantly between high and low light treatments, whether determined from the chlorophyll-a increase (p = 0.01; t-test; Supplementary Table 1) or from the corresponding nitrate drawdown (p < 0.01, t-test; Supplementary Table 1).
Nitrite (NO−2) was not detected in any of the summer treatments until Day 5 (Figure 2C), at which point concentrations began to increase in the high-light treatment to a maximum of 2.0 μM around Day 10, remaining relatively elevated thereon. Only a moderate increase in NO−2 was recorded in the low-light incubations, first detectable on Day 8, and reaching concentrations comparable to those in high-light treatment after Day 15. NO−2 concentrations in the dark treatment remained near or below detection throughout.
Ammonium concentrations remained below 0.1 μM during exponential growth in both light treatments (Figure 2D). At Day 10, an increase to ≥0.5 μM was observed in the high-light treatment. Concentrations of NH+4 in the low-light treatment remained near or slightly above detection until Day 18 and were not measured thereafter. In contrast to the light treatments, NH+4 concentrations in the dark treatment increased steadily from 0.4 on Day 0, to ~3 μM by Day 10, after which concentrations dropped again to 2 μM.
Skeletonema spp. was also the dominant algal group in the summer incubations. This species was prevalent in our initial algal consortia and remained so in all of the light treatments. Differences between the high- and low-light community compositions were not readily discernable by microscopy. These summer samples contained fragments of diatoms and other cells, suggesting that we collected a senescent phytoplankton assemblage. Early September, at which time the samples were collected, generally corresponds to the late summer period of maximum heterotrophic productivity in the Strait of Georgia (Albright, 1977).
N and O Isotopes of NO−3
In the high-, medium-, and low-light treatments of the fall incubations, NO−3 δ15N and δ18O increased with decreasing NO−3 concentrations, from a δ15N of 1.5‰ to as high as 10‰ in high-light and concurrently from a δ18O of 19‰ to as high as 28‰ (Figure 3A). The increase in both δ18O as a function of the natural logarithm of NO−3 were linear among all treatments (Figure 3A), and thus consistent with Rayleigh fractionation (consumption of a closed substrate pool with a constant isotope effect; Mariotti et al., 1981). The slopes of the regression lines in the Rayleigh plots indicated 15ε and 18ε values that ranged between 5 and 9‰ among all incubations; isotope effects did not vary coherently among treatments (Table 2A; Supplementary Table 1). The δ18O increased in tandem with the corresponding δ15N, translating into 18ε values similar to the corresponding 15ε. Plotted against each other, the change in δ18O vs. that in Δδ15N (Δδ18O:δ15N) yielded slopes near unity, 1.07 ± 0.08‰ for the high-light incubations, 0.96 ± 0.04 for a single medium-light treatment, and of 1.18 ± 0.03‰ for the low-light incubations (Table 2A; Figure 3B). The apparent Δδ18O:Δδ15N differences between high- and low- light treatments were not statistically significant (p = 0.07; One-Way ANOVA; Supplementary Table 1).
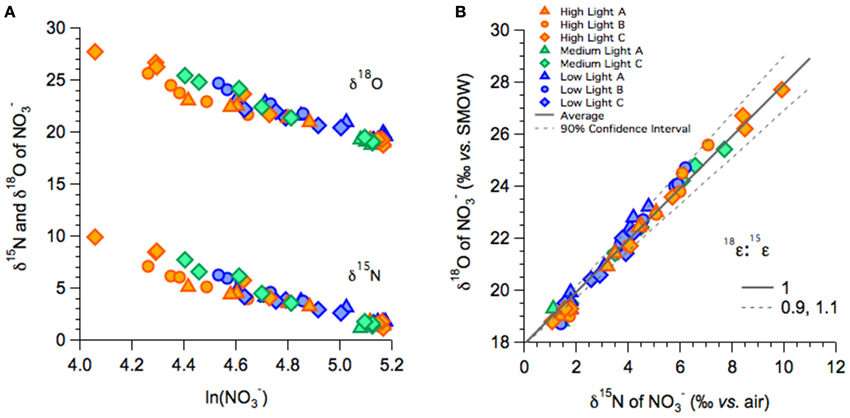
Figure 3. NO−3 isotope dynamics of fall incubations: (A) NO−3 δ15N plotted vs. the logarithm of the NO−3 remaining for the high-, medium-, and low-light treatments. The respective slopes of the linear relationships approximate 15ε. (B) δ18O vs. δ15N of NO−3 for the high-, medium-, and low-light treatments.
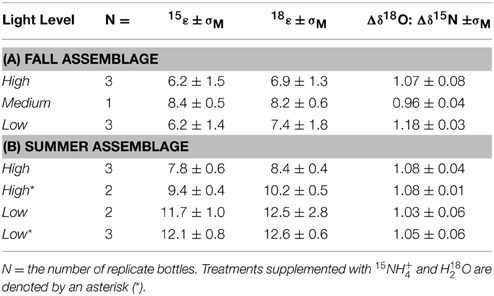
Table 2. Mean N and O isotope effects of NO−3 and Δδ18O:Δδ15N change and associated standard error (σM) for each light treatment for the (A) late fall community incubations and (B) late summer community incubations.
The NO−3δ15N and δ18O in both the high- and low-light treatments of the summer incubations also increased in parallel to the decreasing NO−3 concentrations, from 1.5 to 25‰ 25‰ for δ15N, and 20 to 40‰ for δ18O (Figures 4A,B). Unlike the fall experiment, the corresponding 15ε differed significantly between light treatments, averaging 7.8 ± 0.6‰ among high-light incubations vs. 11.7 ± 1.0‰ for the low-light incubations (p < 0.01; Two-Way ANOVA; Figure 5; Table 2B; Supplementary Table 1). The Two-Way ANOVA also indicated that the 15ε in incubations supplemented with both 15NH+4 and H218O were comparable to those in the unlabeled incubations for both of the light treatments, averaging 9.4 ± 0.4‰ at high-light and 12.1 ± 0.8‰ at low-light (p = 0.08, Two-Way ANOVA; Supplementary Table 1).
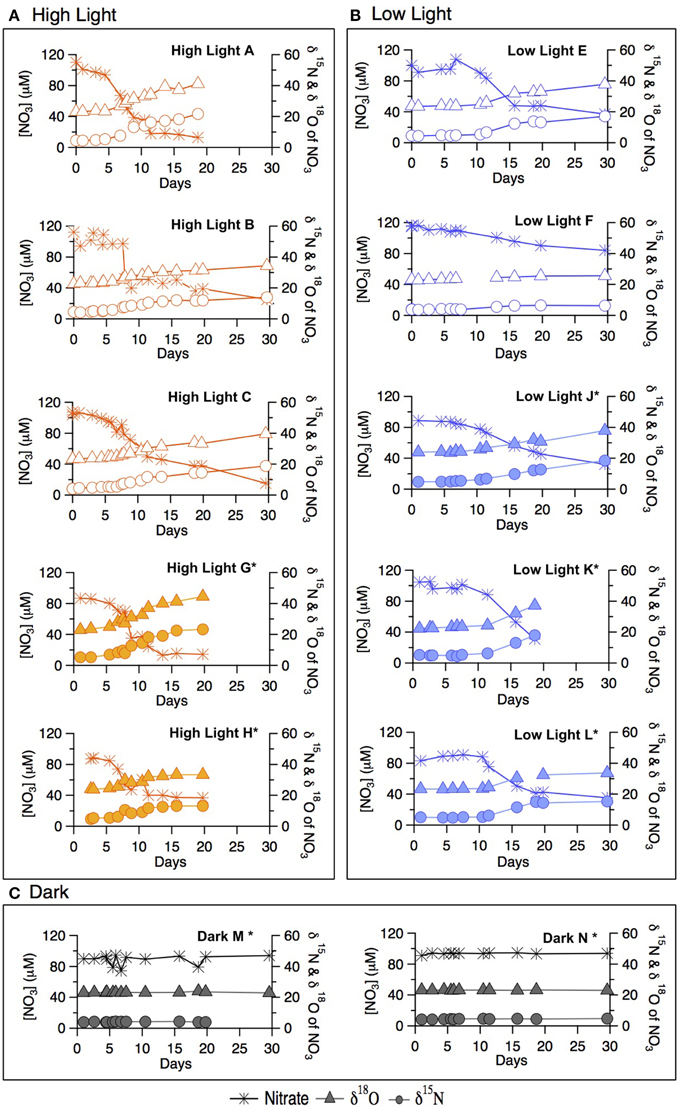
Figure 4. Changes in NO−3 concentrations during the late-summer incubations with the corresponding δ15N and δ18O of NO−3 for (A) high-light (orange symbols), (B) low-light (blue symbols), and (C) dark treatments (gray symbols). Labeled experiments (closed symbols) are denoted by an asterisk (*).
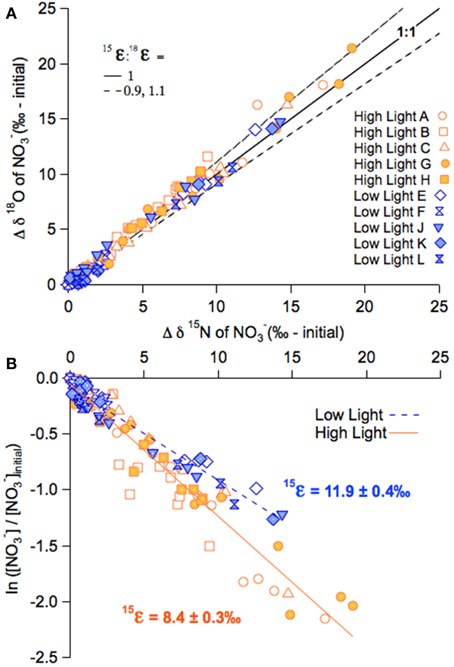
Figure 5. NO−3 isotope dynamics of the late summer incubations. (A) The change in NO−3δ18O (δ18O minus δ18Oinitial) plotted on the corresponding change in δ15N in the high-light and low-light summer incubations, for both unlabeled and labeled treatments. (B) NO−3δ15N plotted vs. the logarithm of the fraction of NO−3 remaining for the high-light and low-light summer incubations, for both labeled and unlabeled treatments. The respective slopes of the linear relationships approximate 15ε.
The 18ε values observed in the summer experiment were 8.4 ± 0.4‰ and 12.5 ± 2.8‰ for high- and-low light bottles, respectively, thus similar to the corresponding 15ε values. The change of δ18O vs. that of δ15N (Δδ18O:Δδ15N) yielded statistically indistinguishable slopes of 1.08 ± 0.04‰ and 1.03 ± 0.06‰ for the unlabeled high- and low-light incubations, respectively (p = 0.12, Two-Way ANOVA; Supplementary Table 1). The Δ18O:Δδ15N values of the parallel labeled incubations were 1.08 ± 0.01‰, and 1.05 ± 0.06‰ in high- and low-light respectively, thus comparable to the natural abundance treatments (p = 1.00, Two-Way ANOVA; Supplementary Table 1). In the dark incubations, which were supplemented with the 15NH+4 and H218O tracers, the δ15N and δ18O of NO−3 remained unchanged for the entire 30 days, indicating undetectable nitrification in these incubations (Figure 4C).
Discussion
The late fall vs. late summer plankton community incubations displayed different responses to the level of irradiance. The low-light incubations of the fall plankton community had slower total nitrate consumption than the corresponding high-light incubations, yet no clear distinction in NO−3 isotope dynamics was observed between low and high light. In the summer plankton community, a similar contrast in irradiance yielded significantly different growth rates and total NO−3 consumption. Low light also resulted in higher N and O isotope effects compared to high light, and a distinction in recycled nutrient (NH+4 and NO−2) dynamics was also observed between low- and high-light treatments. None of the irradiance treatments, however, appeared to foster detectable nitrification in either the fall or summer incubations. The respective growth dynamics of the fall and summer incubations, and the effect of light on the amplitude of the NO−3 N isotope effects are discussed below, as are the implications for the interpretation of NO−3 isotope distributions in the surface ocean. We also scrutinize our experimental design to assess whether nitrification coincident with net NO−3 assimilation was detectable from the coupled N and O isotope ratios. We propose modifications that could yield a more sensitive test of an isotopic role for nitrification at low light.
Growth Dynamics at High and Low Light
The consumption of NO−3 during the fall incubations was similar under all light regimes, and slowed around Day 15. Similarly, net phytoplankton growth in the summer incubations was no longer detected after Day 10 in the high-light treatment, and after Day 15 in the low-light treatment. The cessation of apparent growth was not due to macronutrient exhaustion, given the elevated NO−3 concentrations remaining (≥50 μM) and given the fact that SiO2−4 and PO−34 were initially added in excess with respect to Redfield stoichiometry. The subsidence of NO−3 consumption could be the result of self-shading by the growing algal populations, because we did not mitigate the corresponding changes in luminosity for the fall incubations. Alternatively, slowed NO−3 consumption could reflect a relative increase in heterotrophic activity in the incubations, which could arise due to a number of potential factors, including viral lysis, and/or changes in seawater chemistry stemming from a pH increase due to carbon dioxide removal during photosynthesis, with consequent effects on phytoplankton physiology.
Senescence of the phytoplankton assemblage in the summer experiment was apparent via microscopy during the incubation period, which suggests that heterotrophy could have surpassed photosynthesis in spite of continual illumination. Chlorophyll-a concentrations after Day 10 in the high-light treatment proved very variable, which could also portend autotrophic-heterotrophic coupling. Analogous variability was not detected following the end of growth in the low-light cultures (after Day 15), although chlorophyll-a concentrations were not monitored with sufficient frequency after Day 15 to assess this with certainty.
The potential for net heterotrophy in the summer incubations, suggested by microscopic inspection and from the plateau in chlorophyll-a concentrations, was also evidenced by the NH+4 pool dynamics within each of the treatments. NH+4 concentrations in both light treatments remained near the limit of detection (10 nM) until net phytoplankton growth ceased, after which NH+4 increased modestly in the high-light treatment, whereas the concentration of NH+4 remained stable and did not increase comparably following the cessation of growth at low light (Day 15; Figure 2D). Together, these trends are best explained by the relative predominance of heterotrophic metabolism after the cessation of net phytoplankton growth, with some ammonium assimilation by phytoplankton (the lack of a continuous rise in ammonium requires that phytoplankton are still consuming it even after the step-up in concentration at ~Day 12). The regeneration of NH+4 via the decomposition of organic matter would provide a preferred source of N over NO−3 for algal growth, because of the additional energy required for the intracellular reduction of NO−3 to NH+4 (Bates, 1976; Thompson et al., 1989; Dortch, 1990).
The concentration of NH+4 in the dark treatment of the summer incubations increased steadily from the onset of the incubations, from 0.3 to a maximum of 3 μM at Day 10, indicating ammonification of organic material (Figure 2D). The subsequent drop in NH+4 to 2 μM in the dark treatment after Day 10 is difficult to explain. The absence of any increase in the δ15N of NO−3 of the 15NH+4-amended dark treatment, expected if any NH+4 had been oxidized, further rules out nitrification as a potential explanation for the observed decrease in NH+4, as will be discussed in a subsequent section. Moreover, the biological oxidation of 1 μM ammonium overnight would require a relatively high abundance of nitrifying bacteria, which is unlikely given their inherently slow maximum growth rates (e.g., Keen and Prosser, 1987). Hence, the rapid NH+4 decrease in the dark bottles after Day 10 remains elusive. Ammonium assimilation associated with heterotrophic bacterial growth on dissolved organic carbon is one possible explanation, but we lack the data to consider it further.
In the high- and low-light treatment bottles, the accumulation of NO−2 during the summer incubations (Figure 2C) could, hypothetically, derive from the oxidation of NH+4 by nitrifiers. Slower rates of NO−2 oxidation compared to NH+4 oxidation at the base of the euphotic zone have been cited as the origin of the primary nitrite maximum (Ward et al., 1984; Buchwald and Casciotti, 2013). However, incomplete NO−3 reduction by light-limited phytoplankton in ocean environments with fluctuating light levels has also been hypothesized to contribute to or dominate NO−2 production at the nitrite maximum in the ocean's mixed layer (Collos, 1998; Lomas and Lipschultz, 2006; Mackey et al., 2011). The conspicuous absence of NO−2 in the dark bottles, coupled with a lack of detectable δ15N and δ18O increase in the NO−3 pool therein after isotope label amendment, suggests an absence of NH+4 oxidation to NO−2. Therefore, we posit that the accumulation of NO−2 in the light bottles was due to intracellular NO−3 reduction and cellular NO−2 efflux at low-light (Martinez, 1991) rather than to nitrification.
The Influence of Light on the Amplitude of 15ε and 18ε
The response of N (and O) isotope effect amplitudes to irradiance was qualitatively different in the fall vs. summer incubations. Decreased irradiance had no concerted effect on the 15ε and 18ε of the fall community incubations, whereas low light resulted in a sizeable increase in 15ε and corresponding 18ε of the summer community incubations. While these contrasting results are apparently contradictory, they nevertheless capture the range of possible responses to irradiance observed in mono-culture studies (Wada and Hattori, 1978; Needoba and Harrison, 2004; Needoba et al., 2004). In particular, Needoba and Harrison (2004) noted that among monocultures of four phytoplankton strains, two diatoms and a prymnesiophyte showed higher N isotope effects in light-limited vs. high-light cultures, whereas one diatom species exhibited no increase in 15ε at low light. Species-specific differences in 15ε as well as intra-species differences in 15ε have been attributed to variation in the expression of the enzymatic isotope effect imposed by nitrate reductase, which is determined by the ratio of NO−3 effluxing out of the cell relative to its uptake (Shearer et al., 1991; Granger et al., 2004; Needoba et al., 2004). The intrinsic N (and O) isotope effect(s) of the eukaryotic assimilatory NO−3 reductase in vitro has been estimated to be ~27‰ (Karsh et al., 2012), whereas data on the N or O isotope effects imparted on NO−3 during its active uptake at the cell surface indicate that they range between minor (up to 2‰; Karsh et al., 2013) and undetectable (Granger et al., 2010). N and O isotope discrimination of NO−3 during its assimilation is thus incurred dominantly during intracellular reduction by nitrate reductase. However, the enzymatic 15N-enrichment that is transmitted to the external medium through cellular efflux of the internal NO−3 pool and the cellular-level isotope effect (i.e., the expression of the isotope fractionation in the external medium) depends on the ratio of uptake to efflux (i.e., “efflux model”; Shearer et al., 1991; Granger et al., 2004; Needoba et al., 2004), which may vary with changing physiological and/or environmental conditions.
In this context, the higher N and O isotope effects associated with the low-light treatments are diagnostic of a higher ratio of NO−3 efflux to NO−3 uptake by the phytoplankton (Needoba et al., 2004; Karsh et al., 2013). The increase in 15ε associated with light limitation may reflect a specific physiological response of NO−3 assimilation to this energetic constraint. Under low-light conditions, phytoplankton have lower internal concentrations of NADH/NADPH reductant that is generated during photosynthesis and utilized to fuel the NO−3 reductase enzyme. As a result, lower NO−3 reductase activity under low light would leave proportionally more of the intracellular NO−3 pool to be released back into the external medium. Conversely, higher NO−3 reductase activity due to an increase in the concentration of NADH/NADPH under higher light conditions would result in NO−3 assimilation and a smaller quantity of stored intracellular NO−3 remaining to be released in the extracellular environment (Needoba et al., 2004).
This explanation, however, does not address why phytoplankton would not simply down-regulate their NO−3 uptake in parallel with the decrease in NO−3 reduction to minimize the energetic investment for NO−3 uptake and the subsequent energetic requirement for NO−3 efflux. A hypothesis that has been posed for this behavior is that light-limited phytoplankton generate high internal NO−3 concentrations in preparation for some imminent event of high light availability, promoting an inadvertent increase in cellular NO−3 efflux due to the steeper concentration gradient from the cell interior relative to the medium (Needoba and Harrison, 2004; Needoba et al., 2004).
Our data do not offer a specific test of the physiological hypotheses for this dynamic, yet they do indicate that the range of NO−3 isotope dynamics observed in response to light limitation in pure culture also applies to phytoplankton in natural marine consortia. The lack of a clear difference in the 15ε amplitude between high- and low-light incubations of the fall community suggests that NO−3 homeostasis of the phytoplankton was not affected by light limitation. The overall growth of the consortium was slowed modestly at lower light conditions compared to the late-summer community, which suggests that the assemblage was adapted to maintain near maximum fitness at relatively low light. The consortium may have comprised species that are adapted to lower incident light conditions in winter, and for whom changes in NO−3 physiology would only be instigated at substantially lower light levels, if at all. Conversely, NO−3 metabolism of the summer phytoplankton community was very sensitive to irradiance, showing clear decrease in growth rates and parallel increase in 15ε at lower light levels, akin to the response of some phytoplankton species in culture.
Given the differential response observed here and in monocultures, the magnitude of a given community 15ε is evidently not diagnostic of irradiance alone. At the surface ocean, notable exceptions to the “community” isotope effect on the order of 5‰ exist in the Subantarctic, where the mixed layer is deep and phytoplankton may easily be mixed between high and low light conditions (DiFiore et al., 2006). At the deeper mixed layer depths in the Subantarctic with mean light intensity of ~1.5 MJ/m−2d−1 (~80 μmol quanta m−2 s−1), the observed 15ε is 8–9‰. However, this range in 15ε is similar to the range observed in our high-light treatments of ~130 μmol quanta m−2 s−1. Overall, the existing data indicate that there is a connection between light limitation and NO−3 isotope effects, but a unique relationship appears clouded by differences in species composition and/or adaptive characteristics among phytoplankton assemblages.
Isotopic Impact of Nitrification
A secondary goal of this study was to test whether nitrification occurring simultaneously with net NO−3 assimilation by phytoplankton manifests as an apparent alteration of the Δδ18O:Δδ15N co-variation due to NO−3 assimilation (Granger et al., 2004). Our expectation was that an indigenous plankton consortium incubated at low-light would host some degree of nitrification relative to high-light incubations and that this would be expressed as a positive deviation in the Δδ18O:Δδ15N from a nominal value of 1 (Granger et al., 2004; Wankel et al., 2007; DiFiore et al., 2009; Smart et al., 2015). There were, however, no detectable differences in the Δδ18O:Δδ15N among light treatments in either the fall or summer incubations (Figure 5A).
We explain the invariant Δδ18O:Δδ15N among light treatments by very low to negligible nitrification rates in our incubations. This assessment is supported for the summer incubations, in which there were no detectable isotopic enrichments of NO−3 in the parallel treatments supplemented with 15NH+4 and H218O. Arguably, the rapid assimilation of the 15NH+4 tracer into biomass could have rendered the incubations less sensitive to nitrification than intended. Given the low concentrations of 15NH+4 in the light treatments (~10 nM during net phytoplankton growth), the supplemented 15NH+4 in the N pool could have been diluted to extinction relatively rapidly in the low- and high-light treatment bottles due to rapid assimilation and regeneration. However, the continual increase in ambient NH+4 in the dark labeled incubations, from 0.3 at the onset to 3 μM by Day 10, suggests that the 15NH+4 tracer therein was not entirely shunted into biomass, if at all. The elevated experimental NO−3 added (≥100 μM) to the incubations rendered the 15N-label-isotope approach less sensitive to nitrification than customarily (e.g., Ward, 1987). Nevertheless, our calculations indicate that a nitrification rate as low as 10 nM d−1, characteristic of near-shore systems (e.g., Ward, 1987), would have resulted in a detectable δ15N increase of 1.0‰ over 10 days of incubations in the dark, given negligible assimilation of the 15NH+4 into biomass. A nitrification rate of 30 nM d−1 could have been detected overnight in the dark treatment, yielding a detectable NO−3 δ15N increase of 0.5‰ by Day 2 and of nearly 4‰ by Day 10. As prescribed, the 18O-label approach was considerably less sensitive to nitrification given the isotopic enrichment of ambient H2O (237‰). Still, our calculations suggest that a nitrification rate of ~50 nM d−1, would have resulted in a 1.0‰ increase in the δ18O of nitrate over 10 days in the dark incubations; yet, this was not observed.
Therefore, the lack of any detectable increase in either the δ15N or the δ18O of NO−3 in the dark incubations suggests that nitrification, if at all occurring, was slow. It follows that nitrification rates would have been still lower in the summer incubations with light, given the higher potential for competition for ammonium with phytoplankton and light inhibition of nitrification (Ward et al., 1984; Smith et al., 2014).
Our data thus fail to test mounting evidence from field studies that, in some regions of the surface ocean, nitrification does induce a decoupling of the nitrate N and O isotopes from a Δδ18O:Δδ15N of ~1 expected for NO−3 consumption (Wankel et al., 2007; Smart et al., 2015). Nitrification rates in our experiments were likely <10 nM d−1, which our experiments were not designed well to detect at natural abundance levels because of the elevated initial NO−3 concentrations. In an attempt to extend the dynamic range of the NO−3 isotope ratios, we used a large initial NO−3 addition, which decreased the sensitivity of the coupled N and O isotope ratios to coincident nitrification. Future experiments to test whether coincident nitrification induces a decoupling of the nitrate N and O isotope ratios from the assimilatory Δδ18O:Δδ15N ratio of 1 could be more sensitive if conducted with lower initial NO−3 concentrations akin to field conditions. Experimental verification of this dynamic remains desirable, to validate the inferences gleaned from nitrate isotope distributions in the ocean environment.
Conflict of Interest Statement
The authors declare that the research was conducted in the absence of any commercial or financial relationships that could be construed as a potential conflict of interest.
Acknowledgments
We thank Philippe Tortell (University of British Columbia), Barbara Seth (University of Basel), Julien Foriel (Princeton University) for laboratory support, and Chris Payne (University of British Columbia) and Evgeny Pakhomov (University of British Columbia) for support in the field. Comments by two reviewers helped improve the manuscript. This work was financially supported by the US NSF through grant OCE-0447570 to DS and the Center for Environmental BioInorganic Chemistry (CEBIC) Undergraduate Research Fellowship at Princeton University, and by SNF (Swiss National Science Foundation) R'Equip funds granted to ML.
Supplementary Material
The Supplementary Material for this article can be found online at: http://journal.frontiersin.org/article/10.3389/fmars.2015.00028/abstract
Footnotes
References
Albright, L. J. (1977). Heterotrophic bacterial dynamics in the lower Fraser River, its estuary and Georgia Strait, British Columbia, Canada. Mar. Biol. 39, 203–211. doi: 10.1007/BF00390994
Altabet, M. (1988). Variations in nitrogen isotopic composition between sinking and suspended particles: implications for nitrogen cycling and particle transformation in the open ocean. Deep Sea Res. Part A Oceanogr. Res. Pap. 35, 535–554. doi: 10.1016/0198-0149(88)90130-6
Bates, S. (1976). Effects of light and ammonium on nitrate uptake by two species of estuarine phytoplankton. Limnol. Oceanogr. 21, 212–218. doi: 10.4319/lo.1976.21.2.0212
Bianchi, M., Feliatra, F., Tréguer, P., Vincendeau, M. A., and Morvan, J. (1997). Nitrification rates, ammonium and nitrate distribution in upper layers of the water column and in sediments of the Indian sector of the Southern Ocean. Deep Sea Res. Part II Top. Stud. Oceanogr. 44, 1017–1032. doi: 10.1016/S0967-0645(96)00109-9
Böhlke, J.-K., Mroczkowski, S. J., and Coplen, T. B. (2003). Oxygen isotopes in nitrate: new reference materials for 18O:17O:16O measurements and observations on nitrate-water equilibration. Rapid Commun. Mass Spectrom. 17, 1835–1846. doi: 10.1002/rcm.1123
Bourbonnais, A., Lehmann, M. F., Waniek, J. J., and Schulz-Bull, D. E. (2009). Nitrate isotope anomalies reflect N2 fixation in the Azores Front region (subtropical NE Atlantic). J. Geophys. Res. 114:C03003. doi: 10.1029/2007JC004617
Braman, R. S., and Hendrix, S. A. (1989). Nanogram nitrite and nitrate determination in environmental and biological materials by vanadium (III) reduction with chemiluminescence detection. Anal. Chem. 61, 2715–2718. doi: 10.1021/ac00199a007
Buchwald, C., and Casciotti, K. L. (2013). Isotopic ratios of nitrite as tracers of the sources and age of oceanic nitrite. Nat. Geosci. 6, 308–313. doi: 10.1038/ngeo1745
Buchwald, C., Santoro, A. E., McIlvin, M. R., and Casciotti, K. L. (2012). Oxygen isotopic composition of nitrate and nitrite produced by nitrifying cocultures and natural marine assemblages. Limnol. Oceanogr. 57, 1361–1375. doi: 10.4319/lo.2012.57.5.1361
Casciotti, K. L., Sigman, D. M., Hastings, M. G., Bohlke, J. K., and Hilkert, A. (2002). Measurement of the oxygen isotopic composition of nitrate in seawater and freshwater using the denitrifier method. Anal. Chem. 74, 4905–4912. doi: 10.1021/ac020113w
Collos, Y. (1998). Nitrate uptake, nitrite release and uptake, and new production estimates. Mar. Eco. Prog. Ser. 171, 293–301. doi: 10.3354/meps171293
DiFiore, P. J., Sigman, D. M., and Dunbar, R. B. (2009). Upper ocean nitrogen fluxes in the Polar Antarctic Zone: constraints from the nitrogen and oxygen isotopes of nitrate. Geochem. Geophys. Geosyst. 10, Q11016. doi: 10.1029/2009GC002468
DiFiore, P. J., Sigman, D. M., Karsh, K. L., Trull, T. W., Dunbar, R. B., and Robinson, R. S. (2010). Poleward decrease in the isotope effect of nitrate assimilation across the Southern Ocean. Geophys. Res. Lett. 37:L17601. doi: 10.1029/2010gl044090
DiFiore, P. J., Sigman, D. M., Trull, T. W., Lourey, A. J., and Karsh, K. L. (2006). Nitrogen isotope constraints on Subantarctic biogeochemistry. J. Geophys. Res. 111:C08016. doi: 10.1029/2005JC003216
Dore, J. E., and Karl, D. M. (1996). Nitrification in the euphotic zone as a source for nitrite, nitrate, and nitrous oxide at Station ALOHA. Limnol. Oceanogr. 41, 1619–1628.
Dortch, Q. (1990). The interaction between ammonium and nitrate uptake in phytoplankton. Mar. Ecol. Prog. Ser. 61, 183–201. doi: 10.3354/meps061183
Fawcett, S., Lomas, M., Casey, J., and Ward, B. (2011). Assimilation of upwelled nitrate by small eukaryotes in the Sargasso Sea. Nature 4, 717–722. doi: 10.1038/ngeo1265
Gonfiantini, R., Stichler, W., and Rozanski, K. (1995). Standards and Intercomparison Materials Distributed by the International Atomic Energy Agency for Stable Isotope Measurements. Vienna: International Atomic Energy Agency.
Granger, J., Sigman, D. M., Lehmann, M. F., and Tortell, P. D. (2008). Nitrogen and oxygen isotope fractionation during dissimilatory nitrate reduction by denitrifying bacteria. Limnol. Oceanogr. 53, 2533–2545. doi: 10.4319/lo.2008.53.6.2533
Granger, J., Sigman, D. M., Needoba, J. A., and Harrison, P. J. (2004). Coupled nitrogen and oxygen isotope fractionation of nitrate during assimilation by cultures of marine phytoplankton. Limnol. Oceanogr. 49, 1763–1773. doi: 10.4319/lo.2004.49.5.1763
Granger, J., Sigman, D. M., Prokopenko, M. G., Lehmann, M. F., and Tortell, P. D. (2006). A method for nitrite removal in nitrate N and O isotope analyses. Limnol. Oceanogr. Meth. 4, 205–212. doi: 10.4319/lom.2006.4.205
Granger, J., Sigman, D. M., Rohde, M. M., Maldonado, M. T., and Tortell, P. D. (2010). N and O isotope effects during nitrate assimilation by unicellular prokaryotic and eukaryotic plankton cultures. Geochem. Cosmochem. Acta 74, 1030–1040. doi: 10.1016/j.gca.2009.10.044
Guillard, R. R. L. (1975). “Culture of phytoplankton for feeding marine invertebrates,” in Culture of Marine Invertebrate Animals, eds W. L. Smith and M. H. Chanley (New York, NY: Plenum Press), 26–60.
Harrison, P., Fulton, J., Taylor, F., and Parsons, T. (1983). Review of the biological oceanography of the Strait of Georgia: Pelagic environment. Can. J. Fish. Aquat. Sci. 40, 1064–1094. doi: 10.1139/f83-129
Holmes, R. M., Aminot, A., Kérouel, R., Hooker, B. A., and Peterson, B. J. (1999). A simple and precise method for measuring ammonium in marine and freshwater ecosystems. Can. J. Fish. Aquat. Sci. 56, 1801–1808.
Karsh, K. L., Granger, J., and Kritee, K. (2012). Eukaryotic assimilatory nitrate reductase fractionates N and O isotopes with a ratio near unity. Environ. Sci. Technol. 46, 5727–5735. doi: 10.1021/es204593q
Karsh, K. L., Trull, T., Lourey, M., and Sigman, D. M. (2003). Relationship of nitrogen isotope fractionation to phytoplankton size and iron availability during the Southern Ocean Iron RElease Experiment (SOIREE). Limnol. Oceanogr. 48, 1058–1068. doi: 10.4319/lo.2003.48.3.1058
Karsh, K. L., Trull, T. W., Sigman, D. M., Thompson, P. A., and Granger, J. (2013). The contributions of nitrate uptake and efflux to isotope fractionation during algal nitrate assimilation. Geochem. Cosmochem. Acta 132, 391–412. doi: 10.1016/j.gca.2013.09.030
Keen, G. A., and Prosser, J. I. (1987). Steady state and transient growth of autotrophic nitrifying bacteria. Arch. Microbiol. 147, 73–79. doi: 10.1007/BF00492908
Lomas, M. W., and Lipschultz, F. (2006). Forming the primary nitrite maximum: Nitrifiers or phytoplankton? Limnol. Oceanogr. 51, 2453–2467. doi: 10.4319/lo.2006.51.5.2453
Mackey, K. R. M., Bristow, L., Parks, D. R., Altabet, M. A., Post, A. F., and Paytan, A. (2011). The influence of light on nitrogen cycling and the primary nitrite maximum in a seasonally stratified sea. Prog. Oceanogr. 91, 545–560. doi: 10.1016/j.pocean.2011.09.001
Mariotti, A., Germon, J. C., Hubert, P., Kaiser, P., Letolle, R., Tardieux, A., et al. (1981). Experimental determination of nitrogen kinetic isotope fractionation: some principles; illustration for the denitrification and nitrification processes. Plant Soil 62, 413–430. doi: 10.1007/BF02374138
Martin, J. H., Gordon, R. M., and Fitzwater, S. E. (1990). Iron in Antarctic waters. Nature 345, 156–158. doi: 10.1038/345156a0
Martínez-García, A., Sigman, D. M., Ren, H., Anderson, R. F., Straub, M., Hodell, D. A., et al. (2014). Iron fertilization of the Subantarctic ocean during the last ice age. Science 343, 1347–1350. doi: 10.1126/science.1246848
Martinez, R. (1991). Transient nitrate uptake and assimilation in Skeletonema costatum cultures subject to nitrate starvation under low irradiance. J. Plankton Res. 13, 499–512. doi: 10.1093/plankt/13.3.499
Masson, D., and Peña, A. (2009). Chlorophyll distribution in a temperate estuary: The Strait of Georgia and Juan de Fuca Strait. Estuar. Coast. Shelf Sci. 82, 19–28. doi: 10.1016/j.ecss.2008.12.022
Montoya, J. P., and McCarthy, J. J. (1995). Isotopic fractionation during nitrate uptake by phytoplankton grown in continuous culture. J. Plankton Res. 17, 439–464. doi: 10.1093/plankt/17.3.439
Needoba, J. A., and Harrison, P. J. (2004). Influence of low light and a light: dark cycle on NO−3 Uptake, Intracellular NO−3, and Nitrogen Isotope Fractionation by Marine Phytoplankton. J. Phycol. 40, 505–516. doi: 10.1111/j.1529-8817.2004.03171.x
Needoba, J. A., Sigman, D. M., and Harrison, P. J. (2004). The Mechanism of Isotope Fractionation During Algal Nitrate Assimilation as Illuminated by the 15N/ 14N of Intracellular Nitrate. J. Phycol. 40, 517–522. doi: 10.1111/j.1529-8817.2004.03172.x
Needoba, J. A., Waser, N., Harrison, P., and Calvert, S. (2003). Nitrogen isotope fractionation in 12 species of marine phytoplankton during growth on nitrate. Mar. Ecol. Prog. Ser. 255, 81–91. doi: 10.3354/meps255081
Révész, K., Böhlke, J.-K., and Yoshinari, T. (1997). Determination of δ18O and δ15N in Nitrate. Anal. Chem. 69, 4375–4380. doi: 10.1021/ac9610523
Robinson, R. S., Sigman, D. M., DiFiore, P. J., Rohde, M. M., Mashiotta, T. A., and Lea, D. W. (2005). Diatom-bound 15N/14N: New support for enhanced nutrient consumption in the ice age subantarctic. Paleoceanography 20:PA3003. doi: 10.1029/2004PA001114
Shearer, G., Schneider, J. D., and Kohl, D. H. (1991). Separating the efflux and influx components of net nitrate uptake by Synechococcus R2 under steady-state conditions. J. Gen. Microbiol. 137, 1179–1184. doi: 10.1099/00221287-137-5-1179
Sigman, D. M., Altabet, M. A., McCorkle, D. C., Francois, R., and Fischer, G. (1999). The δ15N of nitrate in the southern ocean: Consumption of nitrate in surface waters. Global Biogeochem. Cycles 13, 1149. doi: 10.1029/1999GB900038
Sigman, D. M., Casciotti, K. L., Andreani, M., Barford, C., Galanter, M., and Bohlke, J. K. (2001). A bacterial method for the nitrogen isotopic analysis of nitrate in seawater and freshwater. Anal. Chem. 73, 4145–4153. doi: 10.1021/ac010088e
Sigman, D. M., DiFiore, P. J., Hain, M. P., Deutsch, C., Wang, Y., Karl, D. M., et al. (2009a). The dual isotopes of deep nitrate as a constraint on the cycle and budget of oceanic fixed nitrogen. Deep Sea Res. Part I. 56, 1419–1439. doi: 10.1016/j.dsr.2009.04.007
Sigman, D. M., Granger, J., DiFiore, P. J., Lehmann, M. M., Ho, R., Cane, G., et al. (2005). Coupled nitrogen and oxygen isotope measurements of nitrate along the eastern North Pacific margin. Global Biogeochem. Cycles 19, doi: 10.1029/2005GB002458
Sigman, D. M., Karsh, K. L., and Casciotti, K. L. (2009b). “Nitrogen isotopes in the ocean,” in Encyclopedia of Ocean Sciences (update from 2001), eds J. H. Steele, K. K. Turekian, and S. A. Thorpe (London: Academic Press), 4138–4153.
Silva, S. R., Kendall, C., Wilkison, D. H., Ziegler, A. C., Chang, C., and Avanzino, R. J. (2000). A new method for collection of nitrate from fresh water and the analysis of nitrogen and oxygen isotope ratios. J. Hydrol. 228, 22–36. doi: 10.1016/S0022-1694(99)00205-X
Smart, S. M., Fawcett, S. E., Thomalla, S. J., Weigand, M. A., Reason, C. J., and Sigman, D. M. (2015). Isotopic evidence for nitrification in the 1 Antarctic winter mixed layer. Global Biogeochem. Cycles. 29, 427–445. doi: 10.1002/2014GB005013
Smith, J. M., Chavez, F. P., and Francis, C. A. (2014). Ammonium uptake by phytoplankton regulates nitrification in the sunlit ocean. PloS ONE. 9:e108173 doi: 10.1371/journal.pone.0108173
Spies, A., and Parsons, T. R. (1985). Estuarine microplankton: an experimental approach in combination with field studies. J. Exp. Mar. Biol. Ecol. 92, 63–81. doi: 10.1016/0022-0981(85)90022-X
Stockner, J. G., Cliff, D. D., and Shortreed, K. R. S. (1979). Phytoplankton ecology of the Strait of Georgia, British Columbia. J. Fish. Res. Board Can. 36, 657–666. doi: 10.1139/f79-095
Thompson, P. A., Levasseur, M. E., and Harrison, P. J. (1989). Light-limited growth on ammonium vs. nitrate: what is the advantage for marine phytoplankton? Limnol. Oceanogr. 34, 1014–1024.
Treibergs, L. A., Fawcett, S. E., Lomas, M. W., and Sigman, D. M. (2014). Nitrogen isotopic response of prokaryotic and eukaryotic phytoplankton to nitrate availability in Sargasso Sea surface waters. Limnol. Oceanogr. 59, 972–985. doi: 10.4319/lo.2014.59.3.0972
Wada, E., and Hattori, A. (1978). Nitrogen isotope effects in the assimilation of inorganic nitrogenous compounds by marine diatoms. Geomicrobiol. J. 1, 85–101. doi: 10.1080/01490457809377725
Wankel, S. D., Kendall, C., Pennington, J. T., Chavez, F. P., and Paytan, A. (2007). Nitrification in the euphotic zone as evidenced by nitrate dual isotopic composition: Observations from Monterey Bay, California. Global Biogeochem. Cycles. 21. doi: 10.1029/2006GB002723
Ward, B. B. (1987). Nitrogen transformations in the Southern California Bight. Deep Sea Res. Part A Oceanogr. Res. Pap. 34, 785–805. doi: 10.1016/0198-0149(87)90037-9
Ward, B. B., Glover, H., and Lipschultz, F. (1989). Chemoautotrophic activity and nitrification in the oxygen minimum zone off Peru. Deep Sea Res. Part A Oceanogr. Res. Pap. 36, 1031–1051. doi: 10.1016/0198-0149(89)90076-9
Ward, B. B., Talbot, M. C., and Perry, M. J. (1984). Contributions of phytoplankton and nitrifying bacteria to ammonium and nitrite dynamics in coastal waters. Cont. Shelf Res. 3, 383–398. doi: 10.1016/0278-4343(84)90018-9
Waser, N. A., Yin, K., Yu, Z., Tada, K., Harrison, P. J., Turpin, D. H., et al. (1998a). Nitrogen isotope fractionation during nitrate, ammonium and urea uptake by marine diatoms and coccolithophores under various conditions of N availability. Mar. Ecol. Prog. Ser. 169, 29–41. doi: 10.3354/meps169029
Keywords: nitrate isotopes, nitrate assimilation, nitrification, phytoplankton, marine ecology
Citation: Rohde MM, Granger J, Sigman DM and Lehmann MF (2015) Coupled nitrate N and O stable isotope fractionation by a natural marine plankton consortium. Front. Mar. Sci. 2:28. doi: 10.3389/fmars.2015.00028
Received: 26 March 2015; Accepted: 11 May 2015;
Published: 29 May 2015.
Edited by:
Hongbin Liu, The Hong Kong University of Science and Technology, ChinaReviewed by:
Marta Plavsic, Rudjer Boskovic Institute, CroatiaSergio Ruiz-Halpern, Southern Cross University, Australia
Copyright © 2015 Rohde, Granger, Sigman and Lehmann. This is an open-access article distributed under the terms of the Creative Commons Attribution License (CC BY). The use, distribution or reproduction in other forums is permitted, provided the original author(s) or licensor are credited and that the original publication in this journal is cited, in accordance with accepted academic practice. No use, distribution or reproduction is permitted which does not comply with these terms.
*Correspondence: Julie Granger, Department of Marine Sciences, University of Connecticut Avery Point, 1080 Shennecossett Road, Groton, CT 06340, USA,anVsaWUuZ3JhbmdlckB1Y29ubi5lZHU=