 Katherine R. M. Mackey1*
 Maria T. Kavanaugh2
 Fujiang Wang3
 Ying Chen3Fei Liu4
 David M. Glover2
 Chia-Te Chien5
 Adina Paytan5
- 1Earth System Science, University of California Irvine (UCI), Irvine CA, USA
- 2Department of Marine Chemistry and Geochemistry, Woods Hole Oceanographic Institution, Woods Hole, MA, USA
- 3Shanghai Key Laboratory of Atmospheric Particle Pollution Prevention, Department of Environmental Science and Engineering, Fudan University, Shanghai, China
- 4Department of Earth Sciences, Second Institute of Oceanography, Nanjing University, Nanjing, China
- 5Institute of Marine Science, University of California Santa Cruz, Santa Cruz CA, USA
Chinese coastal waters support vast fisheries and vital economies, but their productivity is threatened by increasingly frequent harmful algal blooms (HABs). Here we provide direct experimental evidence that atmospheric deposition, along with riverine input, opens new niches for bloom-forming dinoflagellates and diatoms in the East China Sea (ECS) by increasing the ratio of nitrogen to phosphorus (N:P), inducing severe P limitation, and altering trace metal micronutrient inventories. Remote sensing analysis of blooms in the region showed that dinoflagellate blooms were associated with increased aerosol optical thickness and decreased sea surface temperature, whereas diatom blooms were primarily associated with seasonally decreased temperature (e.g., during spring blooms). Bottle incubation experiments revealed that aerosol additions approximating 10 days of strong deposition increased iron availability and intensified P limitation, which together promoted dinoflagellate growth in offshore waters. Diatom growth was correlated with elevated trace metal and nutrient content from aerosols. Aerosols did not induce phytoplankton growth at a station within the Yangtze River plume where light was limiting, consistent with remote sensing observations that aerosol effects are stronger in offshore waters. Eutrophication and trace metal enrichment from Yangtze River discharge together with atmospheric deposition may underlie the transition from diatom-dominated spring blooms toward more frequent spring and summer dinoflagellate blooms that has occurred over the past three decades in the ECS.
Introduction
Chinese coastal seas support the largest fishing industry in the world, supplying China with over 57 million metric tons of food annually and providing jobs to over 9.2 million people (FAO, 2014). Yet anthropogenic nutrient enrichment has led to eutrophication in these waters (Kim et al., 2011), and the frequency of harmful algal blooms (HABs) has been increasing steadily since the 1980s (Tang et al., 2006). Eutrophication of Chinese coastal waters is manifested by increasingly frequent dinoflagellate blooms (Lu et al., 2005; Hu et al., 2008), and intensification of spring diatom blooms that occur naturally in the region (Tang et al., 2006). Much of the work studying these blooms has focused on eutrophication caused by Yangtzee River discharge, which brings substantial anthropogenic nutrient input into the East China Sea.
In China, eutrophication from anthropogenic atmospheric nutrient deposition is gaining recognition as an environmental threat to terrestrial and aquatic ecosystems (Zhang, 1994; Kim et al., 2011; Liu et al., 2013). Although deposition of natural aerosols supports marine productivity globally by supplying macronutrients (nitrogen (N), Duce et al., 2008, phosphorus (P), Herut et al., 1999; Mackey et al., 2012b) and trace metals (Mahowald et al., 2005; Mackey et al., 2010; Mackey K. R. et al., 2012), anthropogenic aerosols tend to have much higher proportions of N relative to P (Duce et al., 2008; Kim et al., 2011), and provide more soluble trace metals than natural particles (Uematsu et al., 2010; Sholkovitz et al., 2012; Mackey et al., 2015b). As such they can alter phytoplankton population dynamics and favor species that would not bloom under natural conditions.
The potential ecological impacts of Asian aerosols on marine ecosystems are vast, yet our understanding of how they currently affect marine productivity is in its infancy. Atmospheric N deposition in China increased 60% between the 1980 and 2000s (Liu et al., 2013), and Chinese marginal seas now receive more than 14% of the total N deposition to the entire North Pacific Ocean (Gao et al., 1997). This extreme N loading has caused Chinese coastal waters to transition from N to P limited status (Kim et al., 2011). Moreover, some Asian aerosols (including natural sources like Gobi Desert “dust” as well as anthropogenic emissions) follow eastward trajectories (Tian and An, 2012) and are deposited on the open Pacific Ocean (Duce et al., 1980) and the North American Pacific coast (Fischer et al., 2009). Understanding the impact of Asian aerosols on marine ecosystems is therefore an issue of global concern.
The effect of riverine eutrophication on HABs is well documented in China based primarily on experimental work (Anderson et al., 2002; Zhou et al., 2008; Li et al., 2014), but studies into the effect of atmospheric deposition on phytoplankton have been less direct. While atmospheric deposition has been put forth as a factor influencing bloom dynamics based on remote sensing (Weng et al., 2011; Tian and An, 2012; Wang et al., 2012) and by comparing atmospheric nutrient fluxes with biological requirements (Zhang, 1994), to our knowledge no study in the ECS has empirically linked in situ phytoplankton growth to aerosol enrichment or directly investigated the effects of aerosol deposition on specific bloom-forming taxa. This study investigates the combined input of anthropogenic nutrients and trace metals from the Yangtze River and anthropogenic aerosols by comparing phytoplankton responses to aerosol enrichment at two sites within and just outside of the Yangtze River plume.
The ECS lies along the eastern coast of China from Taiwan to the Yellow Sea (Figure 1A). The Yangtze (Changjiang) River discharges nutrients from industry and intense agricultural activity into the ECS (Figure 1B) where it mixes with the oligotrophic waters of the Kuroshio current (Zhang et al., 2007). While a southerly coastal current persists, bulk flow on the shelf is generally to the north. Winds and surface currents are strongly affected by the monsoon, with winds coming from the southeast in the summer monsoon phase and from the northwest during the winter phase. Strong seasonal signals are evident optically, resulting from suspended particles and colored dissolved organic matter nearshore (Mao et al., 2012), and where the ratio of non-phytoplankton to phytoplankton particles peaks during winter monsoon conditions from wind-driven sediment resuspension (Shi and Wang, 2010; Aurin et al., 2013). Finally, the strength and direction of monsoon winds can affect the trajectory of both aerosols and aeolian dust from the continent to the marine environment.
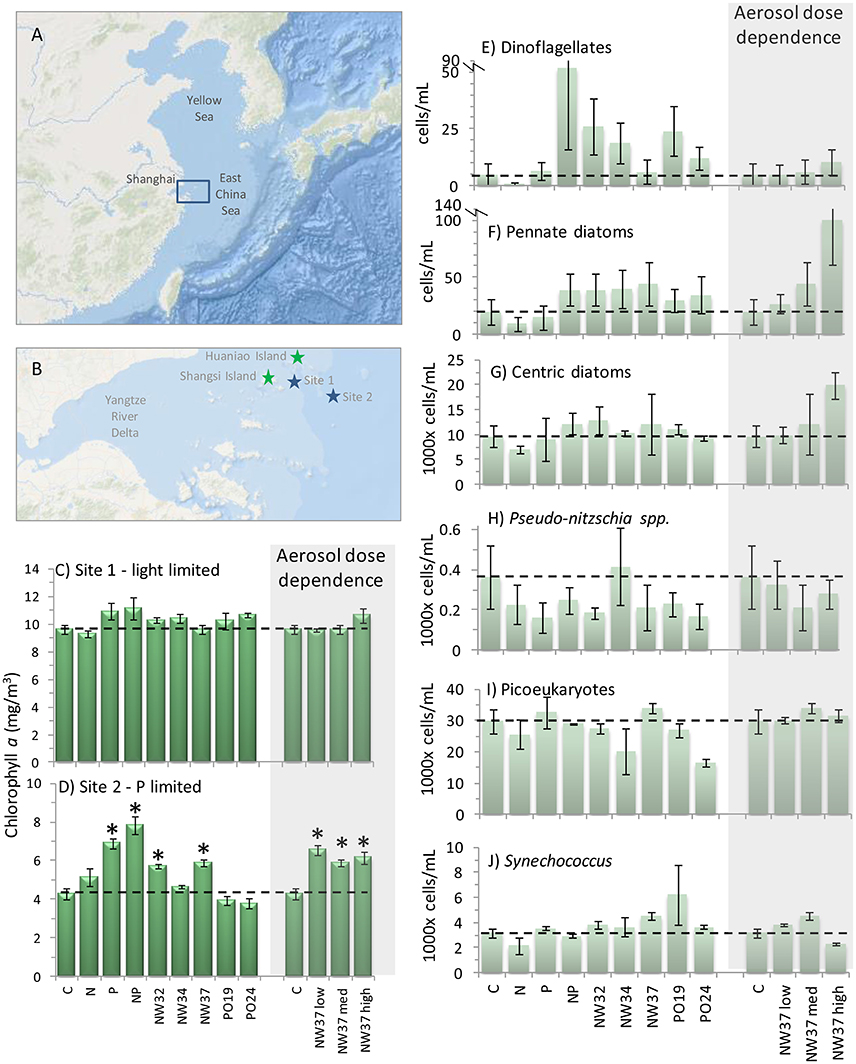
Figure 1. Phytoplankton responses from East China Sea bottle incubation experiments. Maps show (A) Chinese marginal seas and (B) the region of the East China Sea sampled near the mouth of the Yangtze River in the Zhoushan Archipelago. Blue stars show site 1 and site 2 water collection stations; green stars show Huaniao Island where aerosol samples were collected, and Shengsi Island where the incubation experiments were conducted. (C,D) Chlorophyll a concentrations (±SE) on the final day of the site 1 and site 2 experiments. *Indicates average is significantly different from the control (p < 0.05, dashed line) using one-way ANOVA and Bonferroni correction. Cell counts on the final day of the site 2 experiment (±SE) for (E) dinoflagellates, (F) pennate diatoms (not including Pseudonitzschia spp.), (G) centric diatoms, (H) Pseudonitzschia spp., (I) picoeukaryotes, and (J) Synechococcus. N = nitrate, P = phosphate, NW32, NW34, NW37, PO16, and PO26 are aerosol additions (1 mg/L). Aerosol sample NW37 was also administered at low (0.2 mg/L) and high (5 mg/L) concentrations to test aerosol dose responses (shaded regions). Dashed lines show control levels at final time point.
The ECS is one of China's largest fisheries, yet in 2003 72% of the 119 HAB events in Chinese waters occurred there (Tang et al., 2006). HAB frequencies have also increased markedly in the past three decades, where fewer than 10 events per year were recorded in the 1980s compared with 86 events in 2003 (Tang et al., 2006). The high atmospheric deposition and river discharge rates, increased HAB frequency and severity, and economic importance of the ECS therefore make it a prime site to study the interactions between river and aerosol induced eutrophication and HAB formation. We use direct observations from bottle incubation experiments and ocean color data on dinoflagellate- and diatom-dominated blooms to show that aerosol nutrients and metals support phytoplankton growth, and that HAB-forming dinoflagellates are particularly responsive to the effects of aerosols.
Materials and Methods
Incubation Setup and Sampling
Seawater for incubation experiments was collected at two sites located in and near the Yangtze River plume in April 2011 aboard a local fishing boat. Site 1 was within the plume, and site 2 was further away from the river discharge point (Figures 1A,B). Site 1 was nearer to the mouth of the Yangtze River, between two islands in an area with visible suspended sediment (30° 43′ 04″N, 122° 39′ 58″E; Figures 1A,B). Site 2 was east of the Zhoushan Archipelago in waters influenced by the Kuroshio Current outside the area of high sediment resuspension from the Yangtze River, and had a salinity of 31.7ppt (30° 38′ 12.2″N, 122° 56′ 8.51″ E). Site 1, being more heavily influenced by the river discharge, had a salinity of 28.7ppt. Assuming river water has a salinity of zero and ocean water has a salinity of 33, the water we collected at site 1 was a mixture of 87% seawater and 13% river water, while site 2 was 96% seawater and 4% river water. Both of these sites are clearly affected by the Yangtze River outflow, and this is reflected in their salinity levels and nutrient characteristics.
Trace metal clean techniques were used to collect incubation water and during all handling and sample processing steps. Acid cleaning included a 1 week Citranox soaking step, followed by a 1week 10% hydrochloric acid soaking step, followed by a thorough milliQ rinse. All containers and equipment were stored double bagged until use after acid cleaning. For each experiment, surface seawater was collected using a peristaltic pump with acid cleaned C-Flex tubing, passed through 80 μm mesh into acid clean, sample rinsed 50L carboys, and transported to Shengsi Island in the dark. Transport took less than 2 h. In the lab, water was dispensed into 500 mL acid clean, sample rinsed, clear polycarbonate bottles. Nutrient additions included nitrogen (N, as 10 μM NaNO3 + 0.5 μM (NH4)2SO4), phosphorus (P, as 0.5 μM NaH2PO4), or N + P together, and these concentrations were designed to approximately double the background concentrations of these nutrients observed at site 1. Control bottles contained no nutrient additions.
Aerosol treatments included aerosols representing 5 different dates of collection (see below). To simulate 10 days of a moderately strong deposition event for this region (1 g m−2 d−1) over a 10 m mixed layer, 1 mg aerosol on the filter was added per L of seawater. The aerosol filter was cut to the correct size to deliver the appropriate amount of aerosol and then added directly to the bottles. No prior leaching step was included to increase the solubility of the aerosols. The annual average deposition flux for the region is 4.6–98 g m−2 y−1 (Gao et al., 1997). The deposition rate assumed for the additions is thus an order of magnitude above average and represents strong wind or dust storm conditions (Mahowald et al., 2005). For aerosol NW37, concentrations of 0.2 mg L−1 (similar to average or typical loading at the site) and 5 mg L−1 (very high deposition, strong dust storm conditions) were also included to test phytoplankton responses to aerosol dosing. Bottles were incubated in a flowing seawater pool by pumping coastal seawater into the pool at a rate high enough to maintain ambient coastal seawater temperatures without allowing the pool to warm from sunlight. No attempt to artificially manipulate temperature was made. The pool was shaded with a neutral density shade cloth to attenuate sunlight 50% for both site 1 and site 2 experiments. Three bottles per treatment were sampled at “time zero” (collected immediately after nutrient or aerosol additions were made) and on the final day of the incubation 3 days later. The incubation time of 3 days was selected because it is long enough to observe changes in phytoplankton community structure based on prior studies (Mackey et al., 2009; Paytan et al., 2009; Mackey et al., 2012b, 2014; Mackey K. R. et al., 2012; Chien et al., 2016), while avoiding major bottle effects that occur with longer-term incubation experiments.
Aerosol Collection
Aerosols were collected at Huaniao Island (30.86°N, 122.67°E), 70 km away from mainland China in the ECS. Total suspended particle samples were collected daily onto Whatman 41 cellulose filters via a high volume (1130 L min−1) sampler (Thermo Scientific). Three samples with northwestern (NW) back trajectories originating over mainland China and two samples with back trajectories over the Pacific Ocean (PO) were used. Sample IDs and collection dates were: NW32 (19 Nov 2010), NW34 (23 Nov 2010), NW37 (29 Nov 2010), PO19 (16 Aug 2010), and PO24 (26 Aug 2010). Chemical characterization of aerosol samples from this site is provided elsewhere (Zhu et al., 2013).
Seawater Nutrient and Trace Metal Analyses
Water samples for nutrient and trace metal analyses from the incubation experiments were filtered (0.2 μm PES) in a laminar flow hood following trace metal clean techniques. Sample bottles were stored in clean plastic bags and stored frozen. Nitrate (plus nitrite) and phosphate were analyzed via a Lachat Autoanalyzer as described previously (Mackey K. R. et al., 2012) using standards prepared in low nutrient seawater. Detection limits were determined as three times the standard deviation of the blank (5 replicates of low nutrient seawater), and were 0.28 μM for nitrate and 0.005 μM for phosphate.
To measure trace metals in the incubation seawater, samples from the incubation experiments and operational field blanks (MilliQ water, see below) were acidified to pH < 2 with concentrated trace metal grade nitric acid at least 48 h before processing. Trace metals were concentrated using Nobias Chelate-PA1 resin (HITACH, Japan) to remove the seawater matrix, and eluted in 5 mL nitric acid following (Sohrin et al., 2008). Concentrated samples were analyzed by ICP-MS using standards prepared in 5% nitric acid as described previously (Mackey et al., 2015b). All sample preparation occurred within a class 1000 clean room in class 10 laminar flow hoods under HEPA filtration.
Operational field blanks of MilliQ water collected to determine if trace metal contamination was introduced during the course of the incubation. Incubation bottles were filled with 500 mL of MilliQ water and were incubated identically to the seawater samples. One bottle was collected every day of the experiment and these blanks were processed along with the seawater samples. The concentrations were 0.046 ± 0.028 nM Cd, 0.010 ± 0.0032 nM Pb, 3.2 ± 2.1 nM Al, 0.98 ± 0.28 nM Fe, 0.00024 ± 0.00 nM Co, 0.13 ± 0.088 nM Ni, 0.22 ± 0.12 nM Cu, and 1.8 ± 0.76 nM Zn (average ± standard deviation, n = 5). Separate MilliQ procedural blanks (including column chemistry through ICP analysis) were also performed. Reported values herein for seawater samples have been blank corrected using the procedural blank averages.
Chlorophyll a (chl-a)
Samples (200 mL) were filtered on GF/F filters and extracted for 24 h in 90% acetone at −20°C, and chl-a concentrations in the extract were determined fluorometrically on a TD700 fluorometer (Turner Designs; Mackey K. R. et al., 2012).
Phytoplankton Enumeration
For flow cytometry, 1.5 mL sample water was preserved with glutaraldehyde (0.1% final concentration), and samples were stored at −80°C. Measurements were made on an Influx flow cytometer (BD Biosciences) to enumerate cells <3 μm. Cells were classified as picoeukaryotes or Synechococcus based on chlorophyll and phycoerythrin autofluorescence as previously described (Mackey et al., 2014). Prochlorococcus was not present in our samples.
Phytoplankton >3 μm were identified via microscopy. The 50 mL samples were preserved with formalin (2% final concentration), concentrated using a settling chamber, and enumerated on an Olympus IX 70 inverted microscope equipped with epifluorescence excitation. A minimum of 400 cells per sample were counted at 200 × magnification.
Statistical Analyses
Principle component analysis (PCA) was conducted on log transformed nutrient and trace metal data for the control and 1 mg/L aerosol addition treatments. Subsequent principle component scores were correlated with phytoplankton growth rates calculated from the initial and final measurements of cell density. PCA was chosen to account for the covariance among nutrients within the different treatments and because sample size prohibited a full factorial analysis. We report the first four principle components, which account for >95% of the total variance (PC1: 68.6%, PC2: 20.2%, PC3: 3.4%, and PC4: 2.9%).
Results of single factor analysis of variance (ANOVA) on log transformed cell count data are reported in Table S5 for completeness. Due to the high natural variability of both the chemical composition of replicate aerosol samples (Table S3) and the relatively high variance associated with cell count methodologies (Figure 1), the ANOVA did not identify differences among treatments at this sample size. Therefore, by virtue of analyzing effects over the whole range of aerosol treatments and testing for combined effects, the PCA was determined to be a more robust indicator of aerosol effects on phytoplankton.
Remote Sensing
We used an existing database of HAB events in which researchers had directly identified the phytoplankton species causing the bloom to inform our remote sensing analysis. This allowed us to obtain remote sensing data for blooms primarily dominated by dinoflagellates or diatoms, as well as mixed assemblages, and to analyze the datasets separately to determine the effects of aerosols and temperature on these different taxa. Level 3 (4 km) daily and 8-day averages for chl-a, sea surface temperature (SST), and aerosol optical thickness (aot_869; hereafter AOT) from the MODIS/Aqua satellite were downloaded. To account for the episodic nature of potential deposition events and typical residence times of iron in the mixed layer, we computed a cumulative AOT index (hereafter cAOT) by summing the aerosol optical thickness of the previous 32 days of any given measurement. Daily data were matched to bloom events and spatially binned within a 10 km radius around confirmed bloom sites where phytoplankton species had been identified by the State Oceanic Administration (SOA) and peer reviewed literature articles (Zhao, 2010; Table S1, Figure 2A). Dominant taxa were categorized as dinoflagellate-dominated, diatom-dominated, or mixed assemblage (i.e., communities not dominated by either diatoms or dinoflagellates) based on direct observations made at the sites during the blooms, as recorded in the source data and published in reference 33 (see Table S1); in other words, classification of the blooms as being dominated by dinoflagellates, diatoms, or mixed assemblages was based on direct prior observations made at the sites during the blooms, not based on the satellite data that we retrieved. While blooms occurred in early spring and late fall, we confined our analysis to late spring through early fall (April through October) to minimize effects of turbidity. Multiple regression analyses were conducted to determine the relative importance of SSTA and cAOT on chl-a across taxonomic groups. Potential drivers and responses were standardized prior to analysis (Z-scores); thus, effect sizes could be determined from regression coefficients and compared between potential drivers and taxa.
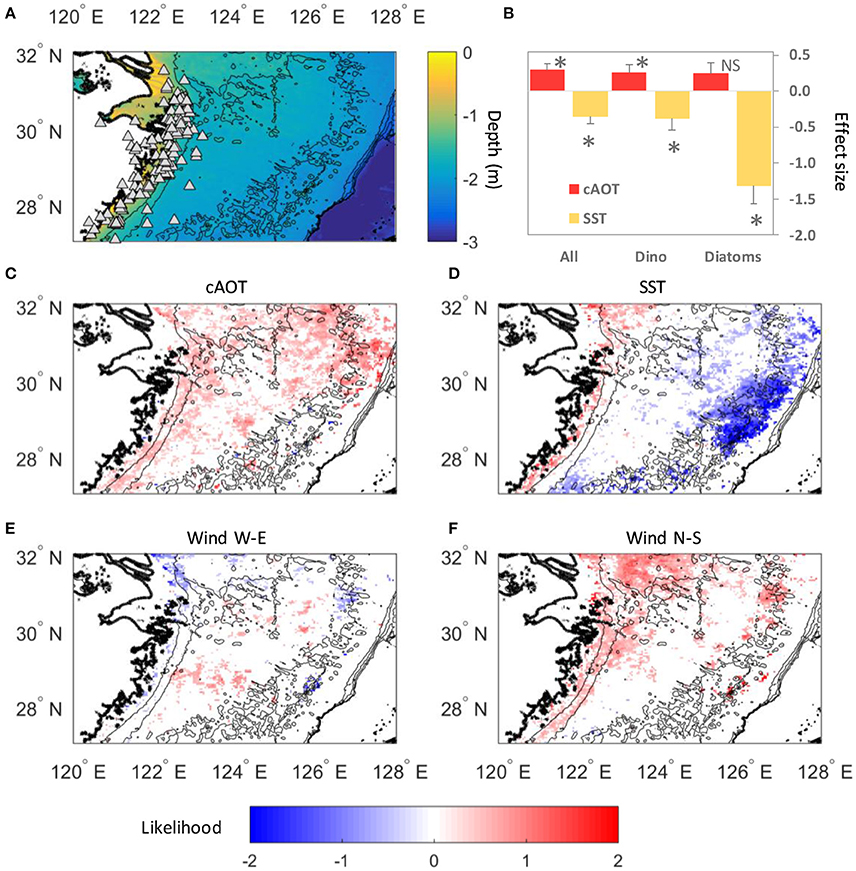
Figure 2. Phytoplankton responses to aerosols, surface temperatures and winds. (A) Map of the East China Sea showing locations of verified HABs in the database (white triangles, Table S1). White asterisks show locations of incubation experiments. (B) Effect size of cAOT and SST on chl-a in all HABs overall, as well as HABs dominated by either dinoflagellates or diatoms. Error bars show standard errors, *Significant at p ≤ 0.05, NS not significant. (C–F) Spatial patterns of the effect of cAOT, SST, east-west winds, and north south winds on bloom likelihood. Likelihoods are a result of multiple logistic regression of standardized variables, thus reflect the relative response associated with each variable after considering the effects of the other three variables. Likelihoods are log-transformed with log(0) equivalent to an equal or 1:1 likelihood of bloom or non-bloom (no effect), <0 = no bloom more likely, and >0 bloom more likely. Only significant responses (p < 0.05) shown.
Blooms, defined as anomalously high chl-a events, were identified from satellite imagery across the domain. Blooms were defined as pixels where chl-a exceeded one standard deviation from the mean, and chl-a exceeded 1 mg m−3. Multiple logistic regression was conducted to determine the effect of cAOT, SSTA, and winds on bloom incidence.
Winds and Monsoons
Daily vector wind velocities were obtained from the NCEP/NCAR reanalysis (Kalnay et al., 1996; http://www.esrl.noaa.gov/psd/data/gridded/data.ncep.reanalysis.html). These data are a product of an assimilative model used in state of the art forecasting and are available globally at ~2° resolution. As such, only mean velocities for the domain were computed. The North Pacific East Asian Monsoon Index (Wang et al., 2001) was also used as an indicator of regional seasonal variability.
Results
Site 1 Phytoplankton Growth Responses
The initial chl-a concentration in the experiment with water from site 1 was 1.8 ± 0.0 μg L−1. In all treatments chl-a increased more than 5-fold by the end of the experiment, and concentrations ranged from 9.3 to 11.1 μg L−1 (Figure 1C). All final concentrations were significantly different than baseline, but were not significantly different from the control (p < 0.05, one-way ANOVA and t-test with Bonferroni correction), suggesting that the populations were light limited in situ rather than nutrient limited, as has been observed in prior studies (Chen et al., 2001). This is also supported by the larger diffuse attenuation coefficient of downwelling irradiance at 490 nm at site 1 (Kd = 1.03 m−1) compared to site 2 (Kd = 0.52 m−1) for April 2011. Light limitation was relieved once we incubated the water during the experiment, allowing cells to take up nutrients that were already available in the water but not consumed due to light limitation in situ. There was no significant dose-dependent response of chl-a to aerosol NW37. Because the growth in all bottles appeared to be similar, phytoplankton counts were not analyzed for the different treatments in the site 1 experiment.
Site 2 Phytoplankton Growth Responses
Chl-a in site 2 incubation water had an initial concentration of 7.4 ± 0.4 μg L−1, which was higher than at site 1 (1.8 ± 0.0 μg L−1), likely due to light limitation within the river plume (see results and discussion below). Final chl-a concentrations in the site 2 experiment ranged from 3.8 to 7.8 μg L−1 (Figure 1D). The largest increase relative to the control occurred in the N + P and P treatments, while the lowest concentrations were observed in the aerosol treatments PO19 and PO24. Aerosol treatments from the NW trajectory had chl-a concentrations from 4.6 to 5.7 μg L−1 and this was significantly different from the control (p < 0.05). To determine significance, one-way ANOVA and t-test using Bonferroni correction were used (Microsoft Excel), where the ANOVA determined whether any significant differences existed between treatments, and the Bonferroni provided p-values based on the number of comparisons. No dose-dependent effect of aerosol on chl-a concentration was detected, and all values were significantly different from the control (Figure 1D). Despite cell abundances increasing in all treatments by the end of the experiment (see below), chl-a levels nevertheless remained similar to or slightly lower than baseline values, possibly due to photoacclimation during the incubation.
Diatoms dominated the phytoplankton community in the site 2 experiment. In all treatments, >90% of the diatoms counted were in the genus Skeletonema, which is a chain forming centric diatom. The remainder comprised other single-celled and chain-forming pennate diatoms and single-celled centric diatoms. Centric diatoms (including Skeletonema and all other chain-forming and single-celled species) were initially present at 5.1 ± 0.5 E3 cells/mL, and ranged from 7.1 to 13.0 E3 cells/mL for all treatments at the end of the experiment (Figure 1G).
Pennate diatom cells were mostly in the genus Pseudonitzchia, including P. delecatissima and P. serrata. The baseline abundance of pennates other than Pseudonitzchia spp. was 19 ± 8 cells/mL. By the end of the experiment their concentrations remained at or below baseline levels in the control, N, and P treatments (range 9–20 cells/mL), but approximately doubled in the N + P treatment and for all aerosol treatments (range 30–44 cells/mL; Figure 1F). Pennates showed different growth responses depending on dose of aerosol NW37, but only at the p < 0.1 level (p = 0.078), reaching 100 ± 39 cells/mL in the “high” 5 mg/L treatment. Pseudonitzchia concentrations in nutrient and aerosol treatments were not significantly different than the control (0.36 ± 0.16 E3 cells/mL) and ranged from 0.17 to 0.25 E3 cells/mL (Figure 1H). The one exception was for aerosol NW34, where abundance increased to 0.42 ± 0.19 E3 cells/mL. There was no significant relationship between Pseudonitzchia abundance and aerosol dose (Figure 1H).
Dinoflagellates were (8 ± 5 cells/mL) in the initial site 2 incubation water, and increased most in the N + P treatment (52 ± 36 cells/mL; Figure 1E). Increases also occurred in several of the aerosol treatments, where abundances ranged from 6 to 26 cells/mL. There was no dose-dependent relationship for dinoflagellates with aerosol NW37 in the site 2 experiment.
The initial incubation water contained approximately 3-fold more picoeukaryotes (7.7 ± 0.7 E3 cells mL−1) than Synechococcus (2.1 ± 0.2 E3 cells mL−1) (Figures 1I,J). Picoeukaryotes increased in abundance for all treatments by the end of the experiment, and ranged from 16.6 to 34.1 E3 cells mL−1 (Figure 1I). No significant dose-dependent relationship was apparent for picoeukaryotes to aerosol NW37. Increases in Synechococcus abundance were more modest, ranging from 2.2 to 6.3 E3 cells mL−1 (Figure 1J). Synechococcus concentrations showed a dose-dependent response to aerosol NW37 (p = 1.66 E-5), where concentrations were highest for the 1 mg/L treatment (4.6 ± 0.3 E3 cells mL−1). The highest aerosol dose of 5 mg/L inhibited Synechococcus growth, and the final concentration (2.3 ± 0.1 E3 cells mL−1) remained close to the baseline level.
Calculation of Time Zero Nutrients
Nutrient uptake following nutrient and aerosol additions was rapid, and even though time zero nutrient samples were filtered and collected within 1 h of making the additions, we observed drawdown of nutrients in that time frame in our measured nutrient samples. The measured time zero nutrient levels therefore underestimated the actual nutrient levels at the start of the incubation. To get a more accurate understanding of the amount of nutrients taken up by phytoplankton during the experiment, we calculated the nutrient concentrations by summing the background or concentrations in the control (no addition) seawater, plus any nutrients added from the nutrient spikes or aerosols. For the nutrient additions, this was an additional 10 μM and/or 0.5 μM . Additions from the aerosol samples were calculated from the amount of and per mg of aerosol added (1 mg L−1), which we measured from the aerosol samples directly (Table S2). Coefficients of variation (CV) were calculated from the CV of the measured triplicate control bottles at time zero and scaled to the calculated concentration for each treatment.
Site 1 Nutrients
Initial nutrient levels in the site 1 experiment were higher than in the site 2 experiment indicative of the stronger influence of riverine nutrient input at this site. Nitrate levels at the start of the experiment were 26.7 ± 1.1 μM (Figure 3B). Initial concentrations for the site 1 experiment were 0.62 ± 0.01 μM (Figure 3D). Similar to the site 2 experiment, negligible enrichment resulted in the aerosol treatments, where initial concentrations ranged from 0.62 to 0.64 μM (Figure 3D). The initial : ratio in the site 1 experiment was 43:1 (Figure 3F).
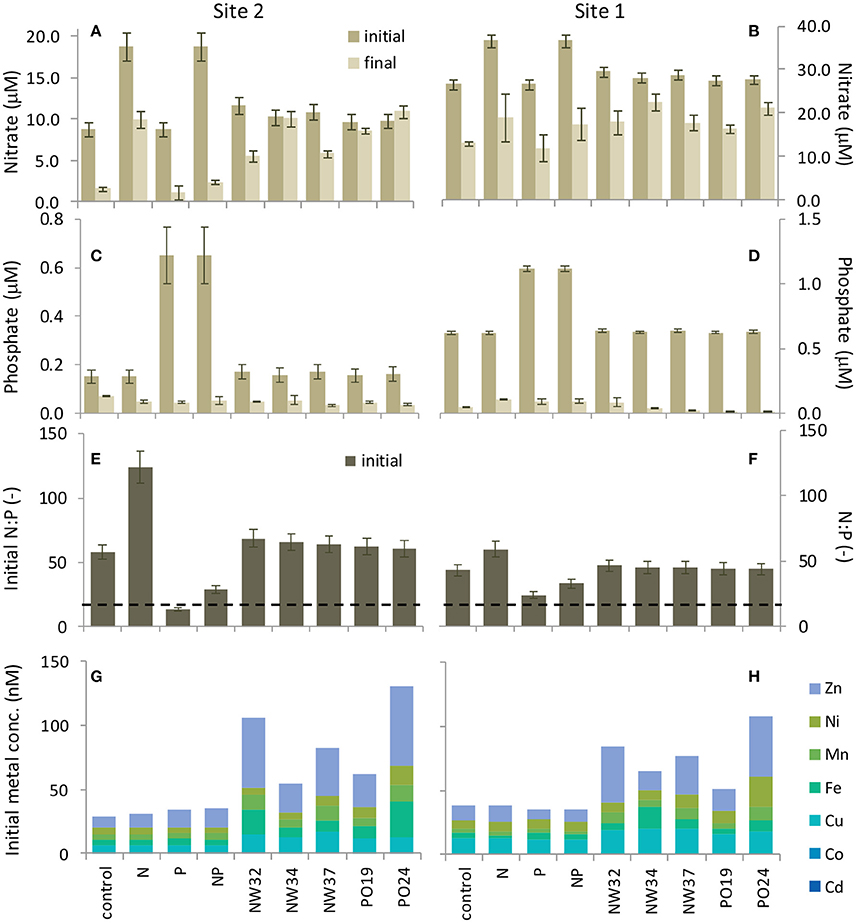
Figure 3. Seawater nutrients in the site 1 and site 2 incubation experiments indicate N enrichment and P limitation. (A,B) Nitrate and (C,D) phosphate concentration on the first and final day of the experiments show that excess N remained while P was drawn down substantially over the 4 day incubations. Legend for (A–D) shown in (A). Initial nutrient concentration values were calculated from measured values in the unammended seawater plus the amount of nutrient (nitrate or phosphate) added by the nutrient spike or the aerosol sample (see Section Materials and Methods and Table S2). Error bars for these samples show a coefficient of variation based on control samples at time zero. Final nutrient concentration values are averages of replicate sample measurements, and error bars show ±SE. (E,F) N:P ratios on the first day of each experiment were elevated above the Redfield Ratio value 16:1 (dashed line). (G,H) Initial trace metal concentrations at the beginning of the incubation experiments were enriched from aerosol additions.
Site 2 Nutrients
Initial levels in the site 2 incubation water were 8.8 ± 0.8 μM (Figure 3A). Over the course of the experiment, was drawn down by 7.2–16.3 μM in the control, N, P, and N+P treatments. Initial concentrations in the site 2 water were 0.15 ± 0.03 μM (Figure 3C). The aerosol additions did not release an appreciable amount of , and all initial levels were similar to the control water (range for samples was 0.16–0.17 μM). By the end of the experiment levels had all declined to roughly the same level and ranged from 0.03 to 0.07 μM (Figure 3C). The initial : ratio in the site 2 incubation water was 58:1, indicating an excess of relative to (Figure 3E). At the final time point all treatments were still at or above the 16:1 ratio.
Trace Metals
Concentrations of seawater soluble Al, Cd, Co, Cu, Fe, Mn, Ni, Pb, and Zn were measured immediately after nutrient and aerosol additions were made, as well as at the end of the experiment and are reported in Table S3. A subset of biologically important metals are plotted in Figures 3G,H. Variable amounts of metal enrichment resulted from the aerosol additions (Figures 3G,H and Figure S1). In particular, aerosols A32, A37, and S24 had the highest concentrations of metals over background seawater levels. The amount of seawater soluble metal released was dose-dependent (Figure S1). In general, the background seawater soluble concentrations of the metals we measured were higher in the site 1 experiment than in the site 2 experiment, with the exception of Mn and Pb (Table S3), and likely reflect a riverine source.
Winds and Monsoons
Wind velocities in the domain are strongly influenced by the East Asian Monsoon (Wang et al., 2001), with negative monsoon indices (MI) occurring primarily in winter (Figure S3B) and characterized by northwesterly winds in summer. While traditionally termed a winter phase, the negative MI can occur throughout the year, although is unusual in late summer. However, within the domain, northerly (negative V velocities, Figure S3C) and offshore (eastward, positive U velocities, Figure S3D) winds can occur episodically throughout the year. Offshore winds have peaks in occurrences during both mid-summer and mid-winter.
Ocean Color Patterns
In regions where in situ blooms had been previously identified, cumulative aerosol index had a relatively equal and opposite effect on bloom intensity as subseasonal SST when considering all summer blooms (Table 1, effect size = 0.29 ± 0.09 and −0.35 ± 0.10 std.dev.). Parsing individual taxa, cAOT had the strongest effect on chl-a in blooms of mixed assemblages (1.21 ± 0.39), although the magnitude of that effect may be sensitive to the small sample size (N = 13). cAOT also had a strong positive effect on chl-a in dinoflagellate-dominated blooms (effect size = 0.26 ± 0.11), although slightly less in magnitude, but opposite in sign to SST (−0.38 ± 0.16). Subseasonal variation in SST was the strongest potential driver in diatom dominated blooms with a 1 standard deviation decrease in SST resulting a greater than 1.3 standard deviation shift in chl-a (SSTA effect on chl-a = −1.31 ± 0.28).
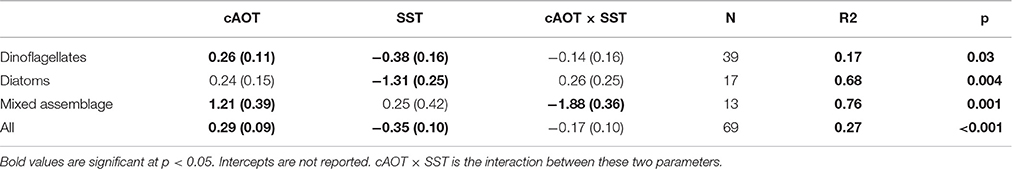
Table 1. Standardized effect sizes of MODIS/Aqua bloom data as determined by multiple linear regression.
Regional Patterns
Aerosol optical thickness was negatively correlated with the Monsoon Index throughout much of the domain (Figure S3B), however bloom likelihood is much higher during the spring and summer (Figure S3A). During our study period (April–October), spatial patterns of AOT summer mean values changed in periods of offshore vs. onshore winds, with higher concentrations of aerosols occurring offshore in patches in the northern domain during offshore winds and higher concentrations nearshore in the southern domain during onshore winds.
Across the entire shelf, increases in cAOT resulted in higher likelihood of blooms even after accounting for the effect of temperature (Figures 2B,C) and both wind velocity components. Cooler SST conditions were associated with increased incidence of blooms off of the continental shelf; whereas warmer SST conditions increased bloom likelihood in the nearshore (Figure 2D). Offshore winds were associated with increased bloom incidence in mid-shelf region (Figure 2E), and southerly winds, which dominate in summer, were associated with blooms closer to the river outflow (Figure 2F). The persistently high (but less variable) chl-a values found in the very nearshore and river mouth resulted in a limited number of blooms identified and thus limited the power of our analysis to determine the effects of all four predictors in those regions.
Discussion
We combined evidence from in situ experiments, published data on historical HAB events and dominant taxa, and remote sensing data to parse the relationships between aerosol deposition and dose, phytoplankton abundance, temperature, and cross-shelf geographical patterns. The remote sensing analysis suggests that aerosol deposition supports both dinoflagellate and diatom blooms in the ECS, but that the response is tempered by SST (Table 1; Figures 2B–F). Chl-a and cAOT were significantly correlated for dinoflagellates (p = 0.03) and mixed phytoplankton assemblages (p = 0.001), suggesting that aerosol enrichment supports or sustains these blooms. Diatom chl-a and cAOT were not significantly correlated; however, cooler SST was a significant potential driver of chl-a for diatom blooms (p = 0.004), consistent with their dominance in cool water spring blooms (Tang et al., 2006). Indeed, in the ECS diatoms typically bloom in the spring when waters are cool, whereas dinoflagellates are favored in the warmer summer months. Satellite data also showed that the effects of aerosols on phytoplankton were prevalent over the shelf, where increased incidence of blooms occurred with higher cumulative AOT. Aerosol optical thickness was negatively correlated with the Monsoon Index throughout much of the domain, however bloom likelihood is much higher during the spring and summer (Figure S3). During our study period (April–October), spatial patterns of AOT summer mean values changed in periods of offshore vs. onshore winds, with higher concentrations of aerosols occurring offshore in patches in the northern domain during offshore winds, and higher concentrations nearshore in the southern domain during onshore winds. While we cannot account for any spatial variability in the wind effect, wind mixing would likely affect SST. Furthermore, the significant effect of cAOT on bloom incidence was present even after accounting for both offshore wind velocity and changes in SST. Thus, the increase in bloom incidence is associated with cAOT directly, and not an indirect effect of the association of cAOT and offshore winds.
To understand the biogeochemical mechanisms by which aerosols fuel dinoflagellate and diatom blooms, we conducted two bottle incubation experiments at locations influenced by the Yangtze River plume in the ECS (Figures 1A,B). We tested five distinct, locally-collected aerosol samples with different sources and chemical compositions at a dose equivalent to 10 days of strong deposition in the ECS (see Section Materials and Methods). In addition, “high,” “medium,” and “low” doses of aerosol NW37 (0.2, 1, and 5 mg L−1) were included to probe dose dependence. Site 2 was outside the area heavily influenced by the Yangtze River suspended sediment (although some limited Yangtze River water influence may still be seen), while site 1 was within an archipelago near the Shengsi Islands where sediment is resuspended by the Yangtze River outflow (Zhang et al., 2007). Phytoplankton from site 1 location grew similarly regardless of nutrient or aerosol additions, indicating that light was the primary factor limiting growth at this site (Figure 1C), as has been observed in other studies in this region (Chen et al., 2001). In other words, when we collected water at site 1, the high sediment load was causing the phytoplankton to be light limited in situ. This light limitation was relieved during our incubation experiment because the bottles were incubated in a shallow pool and away from the turbid water that would have shaded them in situ. Relief from light limitation during the experiment allowed phytoplankton to utilize nutrients that were already present in the water before our nutrient and aerosol additions were made (nutrients likely primarily introduced by the Yangtze River), and therefore all treatments grew similarly to the control, because they all had sufficient background nutrient levels already. This observation of in situ light limitation at site 1 is consistent with the consistently high suspended sediment load near the river mouth (Chen et al., 2001) that reduces light availability, the associated higher Kd value at this site, and with satellite observations that aerosol effects on phytoplankton are not found in the nearshore. It also suggests that the large nutrient enrichments from the Yangtze River are sufficient to support phytoplankton productivity near the river mouth, but that low light may constrain the extent to which phytoplankton can grow due to shading from suspended sediments.
The growth of site 2 phytoplankton varied by treatment. The greatest chlorophyll increase occurred when was added alone or with (Figure 1D), consistent with P limitation of the bulk phytoplankton community (Chen et al., 2001). Aerosol additions contributed but added a negligible amount of to the seawater (Table S2), with seawater N:P ratios well above the Redfield ratio of 16:1 (from 58:1 in unamended seawater to 61–69:1 in aerosol treatments; Figure 3E). Strong P uptake and utilization was also observed, where P concentrations in all treatments were drawn down sharply by the end of the experiment (Figure 3C).
Aerosols had a smaller effect on seawater chemistry at site 1 because nutrient concentrations were higher closer to the Yangtze River outflow (Table S2), and therefore the seawater N:P ratios were less sensitive to aerosol nutrients (N:P = 43:1 in unamended seawater and from 44:1 to 46:1 in aerosol treatments; Figure 3F). Indeed, N concentration in Yangtze River water has increased 8-fold over the past 60 years and supply 1.4 million tons of N to the ECS per year (Wang, 2006; Xu et al., 2013), thus riverine control of nutrient chemistry is expected the closer a site is located to this source. These experiments demonstrate that eutrophic N:P ratios in the ECS are influenced by both river discharge and atmospheric deposition, and that the relative importance of each nutrient source depends on the distance from the Yangtze River outflow as well as the aerosol deposition flux.
Although, site 2 phytoplankton biomass was limited by P in our experiment based on seawater N:P ratios much higher than the Redfield Ratio (Figure 3E) and the highest chlorophyll a concentrations being induced by additions of P (alone or together with N; Figure 1D), different phytoplankton taxa nevertheless responsed to aerosol additions that provided very little P enrichment (Figures 1E–J). To determine which aerosol constituents in addition to N and P could give rise to the individual growth responses of each taxa, we analyzed the concentrations of trace metal micronutrients that were added by the aerosols (Figures 3G,H) and performed PCA on the site 2 dataset (Table 2).
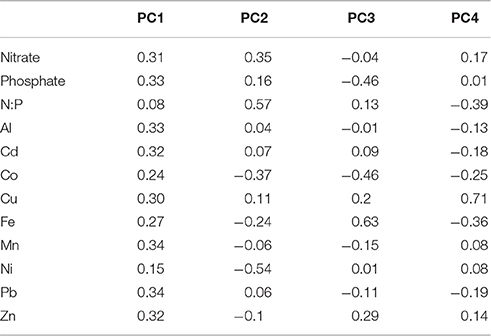
Table 2. Loadings of the top four principle components on nutrients.
Our analysis shows that aerosol additions that enhancing P limited conditions and by providing Fe were correlated with dinoflagellate growth (PC3, p = 0.01; Table 3, Figure 1E). Dinoflagellate abundance has been linked to phosphate depletion and organic P utilization in other coastal areas like coastal California where red tides occur (Mackey et al., 2012a). Moreover, common HAB-forming dinoflagellates in the ECS like Prorocentrum donghaiense (Lu et al., 2005; Tang et al., 2006) have a preference for high N:P ratios (~30:1) (Hu et al., 2008), hence they would be favored under P limited conditions intensified by aerosols with high N:P values, particularly in warmer months. Discharge from the Yangtze River also serves to elevate the seawater N:P; however, the extremely high N:P ratios in aerosols intensify the already high N:P values, particularly at site 2 where river discharge is more diluted with ocean water (Figures 3E,F). Interestingly, it appears to be the P deficiency, not the N enrichment, that favors dinoflagellates (Table 3, PC 3, p < 0.01), suggesting their success may stem from a competitive advantage that dinoflagellates have when P levels are too low for other phytoplankton to thrive.
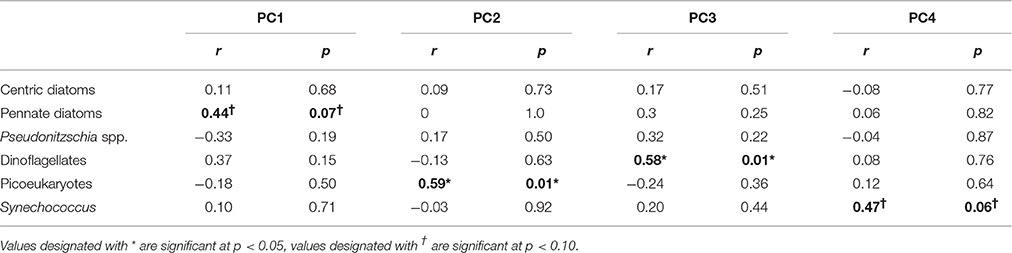
Table 3. Correlation coefficients (r) and significance levels (p) between the top four principle components and phytoplankton growth rates.
The frequency of harmful dinoflagellate blooms in the ECS has increased in the last decade, with blooms covering over 1000 km2 and lasting weeks to months (UNEP's Regional Seas Programme & United Nations Environment Programme, 2005; Tang et al., 2006; Zhao, 2010). The observation that native dinoflagellates are correlated with P limitation in our field experiment and that dinoflagellate blooms are correlated with aerosol load in the satellite record suggests that the large scale ecological shift toward more frequent dinoflagellate HABs could be linked to a regional increase in N:P and Fe:P in the water induced by deposition of aerosols and high nutrient river discharge. Both the Yangtze River outflow and aerosols contribute to the P limited (high N:P) conditions in the ECS; however, based on our analysis dinoflagellates benefitted most when bioavailable Fe levels were also higher. This could suggest that the main role of aerosols in supporting dinoflagellates is to provide Fe, as well as to intensify P limitation by forcing the N:P ratio and therefore P demand even higher than river input alone would do (Figure 3E). As the dinoflagellates were linked to warming temperatures, these effects could also be exacerbated by climate warming. The lack of a dose dependent response to aerosol NW37 could be due to toxicity from a different trace metal constituent introduced in the highest dose, or competition with other phytoplankton that were favored more strongly by the high dose.
Diatoms are natural spring bloom formers in the ECS, though the frequency and intensity of their blooms have been increasing (Tang et al., 2006). The growth response of pennate diatoms (excluding toxin-producing Pseudonitzchia spp.) to aerosols was dose-dependent (p = 0.078; Figure 1F; Table S5). Skeletonema costatum, a common spring bloom-forming ECS phytoplankter (Tang et al., 2006), comprised over 90% of centric diatoms in our samples. Pennate diatom growth responses were correlated with overall nutrient and trace metal enrichment from aerosols (PC1, p = 0.07, Tables 2, 3). Therefore, while dinoflagellates exploit the niche created by P limited conditions, diatoms appear to benefit from overall nutrient and trace metal enrichment caused by aerosols.
Another HAB forming diatom, Pseudonitszchia, was present at site 2. Pseudonitszchia produce the neurotoxin domoic acid, which causes amnesic shellfish poisoning. It has been shown that Pseudonitszchia bloom and increase domoic acid production following iron (Fe) enrichment (Silver et al., 2010), and it has been hypothesized that Fe enrichment from atmospheric deposition could favor this genus (Silver et al., 2010). However, Pseudonitszchia growth was not significantly different from the control following aerosol and nutrient enrichment (Figure 1H), possibly suggesting it grows better under lower nutrient conditions. Unlike dinoflagellates that benefit from high N:P ratios (low relative P), Pseudonitszchia pungens is more competitive under high P availability, hence preferring lower N:P ratios (~10:1) (Hu et al., 2008). Thus, it is possible that this genus was already at a disadvantage in the ECS prior to our experiment due to river discharge and persistent aerosol deposition with high N:P (Kim et al., 2011).
Synechococcus and picoeukaryotes did not respond strongly to most treatments, although in some cases their abundances declined following aerosol additions. Synechococcus abundance was lowest in the “high” aerosol treatment (Figure 1J). These negative responses could be due to competition (i.e., if picoplankton were outcompeted due to aerosol fertilization of other species in the community), or toxicity from trace metals (Paytan et al., 2009; Guo et al., 2012). The PCA suggests that the responses are likely a combination of these factors. Synechococcus was weakly positively correlated with high Cu, low Fe, and low N:P ratios (PC4, p = 0.06; Tables 2, 3). This is surprising given that Synechococcus, as a cyanobacterium, is generally assumed to be more sensitive to Cu toxicity than eukaryotic phytoplankton (Brand et al., 1986). This observation supports the idea that phytoplankton strains from regions with naturally high metal concentrations, like the ECS, tend to have greater flexibility and tolerance in responding to metals compared to cells from the open ocean (Brand et al., 1986; Stuart et al., 2009; Mackey et al., 2015a). In contrast, picoeukaryotes were correlated with high N:P ratios, but low levels of Ni and Co, suggesting that while N enrichment favors their growth, the response is tempered by metal sensitivity (PC2, p = 0.01; Tables 2, 3). Interestingly, autumn aerosols from NW trajectories originating over mainland China were correlated with PC2 while summer aerosols originating over the Pacific Ocean were inversely correlated with PC2 (Figure S2), suggesting that a potential seasonal influence of aerosols on picoeukaryotes could occur in the ECS. Future studies that include simultaneous monitoring of aerosol deposition and chemistry, seawater chemistry, and phytoplankton community dynamics will confirm if this pattern occurs in situ.
This study shows the potential for anthropogenic aerosols, together with river discharge and other natural and anthropogenic factors, to shape phytoplankton communities by influencing seawater N:P ratios and trace metal inventories. Alteration of natural nutrient availability patterns contributes to the success of HAB-forming phytoplankton by creating a new ecological niches and relieving natural constraints on phytoplankton growth. In the ECS, particularly away from the influence of the Yangtze River, new niches are opened as aerosols increase already high seawater N:P ratios, induce P limitation, and alter trace metal availability. The effects of these factors vary between phytoplankton groups and are modulated by aerosol dose and composition, SST, and geographical location (i.e., distance from the river outflow) and other biogeochemical factors. Shifts in coastal biogeochemistry from aerosol deposition may therefore exacerbate the eutrophication, HAB frequency and intensity in the East China Sea that have occurred over the past three decades.
Author Contributions
All authors listed, have made substantial, direct and intellectual contribution to the work, and approved it for publication.
Conflict of Interest Statement
The authors declare that the research was conducted in the absence of any commercial or financial relationships that could be construed as a potential conflict of interest.
The reviewer YL declared a shared affiliation, though no other collaboration, with one of the authors MK to the handling Editor, who ensured that the process nevertheless met the standards of a fair and objective review.
Acknowledgments
We thank Susan Coale for performing cell counts. We thank Hao Yin for collecting the aerosol samples and Lin Guo and Li Zhu for assistance with set up and sampling in the field. This research was supported by NSF-OCE grant 0850467 to AP and NASA Award NNX14AM36G to MK and DG. We thank S. Lin, E. Fouilland, and Y Li for their constructive review comments.
Supplementary Material
The Supplementary Material for this article can be found online at: http://journal.frontiersin.org/article/10.3389/fmars.2017.00002/full#supplementary-material
References
Anderson, D. M., Glibert, P. M., and Burkholder, J. M. (2002). Harmful algal blooms and eutrophication: nutrient sources, composition, and consequences. Estuaries 25, 704–726. doi: 10.1007/BF02804901
Aurin, D., Mannino, A., and Franz, B. (2013). Spatially resolving ocean color and sediment dispersion in river plumes, coastal systems, and continental shelf waters. Remote Sens. Environ. 137, 212–225. doi: 10.1016/j.rse.2013.06.018
Brand, L. E., Sunda, W. G., and Guillard, R. R. L. (1986). Reduction of marine phytoplankton reproduction rates by copper and cadmium. J. Exp. Mar. Biol. Ecol. 96, 225–250. doi: 10.1016/0022-0981(86)90205-4
Chen, Y. L. L., Chen, H. Y., Lee, W. H., Hung, C. C., Wong, G. T. F., and Kanda, J. (2001). New production in the East China Sea, comparison between well-mixed winter and stratified summer conditions. Cont. Shelf Res. 21, 751–764. doi: 10.1016/S0278-4343(00)00108-4
Chien, C. T., Mackey, K. R., Dutkiewicz, S., Mahowald, N. M., Prospero, J. M., and Paytan, A. (2016). Effects of African dust deposition on phytoplankton in the western tropical Atlantic Ocean off Barbados. Glob. Biogeochem. Cycles 30, 716–734. doi: 10.1002/2015GB005334
Duce, R. A., LaRoche, J., Altieri, K., Arrigo, K. R., Baker, A. R., Capone, D. G., et al. (2008). Impacts of atmospheric anthropogenic nitrogen on the Open Ocean. Science 320, 893–897. doi: 10.1126/science.1150369
Duce, R. A., Unni, C. K., Ray, B. J., Prospero, J. M., and Merrill, J. T. (1980). Long-range atmospheric transport of soil dust from Asia to the Tropical North Pacific: temporal variability. Science 209, 1522–1524. doi: 10.1126/science.209.4464.1522
FAO (2014). Fao Yearbook. Fishery and Aquaculture Statistics 2012. Rome: Food and Agriculture Organization of the United Nations.
Fischer, E. V., Hsu, N. C., Jaffe, D. A., Jeong, M.-J., and Gong, S. L. (2009). A decade of dust: Asian dust and springtime aerosol load in the U.S. Pacific Northwest. Geophys. Res. Lett. 36, L03821. doi: 10.1029/2008GL036467
Gao, Y., Arimoto, R., Duce, R. A., Zhang, X. Y., Zhang, G. Y., An, Z. S., et al. (1997). Temporal and spatial distributions of dust and its deposition to the China Sea. Tellus B 49, 172–189. doi: 10.1034/j.1600-0889.49.issue2.5.x
Guo, C., Yu, J., Ho, T. Y., Wang, L., Song, S., Kong, L., et al. (2012). Dynamics of phytoplankton community structure in the South China Sea in response to the East Asian aerosol input. Biogeosciences 9, 1519–1536. doi: 10.5194/bg-9-1519-2012
Herut, B., Krom, M. D., Pan, G., and Mortimer, R. (1999). Atmospheric input of nitrogen and phosphorus to the Southeast Mediterranean: Sources, fluxes, and possible impact. Limnol. Oceanogr. 44, 1683–1692. doi: 10.4319/lo.1999.44.7.1683
Hu, Z.-X., Xu, N., Li, A.-F., and Duan, S.-S. (2008). Effects of different N: P ratios on the growth of Pseudonitzschia pungens, Prorocentrum donghaiense and Phaeocystis globosa. Acta Hydrobiol. Sin. 32, 482–487. doi: 10.3724/SP.J.1035.2008.00482
Kalnay, E., Kanamitsu, M., Kistler, R., Collins, W., Deaven, D., Gandin, L., et al. (1996). The NCEP/NCAR 40-Year Reanalysis Project. Bull. Am. Meteorol. Soc. 77, 437–472. doi: 10.1175/1520-0477(1996)077<0437:TNYRP>2.0.CO;2
Kim, T.-W., Lee, K., Najjar, R. G., Jeong, H.-D., and Jeong, H. J. (2011). Increasing N abundance in the Northwestern Pacific Ocean due to Atmospheric Nitrogen Deposition. Science 334, 505–509. doi: 10.1126/science.1206583
Li, H.-M., Tang, H.-J., Shi, X.-Y., Zhang, C.-S., and Wang, X.-L. (2014). Increased nutrient loads from the Changjiang (Yangtze) River have led to increased Harmful Algal Blooms. Harmful Algae 39, 92–101. doi: 10.1016/j.hal.2014.07.002
Liu, X., Zhang, Y., Han, W., Tang, A., Shen, J., Cui, Z., et al. (2013). Enhanced nitrogen deposition over China. Nature 494, 459–462. doi: 10.1038/nature11917
Lu, D., Goebel, J., Qi, Y., Zou, J., Han, X., Gao, Y., et al. (2005). Morphological and genetic study of Prorocentrum donghaiense Lu from the East China Sea, and comparison with some related Prorocentrum species. Harmful Algae 4, 493–505. doi: 10.1016/j.hal.2004.08.015
Mackey, K. R., Buck, K. N., Casey, J. R., Cid, A., Lomas, M. W., Sohrin, Y., et al. (2012). Phytoplankton responses to atmospheric metal deposition in the coastal and open-ocean Sargasso Sea. Front. Microbiol. 3:359. doi: 10.3389/fmicb.2012.00359
Mackey, K. R. M., van Dijken, G. L., Mazloom, S., Erhardt, A. M., Ryan, J., Arrigo, K. R., et al. (2010). Influence of atmospheric nutrients on primary productivity in a coastal upwelling region. Glob. Biogeochem. Cycles 24:GB4027. doi: 10.1029/2009GB003737
Mackey, K. R., Roberts, K., Lomas, M. W., Saito, M. A., Post, A. F., and Paytan, A. (2012b). Enhanced solubility and ecological impact of atmospheric phosphorus deposition upon extended seawater exposure. Environ. Sci. Technol. 46, 10438–10446. doi: 10.1021/es3007996
Mackey, K. R. M., Post, A. F., McIlvin, M. R., Cutter, G. A., John, S. G., and Saito, M. A. (2015a). Divergent responses of Atlantic coastal and oceanic Synechococcus to iron limitation. Proc. Natl. Acad. Sci. U.S.A. 112, 9944–9949. doi: 10.1073/pnas.1509448112
Mackey, K. R., Chien, C.-T., and Paytan, A. (2014). Microbial and biogeochemical responses to projected future nitrate enrichment in the California upwelling system. Front. Microbiol. 5:632. doi: 10.3389/fmicb.2014.00632
Mackey, K. R. M., Chien, C.-T., Post, A. F., Saito, M. A., and Paytan, A. (2015b). Rapid and gradual modes of aerosol trace metal dissolution in seawater. Front. Microbiol. 5:794. doi: 10.3389/fmicb.2014.00794
Mackey, K. R., Mioni, C. E., Ryan, J. P., and Paytan, A. (2012a). Phosphorus Cycling in the Red Tide Incubator Region of Monterey Bay in Response to Upwelling. Front. Microbiol. 3:33. doi: 10.3389/fmicb.2012.00033
Mackey, K. R. M., Rivlin, T., Grossman, A. R., Post, A. F., and Paytan, A. (2009). Picophytoplankton responses to changing nutrient and light regimes during a bloom. Mar. Biol. 156, 1531–1546. doi: 10.1007/s00227-009-1185-2
Mahowald, N. M., Baker, A. R., Bergametti, G., Brooks, N., Duce, R. A., Jickells, T. D., et al. (2005). Atmospheric global dust cycle and iron inputs to the ocean. Glob. Biogeochem. Cycles 19:GB4025. doi: 10.1029/2004gb002402
Mao, Z., Chen, J., Pan, D., Tao, B., and Zhu, Q. (2012). A regional remote sensing algorithm for total suspended matter in the East China Sea. Remote Sens. Environ. 124, 819–831. doi: 10.1016/j.rse.2012.06.014
Paytan, A., Mackey, K. R. M., Chen, Y., Lima, I. D., Doney, S. C., Mahowald, N., et al. (2009). Toxicity of atmospheric aerosols on marine phytoplankton. Proc. Natl. Acad. Sci. U.S.A. 106, 4601–4605. doi: 10.1073/pnas.0811486106
Shi, W., and Wang, M. (2010). Satellite observations of the seasonal sediment plume in central East China Sea. J. Mar. Syst. 82, 280–285. doi: 10.1016/j.jmarsys.2010.06.002
Sholkovitz, E. R., Sedwick, P. N., Church, T. M., Baker, A. R., and Powell, C. F. (2012). Fractional solubility of aerosol iron: synthesis of a global-scale data set. Geochim. Cosmochim. Acta 89, 173–189. doi: 10.1016/j.gca.2012.04.022
Silver, M. W., Bargu, S., Coale, S. L., Benitez-Nelson, C. R., Garcia, A. C., Roberts, K. J., et al. (2010). Toxic diatoms and domoic acid in natural and iron enriched waters of the oceanic Pacific. Proc. Natl. Acad. Sci. U.S.A. 107, 20762–20767. doi: 10.1073/pnas.1006968107
Sohrin, Y., Urushihara, S., Nakatsuka, S., Kono, T., Higo, E., Minami, T., et al (2008). Multielemental determination of GEOTRACES key trace metals in seawater by ICPMS after preconcentration using an ethylenediaminetriacetic acid chelating resin. Anal. Chem. 80, 6267–6273. doi: 10.1021/ac800500f
Stuart, R. K., Dupont, C. L., Johnson, D. A., Paulsen, I. T., and Palenik, B. (2009). Coastal Strains of Marine Synechococcus Species Exhibit Increased Tolerance to Copper Shock and a Distinctive Transcriptional Response Relative to Those of Open-Ocean Strains. Appl. Environ. Microbiol. 75, 5047–5057. doi: 10.1128/AEM.00271-09
Tang, D., Di, B., Wei, G., Ni, I. H., and Wang, S. (2006). Spatial, seasonal and species variations of harmful algal blooms in the South Yellow Sea and East China Sea. Hydrobiologia 568, 245–253. doi: 10.1007/s10750-006-0108-1
Tian, R., and An, J. (2012). Relationship between aerosol transport routes and red tide occurrences in the East China Sea. Environ. Earth Sci. 69, 1499–1508. doi: 10.1007/s12665-012-1984-5
Uematsu, M., Hattori, H., Nakamura, T., Narita, Y., Jung, J., Matsumoto, K., et al. (2010). Atmospheric transport and deposition of anthropogenic substances from the Asia to the East China Sea. Mar. Chem. 120, 108–115. doi: 10.1016/j.marchem.2010.01.004
UNEP's Regional Seas Programme & United Nations Environment Programme (2005). Integrated Report on Harmful Algal Blooms (HABs) for the NOWPAP Region. Northwest Pacific Action Plan, Special Monitoring and Coastal Environmental Assessment Regional Activity Centre.
Wang, B. (2006). Cultural eutrophication in the Changjiang (Yangtze River) plume: history and perspective. Estuar. Coast. Shelf Sci. 69, 471–477. doi: 10.1016/j.ecss.2006.05.010
Wang, B., Wu, R., and Lau, K.-M. (2001). Interannual variability of the Asian summer monsoon: contrasts between the Indian and the Western North Pacific–East Asian Monsoons. J. Clim. 14, 4073–4090. doi: 10.1175/1520-0442(2001)014<4073:IVOTAS>2.0.CO;2
Wang, S. H., Hsu, N. C., Tsay, S. C., Lin, N. H., Sayer, A. M., Huang, S. J., et al. (2012). Can Asian dust trigger phytoplankton blooms in the oligotrophic northern South China Sea? Geophys. Res. Lett. 39:L05811. doi: 10.1029/2011gl050415
Weng, H., Tian, R., Ji, Z., and Yu, X. (2011). Potential relationships between atmospheric particulate matter transported by winter monsoons and red tides in the East China Sea. Chin. Sci. Bull. 56, 297–305. doi: 10.1007/s11434-010-4209-x
Xu, H., Chen, Z., Finlayson, B., Webber, M., Wu, X., Li, M., et al. (2013). Assessing dissolved inorganic nitrogen flux in the Yangtze River, China: sources and scenarios. Glob. Planet. Change 106, 84–89. doi: 10.1016/j.gloplacha.2013.03.005
Zhang, J. (1994). Atmospheric wet deposition of nutrient elements: correlation with harmful biological blooms in Northwest Pacific Coastal Zones. Ambio 23, 464–468.
Zhang, J., Liu, S. M., Ren, J. L., Wu, Y., and Zhang, G. L. (2007). Nutrient gradients from the eutrophic Changjiang (Yangtze River) Estuary to the oligotrophic Kuroshio waters and re-evaluation of budgets for the East China Sea Shelf. Prog. Oceanogr. 74, 449–478. doi: 10.1016/j.pocean.2007.04.019
Zhao, D. (2010). Occurrence Regularity of Red Tide Disaster in Chinese Sea Area. Rome: China Ocean Press.
Zhou, M., Shen, Z., and Yu, R. (2008). Responses of a coastal phytoplankton community to increased nutrient input from the Changjiang (Yangtze) River. Cont. Shelf Res. 28, 1483–1489. doi: 10.1016/j.csr.2007.02.009
Keywords: atmospheric deposition, harmful algal bloom, red tide, nutrient ratio, trace metals, East China Sea
Citation: Mackey KRM, Kavanaugh MT, Wang F, Chen Y, Liu F, Glover DM, Chien C-T and Paytan A (2017) Atmospheric and Fluvial Nutrients Fuel Algal Blooms in the East China Sea. Front. Mar. Sci. 4:2. doi: 10.3389/fmars.2017.00002
Received: 16 August 2016; Accepted: 05 January 2017;
Published: 20 January 2017.
Edited by:
Senjie Lin, University of Connecticut, USAReviewed by:
Eric Fouilland, Centre National de la Recherche Scientifique (CNRS), France (Amandine Galès contributed to the review of Eric Fouilland)Yizhen Li, Woods Hole Oceanographic Institution, USA
Copyright © 2017 Mackey, Kavanaugh, Wang, Chen, Liu, Glover, Chien and Paytan. This is an open-access article distributed under the terms of the Creative Commons Attribution License (CC BY). The use, distribution or reproduction in other forums is permitted, provided the original author(s) or licensor are credited and that the original publication in this journal is cited, in accordance with accepted academic practice. No use, distribution or reproduction is permitted which does not comply with these terms.
*Correspondence: Katherine R. M. Mackey, a21hY2tleUB1Y2kuZWR1