 Lauren V. Weatherdon1*
 Ward Appeltans2Nadine Bowles-Newark1Thomas M. Brooks3,4,5Frances E. Davis1Katherine Despot-Belmonte1Stephen Fletcher1,6Cristina Garilao7Craig Hilton-Taylor8Tim Hirsch9Diego Juffe-Bignoli1Kristin Kaschner10Naomi Kingston1Kelly Malsch1Eugenie C. Regan11
 Kathleen Kesner-Reyes12David C. Rose13Florian T. Wetzel14Tim Wilkinson1Corinne S. Martin1
- 1UN Environment World Conservation Monitoring Centre, Cambridge, UK
- 2Ocean Biogeographic Information System, Intergovernmental Oceanographic Commission of UNESCO, IOC Project Office for IODE, Oostende, Belgium
- 3International Union for Conservation of Nature, Gland, Switzerland
- 4World Agroforestry Center, University of the Philippines, Los Baños, Philippines
- 5Institute for Marine and Antarctic Studies, University of Tasmania, Hobart, TAS, Australia
- 6Marine Institute, Plymouth University, Plymouth, UK
- 7GEOMAR, Helmholtz Centre for Ocean Research Kiel, Kiel, Germany
- 8Global Species Programme, International Union for Conservation of Nature, Cambridge, UK
- 9Global Biodiversity Information Facility Secretariat, Copenhagen, Denmark
- 10Department of Biometry and Environmental System Analysis, Albert-Ludwigs-University of Freiburg, Freiburg, Germany
- 11The Biodiversity Consultancy, Cambridge, UK
- 12FishBase Information and Research Group Inc., IRRI, Los Baños, Philippines
- 13Department of Geography, University of Cambridge, Cambridge, UK
- 14Museum für Naturkunde-Leibniz Institute for Evolution and Biodiversity Science, Berlin, Germany
Biodiversity and conservation data are generally costly to collect, particularly in the marine realm. Hence, data collected for a given—often scientific—purpose are occasionally contributed toward secondary needs, such as policy implementation or other types of decision-making. However, while the quality and accessibility of marine biodiversity and conservation data have improved over the past decade, the ways in which these data can be used to develop and implement relevant management and conservation measures and actions are not always explicit. For this reason, there are a number of scientifically-sound datasets that are not used systematically to inform policy and decisions. Transforming these marine biodiversity and conservation datasets into knowledge products that convey the information required by policy- and decision-makers is an important step in strengthening knowledge exchange across the science-policy interface. Here, we identify seven characteristics of a selection of online biodiversity and conservation knowledge products that contribute to their ability to support policy- and decision-making in the marine realm (as measured by e.g., mentions in policy resolutions/decisions, or use for reporting under selected policy instruments; use in high-level screening for areas of biodiversity importance). These characteristics include: a clear policy mandate; established networks of collaborators; iterative co-design of a user-friendly interface; standardized, comprehensive and documented methods with quality assurance; consistent capacity and succession planning; accessible data and value-added products that are fit-for-purpose; and metrics of use collated and reported. The outcomes of this review are intended to: (a) support data creators/owners/providers in designing and curating biodiversity and conservation knowledge products that have greater influence, and hence impact, in policy- and decision-making, and (b) provide recommendations for how decision- and policy-makers can support the development, implementation, and sustainability of robust biodiversity and conservation knowledge products through the framing of marine policy and decision-making frameworks.
Introduction
Despite significant progress toward positive change in biodiversity policy, there is a marked mismatch between internationally-agreed policy targets and our capacity to track progress toward them (Walpole et al., 2009; Tittensor et al., 2014). With ongoing declines in biodiversity witnessed globally (McCauley et al., 2015; Newbold et al., 2015; WWF, 2016), it is critical that the best available data are used in biodiversity management and conservation. Yet, this is not as simple as one might hope: the biodiversity informatics landscape is vast and complicated (Bingham et al., 2016), with many interconnecting nodes that often fail to connect to national or international policy processes, and therefore decision-making, in a systematic manner. Differing scales, time frames, and levels of consistency in data collection methodologies and coverage, among other aspects, make it challenging to obtain a complete picture across many facets of biodiversity. Thus, while decisions at multiple levels across sectors require biodiversity data, a number of barriers block the flow of information from generation through to use in decision-making (Stephenson et al., in press). This runs the risk that important decisions are being made, or reporting occurring, with limited awareness of—or access to—useful datasets and knowledge that could alter outcomes. This is particularly important as the knowledge gaps surrounding biodiversity and associated ecosystem services are still considerable, with many basic questions unresolved (Brooks et al., 2014). Greater access to knowledge products that work toward filling spatial, taxonomic and temporal gaps in knowledge will help to reduce uncertainty surrounding decision-making, strengthen our understanding of the big picture, and increase the likelihood of improved outcomes (Campbell et al., 2007; Strydom et al., 2010).
There are many international assessments that support intergovernmental biodiversity policy agreements, and to which data providers could contribute. Initiatives, such as the Global Environmental Outlook, the Intergovernmental Science-Policy Platform on Biodiversity and Ecosystem Services (IPBES), the Global Biodiversity Outlook, the Transboundary Water Assessment Programme and the World Ocean Assessment compile evidence on the status and trends of the world's ecosystems to inform policy, and would benefit from increased access to marine biodiversity and conservation data (Brooks et al., 2014; Stephenson et al., in press). These assessments are often framed by global targets set through multilateral environmental agreements, such as the Aichi Biodiversity Targets of the UN Strategic Plan for Biodiversity 2011–2020 (CBD Secretariat, 2010) and the Sustainable Development Goals (SDGs) adopted as part of the 2030 Agenda for Sustainable Development (United Nations, 2015). Regional policy instruments transposed into national legislation, such as the European Union's Marine Strategy Framework, Habitats, Birds, and Water Framework Directives and the Common Fisheries Policy, also require biodiversity data to inform indicator development, identify and address regional drivers of change, and track progress toward national and regional targets (e.g., Boero, 2015). Associated indicators are often difficult to operationalize due to limited access to suitable biodiversity data (e.g., McOwen et al., 2016; Probst et al., 2016). Likewise, National Biodiversity Strategies and Action Plans developed by Contracting Parties to fulfill their obligations under Article 6 (General Measures for Conservation and Sustainable Use) of the Convention on Biological Diversity (CBD) use biodiversity data to inform spatial planning processes by governments and the private sector, helping to identify national priorities (Bowles-Newark et al., 2014). Improvements to national biodiversity data are guiding changes in conservation policies and on-the-ground actions, with long-term datasets enabling the identification of priority conservation areas for protecting biodiversity and maintaining ecological security and aiding in the development of biodiversity “red lists” (e.g., Wu et al., 2014; Wu, 2016). Finally, international treaties, such as the Convention on International Trade in Endangered Species of Wild Fauna and Flora (CITES) and the Convention on Migratory Species (CMS), as well as regional regulations, such as the European Union Wildlife Trade Regulations, are likewise dependent on reliable and current data to assess the conservation status of species and to track countries' adherence to trade regulations.
These needs are being addressed through the implementation of long-term monitoring networks and calls to streamline measurement efforts. Increasingly, initiatives, such as the Group on Earth Observations Biodiversity Observation Network (GEO BON) and its marine component, the Marine Biodiversity Observation Network, the Global Climate Observing System (GCOS), the Ocean Biogeographic Information System (OBIS), the Biology and Ecosystem Panel of the Global Ocean Observing System (GOOS), and associated GOOS regional alliances aim to collate and standardize existing datasets retroactively to provide a regional overview of data availability, yet these often reflect the challenges noted above. Thus, the GCOS' Essential Climate Variables (Bojinski et al., 2014), GEO BON's Essential Biodiversity Variables (EBVs) (Pereira et al., 2013; Brummitt et al., in press) and GOOS' Essential Ocean Variables (Constable et al., 2016) represent attempts to standardize and streamline data collection efforts proactively through international frameworks (e.g., GOOS' Framework for Ocean Observing, Lindstrom et al., 2012). The relevance and possible usefulness of such frameworks to multilateral environmental agreement indicators, such as those curated by the Biodiversity Indicators Partnership to monitor the UN Strategic Plan for Biodiversity, have been explored (Geijzendorffer et al., 2015). However, there is still a long way to go before these frameworks are fully operationalised and integrated into policy.
Alongside these initiatives, there are examples of progress toward implementing systematic collation of biodiversity and conservation data into knowledge products that are relevant to policy (Brooks et al., 2016). To date, studies have identified strategies for strengthening the sustainability of online knowledge products: some have focused on scientists and institutions as the key users, identifying techniques for motivating data contributions and minimizing duplication of effort (e.g., Costello et al., 2014), while others have highlighted limited data accessibility, discoverability, and digestibility (Wetzel et al., 2015) and unsuitable policy narratives (Rose et al., 2016b) as barriers to uptake in policy-making. The applications of the World Database on Protected Areas (WDPA) through Protected Planet, the IUCN Red List of Threatened Species, the Red List of Ecosystems and the World Database on Key Biodiversity Areas to tracking progress toward the Aichi Biodiversity Targets and Sustainable Development Goals have also been evaluated (Brooks et al., 2015). However, specific characteristics that strengthen the likelihood of information being used in policy- and decision-making have yet to be identified.
To address this, our review examines characteristics demonstrated by a selection of online biodiversity and conservation knowledge products that facilitate their use in biodiversity policy or decision-making at national, regional or global levels. Case studies are used to demonstrate where high-level biodiversity data are being or could be used to inform global or regional policy instruments, focusing primarily on the marine realm. The outcomes of this review are intended to: (a) support data providers in curating biodiversity and conservation knowledge products that have greater influence in policy- and decision-making, and (b) provide recommendations for how decision- and policy-makers can support the development, implementation, and longevity of robust knowledge products through the selected aims, framing, and resources of policy instruments.
Methodology
Knowledge Products Considered
The United Nations Development Programme defines good knowledge products as: relevant; based on an assessment of demand, audience needs, and unbiased evaluation; timely; clearly and consistently written and presented; developed through participatory processes; and easily accessible (UNDP, 2009). Expanding on these aspects, eight online knowledge products that have a significant marine biodiversity or conservation component (Table 1) were reviewed to identify common characteristics that influence their use or recognition in policy or policy-related assessments (e.g., delivering multilateral environmental agreement objectives; recognition by governmental or intergovernmental agencies or in global assessments; use in indicators) and decision-making (e.g., used for screening for areas of biodiversity importance; engaging in transboundary and global planning and collaboration; use in marine spatial planning) (Stephenson et al., in press). Suitable products were identified from the Manual of Marine and Coastal Datasets of Biodiversity Importance (Weatherdon et al., 2015a), which offers the only overview of marine biodiversity- or conservation-related datasets, databases, and knowledge products globally known to this paper's authors. Here, biodiversity and conservation knowledge products are defined as those which not only provide data, but also information to support interpretation and use of these data and, in some cases, capacity building and the provision of value-added products. Knowledge products were selected based on the following criteria: (1) global data coverage; (2) representative temporal range of operation (at least 3 years); (3) demonstrated continuous growth; (4) demonstrated use or recognition in a “policy context” or for decision-making; and (5) significant inclusion of marine biodiversity or conservation data. Examples of demonstrated use or recognition in a “policy context” include: acknowledgement in a policy document; use in a policy-relevant indicator, such as those curated by the Biodiversity Indicators Partnership; use by policy-makers in relation to implementation of specific multilateral environment agreement(s); and/or partnership with governments to implement marine spatial planning, among others. The selection was further refined by the availability of authors with expertise on each of the knowledge products, as expert knowledge was required to reflect on the successes and challenges faced by each.
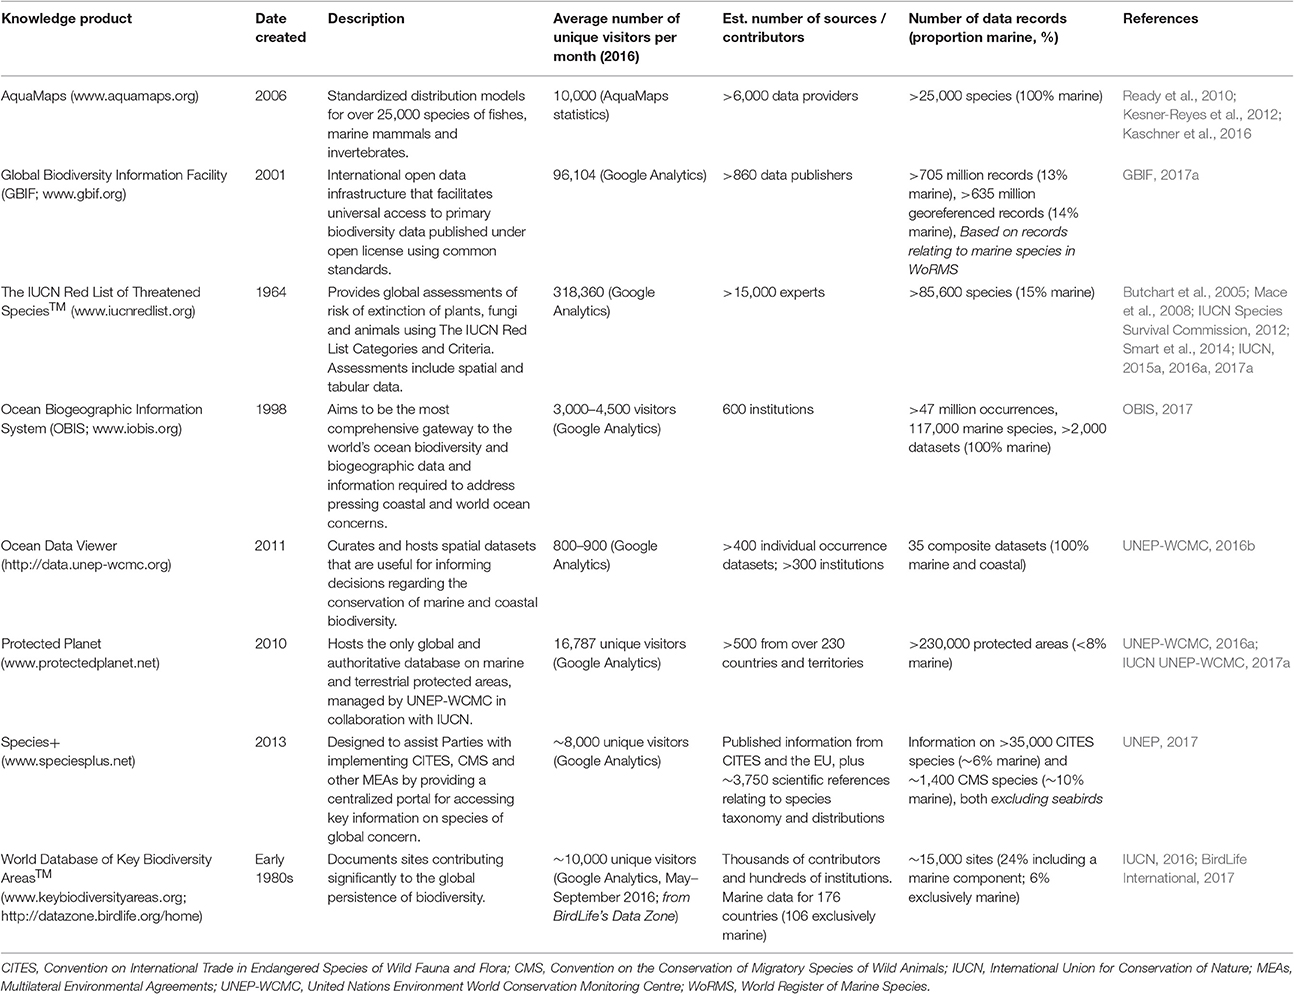
Table 1. Descriptions of biodiversity and conservation knowledge products included in this study, ordered alphabetically.
The biodiversity and conservation knowledge products examined included: the Global Biodiversity Information Facility (GBIF; www.gbif.org), the Ocean Biogeographic Information System (OBIS; www.iobis.org), Protected Planet (www.protectedplanet.net), the Ocean Data Viewer (http://data.unep-wcmc.org), The IUCN Red List of Threatened Species™ (hereafter, “IUCN Red List”; www.iucnredlist.org), the World Database of Key Biodiversity Areas™ (http://www.keybiodiversityareas.org), Species+ (www.speciesplus.net), and AquaMaps (www.aquamaps.org). The selected products are at various stages of development as knowledge products, with some that are longstanding (e.g., IUCN Red List) and others that are still in the early stages (e.g., Ocean Data Viewer); however, each of these products has moved beyond the scientific sphere and has been recognized or used directly in policy- and decision-making, whether on an ad hoc or systematic basis. The Ocean Health Index (www.oceanhealthindex.org/; Halpern et al., 2012, 2015) is another knowledge product that was first developed in 2008 and focuses on the status of the ocean with regards to 10 goals, calculated at multiple scales. As the Ocean Health Index focuses on many more facets than just marine biodiversity, it was decided that the product fell outside of the scope of this particular review. Likewise, the Living Planet Index (www.livingplanetindex.org) is also a well-established example of a knowledge product that translates scientific data into policy-relevant information, and could be considered in future reviews; however, the marine component of the Living Planet Index is still in development, focusing largely on the trends of commercial fish stocks and the incidental killing of marine mammals, seabirds, and reptiles (WWF, 2016), and was therefore not included in the review at this time. Similarly, although also including information on proposed protected areas and those that fall outside of the IUCN's definition of “protected areas” (Dudley, 2008), MPAtlas (www.mpatlas.org) is based largely on the WDPA and, unlike the WDPA, is not formally mandated; for these reasons, MPAtlas was not included in this review. While there are other, recently-established biodiversity and conservation knowledge products that show potential for supporting the implementation of policy instruments and decision-making (e.g., Mapping Ocean Wealth, www.oceanwealth.org, The Nature Conservancy, 2016; Global Fishing Watch, www.globalfishingwatch.org, SkyTruth et al., 2017), the focus of this preliminary review is to draw from the experiences of knowledge products that have been in operation for at least a few years. Large-scale biological and generalist data repositories (e.g., PANGAEA®, Dryad Digital Repository) and datasets were not the focus of this review. It is also important to note that some of the examined products host the same data; for instance, OBIS and GBIF collaborate to enable holders of marine species occurrence data to share their records with both platforms in a single publishing workflow.
Identification of Characteristics
The authors developed a non-exhaustive list of characteristics shared or targeted by these products that have facilitated their sustainability and contribution to policy instruments and decision-making, drawing from the peer-reviewed literature and experiences of those who manage these knowledge products or have expertise in user-driven design processes.
This approach is intended to offer a high-level review rather than a detailed survey of end users' perspectives and a definitive list of characteristics. As several of these products have engaged in user-centered development or surveys, the identified characteristics reflect how users' requirements have been addressed in some cases. Technical characteristics that can strengthen the sustainability and interoperability of online biodiversity information platforms, supporting their continued use in scientific research, have been documented elsewhere (e.g., Berendsohn et al., 2011; Costello et al., 2014); while these are not the focus of this review, some of the identified characteristics were found to be beneficial both to a platform's contributions to scientific research and its uptake in policy.
Results
Table 2 presents a preliminary overview of high-level characteristics common to, or targeted by, the biodiversity and conservation knowledge products reviewed that have facilitated their use in policy instruments or decision-making. An overview of how each knowledge product has achieved, or is progressing toward, each characteristic is provided in Supplementary Table 1. Further examples are discussed in the subsequent sections, with recommendations provided in Section Discussion.
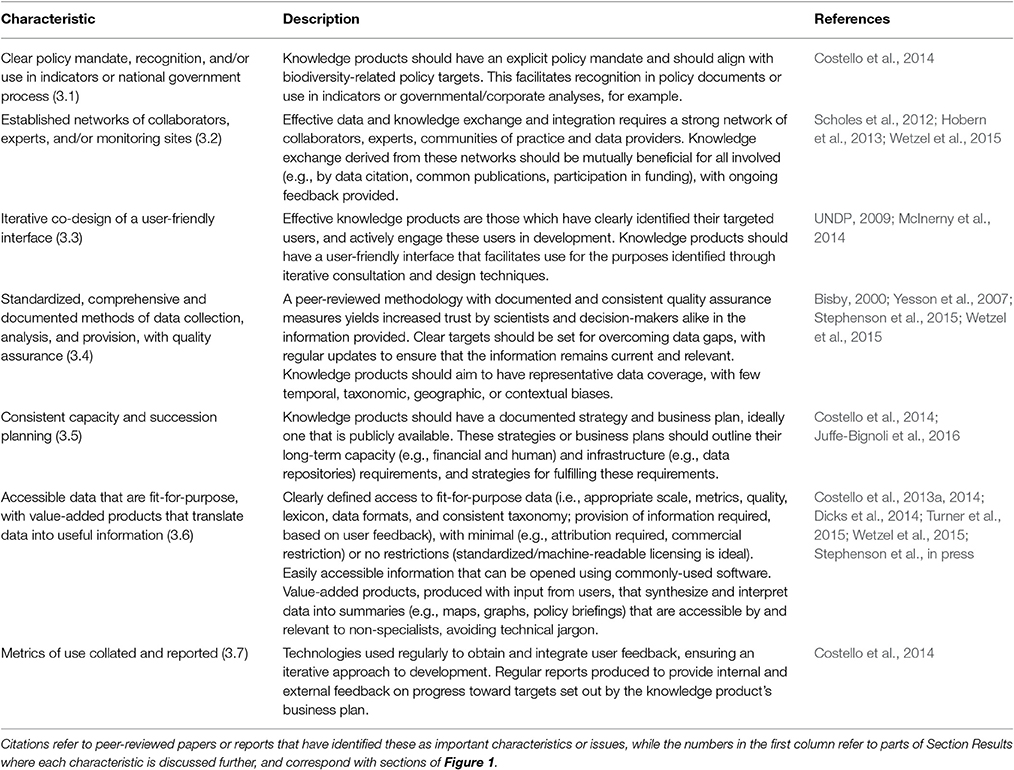
Table 2. Seven characteristics shared, or targeted by, the biodiversity and conservation knowledge products reviewed that facilitate uptake in policy- and decision-making.
Clear Mandate and Direct Policy Relevance
Biodiversity and conservation are complex subjects with many contributing facets, not including the breadth of interactions with human cultures (Royal Society, 2003; Turnhout et al., 2012). Therefore, biodiversity and conservation knowledge products must be focused on improving specific areas of knowledge through clear mandates, and must be targeted toward clearly-defined audiences. Knowledge products developed in response to policy mandates or with direct acknowledgement by policy instruments often have the benefit of guidance with regards to data requirements and targeted users, yet still require time to establish clear workflows and user engagement.
Endorsement by large scientific or intergovernmental organizations alongside a transparent policy mandate can yield support and clear institutional leadership, which is necessary to ensure the sustainability of biodiversity and conservation knowledge products (Costello et al., 2014). For instance, the WDPA, which powers Protected Planet, originated from a formal UN Economic and Social Council (ECOSOC) mandate for national submission of protected area datasets to compile the UN List of National Parks and Equivalent Reserves [ECOSOC Resolution 713 (XXVIII)], and which is now implemented by IUCN's World Commission on Protected Areas (IUCN-WCPA) and UNEP-WCMC (Brooks et al., 2015). Although a considerable amount of time passed between the ECOSOC Resolution in 1959 (UNEP-WCMC, 2016a), which was updated and renewed in 2003, and the creation of the WDPA in 1981, the former provided the impetus for the latter to occur. Since the ECOSOC Resolution, the WDPA has also been mentioned in six CBD Decisions, in five Resolutions from IUCN World Conservation Congresses, and in four IUCN World Parks Congress Recommendations, in addition to the IUCN World Parks Congress' “The Promise of Sydney” (UNEP-WCMC, 2016a). Likewise, Species+ was developed to meet the requirements of governments implementing CITES, CMS and the EU Wildlife Trade Regulations in close collaboration with the CITES Secretariat, CMS Secretariat, the European Commission, and UN Environment. GBIF derives from a recommendation of the Organization for Economic Cooperation and Development's (OECD's) Biodiversity Informatics Subgroup of the Megascience Forum, and was later endorsed by the OECD ministerial Committee for Scientific and Technological Policy. OBIS was established in 1998 under the Census of Marine Life, a decade-long US private foundation-led initiative, and was adopted as an important biodiversity component of the Intergovernmental Oceanographic Commission (IOC) of UNESCO in 2009. In 2010, the 193 Parties to the Convention on Biological Diversity (COP10) called upon IOC/OBIS and UNEP-WCMC, among other relevant international scientific partnerships to facilitate the availability and interoperability of the best available marine and coastal biodiversity datasets and information across global, regional and national scales, and to support the identification of Ecologically or Biologically Significant Marine Areas (EBSAs) (CBD/COP X/29). This mandate led to the development of the Ocean Data Viewer as an online tool that enables users to view and download spatial datasets that are useful for informing decisions regarding the conservation of marine and coastal biodiversity. Similarly, the IUCN Red List Categories and Criteria were formally adopted by the IUCN Council in 2001 (C/51/35), and the resulting IUCN Red List has since been adopted by the Parties to the Convention on Biological Diversity (CBD) to track progress on seven of the 20 Aichi Biodiversity Targets, with demonstrated relevance to regional environmental assessments (Brooks et al., 2015). These examples demonstrate the clear direction that can be provided by the support of an intergovernmental organization and the targets or reporting requirements set out by multilateral environment agreements. However, it is important to note that this, in and of itself, is often insufficient to guarantee the funding required to ensure the ongoing sustainability of a product (see Juffe-Bignoli et al., 2016).
Marine knowledge products can strengthen their relevance to policy by developing biodiversity indicators, or “measure[s] based on verifiable data that conve[y] information about more than [themselves]” (Biodiversity Indicators Partnership, 2011). Indicators are important for tracking environmental and biological change, using narratives that offer a policy-relevant interpretation of the meaning of the data upon which the indicators are based (Walpole et al., 2017). Indeed, the indicator-policy cycle, or the projecting forward of the potential outcomes of different policy options as part of an adaptive decision-making process, can be informed by the use of effective biodiversity indicators, such as the Marine Living Planet Index's use in determining the effects of different bottom trawling management measures on marine biodiversity (Nicholson et al., 2012).
The CBD-mandated Biodiversity Indicators Partnership (BIP) is a global initiative that fosters the development and delivery of a global suite of biodiversity indicators for use by the CBD and other biodiversity-related conventions (BIP Secretariat, 2017). Their biodiversity indicator development framework can be used to guide development of successful biodiversity indicators (Biodiversity Indicators Partnership, 2011), which can provide added value to marine biodiversity and conservation knowledge products by facilitating their integration into global- or national-level reporting, policy-making, and environmental management. For instance, the WDPA, the IUCN Red List, and GBIF each contribute biodiversity indicators to the BIP, including “Protected area coverage” (related to Aichi Target 11) and “Growth in species occurrence records accessible through GBIF” (related to Aichi Target 19). Data and analyses from the BIP have also been used in flagship publications, such as the CBD's Global Biodiversity Outlook 4 (GBO-4) (CBD Secretariat, 2014). Improving the quality of biodiversity indicators, particularly marine, is often a challenge due to significant data gaps, and partnerships—including the involvement of government statistical offices—are crucial for the successful establishment and long-term provision of indicators (Walpole et al., 2017).
The adoption of the 17 UN Sustainable Development Goals (SDGs) and their 169 associated targets, in 2015, has cast a new light on the policy landscape for biodiversity indicators. Many of these targets are relevant to biodiversity and conservation, in particular those under SDG14 on “Conserve and sustainably use the oceans, seas and marine resources for sustainable development.” Thus, for example, the coverage of marine key biodiversity areas by protected areas is used as the indicator for SDG target 14.5 (Biodiversity Indicators Partnership, 2016), effectively combining two of the knowledge products considered here.
Networks of Collaborators, Experts, and Monitoring Sites
The creation, mobilization and transformation of data into policy-relevant information require a strong network of collaborators (Wetzel et al., 2015), involving many actors from site-level communities of practice (e.g., International Waterbird Census) to site-based networks (e.g., European Marine Observation and Data Network [EMODNet], Long Term Ecological Research [LTER] sites). Networks of researchers or volunteers are important as they participate in data collection of different source types (Proença et al., in press), yet this can lead to challenges associated with synthesizing these data in meaningful ways (see section Standardized, Comprehensive and Transparent Methods, Data and Information for more information on data standardization, and section Accessible Data and Knowledge Products that Are Fit-For-Purpose for information on taxonomic backbones).
While remote-sensing products mostly rely on elaborate technological systems, in situ monitoring schemes require significant human capacity to collect species data [e.g., REEF Volunteer Fish Survey Project, Reef Check, and the Reef Life Survey (Edgar et al., 2014); saltmarsh monitoring programmes] and environmental data (e.g., water quality). Biodiversity monitoring schemes often depend on the contributions of many site-level volunteers (e.g., Runnel et al., 2016). For instance, citizen science efforts have been used to inform marine conservation through documentation of large-scale changes in worldwide shark abundance (Ward-Paige and Lotze, 2011; Ward-Paige et al., 2011), yet marine ecosystems are notably under-sampled by citizen science relative to their terrestrial counterparts (Theobald et al., 2015).
Research networks often need to analyze biodiversity data collated from multiple sources, and to produce multi-scale spatial models, derive species trends and predictions, and create and disseminate knowledge products (Hobern et al., 2013). To be useful and relevant, such analyses must be able to evaluate or project the impact of different policies on biodiversity, thereby linking actions with outcomes (Nicholson et al., 2012). Such approaches from expert groups are urgently needed, and require easily interpreted information to support policy-relevant discussions (e.g., visualization of population trends, Weatherdon et al., 2015b). The structure of the independent, specialist IUCN Commissions provides an example, with ~2,500 specialist members of the IUCN World Commission on Protected Areas supporting the Protected Planet knowledge product, and >10,000 specialist members of the IUCN Species Survival Commission supporting the IUCN Red List knowledge product.
Furthermore, strong interdisciplinary networks that work at the science-policy interface are required to ensure that knowledge derived from these networks effectively informs political decision processes. In particular, long-lasting efforts, such as the Biodiversity Indicators Partnership are needed to build credible learning environments that contribute to the success of knowledge exchange at the science-policy interface (Tinch et al., 2016).
Iterative Co-Design of a User-Friendly Interface
Regular use of data, decision-support tools, and value-added products depends not only on the reliability and quality of these resources, but also on them being easy to use and fit for purpose (e.g., Rose et al., 2016a). To date, biodiversity databases have often been conceived and developed in the absence of policy- and decision-makers' input, with user-driven questions considered retroactively. Direct user engagement in the conception, design, and delivery of an effective biodiversity knowledge product is necessary to ensure that the final product meets users' requirements and to increase the likelihood of uptake (e.g., Parker and Sinclair, 2001; Kujala, 2003). Value-added products that translate raw data into useful products—such as indicators, maps, reports, or policy briefs—can yield time- and cost-savings by streamlining policy reporting, but must be developed with the end user in mind. Conversely, use of technical jargon and a lack of engagement with end users can result in an end product that is not conducive to decision-making, either due to a lack of awareness, capacity, or appropriate translation within a policy- or decision-making context (Stephenson et al., in press).
“User-centered design” or “co-design” is a process that involves iterative interactions with end users when defining, developing, and testing a product, thereby aiding in the development of a product that is based on a deep understanding of users' goals, motivations, and abilities (Parker and Sinclair, 2001; McInerny et al., 2014). For instance, Species+ was developed through a partnership between the CITES Secretariat and UNEP-WCMC for a specific purpose, for an identified set of end users: namely, to assist Parties in the implementation of CITES, CMS, and the European Union Wildlife Trade Regulations. A consultative design process ensured that the product aligns with its users' needs by providing easy access to the core data and information the Parties require. For example, the interface provides access to data in multiple formats, such as downloadable species' lists by multilateral environmental agreement, a flexible search criteria, a logical information hierarchy, and an application programming interface for disseminating data. Similarly, the development of “A Global Standard for the Identification of Key Biodiversity Areas” incorporated a formal end-user consultation process (Dudley et al., 2015), which in turn led to the establishment of a Key Biodiversity Areas Consultative Forum (https://www.kbaconsultation.org/) mandated to ensure two-way information flow between the producers and the users of Key Biodiversity Area data.
User-friendly interfaces and analytical tools have been shown to generate growth in data contributions and use in the integrated scientific research necessary to support policy. Since 2008, the number of peer-reviewed articles using GBIF-mediated data has increased 8-fold, from 52 articles in 2008 to 407 articles in 2015. Between 2008 and 2016, the number of occurrence records published in GBIF also increased from ~125 million to 650 million, showing the interface's capacity to mobilize data quickly (GBIF Secretariat, 2016), of direct relevance to Aichi Target 19. This is due in part to data mobilization activities that have made it easier and more rewarding for contributors to submit data, with stronger attribution provided through the use of Digital Object Identifiers (DOIs). Similarly, all IUCN Red List species assessments are also assigned DOIs, and are thus permanent and individually citeable. Additionally, powerful application programming interfaces and analytical tools, such as those employed by OBIS (e.g., open-source R-packages, such as https://github.com/iobis/robis) provide easy and rapid access to a wealth of data systems, and are opening up these resources for use in the integrated scientific research necessary to monitor and understand important phenomena relevant to marine policy.
Standardized, Comprehensive and Transparent Methods, Data and Information
Data availability and comprehensiveness are essential considerations when providing information that offers the full picture required by decision-makers, and a challenge that is difficult to overcome. The implications are significant: limited biodiversity data can result in certain regions or taxa being overlooked in policy instruments (Geijzendorffer et al., 2015; Stephenson et al., in press). All of the products reviewed have achieved progress toward full data coverage, yet some taxonomic, geographic and contextual gaps remain (McCarthy et al., 2012; Juffe-Bignoli et al., 2016). These gaps are often clearly identified and communicated, with established targets to fill these gaps, while each product is progressing toward standardized, comprehensive, and transparent methods of data collation, quality assurance, and provision.
At present, available information in the IUCN Red List is biased toward terrestrial ecosystems, with marine species comprising fewer than 12% of those included, facing Linnean (i.e., most species on Earth are not formally described), Wallacean (i.e., for most taxa, geographical distributions are poorly understood), and Darwinian (i.e., lack of phylogenetic information) shortfalls (see Brito, 2010 and Diniz-Filho et al., 2013). With an estimated 1 to 2.2 million marine species globally (Mora et al., 2011; Appeltans et al., 2012), and only 240,000 named to date (WoRMS Editorial Board, 2017) and 50% coverage in OBIS, filling these gaps is a daunting task. However, IUCN has identified priority taxonomic groups of marine fish, invertebrates, plants and macroalgae, the inclusion of which would increase the number of marine species within the IUCN Red List by more than 6-fold (IUCN, 2017a). In addition, situations where data are insufficient to allow assessment of extinction risk are clearly documented through application of the “Data Deficient” category (IUCN, 2012); 16% of all species assessed for the IUCN Red List, and 22% of marine species, are assessed as “Data Deficient” (IUCN, 2017a,b).
The GBIF Index records occurrence information for ~1.26 million species, compared with 1.64 million species included in GBIF's taxonomic backbone (as of the 1st February 2017). However, GBIF's comprehensive content assessment methodology showed that GBIF's records—like the IUCN Red List—are dominated by terrestrial records, primarily birds (Gaiji et al., 2013), with other assessments noting unclear taxonomic coverage, record completeness, and geographic biases (Meyer et al., 2015). To address this, GBIF offers graphs and information on trends in data completeness and potential biases (e.g., seasonal, taxonomic) that provide scientists and decision-makers alike with a clearer picture on the extent of data coverage and limitations (GBIF, 2017b). As part of GBIF's current Strategic Plan, mapping and assessment of gaps will help to inform strategies for prioritizing new data mobilization among its network of national nodes and institutional data publishers (GBIF, 2017c).
Gaps in OBIS are also well-known, with more data available for the northern hemisphere, coastal areas and the ocean's surface, and a chronic under-exploration of the deep pelagic ocean (Webb et al., 2010). To address these gaps, new partnerships are underway with key scientific communities (e.g., International network for scientific investigation of deep-sea ecosystems, INDEEP), monitoring networks (e.g., Marine Biodiversity Observation Network, Global Coral Reef Monitoring Network, Animal Telemetry Network), and observing systems (as part of Global Ocean Observing System). Beyond increasing global coverage, OBIS' focus is on delivering timely and robust indicators that address emerging societal requirements based on the Essential Ocean Variables identified by the Global Ocean Observing System's Biology and Ecosystems panel. Thus, while the identified gaps in knowledge across these products highlight the challenges associated with collating standardized taxonomic and geographic data on a global scale, these examples demonstrate the value of transparent communication strategies in ensuring that policy- and decision-makers are fully aware of these gaps and their implications.
Standardization of data and metadata is an important aspect of interoperability and quality assurance, facilitating meaningful exchange of—and trust in—available marine biodiversity information. Access to underlying data and methodologies encourages transparency, allowing for greater uptake in decision making processes (Stephenson et al., in press). Standardized data quality are also essential for use in statistical analyses and for comparison across regions or sites (e.g., Darwin Core Archive for occurrence records, Wieczorek et al., 2012; ABCD [Access to Biological Collection Data Schema] for specimen records; ISO 19115 as an international metadata standard for geographic information). Several biodiversity metadata standards exist; in particular, Ecological Metadata Language (EML) is used by GBIF, OBIS and the Long-Term Ecological Research (LTER) Network to provide information on datasets (e.g., methodologies, spatial and temporal coverage, terms of use) (Fegraus et al., 2005). These standards help to ensure correct translation of data into policy-relevant information, and foster the interoperability and machine-readability of datasets collated globally. For instance, occurrence records mediated via GBIF, OBIS, and OBIS SEAMAP often derive from different sampling methodologies (e.g., acoustic, visual and tracking data), which must be accounted for when making inferences at global or regional scales. In 2010, Protected Planet established the WDPA Data Standard in 2010 to provide a global standard for protected areas data in the move toward consistent and complete data collation (Milam et al., 2016). In 2014, the WDPA standard was integrated into a full WDPA User Manual that is freely available on the Protected Planet website and updated regularly in line with user feedback (UNEP-WCMC, 2016a).
Knowledge products that effectively meet the needs of decision-makers are often those with published workflows and mandates that provide unique content (see Costello et al., 2014) aligned with policy targets. For example, the IUCN Red List maintains a transparent assessment process that is grounded in the peer-reviewed literature (IUCN, 2012), using the best scientific information available. All IUCN Red List assessments undergo peer review and consistency check before publication, and the IUCN Red List overall is accompanied by a clear process for handling petitions, and a conflict of interest policy. On the other hand, while the Ocean Data Viewer hosts a diverse selection of datasets with differing methodologies and intended uses, each of these datasets—many of which are unique—or the methodologies behind them have been published in peer-reviewed journals, and accompanying ISO 19115-compatible metadata sheets have been developed by UNEP-WCMC to provide users with knowledge of each dataset's limitations and appropriate uses (Weatherdon et al., 2015a).
Sufficient Capacity and Succession Planning
Many of the knowledge products reviewed here have the benefit of longevity (often more than a decade), which has provided them with the opportunity to establish critical size, reputation, capacity, and consistent workflows. Estimates of the financial and human capacity invested to bring the IUCN Red List and Protected Planet to their current states range from US$116 and 204 million and from 278 to 308 person-years (an average value of US$14 million), respectively, with more than three decades having elapsed since they were first formed (Juffe-Bignoli et al., 2016). This demonstrates the considerable cost associated with curating policy-relevant biodiversity information required to track progress toward established multilateral environmental agreement targets.
Biodiversity and conservation knowledge products are often dependent on revenue sources that are time-bound and project-based, making it difficult to ensure longevity and continuity of methodologies and resources. Frequently, voluntary contributions are essential to ensure that databases remain up-to-date. For instance, the Ocean Data Viewer, Protected Planet, GBIF, OBIS, AquaMaps, and the IUCN Red List, among others, are indebted to the thousands of data contributors and scientists who offer their time and resources to ensure the continuity and quality of these valuable online records. In 2013, the estimated annual financial costs associated with volunteer contributions to Protected Planet and the IUCN Red List were US$7,132 and US$504,085, respectively (Juffe-Bignoli et al., 2016). Thus, the expense noted above is often subsidized through the time of volunteers, making it difficult to ensure the continuity and consistent quality of methodologies and data provision, particularly for the site-level biodiversity monitoring networks that feed into these knowledge products.
For these reasons, clear succession and financial planning are necessary from inception to ensure the continuity of a biodiversity and conservation knowledge product and to provide transparent information on the product's overarching objectives, capacity requirements, and strategies for fulfilling both (see Costello et al., 2014). For example, the IUCN Red List has a strategic 7-year plan that is downloadable from their website, as well as explicit goals and estimated costs documented in their brochure (e.g., to assess 160,000 species; as of 2012, more than 73,000 had been assessed) (IUCN, 2012; IUCN Red List Committee, 2013). GBIF, too, has 5-year actionable plans that are outlined in formal GBIF Strategic Plan and Implementation Plan documents (GBIF, 2017c).
Accessible Data and Knowledge Products That Are Fit-For-Purpose
Linked closely to succession planning, sufficient financial support, and transparent methods is the shift toward open access data and information that are fit-for-purpose. The need for data that are not only available at the right scale, quality, and type, but also free from restrictions and cost, has made it challenging to meet these needs. This is particularly true for knowledge products that are newly established, which are subject to these requirements yet face the burden of proving their potential with limited resources.
For well-established knowledge products, there are benefits to removing barriers to data access. For instance, since Protected Planet was redesigned and the requirement for users to register removed, data downloads have increased 8-fold from 6,000 in 2014 to 47,348 in 2015 (IUCN and UNEP-WCMC, 2017b). This move toward streamlined access to data has thereby led to a measurable increase in downloaded information, demonstrating the value of moving toward greater accessibility. Likewise, GBIF and OBIS have recently transitioned to a small set of machine-readable Creative Commons licenses that allow interested parties to download and use data with fewer restrictions.
However, the move toward increased accessibility also has implications for those who contribute, and particularly for the voluntary contributions that are often essential to maintaining global biodiversity and conservation knowledge products (Juffe-Bignoli et al., 2016). Such approaches often overlook the indirect costs that are borne by those whom have provided their data for others' use, often at minimal or no cost (Groom et al., 2017). Until recently, papers were cited explicitly, while the data at the core of the research—and those who contributed them—were not. With recent calls for action (Penev et al., 2011; Costello et al., 2013a, 2014), the creation of Digital Object Identifiers (DOIs) for datasets (e.g., through DataCite), the publication of data papers (Chavan and Penev, 2011), and changes in citation policy to include DOIs for both papers and the corresponding data have been increasingly integrated into workflows. For instance, Nature's Scientific Data, Pensoft's Biodiversity Data Journal, and GBIF are among those whom have adopted this approach. In the case of GBIF, DOIs are also minted for each individual data download requested by users based on a particular query, enabling multiple data publishers to be cited in a single reference. This is an important characteristic for online biodiversity and conservation knowledge products that collate and disseminate others' data: citations through DOIs provide data contributors with recognition and the capacity to track others' use of their datasets, and to thereby demonstrate their impact to the institutions they belong to and funders alike (Robertson et al., 2014; Sutter et al., 2015).
Biodiversity and conservation knowledge products must condense complex concepts into targeted and easily digestible summaries that provide timely information that decision-makers require—in other words, they must translate the supporting evidence at the bottom of the ‘4S’ hierarchy pyramid into relevant summaries or decision-support products (Haynes, 2001, 2006; Dicks et al., 2014). Examples of such products include projected scenarios of outcomes of based on the evidence (e.g., AquaMaps' projections for how climate change is expected to alter the relative distributions of fishes; Weatherdon et al., 2015b), screening tools for identifying areas of importance to marine biodiversity (e.g., International Finance Corporation Performance Standard 6 marine “Critical Habitat” screening layer; Martin et al., 2015), or indicators of progress toward national and international biodiversity targets (e.g., indicators based on the IUCN Red List, World Database of Key Biodiversity Areas, and Protected Planet), for instance, which can be used to guide decisions. Value-added products can also help to guide marine biodiversity management priorities: for example, an overlap analysis of global marine species richness, using data from AquaMaps and IUCN's Global Marine Species Assessment, with cumulative human impacts identified priority areas for marine conservation (Selig et al., 2014). Similarly, the Integrated Biodiversity Assessment Tool (IBAT, 2015) for Business (https://www.ibatforbusiness.org/) draws together information from different biodiversity and conservation knowledge products—including the IUCN Red List, Protected Planet's WDPA, and the World Database of Key Biodiversity Areas—to help businesses incorporate biodiversity considerations into key project planning and management decisions (e.g., screening and classifying potential investments; siting operations; reporting on corporate biodiversity performance). On the other hand, Species+ provides a variety of user-driven products to support decision-making, including an integrated document library, data downloads, integration with the CITES Trade Database and Checklist of CITES Species, and web service capabilities through the Species+/CITES Checklist API. These examples improve the accessibility and relevance of scientific knowledge to government officials, scientists, businesses, and non-specialists, increasing the likelihood that the information will be incorporated into decision-making.
The state of being fit-for-purpose does not just allude to data that answer the correct questions at the appropriate scales, but also to a shared lexicon, or alignment between the categories of data and of those used to make decisions. Selection of an appropriate taxonomic reference system, or “taxonomic backbone” (e.g., the Pan-European Species-directories Infrastructure, or PESI, de Jong et al., 2015; Catalog of Life; World Register of Marine Species, Costello et al., 2013b), that provides the structure behind a biodiversity knowledge product is an important consideration in ensuring its interoperability with political processes and reporting requirements. For instance, the taxonomic backbone behind Species+ is based on the standardized taxonomies adopted by CITES and CMS; thus, the taxonomic names used in Species+ align with the taxonomic names used in policy discussions and decisions regarding the statuses of species. On the other hand, AquaMaps works with Integrated Taxonomic Information System (ITIS; www.itis.gov) species codes that are often incompatible with taxonomies used by other online sources. Development of a shared, comprehensive backbone for the world's species is being addressed through a collaboration of key biodiversity institutions convened through GBIF and Catalog of Life (GBIF, 2017c).
Metrics of Use Collated and Reported
Just as biodiversity monitoring is required to track progress toward global targets and to implement adaptive management strategies, so too are metrics necessary to manage and strengthen biodiversity and conservation knowledge products. Data on visits, data downloads, and citations over time can be used to respond to users' requirements, and to determine what works and what does not work. Technologies, such as DOIs, Google Analytics, and traceable “shortlinks” can provide important information on metrics, such as these, and can provide helpful statistics on users' preferences. When cited, DOIs can also be used to track the use of data in subsequent analyses or references in policy and technical documents. For instance, in 2016, UNEP-WCMC analyzed trends in data downloads, user profiles, and common uses of marine data hosted on the Ocean Data Viewer. This report is being used to guide development priorities in 2017, and to strengthen engagement with key audiences. Thus, metrics of use are important for ensuring that biodiversity and conservation knowledge products are tailored to their users' needs.
Likewise, collation and external reporting on metrics of progress toward objectives set within a knowledge product's strategy or business plan are important for demonstrating achievements and sharing a collective vision. In their annual Science Review, GBIF offers a visual overview of the ways in which GBIF-mediated data are used in science, with a complementary Science Review Sourcebook that provides a comprehensive list of the peer-reviewed articles (GBIF, 2016). The review notes that GBIF has been cited as a source of data by more than 1,400 peer-reviewed research publications, and has contributed data to intergovernmental processes, such as the CBD and IPBES. On a shorter time frame, GBIF also produces monthly slides that offer an overview of the latest news and announcements, GBIF participation, and data publication, access and use (GBIF Secretariat, 2016). Likewise, IUCN's Species Survival Commission (SSC) and the Global Species Programme publish an annual report highlighting assessments from the IUCN SSC Specialist Groups, spotlighting high-level interventions, and providing a summary of publications (IUCN, 2015b). OBIS, too, reports on milestones achieved, including contributions to the World Ocean Assessment and the CBD's Ecologically or Biologically Significant Marine Areas process, with a clear vision, mission, and objectives documented on the website (OBIS, 2017). These examples demonstrate to contributors, policy-makers and funders alike the added value brought by these initiatives, encouraging investment.
Discussion
Mapping Linkages between Characteristics
The seven characteristics identified here are closely interconnected, with each supporting the overall capacity of a knowledge product to meet users' requirements (Figure 1). For example, the combination of a policy mandate and user-driven development is instrumental in ensuring that a knowledge product will meet the policy-makers' requirements under specific policy instruments. Published methods with clear quality assurance protocols and comprehensive data coverage increase policy-makers' trust in the data, while a user-friendly online interface that is regularly updated will help to generate increased and returning traffic. Such products require consistent human, technological, and financial capacity to maintain operations and to invest in further improvements and helpful features. The capacity to implement and adapt a clear business plan and long-term strategy, combined with regular feedback provided to those on either side of the science-policy interface, ensures that everyone understands the overarching objectives and requirements of the knowledge product. Thus, these characteristics and the linkages between them should be considered and revisited both in the short- and long-term as the vision for the knowledge product evolves.
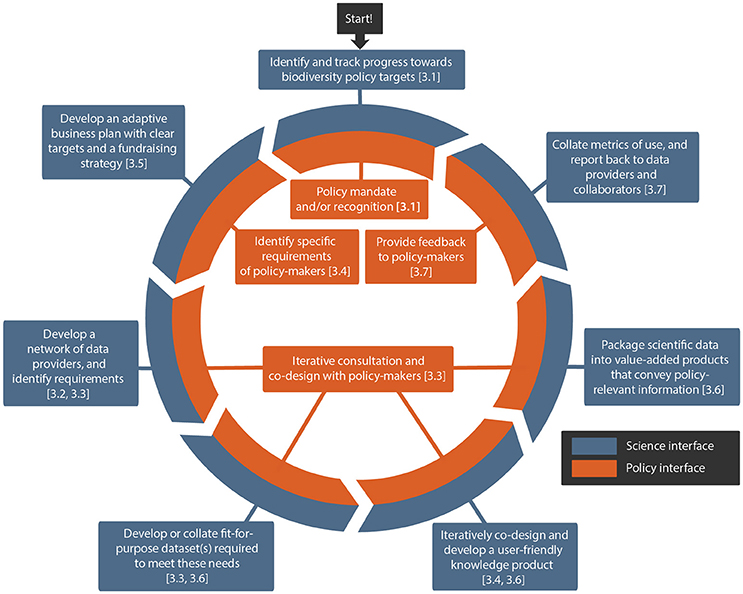
Figure 1. Biodiversity and conservation knowledge product development cycle. A biodiversity and/or conservation knowledge product's development is circular, with ongoing feedback from end users on either side of the science-policy interface and products adapted to meet evolving requirements.
These characteristics do not fully account for many of the technological, financial and scientific requirements for the sustainability of biodiversity and conservation knowledge products, which have been addressed in other reviews (e.g., Berendsohn et al., 2011; Costello et al., 2014; Juffe-Bignoli et al., 2016), and therefore should not be viewed as a definitive list. This preliminary framework is intended as a starting point for supporting biodiversity and conservation knowledge products' in strengthening knowledge exchange across the science-policy interface.
Recommendations for How Policy Can Support Marine Biodiversity and Conservation Knowledge Products
The identified characteristics highlight the considerable upfront and long-term investments required to develop and sustain online biodiversity and conservation knowledge products that serve the needs of policy- and decision-makers in fulfilling commitments under national, regional and global policy instruments, and in conserving biodiversity. As noted, this need for investment is often difficult to reconcile with the provision of open access data, particularly at the time scales required to establish knowledge products with effective workflows. While it is therefore important that requirements for establishing and sustaining effective biodiversity and conservation knowledge products are documented explicitly, policy- and decision-makers should also consider the feasibility of policy targets and the financial, human, and technological requirements for monitoring progress toward these from their inception. This includes developing strategies within the scope of multilateral environmental agreements, and/or public/private partnerships, to provide long-term support to new and existing biodiversity monitoring networks and knowledge products, particularly those of intergovernmental relevance.
While there is considerable overlap between the objectives of multilateral environmental agreements (UNEP-WCMC, 2015) that can be used to streamline data collection and provision, different reporting formats make it challenging to provide multi-purpose data. Therefore, services, such as the Online Reporting System developed by UNEP-WCMC and the Secretariat of the African-Eurasian Waterbird Agreement (UNEP-AEWA) encounter difficulties in defining specific measurements that address the reporting requirements of multiple multilateral environmental agreements. By standardizing reporting formats in the development of multilateral environmental agreements, and possibly streamlining reporting processes (i.e., collect data once, report them several times), policy-makers can support curators of biodiversity and conservation knowledge products in providing access to relevant information.
Critically, ongoing communication between those who curate biodiversity and conservation knowledge products and their end users is necessary to ensure that the product is designed and adapted to meet their evolving needs, yet recognition of technological and capacity constraints is necessary. Knowledge development and exchange is a cyclical, rather than linear, process that requires strong relationships and sufficient, long-term capacity to ensure continued relevance and application at the science-policy interface. Thus, policy- and decision-makers must be willing to engage in knowledge exchange with scientists, providing iterative feedback on their evolving requirements, and must be receptive to the needs of scientists in fulfilling these requirements.
Moving beyond the sustainability and uptake of biodiversity and conservation knowledge products to demonstrated “impact” is yet one step further removed, and is often difficult to evaluate on anything shorter than political, biological or ecological time scales. However, as demonstrated above, there have been instances where increased access to data has led to demonstrable impact: for instance, cetacean density model outputs from OBIS SEAMAP have been used in planning military sonar outputs (Roberts et al., 2016) and have been used by the US Species Act to regulate shipping and oil and gas exploration; the New England Aquarium has also used OBIS-mediated data to detect potential wildlife crime in animal trade (USAID, 2016). Marine knowledge products therefore offer clear benefits for supporting the conservation and sustainable management of marine biodiversity and associated ecosystem services.
Author Contributions
LW led the development of the manuscript and created Figure 1, with support from CM. LW and CM jointly developed the concept for the review, with contributions and feedback on all components of the manuscript received from WA, NB, TB, FD, KD, SF, CG, CH, TH, DJ, KK, NK, KM, ER, KK-R, DR, FW, and TW.
Funding
LW, CM, DR, CG, KK-R, KD, NB, and FW received funding through the “Building the European Biodiversity Observation Network” (EU BON) project (www.eubon.eu), a 7th Framework Programme funded by the European Union under grant agreement No. 308454. FD, SF, KM, and TW contributed through funding provided by the World Conservation Monitoring Centre.
Conflict of Interest Statement
The authors declare that the research was conducted in the absence of any commercial or financial relationships that could be construed as a potential conflict of interest.
Acknowledgments
This is a contribution to the “Building the European Biodiversity Observation Network” (EU BON) project (www.eubon.eu), a 7th Framework Programme funded by the European Union under grant agreement No. 308454. An early version of this paper was originally presented by LW as a poster at the 4th International Marine Conservation Congress in St. John's, Newfoundland (31st July 2016). The authors would also like to acknowledge the Proteus Partnership, the European Commission, the CITES Secretariat, UN Environment, the World Conservation Monitoring Centre, the International Union for Conservation of Nature and the national agencies contributing to GBIF core funds for their financial contributions toward developing and maintaining these knowledge products, and to extend their gratitude to the thousands of individuals and organizations who contribute their expertise and data, often voluntarily, to ensuring that these products continue to provide valuable data and information for decision-making. The authors are also grateful to Jan Legind and the Data Products Team at the GBIF Secretariat, as well as Stuart Butchart, Tris Allinson, Alex Tate, Maria Dias, Carolina Hazin, and Paul Donald of BirdLife International for their assistance with the manuscript.
Supplementary Material
The Supplementary Material for this article can be found online at: http://journal.frontiersin.org/article/10.3389/fmars.2017.00096/full#supplementary-material
References
Appeltans, W., Ahyong, S. T., Anderson, G., Angel, M. V., Artois, T., Bailly, N., et al. (2012). The magnitude of global marine species diversity. Curr. Biol. 22, 2189–2202. doi: 10.1016/j.cub.2012.09.036
Berendsohn, W. G., Güntsch, A., Hoffmann, N., Kohlbecker, A., Luther, K., and Müller, A. (2011). Biodiversity information platforms: from standards to interoperability. ZooKeys 150, 71–87. doi: 10.3897/zookeys.150.2166
Bingham, H., Doudin, M., Despot-Belmonte, K., Weatherdon, L. V., Regan, E. C., Wetzel, F., et al. (2016). Pathways Through the Global Biodiversity Informatics Landscape. Available online at: http://wcmc.io/BiodiversityInformatics
Biodiversity Indicators Partnership (2011). Guidance for National Biodiversity Indicator Development and Use. Cambridge: UNEP-WCMC. 40 Available online at: http://www.bipnational.net/LinkClick.aspx?fileticket=6JNUXXo6xOA%3D&tabid=38&language=en-US
Biodiversity Indicators Partnership (2016). Protected Area Coverage of Key Biodiversity Areas. Available online at: https://www.bipindicators.net/indicators/protected-area-coverage-of-key-biodiversity-areas
BIP Secretariat (2017). Biodiversity Indicators Partnership (online). Available onlie at: https://www.bipindicators.net/
BirdLife International (2017) The World Database of Key Biodiversity Areas. Developed by the Key Biodiversity Areas Partnership. Available online at: http://www.keybiodiversityareas.org
Bisby, F. A. (2000). The quiet revolution: biodiversity informatics and the Internet. Science 289, 2309–2312. doi: 10.1126/science.289.5488.2309
Boero, F. (2015). The future of the Mediterranean Sea Ecosystem: towards a different tomorrow. Rend. Fis. Acc. Lincei. 26, 3–12. doi: 10.1007/s12210-014-0340-y
Bojinski, S., Verstraete, M., Peterson, T. C., Richter, C., Simmons, A., and Zemp, M. (2014). The concept of essential climate variables in support of climate research, applications, and policy. Bull. Am. Meteorol. Soc. 95, 1431–1443. doi: 10.1175/BAMS-D-13-00047.1
Bowles-Newark, N. J., Arnell, A. P., Butchart, S., Chenery, A., Brown, C., and Burgess, N. D. (2014). Incorporating and utilising spatial data and mapping for NBSAPs: Guidance to support NBSAP Practitioners. Cambridge: UNEP-WCMC. 84. Available online at: https://www.unep-wcmc.org/system/dataset_file_fields/files/000/000/209/original/01_IncorporatingSpatialDataandMappingforNBSAPs_Main.pdf?1399971609
Brito, T. (2010). Overcoming the linnean shortfall: data deficiency and biological survey priorities. Basic Appl. Ecol. 11, 709–713. doi: 10.1016/j.baae.2010.09.007
Brooks, T. M., Akçakaya, H. R., Burgess, N. D., Butchart, S. H. M., Hilton-Taylor, C., Hoffmann, M., et al. (2016). Analysing biodiversity and conservation knowledge products to support regional environmental assessments. Sci. Data 3:160007. doi: 10.1038/sdata.2016.7
Brooks, T. M., Butchart, S. H. M., Cox, N. A., Heath, M., Hilton-Taylor, C., Hoffmann, M., et al. (2015). Harnessing biodiversity and conservation knowledge products to track the Aichi Targets and Sustainable Development Goals. Biodiversity 16, 157–174. doi: 10.1080/14888386.2015.1075903
Brooks, T. M., Lamoreux, J. F., and Soberón, J. (2014). IPBES ≠ IPCC. Trends Ecol. Evol. 29, 543–545. doi: 10.1016/j.tree.2014.08.004
Brummitt, N., Regan, E. C., Weatherdon, L. V., Martin, C. S., Geijzendorffer, I. R., Rocchini, D., et al. (in press). Taking stock of nature : essential biodiversity variables explained. Biol. Conserv. doi: 10.1016/j.biocon.2016.09.006
Butchart, S. H., Stattersfield, A. J., Baillie, J., Bennun, L. A., Stuart, S. N., Akçakaya, H. R., et al. (2005). Using Red List Indices to measure progress towards the 2010 target and beyond. Philos. Trans. R. Soc. Lond. B Biol. Sci. 360, 255–268. doi: 10.1098/rstb.2004.1583
Campbell, S., Benita, S., Coates, E., Davies, P., and Penn, G. (2007). Analysis for policy: Evidence-based policy in practice. London: Government Social Research Unit.
CBD Secretariat (2010). Strategic Plan for Biodiversity 2011–2020 (COP 10 Decision X/2). Nagoya. Available online at: https://www.cbd.int/doc/decisions/cop-10/cop-10-dec-02-en.pdf
CBD Secretariat (2014). Global Biodiversity Outlook 4. Montreal. Secretariat of the Convention on Biological Diversity. 155. Available online at: https://www.cbd.int/gbo/gbo4/publication/gbo4-en.pdf
Chavan, V., and Penev, L. (2011). The data paper: a mechanism to incentivize data publishing in biodiversity science. BMC Bioinformatics 12:S2. doi: 10.1186/1471-2105-12-S15-S2
Constable, A. J., Costa, D. P., Schofield, O., Newman, L., Urban, E. R., Fulton, E. A., et al. (2016). Developing priority variables (“ecosystem Essential Ocean Variables”-eEOVs) for observing dynamics and change in Southern Ocean ecosystems. J. Mar. Syst. 161, 26–41. doi: 10.1016/j.jmarsys.2016.05.003
Costello, M. J., Appeltans, W., Bailly, N., Berendsohn, W. G., de Jong, Y., Edwards, M., et al. (2014). Strategies for the sustainability of online open-access biodiversity databases. Biol. Conserv. 173, 155–165. doi: 10.1016/j.biocon.2013.07.042
Costello, M. J., Bouchet, P., Boxshall, G., Fauchald, K., Gordon, D., Hoeksema, B. W., et al. (2013b). Global coordination and standardisation in marine biodiversity through the World Register of Marine Species (WoRMS) and related databases. PLoS ONE 8:e51629. doi: 10.1371/journal.pone.0051629
Costello, M. J., Michener, W. K., Gahegan, M., Zhang, Z.-Q., and Bourne, P. E. (2013a). Biodiversity data should be published, cited, and peer reviewed. Trends Ecol. Evol. 28, 454–461. doi: 10.1016/j.tree.2013.05.002
de Jong, Y., Kouwenberg, J., Boumans, L., Hussey, C., Hyam, R., Nicolson, N., et al. (2015). PESI - a taxonomic backbone for Europe. Biodivers. Data J. 3:e5848. doi: 10.3897/BDJ.3.e5848
Dicks, L. V., Walsh, J. C., and Sutherland, W. J. (2014). Organising evidence for environmental management decisions: a ‘4S’ hierarchy. Trends Ecol. Evol. 29, 607–613. doi: 10.1016/j.tree.2014.09.004
Diniz-Filho, J. A., Loyola, R. D., Raia, P., Mooers, A. O., and Bini, L. M. (2013). Darwinian shortfalls in biodiversity conservation. Trends Ecol. Evol. 28, 689–695. doi: 10.1016/j.tree.2013.09.003
Dudley, N. (ed.). (2008). Guidelines for Applying Protected Area Management Categories. Gland: International Union for Conservation of Nature. 86. Available online at: https://www.iucn.org/sites/dev/files/import/downloads/iucn_assignment_1.pdf
Dudley, N., Boucher, J. L., Cuttelod, A., Brooks, T. M., and Langhammer, P. F. (2015). Applications of Key Biodiversity Areas: End-User Consultations. Gland: IUCN. Available online: https://portals.iucn.org/library/sites/library/files/documents/2014-051.pdf
Edgar, G. J., Stuart-Smith, R. D., Willis, T. J., Kininmonth, S., Baker, S. C., Banks, S., et al. (2014). Global conservation outcomes depend on marine protected areas with five key features. Nature 506, 216–220. doi: 10.1038/nature13022
Fegraus, E. H., Andelman, S. J., Jones, M. B., and Schildhauer, M. (2005). Maximizing the value of ecological data with structured metadata: an introduction to Ecological Metadata Language (EML) and principles for metadata creation. Bull. Ecol. Soc. Ame. 86, 158–168. doi: 10.1890/0012-9623(2005)86[158:MTVOED]2.0.CO;2
Gaiji, S., Chavan, V., Ariño, A. H., Otegui, J., Hobern, D., Sood, R., et al. (2013). Content assessment of the primary biodiversity data published through GBIF network: status, challenges and potentials. Biodiversity Inform. 8, 94–172. doi: 10.17161/bi.v8i2.4124
GBIF (2016). GBIF Science Review 2016. Copenhagen. Available online at: http://www.gbif.org/resource/82873
GBIF (2017a). Global Biodiversity Information Facility. Available online at: http://www.gbif.org (Accessed January 27, 2017).
GBIF (2017b). Global data trends: Trends in data availability on the GBIF network, 2008 to 2017. Available online at: http://www.gbif.org/analytics/global
GBIF (2017c). GBIF Implementation Plan 2017–2021 and Annual Work Programme 2017. Copenhagen. Available online at: http://www.gbif.org/resource/83029
GBIF Secretariat (2016). GBIF monthly slides - June 2016. 21 Slides. Available online at: http://www.gbif.org/resource/81771
Geijzendorffer, I. R., Regan, E. C., Pereira, H. M., Brotons, L., Brummitt, N., Gavish, Y., et al. (2015). Bridging the gap between biodiversity data and policy reporting needs: an essential biodiversity variables perspective. J. Appl. Ecol. 53, 1341–1350. doi: 10.1111/1365-2664.12417
Groom, Q., Weatherdon, L., and Geijzendorffer, I. R. (2017). Is citizen science an open science in the case of biodiversity observations? J. Appl. Ecol. 54, 612–617. doi: 10.1111/1365-2664.12767
Halpern, B. S., Longo, C., Hardy, D., McLeod, K. L., Samhouri, J. F., Katona, S. K., et al. (2012). An index to assess the health and benefits of the global ocean. Nature 488, 615–620. doi: 10.1038/nature11397
Halpern, B. S., Longo, C., Lowndes, J. S., Best, B. D., Frazier, M., Katona, S. K., et al. (2015). Patterns and emerging trends in global ocean health. PLoS ONE 10:e0117863. doi: 10.1371/journal.pone.0117863
Haynes, R. B. (2001). Of studies, summaries, synopses, and systems: the “4S” evolution of services for finding current best evidence. Evid. Based Med. 6, 36–38. doi: 10.1136/ebm.6.2.36
Haynes, R. B. (2006). Of studies, syntheses, synopses, summaries, and systems: the “5S” evolution of information services for evidence-based healthcare decisions. Evid. Based Med. 11, 162–164. doi: 10.1136/ebm.11.6.162-a
Hobern, D., Apostolico, A., Arnaud, E., Bello, J. C., Canhos, D., Dubois, G., et al. (2013). Global Biodiversity Informatics Outlook: Delivering Biodiversity Knowledge in the Information Age. Copenhagen: GBIF Secretariat.
IBAT (2015). Integrated Biodiversity Assessment Tool. Provided by BirdLife International, Conservation International, IUCN and UNEP-WCMC. Washington, DC: IBAT. Available online at: https://www.ibatforbusiness.org/
IUCN (2012). The IUCN Red List of Threatened Species Brochure. Gland, Switzerland: International Union for Conservation of Nature. Available online at: http://cmsdocs.s3.amazonaws.com/IUCN_Red_List_Brochure_2014_LOW.PDF
IUCN (2015a). The IUCN Red List Terms and Conditions of Use (version 2.1). Gland: IUCN. Available online at: http://www.iucnredlist.org/info/terms-of-use
IUCN (2015b). 2014 Annual Report of the Species Survival Commission and the Global Species Programme. Gland: International Union for Conservation of Nature. 212.
IUCN (2016a). The IUCN Red List of Threatened Species. Available online at: www.iucnredlist.org (Accessed January 1, 2016).
IUCN (2016b) A global standard for the identification of Key Biodiversity Areas: Version 1.0. Gland: IUCN. Available online at: https://portals.iucn.org/library/node/46259 (Accessed January 1, 2016).
IUCN (2017a). Overview of The IUCN Red List. Available online at: http://www.iucnredlist.org/about/overview (Accessed January 15, 2017).
IUCN (2017b). The IUCN Red List Status. Available online: http://www.iucnredlist.org/initiatives/mammals/analysis/red-list-status (Accessed January 31, 2017).
IUCN UNEP-WCMC (2017a). The World Database on Protected Areas (WDPA) [On-line]. Cambridge: UNEP-WCMC. Available online at: www.protectedplanet.net (Accessed January 1, 2017).
IUCN UNEP-WCMC (2017b). About Protected Planet (online). Cambridge: UNEP-WCMC. Available online at: https://www.protectedplanet.net/c/about (Accessed January 15, 2017).
IUCN Red List Committee (2013). The IUCN Red List of Threatened SpeciesTM: Strategic Plan 2013–2020. Version 1.0. Available online at: http://cmsdocs.s3.amazonaws.com/IUCN_Red_List_Brochure_2014_LOW.PDF
IUCN Species Survival Commission (2012). IUCN Red List Categories and Criteria: Version 3.1. 2nd Edn. Gland; Cambridge.
Juffe-Bignoli, D., Brooks, T. M., Butchart, S. H. M., Jenkins, R. B., Boe, K., Hoffmann, M., et al. (2016). Assessing the cost of global biodiversity and conservation knowledge. PLoS ONE 11:e0160640. doi: 10.1371/journal.pone.0160640
Kaschner, K., Kesner-Reyes, K., Garilao, C., Rius-Barile, J., Rees, T., and Froese, R. (2016). AquaMaps: Predicted Range Maps for Aquatic Species. Available online at: www.aquamaps.orgVersion 08/2016
Kesner-Reyes, K., Kaschner, K., Kullander, S., Garilao, C., Baril, J., and Froese, R. (2012). AquaMaps: Algorithm and Data Sources for Aquatic Organisms. FishBase. Available online at: www.fishbase.org, version.
Kujala, S. (2003). User involvement: a review of the benefits and challenges. Behav. Inf. Technol. 22, 1–16. doi: 10.1080/01449290301782
Lindstrom, E., Gunn, J., Fischer, A., McCurdy, A., Glover, L. K., and Members, T. T. (2012). A Framework for Ocean Observing. By Task Team an Integr. Framew. Sustain. Ocean Obs. UNESCO 2012, IOC/INF-1284, 1–28. doi: 10.5270/oceanobs09-foo
Mace, G. M., Collar, N. J., Gaston, K. J., Hilton-Taylor, C., Akçakaya, H. R., Leader-Williams, N., et al. (2008). Quantification of extinction risk: IUCN's system for classifying threatened species. Conserv. Biol. 22, 1424–1442. doi: 10.1111/j.1523-1739.2008.01044.x
Martin, C. S., Tolley, M. J., Farmer, E., Mcowen, C. J., Geffert, J. L., Scharlemann, J. P. W., et al. (2015). A global map to aid the identification and screening of critical habitat for marine industries. Mar. Policy 53, 45–53. doi: 10.1016/j.marpol.2014.11.007
McCarthy, D. P., Donald, P. F., Scharlemann, J. P. W., Buchanan, G. M., Balmford, A., Green, J. M. H., et al. (2012). Financial costs of meeting global biodiversity conservation targets: current spending and unmet needs. Science 338, 946–949. doi: 10.1126/science.1229803
McCauley, D. J., Pinsky, M. L., Palumbi, S. R., Estes, J. A., Joyce, F. H., and Warner, R. R. (2015). Marine defaunation: animal loss in the global ocean. Science 347:1255641. doi: 10.1126/science.1255641
McInerny, G. J., Chen, M., Freeman, R., Gavaghan, D., Meyer, M., Rowland, F., et al. (2014). Information visualisation for science and policy: engaging users and avoiding bias. Trends Ecol. Evol. 29, 148–157. doi: 10.1016/j.tree.2014.01.003
McOwen, C. J., Ivory, S., Dixon, M. J. R., Regan, E. C., Obrecht, A., Tittensor, D. P., et al. (2016). Sufficiency and suitability of global biodiversity indicators for monitoring progress to 2020 targets. Conserv. Lett. 9, 489–494. doi: 10.1111/conl.12329
Meyer, C., Kreft, H., Guralnick, R., and Jetz, W. (2015). Global priorities for an effective information basis of biodiversity distributions. Nat. Commun. 6:8221. doi: 10.1038/ncomms9221
Milam, A. N., Kenney, S., Juffe-Bignoli, D., Bertzky, B., Corrigan, C., MacSharry, B., et al. (2016). “Maintaining a global data set on protected areas,” in Protected Areas: Are They Safeguarding Biodiversity? eds L. Joppa, J. Baillie, and J. Robinson (Chichester: John Wiley & Sons, Ltd.), 81–102.
Mora, C., Tittensor, D. P., Adl, S., Simpson, A. G., and Worm, B. (2011). How many species are there on earth and in the ocean? PLoS Biol. 9:e1001127. doi: 10.1371/journal.pbio.1001127
Newbold, T., Hudson, L. N., Hill, S. L. L., Contu, S., Lysenko, I., Senior, R. A., et al. (2015). Global effects of land use on local terrestrial biodiversity. Nature 520, 45–50. doi: 10.1038/nature14324
Nicholson, E., Collen, B., Barausse, A., Blanchard, J. L., Costelloe, B. T., Sullivan, K. M. E., et al. (2012). Making robust policy decisions using global biodiversity indicators. PLoS ONE 7:e41128. doi: 10.1371/journal.pone.0041128
OBIS (2017). Ocean Biogeographic Information System. Intergovernmental Oceanographic Commission of UNESCO. Available online at: www.iobis.org; http://www.iobis.org/about/
Parker, C., and Sinclair, M. (2001). User-centred design does make a difference: the case of decision support systems in crop production. Behav. Inform. Technol. 20, 449–460. doi: 10.1080/01449290110089570
Penev, L., Mietchen, D., Chavan, V., Hagedorn, G., Remsen, D., Smith, V., et al. (2011). Pensoft Data Publishing Policies and Guidelines for Biodiversity Data. Pensoft Publishers. Available online at: http://pensoft.net/J_FILES/Pensoft_Data_Publishing_Policies_and_Guidelines.pdf
Pereira, H. M., Ferrier, S., Walters, M., Geller, G. N., Jongman, R. H., Scholes, R. J., et al. (2013). Essential biodiversity variables. Science 339, 277–278. doi: 10.1126/science.1229931
Probst, W. N., Rau, A., and Oesterwind, D. (2016). A proposal for restructuring Descriptor 3 of the Marine Strategy Framework Directive (MSFD). Mar. Policy 74, 128–135. doi: 10.1016/j.marpol.2016.09.026
Proença, V., Martin, L. J., Pereira, H. M., Fernandez, M., McRae, L., Belnap, J., et al. (in press). Global biodiversity monitoring: from data sources to essential biodiversity variables. Biol. Conserv. doi: 10.1016/j.biocon.2016.07.014
Ready, J., Kaschner, K., South, A. B., Eastwood, P. D., Rees, T., Rius, J., et al. (2010). Predicting the distributions of marine organisms at the global scale. Ecol. Modell. 221, 467–478. doi: 10.1016/j.ecolmodel.2009.10.025
Roberts, J. J., Best, B. D., Mannocci, L., Fujioka, E., Halpin, P. N., Palka, D. L., et al. (2016). Habitat-based cetacean density models for the U.S. Atlantic and Gulf of Mexico. Sci. Rep. 6:22615. doi: 10.1038/srep22615
Robertson, T., Döring, M., Guralnick, R., Bloom, D., Wieczorek, J., Braak, K., et al. (2014). The GBIF integrated publishing toolkit: facilitating the efficient publishing of biodiversity data on the internet. PLoS ONE 9:e102623. doi: 10.1371/journal.pone.0102623
Rose, D. C., Brotherton, P. N. M., Owens, S., and Pryke, T. (2016b). Honest advocacy for nature: presenting a persuasive narrative for conservation. Biodiversity Conserv. 1–21. doi: 10.1007/s10531-016-1163-1
Rose, D. C., Sutherland, W. J., Parker, C., Lobley, M., Winter, M., Morris, C., et al. (2016a). Decision support tools for agriculture: towards effective design and delivery. Agric. Syst. 149, 165–174. doi: 10.1016/j.agsy.2016.09.009
Royal Society (2003). Measuring Biodiversity for Conservation. Policy Document 11/03. London. 65. Available online at: https://royalsociety.org/~/media/Royal_Society_Content/policy/publications/2003/4294967955.pdf
Runnel, V., Wetzel, F. T., Groom, Q. J., Koch, W., Peer, I., Valland, N., et al. (2016). Summary report and strategy recommendations for EU citizen science gateway for biodiversity data. Res. Ideas Outcomes 2:e11563. doi: 10.3897/rio.2.e11563
Scholes, R. J., Walters, M., Turak, E., Saarenmaa, H., Heip, C. H. R., Tuama, É. Ó., et al. (2012). Building a global observing system for biodiversity. Curr. Opin. Environ. Sustainability 4, 139–146. doi: 10.1016/j.cosust.2011.12.005
Selig, E. R., Turner, W. R., Troëng, S., Wallace, B. P., Halpern, B. S., Kaschner, K., et al. (2014). Global priorities for marine biodiversity conservation. PLoS ONE 9:e82898. doi: 10.1371/journal.pone.0082898
Smart, J., Hilton-Taylor, C., and Mittermeier, R. (2014). The IUCN Red List: 50 Years of Conservation. Mexico City: CEMEX.
Stephenson, P. J., Bowles-Newark, N., Regan, E., Stanwell-Smith, D., Diagana, M., Höft, R., et al. (in press). Unblocking the flow of biodiversity data for decision-making in Africa. Biol. Conserv. doi: 10.1016/j.biocon.2016.09.003
Stephenson, P. J., Burgess, N. D., Jungmann, L., Loh, J., O'Connor, S., Oldfield, T., et al. (2015). Overcoming the challenges to conservation monitoring: integrating data from in-situ reporting and global data sets to measure impact and performance. Biodiversity 16, 68–85. doi: 10.1080/14888386.2015.1070373
Strydom, W. F., Funke, N., Nienaber, S., Nortje, K., and Steyn, M. (2010). Evidence-based policymaking: a review. S Afr. J. Sci. 106:8. Available online at: http://www.scielo.org.za/scielo.php?script=sci_arttext&pid=S0038-23532010000300010&lng=en&nrm=iso
Sutter, R. D., Wainscott, S. B., Boetsch, J. R., Palmer, C. J., and Rugg, D. J. (2015). Practical guidance for integrating data management into long-term ecological monitoring projects. Wildl. Soc. Bull. 39, 451–463. doi: 10.1002/wsb.548
SkyTruth, Oceana, Google (2017). Global Fishing Watch. Available online at: http://globalfishingwatch.org/
The Nature Conservancy (2016). Mapping Ocean Wealth. Available online at: www.oceanwealth.org
Theobald, E. J., Ettinger, A. K., Burgess, H. K., DeBey, L. B., Schmidt, N. R., Froehlich, H. E., et al. (2015). Global change and local solutions: Tapping the unrealized potential of citizen science for biodiversity research. Biol. Conserv. 181, 236–244. doi: 10.1016/j.biocon.2014.10.021
Tinch, R., Balian, E., Carss, D., de Blas, D. E., Geamana, N. A., Heink, U., et al. (2016). Science-policy interfaces for biodiversity: dynamic learning environments for successful impact. 1–24. Biodivers. Conserv. doi: 10.1007/s10531-016-1155-1
Tittensor, D. P., Walpole, M., Hill, S. L. L., Boyce, D. G., Britten, G. L., Burgess, N. D., et al. (2014). A mid-term analysis of progress toward international biodiversity targets. Science 346, 241–244. doi: 10.1126/science.1257484
Turner, W., Rondinini, C., Pettorelli, N., Mora, B., Leidner, A. K., Szantoi, Z., et al. (2015). Free and open-access satellite data are key to biodiversity conservation. Biol. Conserv. 182:173–176. doi: 10.1016/j.biocon.2014.11.048
Turnhout, E., Bloomfield, B., Hulme, M., Vogel, J., and Wynne, B. (2012). Listen to the voices of experience. Nature 488, 454–455. doi: 10.1038/488454a
UNDP (2009). Handbook on Planning, Monitoring and Evaluating for Development Results. New York, NY. Available online at: http://web.undp.org/evaluation/evaluations/handbook/english/documents/pme-handbook.pdf
UNEP (2017). The Species+ Website. Nairobi; Cambridge: Compiled by UNEP-WCMC. Available online at: www.speciesplus.net (Accessed January 25, 2017).
UNEP-WCMC (2015). Mapping Multilateral Environmental Agreements to the Aichi Biodiversity Targets. Cambridge: UNEP-WCMC. Available online at: http://wcmc.io/MEA-Aichi_Target_mapping
UNEP-WCMC (2016a). World Database on Protected Areas User Manual 1.4. Cambridge. Available online at: www.protectedplanet.net
UNEP-WCMC (2016b). Ocean Data Viewer [On-line]. Cambridge: UNEP-WCMC. Available online at: http://data.unep-wcmc.org
United Nations (2015). Transforming our world: the 2030 Agenda for Sustainable Development (A/RES/70/1). New York, NY. Available online at: http://www.un.org/ga/search/view_doc.asp?symbol=A/RES/70/1&Lang=E
USAID (2016). Wildlife Crime Tech Challenge: New England Aquarium is Tackling Wildlife Trafficking at Ports [Video]. Available online at: https://www.youtube.com/watch?v=qlX1cIg8XlA&feature=youtu.be
Walpole, M., Almond, R. E., Besançon, C., Butchart, S. H. M., Campbell-Lendrum, D., Carr, G. M., et al. (2009). Tracking progress toward the 2010 biodiversity target and beyond. Science 325, 1503–504. doi: 10.1126/science.1175466
Walpole, M., McGeoch, M. A., Bubb, P., and Brummitt, N. (2017). “Using Data for Decision-Making: From Observations to Indicators and Other Policy Tools,” in The GEO Handbook on Biodiversity Observation Networks. eds M. Walters, and R. J. Scholes (Cham: Springer International Publishing), 293–308.
Ward-Paige, C. A., and Lotze, H. K. (2011). Assessing the value of recreational divers for censusing elasmobranchs. PLoS ONE 6:e25609. doi: 10.1371/journal.pone.0025609
Ward-Paige, C. A., Pattengill-Semmens, C., Myers, R. A., and Lotze, H. K. (2011). Spatial and temporal trends in yellow stingray abundance: evidence from diver surveys. Environ. Biol. Fishes 90, 263–276. doi: 10.1007/s10641-010-9739-1
Weatherdon, L. V., Fletcher, R., Jones, M. C., Kaschner, K., Sullivan, E., Tittensor, D. P., et al. (2015a). Manual of Marine and Coastal Datasets of Biodiversity Importance. December 2015 Edition. Cambridge: UNEP World Conservation Monitoring Centre. 30.
Weatherdon, L. V., Garilao, C., and Kesner-Reyes, K. (2015b). What May Happen to Bony Fishes in the North Sea. An Infographic Based on AquaMaps. Vol. 413. The Parliament Magazine. Available online at: http://wcmc.io/TPM-413; http://wcmc.io/North-Sea
Webb, T. J., Vanden Berghe, E., and O'Dor, R. (2010). Biodiversity's big wet secret: the global distribution of marine biological records reveals chronic under-exploration of the deep pelagic ocean. PLoS ONE 5:e10223. doi: 10.1371/journal.pone.0010223
Wetzel, F. T., Saarenmaa, H., Regan, E., Martin, C. S., Mergen, P., Smirnova, L., et al. (2015). The roles and contributions of Biodiversity Observation Networks (BONs) in better tracking progress to 2020 biodiversity targets: a European case study. Biodiversity 16, 137–149. doi: 10.1080/14888386.2015.1075902
Wieczorek, J., Bloom, D., Guralnick, R., Blum, S., Döring, M., Giovanni, R., et al. (2012). Darwin core: an evolving community-developed biodiversity data standard. PLoS ONE 7:e29715. doi: 10.1371/journal.pone.0029715
WoRMS Editorial Board (2017). World Register of Marine Species. Available online at: //www.marinespecies.org at VLIZ. (Accessed January 20, 2017).
Wu, R. (2016). China's ecosystems: focus on biodiversity. Science 353:657. doi: 10.1126/science.aah3994
Wu, R., Long, Y., Malanson, G. P., Garber, P. A., Zhang, S., Li, D., et al. (2014). Optimized spatial priorities for biodiversity conservation in China: a systematic conservation planning perspective. PLoS ONE 9:e103783. doi: 10.1371/journal.pone.0103783
WWF (2016). Living Planet Report 2016. Risk and resilience in a new era. Gland: WWF, International. 74. Available online at: http://awsassets.panda.org/downloads/lpr_living_planet_report_2016.pdf
Keywords: science-policy interface, marine policy, knowledge exchange, biodiversity informatics, knowledge products, evidence-based conservation
Citation: Weatherdon LV, Appeltans W, Bowles-Newark N, Brooks TM, Davis FE, Despot-Belmonte K, Fletcher S, Garilao C, Hilton-Taylor C, Hirsch T, Juffe-Bignoli D, Kaschner K, Kingston N, Malsch K, Regan EC, Kesner-Reyes K, Rose DC, Wetzel FT, Wilkinson T and Martin CS (2017) Blueprints of Effective Biodiversity and Conservation Knowledge Products That Support Marine Policy. Front. Mar. Sci. 4:96. doi: 10.3389/fmars.2017.00096
Received: 09 February 2017; Accepted: 22 March 2017;
Published: 07 April 2017.
Edited by:
Thomas P. Good, NOAA Fisheries, USAReviewed by:
Edward Jeremy Hind-Ozan, Manchester Metropolitan University, UKDanielle Kreb, RASI Conservation Foundation, Indonesia
Copyright © 2017 Weatherdon, Appeltans, Bowles-Newark, Brooks, Davis, Despot-Belmonte, Fletcher, Garilao, Hilton-Taylor, Hirsch, Juffe-Bignoli, Kaschner, Kingston, Malsch, Regan, Kesner-Reyes, Rose, Wetzel, Wilkinson and Martin. This is an open-access article distributed under the terms of the Creative Commons Attribution License (CC BY). The use, distribution or reproduction in other forums is permitted, provided the original author(s) or licensor are credited and that the original publication in this journal is cited, in accordance with accepted academic practice. No use, distribution or reproduction is permitted which does not comply with these terms.
*Correspondence: Lauren V. Weatherdon, bGF1cmVuLndlYXRoZXJkb25AdW5lcC13Y21jLm9yZw==