 Emilie Novaczek
 Victoria Howse
 Christina Pretty
 Rodolphe Devillers
 Evan Edinger
 Alison Copeland4
- 1Marine Geomatics Research Lab, Department of Geography, Memorial University of Newfoundland, St. John's, NL, Canada
- 2Centre for Fisheries and Ecosystem Research, Fisheries and Marine Institute of Memorial University of Newfoundland, St. John's, NL, Canada
- 3Marine Habitat Mapping Group, Departments of Geography and Biology, Memorial University of Newfoundland, St. John's, NL, Canada
- 4Department of Environment and Natural Resources, Government of Bermuda, Flatts, Bermuda
Over 5,000 marine protected areas (MPAs) exist around the world. Most are small (median size of ~2 km2) and designed primarily for the conservation of a single flagship species. Internationally, there is an increasing focus on ecologically representative conservation; however the contribution of these small MPAs to the protection of regional biodiversity is often unknown. This paper presents a benthic habitat mapping exercise and reports on measures of biodiversity in the Eastport MPA and the nearby area of Newman Sound in Eastern Canada. The Eastport MPA is a 2.1 km2 no-take reserve designated in 2005, based on a voluntary fishery closure implemented by the local community in 1997. The primary goal of the Eastport MPA is to protect and sustain the American lobster (Homarus americanus) population, supporting a local commercial fishery. Benthic habitats were characterized and mapped using multibeam echosounder data and seafloor videos. Three statistically distinct benthic habitats were identified within the boundaries of the MPA: “shallow rocky,” “sand and cobble,” and “sand.” The distribution of species is primarily driven by depth and substrate type. The shallow rocky habitat (48% of the study area) contains complex bedrock and boulder features with high macroalgal cover. These characteristics are associated with juvenile and adult American lobster habitat. However, comparison of the MPA habitats to the surrounding Newman Sound area indicate that this small MPA contributes little to the conservation of the regional marine biodiversity. We recommend that adaptive management mechanisms be used to review such MPAs and expand them to better protect ecosystems representative of their regions.
Introduction
Marine protected areas (MPAs) are spatial management tools that can help sustain or increase marine biodiversity, species abundance and biomass, promote regrowth of marine vegetation, and conserve the integrity of sensitive habitats (Lester et al., 2009; Green et al., 2014; McLaren et al., 2015). Not all MPAs are effective at meeting their goals and meaningful measurement of what constitutes adequate conservation of a species, habitat, or ecosystem remains a challenge. While there is no universal formula for ensuring MPA success (Moussaoui and Auger, 2015), size of the protected area is an important factor (Claudet et al., 2008; Edgar et al., 2014). In a global study of 87 MPAs, Edgar et al. (2014) identified five characteristics, called “NEOLI,” that are shared by successful MPAs: No take, well Enforced, Old (>10 years), Large (>100 km2), and Isolated. While large and isolated MPAs are increasing in popularity (Leenhardt et al., 2013), most of the world's 5,000+ MPAs are small, with a median size around 2 km2 (IUCN UNEP-WCMC, 2016). In some contexts, small MPAs have been shown to provide significant increases in species biomass and abundance, depending on the species they protect and the nature of the relevant threats (Hamilton et al., 2011; Batista et al., 2015; McLaren et al., 2015). Size recommendations made throughout the MPA literature are summarized by Green et al. (2014). For MPAs designed to conserve biodiversity and support climate change resilience, moderate to large sizes (4–20 km across) are thought to be most effective. However, if the goal of the MPA is primarily to support fisheries, small reserves (0.5–1 km across) may be sufficient (Green et al., 2014). Identifying the optimal size of an MPA can be a complex challenge, as it depends on many factors: management goals, species distribution and life traits, and threat type, among others. To explore the contribution of a small MPA to regional biodiversity, this study examines the Canadian Eastport MPA, which possesses three of the five NOELI characteristics (i.e., no take, well-enforced, old) and is representative of the global median MPA size.
The Eastport MPA is one of the two existing Canadian federal MPAs in the Canadian province of Newfoundland and Labrador. Covering a total of 2.1 km2, the two protected areas (Duck Island and Round Island) were first proposed as no-fishing zones in 1997 by the local fishing community before becoming an MPA under Canada's Oceans Act in 2005. Like many early Canadian protected areas (Roff and Evans, 2002), the Eastport MPA was designed with a focal species in mind; in this case, the American lobster. In 2014, Fisheries and Oceans Canada (DFO) reported that the Atlantic Canadian lobster fishery was valued at $942 million Canadian dollars, making it the most valuable fishery in Canada that year (DFO, 2016a). Although the Newfoundland lobster fishery is not as profitable as the other Atlantic provinces, it has been a consistent fishery in terms of both value and weight of landings for the last 20 years (DFO, 2016a). At the time of their creation, the Eastport fishery closures aimed to ensure a sustainable American lobster fishery in the region after the cod collapse shook the island of Newfoundland (FRCC, 1995).
Although Eastport is now an MPA, it could have arguably reached similar objectives if it remained a fisheries the reserve mainly focuses on sustaining the commercially exploited lobster population. A fisheries closure is defined in the Canadian Fisheries Act as a provision to regulate human fishing of commercial species (Jamieson and Lessard, 2001). Marine Protected Areas have a different, broader set of goals. MPAs are defined in the Canadian Oceans Act as areas designated for the conservation of commercial and non-commercial fishery resources and their habitats; threatened and endangered species and their habitats; unique habitats; areas of high biodiversity or biological productivity; and/or any other marine resources or habitat at the discretion of the minister (Government of Canada, 1996). Delineation of the Eastport MPA was originally informed by reports of high lobster catches, but no detailed habitat mapping or assessment of biodiversity was incorporated into the original implementation of the closures. The difference in management goals for fisheries closures and MPAs manifests in different priorities and decisions regarding the size of the protected area (as discussed above), as well as placement, enforcement and how success is defined for the MPA. When the Eastport closures were legally established as an MPA in 2005, conservation of threatened wolffish (Anarhichas denticulatus and A. minor) was incorporated into the management plan. No alterations were made to the MPA boundaries at that time and no evidence existed that this area was of importance for those species prior to their inclusion in the management plan (DFO, 2013). As Roff and Evans (2002) note, a conservation strategy developed for a flagship or focal species may have advantages, including facilitation of public outreach and easily measurable management goals, however it is crucial that managers examine the relationship between the focal species and conservation of representative habitats and biodiversity.
As a signatory to the Convention on Biological Diversity, Canada has committed to protect at least 10% of coastal and marine waters by 2020 through ecologically representative and well-connected area-based conservation measures (Aichi Target 11; CBD-UNEP, 2010). To meet this commitment, the Canadian Government is currently working to implement an MPA Network, paired with the assessment of other area-based management measures to determine how existing efforts, like fisheries closures, are contributing to biodiversity conservation (DFO, 2011, 2016b). As more nations move toward the implementation of marine conservation networks, understanding the contribution of existing small MPAs and fishery closures to broader conservation goals could help better integrate those areas into resilient MPA networks.
MPAs, like other spatial management tools, require knowledge of the biotic and abiotic environments being managed. Seafloor maps can provide valuable data to quantify and monitor ecological changes and offer baseline data for MPA development and monitoring (Young and Carr, 2015). In addition to water depth, bathymetric maps can provide high resolution estimates of seabed rugosity, slope, curvature, and other bathymetric derivatives that are often crucial when describing or modeling species distributions (Kaplan et al., 2010). Protection of diverse habitats in turn protects greater biodiversity, and provides benefits to surrounding fisheries (Gaines et al., 2010). This paper reports on a benthic habitat mapping exercise in the small no-take MPA of Eastport, Newfoundland, combined with a comparison of species and habitat diversities between the MPA and its region. Mapping benthic habitats to better understand what is protected, what is left to protect, and which strategies have been successful in the past will help inform the MPA network planning process and contribute to the other goals and objectives highlighted by the Convention on Biological Diversity.
Methods
Study Area
The Eastport MPA is located in the Newman Sound region of Bonavista Bay, on the northeast coast of the island of Newfoundland in Eastern Canada (Figure 1). Bonavista Bay is an area of diverse geomorphology, with extensive narrow sounds, sheltered fjords, shallow sills, low relief bays, and islands (Cumming et al., 1992; Anderson et al., 2002). The nearby Terra Nova National Park (400 km2) and Terra Nova Migratory Bird Sanctuary protect the coastline and adjacent terrestrial environments (Charest et al., 2000; Environment Climate Change Canada, 2016). Newman Sound has been intensively studied, primarily for its eelgrass (Zostera marina) beds (with patches up to 80 m2) that are known to provide refuge and nursery grounds for several fish species, specifically juvenile Atlantic cod, Gadus morhua (Cote et al., 2004; Gorman et al., 2009; Rao et al., 2014).
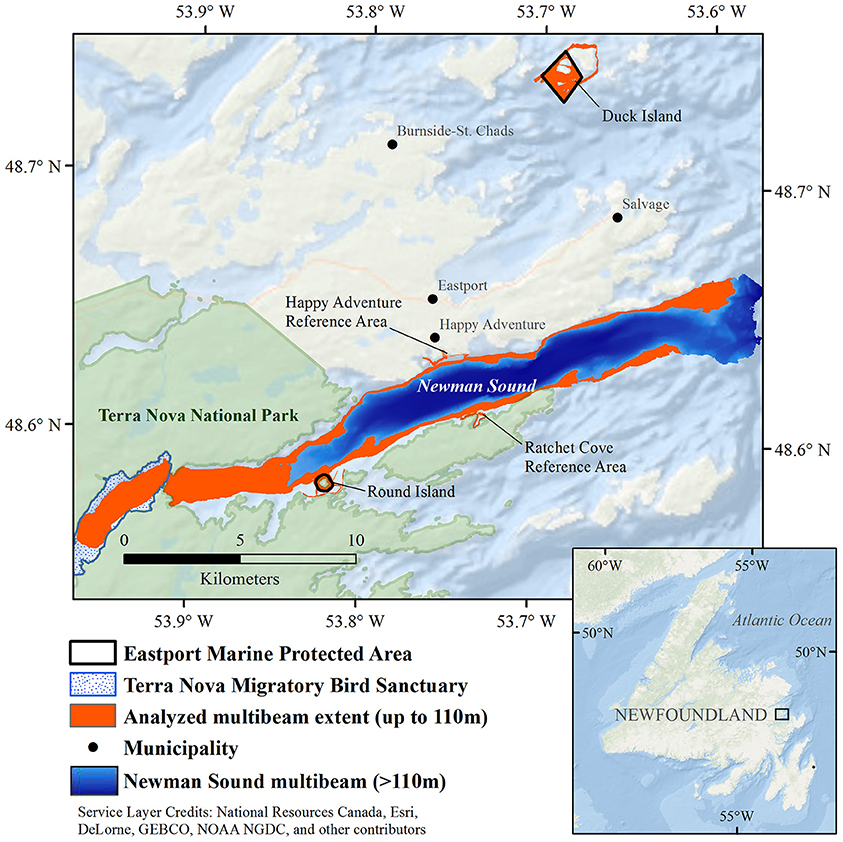
Figure 1. Newman Sound and the Eastport Marine Protected Area closures, Bonavista Bay, Newfoundland.
Bathymetric Survey
High resolution bathymetric data were collected in the two Eastport MPA closures and DFO reference areas (Figure 1) between April 26–May 11, 2015, using an R2Sonic 2024 multibeam echosounder (200–400 kHz) installed on an International Submarine Engineering (ISE) Explorer Autonomous Underwater Vehicle (AUV). AUV position was recorded by a Sound Ocean Systems Inc. GPSR-X015G Differential Global Positioning System fed into an iXBlue PHINS fiber optic gyroscope inertial navigation system. Sound velocity profiles (SVP) were collected using a SonTek Castaway CTD (connectivity, temperature, and depth sensor) for the Round Island closure and a Seabird Electronics (SBE) 19plus CTD for the Duck Island closure. Tidal data, obtained from the Canadian Hydrographic Service, were used along with the SVP for post-processing the multibeam data in the CARIS HIPS & SIPS v9.0 hydrographic data processing software, in order to generate 2 m resolution bathymetric surfaces for the two MPA closures and reference areas.
The Eastport multibeam data, and subsequent substrate and habitat classifications, were also compared to the best available habitat data for the surrounding area. Multibeam data were collected in Newman Sound (see Figure 1) by the Canadian Hydrographic Service in 2002. Data were collected using a vessel-mounted Simrad EM 3000 multibeam echosounder. Multibeam bathymetric and backscatter data from this survey were processed by the Geological Survey of Canada. Raw bathymetric data were manually cleaned using CARIS HIPS & SIPS and were gridded at a resolution of 10 m using Geographic Resources Analysis Support System (GRASS). Newman Sound multibeam data collected within the depth range of the Eastport MPA closures (<110 m) were extracted from this dataset using ArcGIS 10.2.
Seafloor Video
A depth-stratified, randomly distributed seafloor video survey was conducted from June 21 to 27, 2015, within the boundaries of the Eastport MPA and reference areas (N = 87). Benthic video transects were recorded on a custom drop camera system, with a pair of mounted LED lights and red scaling lasers (5 cm apart), from a 40 ft inshore fishing vessel chartered from a local fisher. Seafloor video was recorded with continuous WAAS global positioning system (GPS) overlay of vessel position using a standard definition 250 m-tethered Deep Blue Pro camera. Simultaneous high-definition video was recorded with a mounted GoPro Hero 3 Black Edition at all sites <70 m. Video recording was monitored on board via live feed to maintain a distance of ~1 m between the camera and the seafloor. Each transect recorded 4 min of bottom time while the vessel drifted slowly. Still images from the video were scaled and measured for frame area using ImageJ software. Location, UTC (coordinated universal time), elapsed video time and video area were recorded from the tethered Deep Blue Pro camera footage. For sample stations <70 m, substrate type and coverage, flora/fauna identification, and abundance were determined from GoPro camera footage. For deeper sample stations, all the analyses were based on the Deep Blue Pro footage. Substrate and macroalgae presence were recorded every 10 s or more frequently if abrupt changes in the dominant substrate were observed. To record benthic fauna, every visible individual was identified and counted for the entire bottom time for each transect. Individual organisms were identified to the lowest possible taxonomic level. All abundance data were standardized by length (m) of the video survey transects.
An archival seafloor video dataset, collected by Copeland (2006) to ground-truth the Newman Sound multibeam data, was also employed for comparison of the MPA with its surrounding area. This dataset consists of species presence/absence recorded along video transects stratified by acoustic backscatter value, collected via SCUBA video transects, drop video and Remotely Operated Vehicle (ROV) transects. Fifty-meters long SCUBA video transects were recorded via Sony digital video camera in an Amphibico housing by divers at depths <20 m in July of 2004. Unmanned video transects were recorded using a SeaView BW-150 drop camera deployed from a vessel in November 2004 and a Videoray Pro ROV video operated by DFO from the Canadian coastguard ship Shamook in December 2004, extending the survey range to 80 m water depth.
Substrate Classification
Geomorphometric characteristics were derived from the Eastport multibeam bathymetry data using ArcGIS 10.2, NOAA's Benthic Terrain Modeler (BTM) extension, and the Terrain Attribute Selection for Spatial Ecology (TASSE) ArcGIS toolbox (Lecours, 2015; Lecours et al., 2017). Slope, Benthic Position Index (BPI), curvature, and standard deviation were calculated for all study areas. BPI refers to the relative elevation, identifying crests and depressions; in terrestrial studies, this is called Topographic Position Index (TPI; Verfaillie et al., 2007). These variables have been shown to capture the majority of variation in the seafloor (Lecours et al., 2017). The terrain attributes were applied in two substrate classification routines to separate correlated variables; both were tested for agreement with patterns of biodiversity through non-metric Multidimensional Scaling (nMDS) and analysis of similarity (ANOSIM) tests. The classification with best fit (i.e., lowest dimensional stress and significant separation of species groups by substrate class) was carried forward for further analysis. Substrate classifications were generated using the ArcGIS 10.2 ISO unsupervised classification tool. This tool combines a maximum likelihood clustering with an iterative self-organizing (ISO) algorithm. Unsupervised classifications are easily reproducible, do not require a priori assumptions about ecological relationships, and have been shown to produce results equal to or better than supervised classification methods when used to map biotic assemblages (Eastwood et al., 2006). In areas of hard substrate and high geomorphological complexity, as found in the Eastport MPA study area, unsupervised classification of bathymetry and bathymetric derivatives have also been shown to match performance of acoustic backscatter in segmenting seafloor substrate types (Calvert et al., 2015).
For comparison to the Newman Sound data, the Eastport multibeam data were resampled at a 10 m resolution using ArcGIS 10.2 and both datasets were combined in a single mosaic. Geomorphometric variables were generated again at the 10 m resolution following the methods listed above, and an unsupervised substrate classification was generated for the entire area.
Biological Communities
All statistical analyses of the video data were completed in PRIMER (Plymouth Routines in Multivariate Ecological Research) v7. Biological datasets were first processed with the PRIMER Dispersion Weighting protocol to balance contribution from highly variable species counts based on a Poisson model of cluster centers (Clarke et al., 2006). This normalized the influence of highly abundant, highly clustered species on similarity matrices. The dataset was then square root transformed to balance the contribution of high-abundance species with consistent, but low-abundance species to the measure of between-site variance. A Bray-Curtis similarity matrix was generated on the transformed dataset, and nMDS, Analysis of Similarity (ANOSIM) and Similarity Percentages (SIMPER) procedures were carried out on the similarity matrix. These analyses were conducted to test the efficacy of the unsupervised substrate classes as predictors of the distribution of taxonomic composition and, where applicable, to merge substrate classes occupied by statistically indistinguishable biological communities into continuous habitats. The accuracy of the resulting habitat map was calculated using an error matrix, which compares the predicted habitat type (according to unsupervised multibeam classification) to the observed habitat type in the video survey. Two standard types of accuracy were measured: the user accuracy, indicating how likely a user is to find a particular habitat where predicted, and the producer accuracy, indicating how likely it is that each observed habitat was correctly classified.
Habitats were also explored through an analysis of the combined Newman Sound and Eastport MPA datasets. For this analysis, all biological abundance data were transformed into presence/absence to match previously collected Newman Sound video data. Some taxonomic resolution was also sacrificed to make this comparison, as some taxa identified to species level in the Eastport MPA dataset were comparable only to taxa identified to the genus or family level in the archival Newman Sound data. Otherwise, the same methods were applied as described above.
Results
Bathymetry and Seabed Morphology of the Eastport MPA
The multibeam survey of the Eastport MPA and reference areas covered a total area of 3.4 km2. Bathymetric data were processed and analyzed at a 2 m resolution grid, with depths recorded by the survey ranging from <1 m to a maximum depth of 108 m (Figure 2). Depths within the Duck Island closure reach 101 m in the southern part, although about 64% of the protected area around Duck Island falls within the 0–50 m range. Benthic Position Index (BPI) values indicate high topographic variation, with many ridges, crests, and depressions surrounding the island. Slopes around these features reach highs of 65°. The majority of the Round Island closure is shallower than 20 m, gradually deepening to a maximum of 50 m toward the center of Newman Sound. The highest slopes are found on the northern side of Round Island, reaching a maximum of 48° along the sides of a depression about 70 m from the coast. Generally, there is very little topographic variation within the Round Island closure. The reference areas share the shallow depth range (0–50 m) and low topographic variation of the Round Island closure.
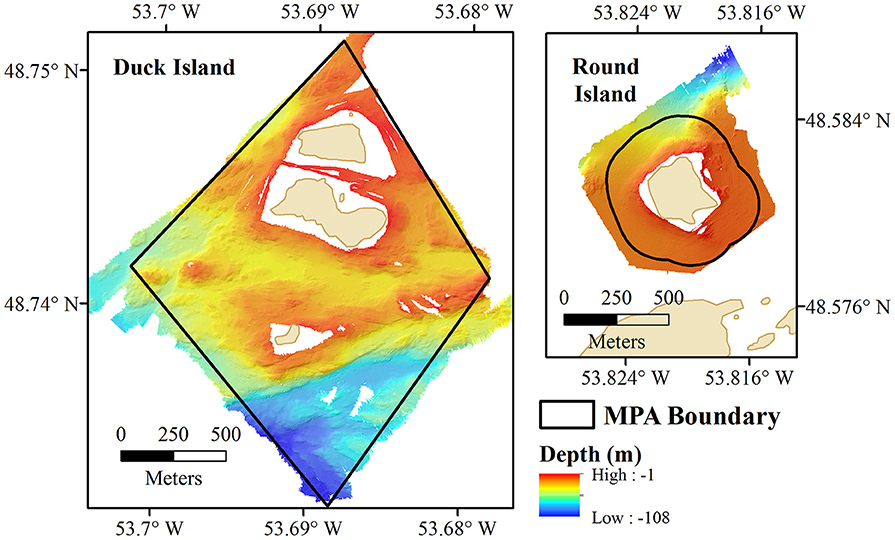
Figure 2. Bathymetry within the Eastport MPA, visualized with hillshade effect.
Substrate Classification
Unsupervised classifications were tested with two combinations of input variables (bathymetry, slope, and BPI; bathymetry, bathymetric standard deviation and BPI), chosen to reflect variations in the seafloor without internal correlation. The unsupervised classification using bathymetry, slope, and BPI provided the best fit with the biological data. Five substrate classes were identified, characterized by distinct seabed morphologies (Figure 3).
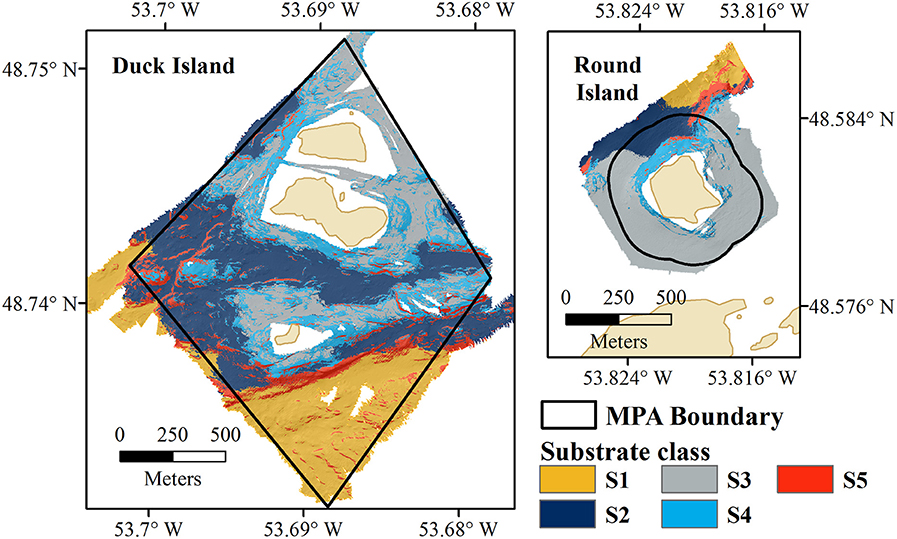
Figure 3. Eastport MPA substrate classification results for Duck Island (Left) and Round Island (Right).
Substrate class S1 is found in the deepest portions of the study area, characterized by moderate slopes (Figure 4). Substrate classes S2 and S3 dominate the study area; S2 is found in moderate depths and slopes and S3 is found in shallow depths and low slopes. Substrate class S4 shares the shallow depth range of S3, and includes moderate slopes and slightly more variation in BPI. Substrate class S5, found across the entire depth range of the Eastport MPA, is characterized by the steepest slopes within the survey area and large variations in BPI, indicating the presence of ridge and trench features.
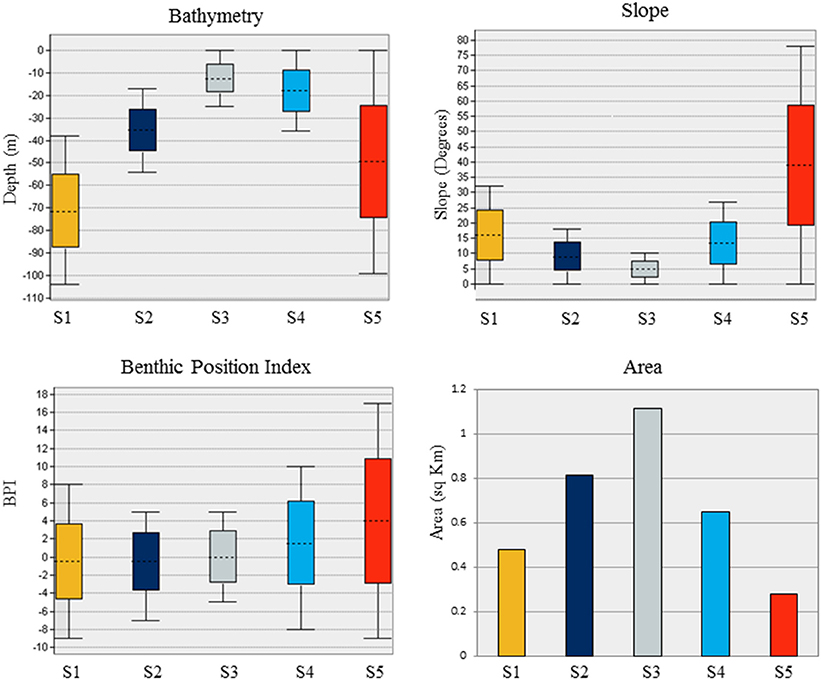
Figure 4. Characteristics of the five substrates identified in the Eastport Marine Protected Area based on depth, slope, BPI, and total area.
Biological Communities of the Eastport MPA
A total of 87 video transects were recorded in 2015 and analyzed throughout the Eastport MPA and reference areas. Video transects covered a total linear distance of 2,179 m and a total area of ~903 m2 ranging from 8 to 96 m depth. Visual analysis of the videos resulted in the identification of 39 different species, of which 34 were recorded within MPA boundaries (29 species identified within the Duck Island MPA closure and 32 species identified within the Round Island MPA closure). Observed species include 5 fish, 20 invertebrates and 14 species of algae (see Supplementary Materials). Of 8,392 individual organisms identified in the videos, only 47 (0.56%) could not be confidently identified and were excluded from further analysis: 27 unknown anemones, 12 unknown sea stars, 4 unknown fish, and 4 unknown decapods. Capelin (Mallotus villosus) were occasionally observed during camera descent but, as a primarily pelagic species, were not included in the benthic habitat map.
Species-area accumulation curves (Species observed, Jacknife 1, Jacknife 2, and Michaelis-Menten; Figure 5) reached asymptote early in the survey, indicating that the overall area was sufficiently sampled (N = 87, ~903 m2). Generally, the 2D nMDS plot indicated very little separation of taxonomic composition recorded across all of the video transects sampled within the Eastport MPA (Figure 6; 2D stress = 0.21). It should be noted, that while a 2D nMDS with a stress value >0.2 provides a useful visualization of the data, other methods (ex. ANOSIM) should supplement the identification of cluster groups (Clarke and Warwick, 2001). Groups of co-occurring species found to be statistically distinct from other groups, based on the pairwise ANOSIM tests on abundance and composition of species (i.e., between different substratum categories), were considered to be distinct biological communities associated with the different substratum categories. Species composition in the reference areas were not found to be significantly different from the videos collected within the MPA closure.
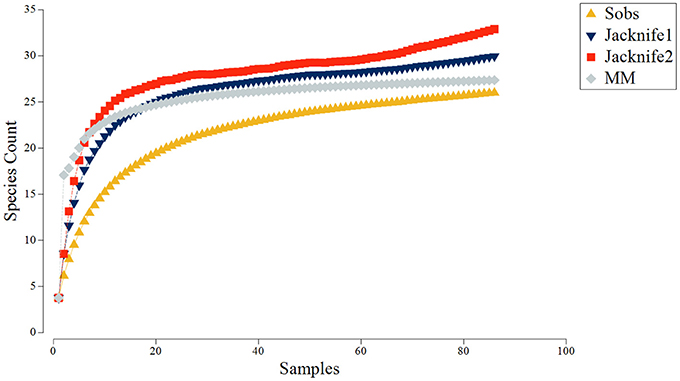
Figure 5. Species accumulation curves derived from video samples collected in the Eastport MPA in 2015: Species observed (Sobs), Jacknife1, Jacknife2, and Michaelis-Menten (MM).
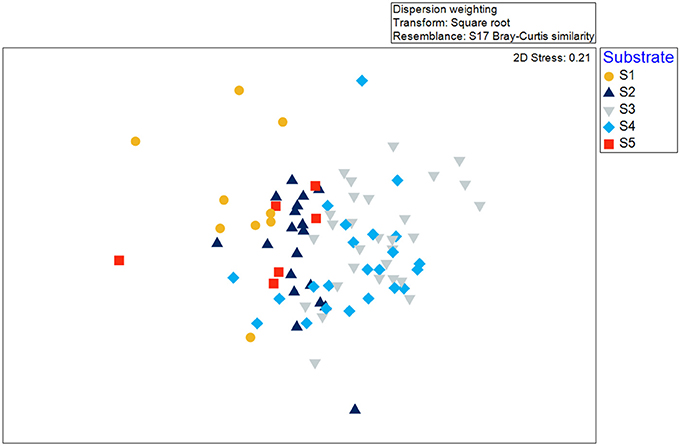
Figure 6. Non-metric multidimensional scaling (nMDS) as a visualization of similarity between video transects collected in the Eastport MPA in 2015. Symbol shape and color indicate the unsupervised substrate classification.
Pairwise ANOSIM tests show significantly different species composition between S1 and S2, S3, and S4. Similarly, S2 was found to be biologically distinct from S1, S3, and S4 (p < 0.05; Supplementary Materials). Of the pairwise combinations, S3 and S4 were not found to be significantly different (p > 0.05). S5 was not found to be significantly different from S1, S2, and S4, although those three substrates appear to be biologically different in each of their respective pairwise tests. However, S5 is not very prevalent, and was surveyed by few video transects (N = 6).
Benthic Habitats of the Eastport MPA
Three distinct benthic habitats were identified within the Eastport MPA based on similarities in species composition between substrate classes (Figure 7). Habitat 1 (H1—shallow rocky habitat) includes S3 and S4, Habitat 2 (H2—sand and cobble) occurs on S2, and Habitat 3 (H3—sand) on S1. S5 was not identified as a unique habitat as it was not found to be significantly biologically different from S1, S2 and S4, but could not be confidently grouped with any identified habitat.
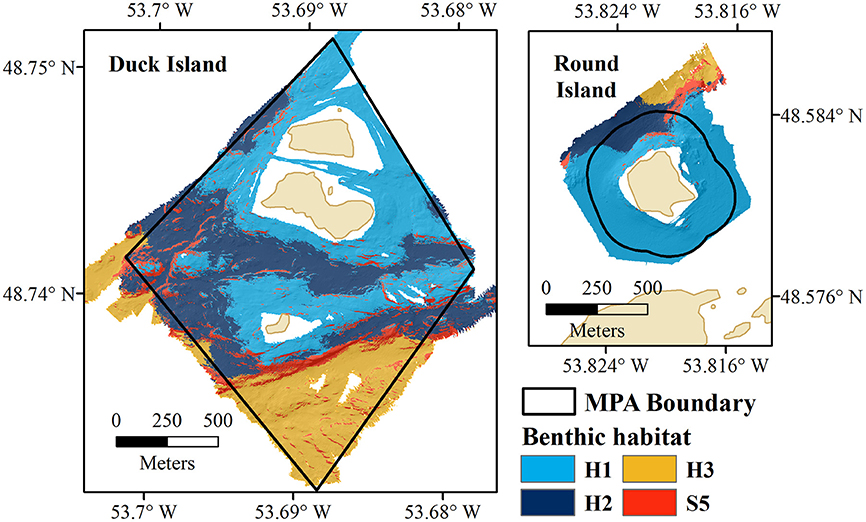
Figure 7. Benthic habitats of the Eastport MPA (Duck Island and Round Island); H1, shallow, rocky habitat; H2, sand and cobble; H3, sand; and S5, high profile bedrock features.
Species-area curves (Figure 8) generated for the fauna identified within each habitat type of the Eastport MPA indicate that the shallow rocky habitat (H1) was very well-sampled. The majority of species observed in this habitat were recorded within the first 200 m2 of seafloor video. The sand and cobble habitat (H2) follows a roughly similar curve, and appears to be adequately sampled after 200 m2 of seafloor video. Sandy habitat (H3) was not adequately sampled by this survey largely due to the low prevalence of this habitat type within the MPA (0.28 km2, 15% of MPA area). Similarly, the high profile bedrock and boulder features (S5), which made up a very small fraction of the MPA (0.149 km2, 8% of MPA area), were insufficiently sampled for species composition.
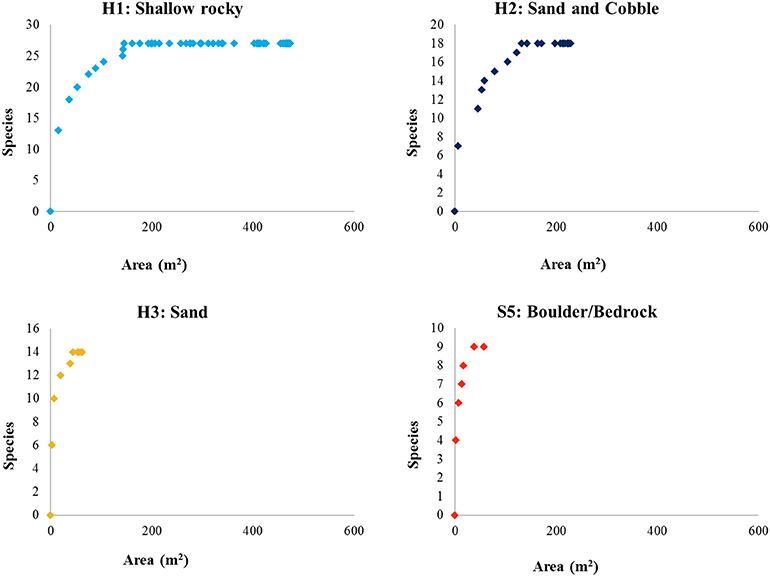
Figure 8. Species-area curves of fauna identified from seafloor video within the mapped habitats of the Eastport MPA.
Shallow Rocky Habitat
Rocky habitat (H1) was found in shallow waters (<36 m), in areas of relatively low slope, and low to moderate BPI values. SIMPER analysis indicates that internal similarity is mainly driven by the high abundance of green sea urchin (Strongylocentrotus droebachiensis) and northern seastar (Asterias vulgaris). The shallow rocky habitat covers approximately half of the MPA (48.9%), including most of the Round Island closure (86.3%). The mixed cobble, boulder, and bedrock substrate provides a surface for leafy and encrusting algae, and this habitat is characterized by both high algal cover and high algal richness. All 14 species of algae observed in the study area occur within the shallow rocky habitat. The most abundant invertebrate fauna include green urchin, northern seastar and frilled anemone (Metridium senile). Several invertebrate species were exclusive to this habitat, including smooth sunstar (Solaster endeca), northern seastar, sea cucumber, and finger sponge (Haliclona oculata). The vast majority of sessile species, including mussels (95% of all observations), all stalked jellyfish (Lucernaria quadricornis; 73.7%) and frilled anemones (79%), were recorded in the shallow rocky habitat, where hard surfaces for attachment are most prevalent. A total of five fish species were observed in the video survey, and all were present within the shallow rocky habitat. The most abundant fish species was the common cunner (Tautogolabrus adspersus), which was found exclusively within this habitat. Atlantic cod (G. morhua), generally of smaller size (~30–40 cm, estimated from video scaling lasers), were also exclusively recorded in shallow, rocky areas.
Sand and Cobble Habitat
The sand and cobble habitat (H2) is characterized by intermediate water depths (16–54 m), with mixed cobble and sandy bottom substrates. In some areas this habitat overlaps in depth range with the shallow rocky habitat; however, the majority of this sand and cobble habitat was found beyond the macroalgae-dominated shallows. Approximately 28% of the protected areas are predicted to be sand and cobble habitat. Coralline encrusting algae (Lithothamnion sp.) was present in all of the sand and cobble habitat video transects. Sea colander (Agarum sp.) and northern sea fern (Ptilota serrata) were also very common in these areas, present in 84 and 68% of videos respectively. Overall, algal richness in the cobble and sand habitat was half that of the shallow rocky habitat (7 species total). Green urchin, brittle star (Ophiopholis sp.), stalked jellyfish, toad crab (Hyas areneus), and burrowing anemones (Pachycerianthus borealis) were common. Eelpout (Zoarcidae) and sculpin (Myoxocephalus sp.) were the only fish species recorded.
Sandy Habitat
The sandy habitat (H3) was found in deeper waters (40–108 m, mean depth 70 m), with substrates dominated by sand and finer sediments (>80% bottom coverage from video analysis). Only about 15% of the protected areas were classified as sandy habitat, and all protected sandy habitat was found within the Duck Island closure. Few algae species (5 of 14) were recorded in the sandy habitat, limited by light penetration. The deep sandy habitat was characterized by brittle star, burrowing anemone, and snow crab (Chionoecetes opilio). Snow crabs were rare in general (only three recorded in the entire survey) and only found on sandy habitat. Eelpout, sculpin, and flatfish were all recorded in the sandy habitat at greater abundance per meter than in the shallower habitats.
High Profile, High Slope Boulder, and Bedrock Features
Substrate 5 (S5) was classified as a distinct substrate from the three habitats but could not be classified as a unique habitat. ANOSIM analysis indicates that S5 does not differ biologically from any other substrate except S3, the shallowest and lowest slope substrate. S5 covers the smallest area (8%) of the MPA. Characterization of S5 is limited, with only few video transects in these areas (N = 6). It appears that S5 is populated by the most abundant species of the other habitats (e.g., green urchin, brittle star, frilled anemone, coralline algae). Kelp (Laminaria sp), sea colander, and northern sea fern were also present, though rare.
Habitat Map Accuracy
The overall accuracy of the habitat map was ~70% (Table 1). Shallow rocky habitat is predicted to include rocky mixed substrates (including cobbles, boulders, and bedrock), as well as macroalgae-dominated substrates. Sand and cobble habitat is predicted to include sand-dominated substrates with occasional cobbles, and sandy habitat includes the deepest areas, where sand is continuous (>80% cover).
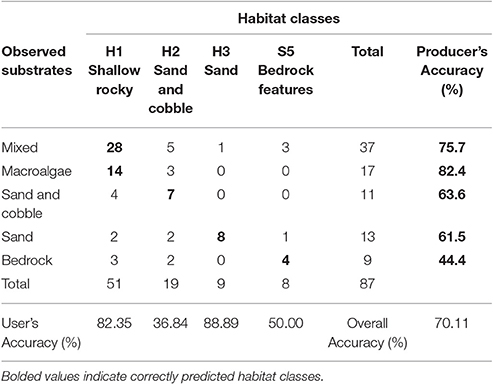
Table 1. Eastport Marine Protected Area habitat map error matrix (N = 87).
The shallow rocky habitat (H1; “mixed” and “macroalgae” in the videos) and the deepest sandy habitat (H3; sand) were accurately predicted (user's accuracy 82.35 and 88.89% respectively), while the sand and cobble habitat (H2) and high profile bedrock features (S5) had a lower accuracy (user's accuracy 36.84 and 50% respectively). Producer's accuracy was relatively high for all of the observed substrates except for bedrock.
Diversity and Species Richness
The Duck Island closure showed greater benthic habitat and faunal diversities (H' = 1.33) than Round Island (H' = 1.09). Round Island, however, showed greater benthic species richness, driven mainly by a diverse algal community, as this MPA closure is dominated by shallow rocky habitat. The sandy, and sand and cobble habitats showed much lower algal richness and low epifaunal diversity overall (Table 2).
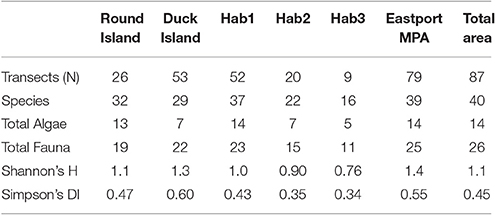
Table 2. Species Richness and Diversity (Shannon's H and Simpson's Diversity Index calculated for fauna only).
Comparison to Newman Sound
Unsupervised classification of the 10 m resolution multibeam data delivered five distinct substrate types throughout the Eastport and Newman Sound area within the <110 m depth range represented by the protected areas. Distribution of substrates is consistent with the classification carried out at 2 m resolution within the MPA boundaries (Table 3, Figure 9). All five Newman Sound substrate classes are represented within the MPA. Of the total area, 4.2 km2 is made up of shallow, rocky substrates, ranging from continuous bedrock to mixed cobbles and boulders (NS5). This substrate type and the corresponding habitat(s) are well-protected; ~22% of the shallow rocky habitat in the surveyed area falls within the boundaries of the Eastport MPA. Fine substrate habitats (NS1 and NS2) receive much less protection, with only 0.3 km2 represented within the MPA boundaries (4.4% of total surveyed fine substrates ≤110 m).
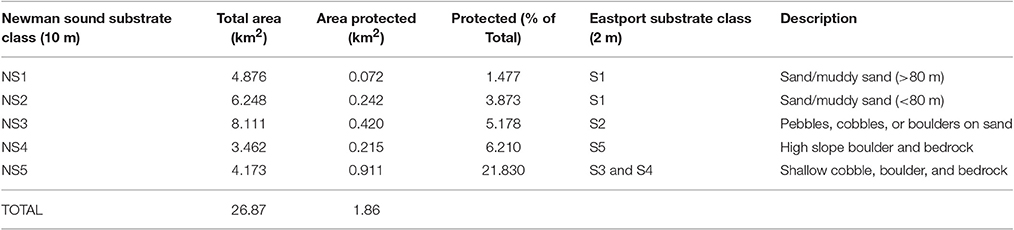
Table 3. Representation of Newman Sound unsupervised substrate classes within Eastport MPA boundaries.
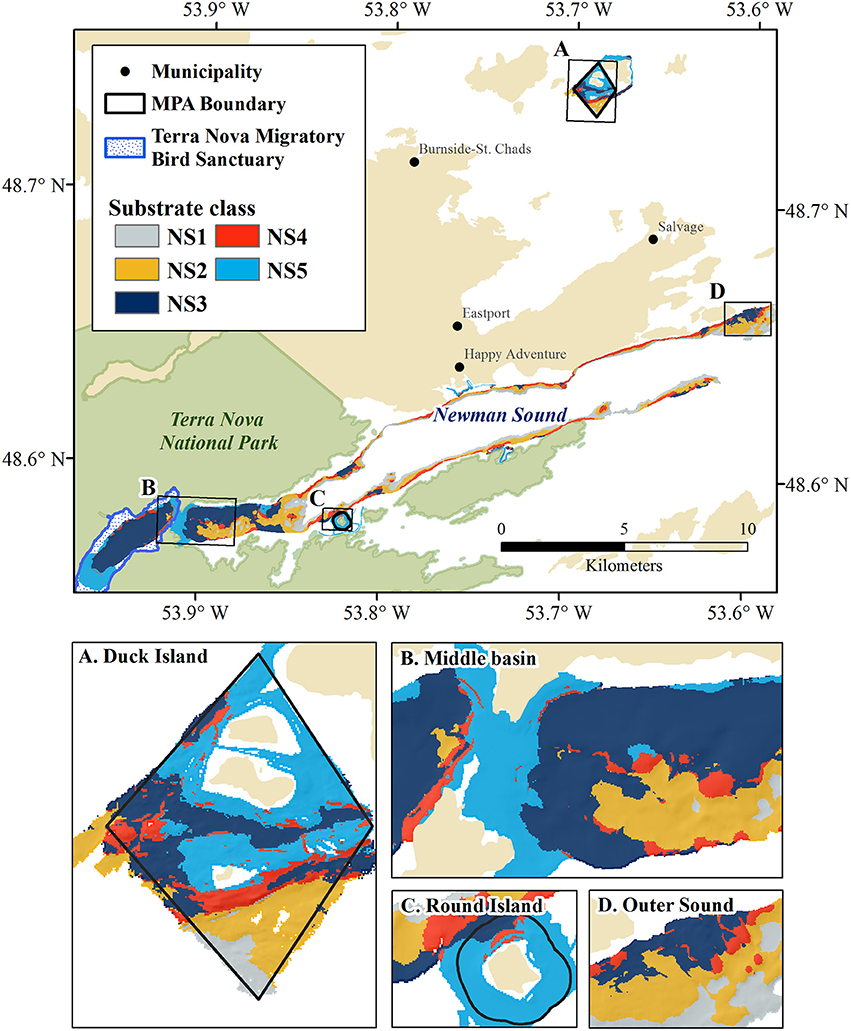
Figure 9. Unsupervised substrate classification of Newman Sound and the Eastport MPA at 10m resolution. MPA closures and features of interest shown in insets: (A) Duck Island Closure, (B) Middle Basin narrows and shallow sill, (C) Round Island Closure, (D) Outer Sound fjord mouth.
A total of 58 taxa were identified in the two benthic surveys (Newman Sound and the Eastport MPA). Of these, 22 were present in both the Eastport MPA and Newman Sound, 12 were only found within the MPA boundaries and 24 were only found outside of the MPA. At the species presence/absence level available in the Newman Sound archival data, habitats could not be distinguished biologically throughout the Eastport/Newman Sound areas using the methods described above. Species composition was found to be significantly different (ANOSIM, p < 0.01) between videos recorded within the Eastport MPA and videos recorded within the same depth range (<110 m) in the broader Newman Sound area (Figure 10). Due to this difference, the habitats identified within the MPA may not be transferrable to the similar substrates of Newman Sound.
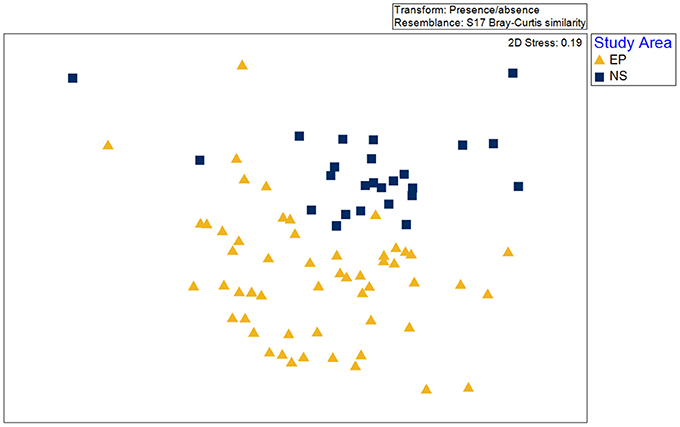
Figure 10. Non-metric multidimensional scaling (nMDS) as a visualization of difference between species composition within video transects collected in the Eastport MPA (EP) and the surrounding Newman Sound (NS) area.
Discussion
Benthic Habitats of the Eastport MPA
Species distribution within the Eastport MPA appears to be controlled mainly by depth and substrate type. The limited size (2.1 km2) and depth range (0–110 m) of the Eastport Duck Island and Round Island MPA closures capture a limited portion of the regional biodiversity. The vast majority of the protected area (95.7%) is within the photic zone, at depths <80 m. Within the MPA, substrate ranges from algal dominated rocky shallows near the islands' coasts to cobble and sand habitats at the greatest depths. The most abundant species are relative generalists in shallow coastal areas, able to utilize a range of available habitats. Green urchins, for example, were recorded on every substrate and habitat type.
The algae-rich shallow rocky habitat that makes up the majority of the Eastport MPA may offer important predation cover for juvenile fishes and invertebrates. Juvenile Atlantic cod have been shown to prefer the complex habitat provided by shallow, seaweed-dominated habitats in Newfoundland waters. Urchin barrens, the result of grazing by large urchin populations, reduce habitat complexity. Field experiments conducted in Conception Bay, Newfoundland, demonstrated that removal of urchins from rocky barrens resulted in the colonization and growth of macroalgae species and a simultaneous increase in juvenile cod density (Keats et al., 1987b). The shallow rocky habitat was the most prevalent in the MPA, and very well-sampled by this survey. The species-area curve (Figure 8) indicates that the protection of this habitat (0.911 km2) is likely sufficient to protect at least 90% of associated species, a minimum area threshold identified by MPA network planners in California to ensure adequate habitat representation (California MLPA Master Plan Science Advisory Team, 2011). However, the small size of the MPA and the limited number of individuals protected may not be sufficient to ensure a viable population. Assessing the appropriate size of the closure would require further study on the population dynamics that go beyond our study. Species richness and faunal diversity (measured by Shannon's H and Simpson's Diversity Index) were higher in the shallow rocky habitat and lower in the deeper, sandy flats. Species diversity is often closely linked to habitat complexity in marine coastal environments (Kostylev et al., 2005), a pattern that is reflected in the Eastport MPA. It should be noted that these analyses are based on vertical seafloor video conducted during the summer season; cryptic, mobile, or seasonal species are not represented by this survey and may alter the species-area curves and diversity metrics.
The cobble and sand habitat included species of both the shallow rocky and deep sand habitats, though in lower abundances. This reflects the transitional nature of this habitat, as the coastal gradient shifts from rocky shallows to the sand-dominated depths. Generally, the sand and cobble habitat appears to be a suboptimal spillover habitat for most of the species represented in this survey. There are no species unique to this habitat and the vast majority of species are much more abundant in either the shallow rocky habitat or the deeper, sandy habitat. The bay scallop (Argopecten irradians) was the only species found to be more common among the sand and cobble habitat, when compared to other habitat types. The sandy habitat appears to be well-sampled by this survey (Figure 8), and the MPA appears to protect 90% of the species found in this habitat (0.52 km2 protected).
Snow crab, a locally harvested species, was recorded in the deep sandy habitat, although all appeared to be immature individuals. Despite low abundance in this survey, this pattern agrees with a previous study of snow crab habitat in Bonne Bay, Newfoundland, which indicates that immature snow crabs are most abundant between 50 and100 m on fine substrates (Comeau et al., 1989). In total, about 15% of the MPA (0.28 km2) may protect suitable juvenile snow crab habitat. Eelpout, sculpin, and flatfish were also found to be more abundant (per meter of video transect) in the sandy habitat, though they likely move between habitats to feed. For example, a study of eelpout diet indicates that green urchins are a staple (62% of overall diet by weight; Keats et al., 1987a) and this species likely uses the shallower, urchin-dense habitats to hunt. Brittle stars, the most abundant prey species available in sandy habitat, make up only 6% of eelpout diet in Newfoundland studies (Keats et al., 1987a). Deep sandy habitat is not prevalent in the MPA, and as a result, the species-area curve for this habitat type indicates that it was not well-sampled by this survey (Figure 8). It is not possible to conclude whether the area within the MPA boundary is sufficient to protect 90% of associated species without additional surveys.
Shallow rocky habitat was very accurately predicted (user's accuracy 82.35%). The deep sandy habitat was also very well-predicted by the unsupervised substrate classification (user's accuracy 88.89%). The mid-depth sand and cobble habitat, however, was not well-predicted, possibly due to its transitional nature. The sand and cobble classification misidentified transects from all substrate types. This may be due, in part, to the video classification procedure. The difference between the observed habitats was marginal at times; mixed cobble substrate with less than 60% sand cover observed in the video was recorded as mixed-rocky, while areas of 60–80% sand were listed as sand and cobble, and over 80% sand cover was simply listed as sand.
Management Objectives of the Eastport MPA
American Lobster
The primary conservation objective of the Eastport MPA is “to maintain a viable population of American lobster through the conservation, protection, and sustainable use of resources and habitats” (DFO, 2014). While no American lobsters were recorded within or surrounding the MPA boundaries during this survey, this species is known to be cryptic and the sampling strategy used in this study was not designed to confirm lobster presence but to map the benthic habitat more generally. Lobsters spend much of their time during the day in rocky shelters and are unlikely to be found by a bottom-facing camera (Ennis, 1984). American lobsters can be found on a variety of habitats from sandy substrates to bedrock, but commonly occupy coarse rocky substrates with suitable crevices (Tanaka and Chen, 2015). Previous research and the active fishery in the area suggest that the species is present in the MPA in relatively high abundance. Baited lobster traps have been used to successfully sample lobster in the MPA (Janes, 2009; DFO, 2014). A decade after the original fishery closures were created, Janes (2009) demonstrated several changes within the American lobster population, including higher abundance of large, ovigerous females and increases in mean size of both male and female lobsters. Small coastal MPAs (collectively protecting 2.2 km2) on the Norwegian Skagerrak coast have shown similar increases in mean size and abundance of lobster within the closures (Moland et al., 2013). These results demonstrate the potential of small coastal MPAs as an effective management tool for this species.
The shallow rocky habitat that dominates the Eastport MPA has several characteristics of optimal juvenile lobster habitat. The area provides complex rocky features with many crevices and a thick seaweed canopy that provides cover from predators. Experiments conducted by Johns and Mann (1987) suggest that settling juvenile lobsters (stage IV) have a strong preference for seaweed-covered rocky habitats over mud, pebbles, or sand. Both laboratory and field experiments have shown early stage lobsters are more likely to settle on cobble substrate and rocks colonized by macroalgae; they settle faster in these habitats and experience lower predation mortality (Wahle and Steneck, 1992; Hovel and Wahle, 2010). The shallow rocky habitat and bedrock features of S5 also provide the complex structure that adult lobsters use for shelter (Christian, 1995). Lobster grounds are defined by Hooper (1997) as mixed rocky substrate areas characterized by the presence of green urchin, mussels, brittle stars, toad crab, and rock crab—an accurate description of the shallow rocky habitat identified within the Eastport MPA. Results of this habitat mapping exercise also agree with local ecological knowledge: harvesters described the MPA location as suitable lobster habitat (Rowe and Feltham, 2000), known for the rocky bottoms with depths generally <25 m (Ennis et al., 1989). Based on maps generated by Rowe and Feltham (2000), ~0.208 km2 of lobster habitat is found within the Round Island closure and 0.114 km2 within the Duck Island closure. The habitat maps presented in this report suggest that there is slightly more lobster habitat within MPA protection than previously expected: 0.254 km2 of shallow rocky habitat was recorded in the Round Island closure and 0.659 km2 in the Duck Island closure.
Wolffish
The secondary conservation objective of the Eastport MPA is “to ensure the conservation and protection of threatened or endangered species,” specifically mentioning threatened wolffish (DFO, 2013). This target was included in management plans after 2005, when the fishery closure was gazetted as an MPA under the Canadian Oceans Act, and did not inform design or placement of the protected areas. This addition was likely an attempt to broaden the scope of the MPA beyond the protection of American lobster, which is common throughout Atlantic Canadian waters. Spotted wolffish (Anarhichas minor) and northern wolffish (A. denticulatus) are currently listed as Threatened Species under Canada's Species at Risk Act (SARA), though they are not listed to species level by the Eastport MPA Management Plan (DFO, 2013). It is highly unlikely that spotted wolffish or northern wolffish are protected by the Eastport MPA; these species are most commonly found in the Newfoundland waters between 200 and 1,000 m (Kulka et al., 2007), well-beyond the depth range found within MPA boundaries. Atlantic wolffish (Anarhichas lupus) are the most likely wolffish species to be found in the Eastport MPA, due to their relatively shallow depth range (Kulka et al., 2007). Atlantic wolffish are currently recognized as a species of Special Concern under SARA (Kulka et al., 2007), but are not specified in the Eastport MPA management plan, which only refers to threatened and endangered species (DFO, 2013). Previous characterization of Atlantic wolffish habitat in Conception Bay identified denning habitat occurring in boulder and bedrock substrates of high slope (>30°; Novaczek et al., 2017). Approximately 6% (0.12 km2) of the Eastport MPA provides adequate slope for potential wolffish denning habitat, and several prey species are present throughout the MPA (green urchin, blue mussel, and rock crab; Kulka et al., 2007).
While there is some potential habitat for Atlantic wolffish within the MPA, there is no evidence that this MPA is used by wolffish of any species. No wolffish, or any other species listed by Canada's Species at Risk Act (SARA), were recorded in this survey. Like the American lobster, Atlantic wolffish may not be easily detected in vertical video surveys as, in addition to being relatively rare, they spend much of their time in rocky dens (Kulka et al., 2007; Larocque et al., 2008). Since 2007, when DFO began an organized campaign among harvesters to recognize and report wolffish, there have been no reported sightings in or near the MPA (DFO, 2013; Janes, 2013). When the results of this study were presented to local stakeholders in 2016, fishers reported that they had not observed wolffish as bycatch in any fisheries near the MPA.
Additional Management Goals
The Eastport MPA management plan also aims to investigate possible economic benefits from the MPA as a result of resource conservation, research and education initiatives. Two commercial species (Atlantic cod and snow crab) were found within the boundaries of the MPA, although not in high abundance. Mussels and scallops, which are harvested recreationally in Newman Sound, were also recorded within the MPA, indicating that the MPA protects at least a small portion of their habitat and may contribute to the sustainability of harvested populations outside the MPA.
Comparison to the Surrounding Habitat and Species Diversity
Mapping of the Eastport MPA and Newman Sound indicates that all major substrate types are represented within the MPA boundaries. However, patch sizes are very small; NS1 and NS2, which correspond with sand and finer sediments, make up only 0.072 and 0.242 km2 of the MPA respectively. Further field surveys, including species abundance data, will be required to deliver a more complete estimate of habitat and biological community representation.
Previous habitat mapping efforts identified 10 distinct habitats throughout Newman Sound mainly based on depth and multibeam acoustic backscatter signature (Copeland, 2006):
• Bedrock with sponges with anemones and echinoderms.
• Laminaria covered seabed.
• Rhodolith beds.
• Boulder gravel with anemones and echinoderms.
• Pebble and cobble gravel with foraminifera, bryozoans, and grazing epifauna.
• Shallow sand with sand dollars and macroalgae.
• Deep sand.
• Gravelly sand with bivalves and echinoderms.
• Gravelly muddy sand with ophiuroids, infaunal bivalves, and polychaetes.
• Mud with polychaete worms and infaunal bivalves.
The shallow rocky habitat and bedrock features identified in the Eastport MPA are similar in substrate and species composition to Copeland's “Laminaria covered seabed,” “bedrock,” and “boulder gravel” habitats, including common species like coralline algae, kelp, frilled anemone, and green urchin. However, several species of the bedrock and boulder habitats in Newman Sound were not observed within the Eastport MPA, including northern red anemone (Telia felina), purple sunstar (S. endeca), breadcrumb sponge (Halichondria panacea), sea peach (Halocynthia pyriformis), and hydroids (Hydrozoan sp.). It does not appear that sand or gravelly sand habitats identified by Copeland in Newman Sound support the same biotic communities as the sandy habitat protected by the Eastport MPA, despite similar substrate. Species richness across all habitats surveyed by Copeland (2006) is much greater in Newman Sound (N = 96) than within the boundaries of the Eastport MPA (N = 34). Within the depth range represented by the Eastport MPA (<110 m), which was mapped and analyzed for this paper (28.73 km2 total), the difference in species richness is less dramatic. Fewer taxa were recorded within the MPA (N = 34) than outside (N = 44). Of the 58 taxa identified across the Eastport MPA and Newman Sound datasets, 22 were present in both the Eastport MPA and Newman Sound, 12 were only found within the MPA boundaries and 24 were only found outside of the MPA.
Anderson et al. (2002) produced single-beam acoustic seabed classifications within Bonavista Bay, roughly 100 km south of the Eastport MPA. They identified seven different acoustically distinct seabed types within the 24 km2 study area: “high relief/cobble,” “sparse algae/cobble,' “true algae,” “rock,” “gravel,” “loose gravel,” and “mud.” Of these, the shallow “true algae,” “sparse algae/cobble,” and “high relief/cobble” appear to be represented within the Eastport MPA within the shallow rocky habitat, sand and cobble habitat, and the high profile rock features of S5. These are also the three habitat types that Anderson et al. suggest are important areas for Atlantic cod. In this survey, cod were only observed within the shallow rocky habitat, which, like Anderson's “true algae” habitat, is characterized by dense algal cover including kelp and Irish moss (Chondrus crispus) (Anderson et al., 2002).
Of 13 coastal marine habitats identified by Hooper (1997) in Newfoundland waters, only a few appear to be represented within the Eastport MPA: “kelp beds,” “lobster grounds,” (shallow rocky habitat) and clam beds (sandy habitat). A Community-based Coastal Resource Inventory (CCRI) was commissioned to identify important species within the Eastport area (KEDC, 2001). Two of the three CCRI algae species are protected by the Eastport MPA: Laminaria and Irish moss. Most invertebrates identified by the CCRI were observed within MPA boundaries; however, few of the fish species were recorded. Of 17 listed “key” fish species, only three were observed within the MPA: cod, flounder, and capelin. Several decades of study on eelgrass beds of Newman Sound have demonstrated that these habitats are both sensitive to human impact and ecologically important as fish nursery areas (Gorman et al., 2009; Rao et al., 2014). No eelgrass habitat is included within the boundaries of the Eastport MPA.
Conservation Contribution of the Eastport MPA
As a single-species management tool designed to support the American lobster fishery, the Eastport MPA closures are celebrated and respected by the local community. The most prevalent habitat of the MPA (shallow rocky) appears to be suitable for juvenile lobster settlement and survival. Monitoring of the Eastport MPA through mark recapture studies have demonstrated higher proportions of ovigerous females inside the MPA compared to the surrounding commercial area, indicating the MPA protects reproductively active adults (Janes, 2009). This contributes to the MPA's primary conservation goal: protecting the American lobster population and, by extension, the local fishery. Further study confirming larval dynamics, settlement and connectivity could help better define the effectiveness of this MPA for protection of lobster throughout life stages. However, our study suggests that this small MPA offers little additional benefit and plays a very limited role in protecting regional biodiversity. While the MPA appears to provide protection for species associated with shallow rocky habitats, it does not protect the deeper, fine sediment habitats as well. The small size of the closure also raises questions on the ability of the MPA to support healthy lobster populations in the region. Comparison to previous research in the Newman Sound area shows that species diversity and richness within the MPA is relatively low, as is the representation of most substrate types (1–5% of mapped area; Table 3). Furthermore, this study focuses exclusively on representation of substrates and associated biodiversity within the 110 m depth range of the MPA boundaries. Deeper habitats and associated species receive no protection from the MPA.
The fishery enhancement goals of the Eastport MPA provide little “umbrella effect” for protecting representative marine biodiversity, sensitive habitats, or species at risk. Eelgrass beds, demonstrated to be both sensitive to anthropogenic impacts and important habitat for juvenile fish in the Newman Sound/Eastport area, are not protected by the MPA despite their close proximity to the closures (Gorman et al., 2009; Rao et al., 2014). No species at risk were recorded in the MPA, and the analysis of available habitat demonstrates that it is extremely unlikely that the area is used by the threatened species (northern or spotted wolffish) targeted by the Eastport MPA Management Plan. These findings are important as countries like Canada aim to meet the Aichi Biodiversity Target 11, which is explicit that protected areas included under the commitment should be ecologically representative (CBD-UNEP, 2010). The Canadian Government intends to reach Target 11 through a combination of new protected areas and existing MPAs, National Marine Conservation Areas, National Wildlife Areas and “other effective area-based conservation measures,” including fisheries closures (DFO, 2016b).
Assessing the effectiveness of spatial marine conservation efforts is an ongoing challenge in ocean and coastal management. The success of marine conservation efforts depends on careful consideration of the goals and design criteria early in the process, including spatial representation of target species' distribution (Klein et al., 2015). The Eastport MPA was not designed to protect ecosystems representative of its region, species at risk, or habitats known to be unique and/or vulnerable to human impact. Instead, like many MPAs around the world, it resulted from the will of a community to sustain a local fishery. A clear limitation of the Eastport MPA is its size. While small MPAs can in some contexts provide conservation benefit (Claudet et al., 2010; Moland et al., 2013), the size of the MPA must be appropriate to its goals. Our study finds that the Eastport MPA, which has goals very similar to the ones of a fishery closure, has been expected to deliver conservation benefit (i.e., protection of threatened or endangered species) that do not match its size, boundaries, or other management efforts. Further research is ongoing to examine how the Eastport MPA could be redesigned to improve conservation of biodiversity and vulnerable habitats. Appropriate changes may include increased MPA size, change in MPA boundary to include more diverse habitat types, or an expanded network of additional small closures. A shift toward ecosystem-based management and the use of indicators such as species richness and distribution can aid in assessing the more general contribution of an MPA (Soykan and Lewison, 2015). The ability to revise MPA boundaries and regulations in light of their measured effectiveness (i.e., to conduct adaptive management) is a critical challenge for the next several decades. Habitat mapping provides the baseline knowledge important to the successful design and implementation of MPAs. If fisheries closures, or MPAs that share similar goals and design, are to be included within conservation commitments at any level (local, national, or international), it is crucial that managers proceed carefully and use the best available tools to establish that both existing and proposed protected areas have demonstrated the ability to meet management goals.
Author Contributions
All coauthors have given final approval of the manuscript, and all coauthors have agreed to be accountable for all aspects of the work. Further details on author contributions are as follows: EN contributed to the survey design, and led data acquisition, analysis, interpretation, in addition to significant contribution to drafting of the manuscript. VH contributed to biological data processing, analysis and interpretation, in addition to significant contribution to drafting of the manuscript. CP contributed to acoustic data analysis, interpretation, and provided revision of the manuscript for intellectual content. RD contributed to project conception, survey design, data analysis, interpretation of results, and contributed significant revision of the manuscript for intellectual content. EE contributed to project conception, survey design, interpretation of results, and provided revision of the manuscript for intellectual content. AC contributed to survey design, data acquisition, interpretation of results, and provided revision of the manuscript for intellectual content.
Funding
This study of the Eastport MPA was funded by the Academic Research Contribution Program (ARCP) of the Department of Fisheries and Oceans Canada (Project 3342008). Archival data was provided by Memorial University of Newfoundland Department of Geography.
Conflict of Interest Statement
The authors declare that the research was conducted in the absence of any commercial or financial relationships that could be construed as a potential conflict of interest.
Supplementary Material
The Supplementary Material for this article can be found online at: http://journal.frontiersin.org/article/10.3389/fmars.2017.00174/full#supplementary-material
References
Anderson, J. T., Gregory, R. S., and Collins, W. T. (2002). Acoustic classification of marine habitats in coastal Newfoundland. ICES J. Mar. Sci. 59, 156–167. doi: 10.1006/jmsc.2001.1126
Batista, M. I., Henriques, S., Pais, M. P., and Cabral, H. N. (2015). A framework for the assessment of MPA effectiveness based on life history of fishes. Ocean Coast. Manage. 118, 75–87. doi: 10.1016/j.ocecoaman.2015.11.010
CBD-UNEP (2010). Aichi Biodiversity Targets. Available online at: https://www.cbd.int/sp/targets/
California MLPA Master Plan Science Advisory Team (2011). Methods Used to Evaluate Marine Protected Area Proposals in the North Coast Study Region. Sacramento, CA: Marine Life Protection Act Initiative.
Calvert, J., Strong, J. A., Service, M., McGonigle, C., and Quinn, R. (2015). An evaluation of supervised and unsupervised classification techniques for marine benthic habitat mapping using multibeam echosounder data. ICES J. Mar. Sci. 72, 1498–1513. doi: 10.1093/icesjms/fsu223
Charest, R., Brouillet, L., Bouchard, A., and Hay, S. (2000). The vascular flora of Terra Nova National Park, Newfoundland, Canada: a biodiversity analysis from a biogeographically and life form perspective. Can. J. Bot. 78, 629–645. doi: 10.1139/b00-040
Christian, J. R. (1995). Patterns of Diel Activity and Movements of the American Lobster, Homarus americanus, as Determined by Ultrasonic Telemetry. Master of Science Thesis, Memorial University of Newfoundland, St. John's, NL.
Clarke, K. R., Chapman, M. G., Somerfield, P. J., and Needham, H. R. (2006). Dispersion-based weighting of species counts in assemblage analyses. Mar. Ecol. Prog. Ser. 320, 11–27. doi: 10.3354/meps320011
Clarke, K. R., and Warwick, R. M. (2001). Change in Marine Communities: An Approach to Statistical Analysis and Interpretation. Plymouth, MA: PRIMER-E Ltd.
Claudet, J., Osenberg, C. W., Benedetti-Cecchi, L., Domenici, P., Garcia-Charton, J.-A., Perez-Ruzafa, A., et al. (2008). Marine reserves: size and age do matter. Ecol. Lett. 11, 481–489. doi: 10.1111/j.1461-0248.2008.01166.x
Claudet, J., Osenberg, C. W., Domenici, P., Badalamenti, F., Milazzo, M., Falcón, J. M., et al. (2010). Marine reserves: fish life history and ecological traits matter. Ecol. Appl. 20, 830–839. doi: 10.1890/08-2131.1
Comeau, M., Conan, G. Y., Maynou, F., Robichaud, G., Therriault, J. C., and Starr, M. (1989). Growth, spatial distribution, and abundance of benthic stages of the snow crab (Chionoecetes opilio) in Bonne Bay, Newfoundland, Canada. Can. J. Fish. Aquat. Sci. 55, 262–279. doi: 10.1139/f97-255
Copeland, A. (2006). Benthic Habitat Mapping with Multibeam Sonar in Newman Sound, Terra Nova National Park, Newfoundland. Unpublished Masters thesis, Memorial University Research Repository, Item ID: 10342. Available online at: http://research.library.mun.ca/10342/
Cote, D., Moulton, S., Frampton, P. C. B., Scrunton, D. A., and McKinley, R. S. (2004). Habitat use and early winter movements by juvenile Atlantic cod in a coastal area of Newfoundland. J. Fish Biol. 64, 665–679. doi: 10.1111/j.1095-8649.2004.00331.x
Cumming, E. H., Aksu, A. E., and Mudie, P. J. (1992). Late Quaternary glacial and sedimentary history of Bonavista Bay, northeast Newfoundland. Can. J. Earth Sci. 29, 222–235. doi: 10.1139/e92-021
DFO (2016b). Guidance on Identifying “Other Effective Area-Based Conservation Measures” in Canadian Coastal and Marine Waters. Canadian Science Advisory Secretariat. Science Advisory Report 2016/002.
DFO (2011). National Framework for Canada's Network of Marine Protected Areas. Ottawa, ON: Government of Canada.
DFO (2013). Eastport Marine Protected Areas Management Plan. Available online at: www.icomnl.ca
DFO (2014). Review of the Eastport Marine Protected Area Monitoring Indicators, Protocols and Strategies. DFO Canadian Science Advisory Secretariat Report, 2014/12.
DFO (2016a). “Seafisheries Landings,” Fisheries and Oceans Canada, last modified October 6, 2016. Available online at: http://www.dfo-mpo.gc.ca/stats/commercial/sea-maritimes-eng.htm
Eastwood, P. D., Souissi, S., Rogers, S. I., Coggan, R. A., and Brown, C. J. (2006). Mapping seabed assemblages using comparative top-down and bottom-up classification approaches. Can. J. Fish. Aquat. Sci. 63, 1536–1548. doi: 10.1139/f06-058
Edgar, G. J., Stuart-Smith, R. D., Willis, T. J., Kininmonth, S., Baker, S. C., Banks, S., et al. (2014). Global conservation outcomes depend on marine protected areas with five key features. Nature 506, 216–220. doi: 10.1038/nature13022
Ennis, G. P. (1984). Territorials behavior of the American lobster Homarus americanus. Trans. Am. Fish. Soc. 113, 330–335. doi: 10.1577/1548-8659(1984)113<330:TBOTAL>2.0.CO;2
Ennis, G. P., Collins, P. W., and Dawe, G. (1989). Fisheries and Population Biology of Lobsters (Homarus americanus) at St. Chads – Burnside, Newfoundland. Canadian technical Report of Fisheries and Aquatic Sciences; No. (1651).
Environment and Climate Change Canada (2016). Terra Nova Migratory Bird Sanctuary [Online]. Environment and Climate Change Canada– Atlantic Region. Available online at: https://www.ec.gc.ca/ (Accessed September, 2016; Modified April 25, 2016).
Fisheries Resource Conservation Council FRCC (1995). A Conservation Framework for Atlantic Lobster. Report to the Minister of Fisheries and Oceans, FRCC95.R.1, Ottawa, ON.
Gaines, S. D., White, C., Carr, M. H., and Palumbi, S. R. (2010). Designing marine reserve networks for bot conservation and fisheries management. Proc. Natl. Acad. Sci. U.S.A. 107, 18286–18293. doi: 10.1073/pnas.0906473107
Gorman, A. M., Gregory, R. S., and Schneider, D. C. (2009). Eelgrass patch size and proximity to the patch edge affect predation risk of recently settled age 0 cod (Gadus). J. Exp. Mar. Biol. Ecol. 371, 1–9. doi: 10.1016/j.jembe.2008.12.008
Government of Canada (1996). Oceans Act, c. 31. Section 35: Marine Protected Areas. Available online at: www. http://laws-lois.justice.gc.ca/
Green, A. L., Fernandes, L., Almany, G., Abesamis, R., McLeod, E., Aliño, P. M., et al. (2014). Designing marine reserves for fisheries management, biodiversity conservation, and climate change adaptation. Coast. Manage. 42, 143–159. doi: 10.1080/08920753.2014.877763
Hamilton, R. J., Potuku, T., and Montambault, J. R. (2011). Community-based conservation results in the recovery of reef fish spawning aggregations in the Coral Triangle. Biol. Conserv. 144, 1850–1858. doi: 10.1016/j.biocon.2011.03.024
Hooper, R. G. (1997). A General Coastal Marine Classification System for Newfoundland. Report for Department of Fisheries and Oceans, Habitat Management, St. John's, NL.
Hovel, K. A., and Wahle, R. A. (2010). Effects of habitat patchiness on American lobster movement across a gradient of predation risk and shelter competition. Ecology 91, 1993–2002 doi: 10.1890/09-0595.1
IUCN UNEP-WCMC (2016). The World Database on Protected Areas (WDPA) [Online]. Cambridge, UK: UNEP-WCMC. Available online at: www.protectedplanet.net (Accessed December, 2016).
Jamieson, G. S., and Lessard, J. (2001). Marine Protected Areas and Fishery Closures in British Columbia. Fisheries and Oceans Canada: Canadian Special Publication of Fisheries and Aquatic Science.
Janes, J. (2013). Eastport Marine Protected Area Monitoring Report 2012. Ecosystems Management Publication Series, Newfoundland and Labrador Region.
Janes, J. M. (2009). Assessing Marine Protected Areas as a Conservation Tool: a Decade Later, Are We Continuing to Enhance Lobster Populations at Eastport, Newfoundland? Canadian Technical Report on Fisheries and Aquatic Sciences.
Johns, P. M., and Mann, K. H. (1987). An experimental investigation of juvenile lobster habitat preference and mortality among habitats of varying structural complexity. J. Exp. Mar. Biol. Ecol. 109, 275–285. doi: 10.1016/0022-0981(87)90058-X
Kaplan, D. M., Planes, S., Fauvelot, C., Brochier, T., Lett, C., Bodin, N., et al. (2010). New tools for the spatial management of living marine resources. Curr. Opin. Environ. Sustainabil. 2, 88–93. doi: 10.1016/j.cosust.2010.02.002
Keats, D. W., Steele, D. H., and South, G. R. (1987a). Eelpout (Macrozoarces americanus (Bloch and Schneider)(Pisces: Zoarcidae)) predation on green sea urchins (Strongylocentrotus droebachiensis (OF Mull.)(Echinodermata: Echinoidea)) in eastern Newfoundland. Can. J. Zool. 65, 1515–1521. doi: 10.1139/z87-234
Keats, D. W., Steele, D. H., and South, G. R. (1987b). The role of fleshy macroalgae in the ecology of juvenile cod (Gadus morhua L.) in inshore waters off eastern Newfoundland. Can. J. Zool. 65, 49–53. doi: 10.1139/z87-008
Kittiwake Economic Development Corporation KEDC (2001). Community Based Coastal Resource Inventory (CCRI) – Bonavista and Notre Dame Bays. Prepared for the Department of Fisheries and Oceans, St. John's, NL (Unpublished).
Klein, C. J., Brown, C. J., Halpern, B. S., Segan, D. B., McGowan, J., Beger, M., et al. (2015). Shortfalls in the global protected area network at representing marine biodiversity. Sci. Rep. 5:17539. doi: 10.1038/srep17539
Kostylev, V. E., Erlandsson, J., Ming, M. Y., and Williams, G. A. (2005). The relative importance of habitat complexity and surface area in assessing biodiversity: fractal application on rocky shores. Ecol. Complex. 2, 272–286. doi: 10.1016/j.ecocom.2005.04.002
Kulka, D., Hood, C., and Huntington, J. (2007). Recovery Strategy for Northern Wolffish (Anarhichas denticulatus) and Spotted Wolffish (Anarhichas minor), and Management Plan for Atlantic Wolffish (Anarhichas lupus) in Canada. Fisheries and Oceans Canada: Newfoundland and Labrador Region. St. John's, NL.
Larocque, R., Gendron, M., and Dutil, J. (2008). A Survey of Wolffish (Anarhichas spp.) and Wolffish Habitat in Les Méchins, Quebec. Canadian Technical Report of Fisheries and Aquatic Sciences, 2786, 1–19.
Lecours, V. (2015). Terrain Attribute Selection for Spatial Ecology (TASSE), v. 1.0. Available online at: www.marinegis.com
Lecours, W., Devillers, R., Simms, A., Lucieer, V. L., and Brown, C. J. (2017). Towards a framework for terrain attribute selection in environmental studies. Environ. Modell. Softw. 89, 19–30. doi: 10.1016/j.envsoft.2016.11.027
Leenhardt, P., Cazelt, B., Salvat, B., Claudet, J., and Feral, F. (2013). The rise of large-scale marine protected areas: conservation or geopolitics? Ocean Coast. Manage. 85(Pt A), 112–118. doi: 10.1016/j.ocecoaman.2013.08.013
Lester, S. E., Halpern, B. S., Grorud-Colvert, K., Lubchenco, J., Ruttenberg, B. I., Gaines, S. D., et al. (2009). Beiological effects within no-take marine reserves: a global synthesis. Mar. Ecol. Prog. Ser. 384, 33–46. doi: 10.3354/meps08029
McLaren, B. W., Langlois, T. J., Harvey, E. S., Shortland-Jones, H., and Stevens, R. (2015). A small no-take marine sanctuary provides consistent protection for small-bodied by-catch species, but not for large-bodied, high-risk species. J. Exp. Mar. Biol. Ecol. 471, 153–163. doi: 10.1016/j.jembe.2015.06.002
Moland, E., Olsen, E. M., Knutsen, H., Garrigou, P., Espeland, S. H., Kleiven, A. R., et al. (2013). Lobster and cod benefit from small-scale northern marine protected areas: inference from an empirical before–after control-impact study. Proc. R. Soc. Biol. Sci. 280:20122679. doi: 10.1098/rspb.2012.2679
Moussaoui, A., and Auger, P. (2015). Simple fishery and marine reserve models to study the SLOSS problem. ESAIM Proc. Surv. 49, 78–90. doi: 10.1051/proc/201549007
Novaczek, E., Devillers, R., Edinger, E., and Mello, L. (2017). High Resolution habitat mapping to describe coastal denning habitat of a Canadian species at risk, Atlantic wolffish (Anarhichas lupus). Can. J. Fish. Aquat. Sci. doi: 10.1139/cjfas-2016-0414. [Epub ahead of print].
Rao, A. S., Gregory, R. S., Murray, G., Ings, D. W., Coughlan, E. J., and Newton, B. H. (2014). Eelgrass (Zostera marina) Locations in Newfoundland and Labrador. Canadian Technical Report on Fisheries and Aquatic Sciences, Fisheries and Oceans Canada.
Roff, C. R., and Evans, S. M. J. (2002). Frameworks for marine conservation – non-hierarchical approaches and distinctive habitats. Aquat. Conserv. Mar. Freshw. Ecosyst. 12, 635–648. doi: 10.1002/aqc.513
Rowe, S., and Feltham, G. (2000). “Eastport Peninsula lobster conservation: integrating harvester's local knowledge and fisheries science for resource co-management,” in Finding Our Sea Legs: Linking Fishery People and Their Knowledge with Science and Management, eds B. Neis and L. Felt (St. John's, NL: ISER Books), 236–245.
Soykan, C. U., and Lewison, R. L. (2015). Using community-level metrics to monitor the effects of marine protected areas on biodiversity. Conserv. Biol. 29, 775–783. doi: 10.1111/cobi.12445
Tanaka, K., and Chen, Y. (2015). Spatiotemporal variability of suitable habitat for American lobster (Homarus americanus) in Long Island Sound. J. Shellfish Res. 34, 531–543. doi: 10.2983/035.034.0238
Verfaillie, E., Doornenbal, P., Mitchell, A. J., White, J., and Van Lancker, V. (2007). The Bathymetric Position Index (BPI) as a Support Tool for Habitat Mapping. European Marine Observation and Data Network, Mapping European Seabed Habitats. Available online at: www.emodnet-seabedhabitats.eu
Wahle, R. A., and Steneck, R. S. (1992). Habitat restrictions in early benthic life: experiments on habitat selection and in situ predation with the American lobster. J. Exp. Mar. Biol. Ecol. 157, 91–114. doi: 10.1016/0022-0981(92)90077-N
Keywords: MPA, fishery closure, marine conservation, AICHI 11, Eastport, species at risk, American lobster
Citation: Novaczek E, Howse V, Pretty C, Devillers R, Edinger E and Copeland A (2017) Limited Contribution of Small Marine Protected Areas to Regional Biodiversity: The Example of a Small Canadian No-Take MPA. Front. Mar. Sci. 4:174. doi: 10.3389/fmars.2017.00174
Received: 26 January 2017; Accepted: 19 May 2017;
Published: 02 June 2017.
Edited by:
John A. Cigliano, Cedar Crest College, United StatesReviewed by:
Mark H. Carr, University of California, Santa Cruz, United StatesPatricia Briones-Fourzan, National Autonomous University of Mexico, Mexico
Copyright © 2017 Novaczek, Howse, Pretty, Devillers, Edinger and Copeland. This is an open-access article distributed under the terms of the Creative Commons Attribution License (CC BY). The use, distribution or reproduction in other forums is permitted, provided the original author(s) or licensor are credited and that the original publication in this journal is cited, in accordance with accepted academic practice. No use, distribution or reproduction is permitted which does not comply with these terms.
*Correspondence: Emilie Novaczek, ZW5vdmFjemVrQG11bi5jYQ==