 Nuno Queiroz1,2*
 Catarina Vila-Pouca3
 Ana Couto1,4
 Emily J. Southall2
 Gonzalo Mucientes1
 Nicolas E. Humphries2
 David W. Sims2,5,6*
- 1Centro de Investigação em Biodiversidade e Recursos Genéticos (CIBIO/InBIO), Universidade do Porto, Porto, Portugal
- 2The Laboratory, Marine Biological Association of the United Kingdom, Citadel Hill, Plymouth, United Kingdom
- 3Department of Biological Sciences, Macquarie University, Sydney, NSW, Australia
- 4Laboratório Marítimo da Guia, Marine and Environmental Sciences Centre, Universidade de Lisboa, Cascais, Portugal
- 5Ocean and Earth Science, National Oceanography Centre Southampton, University of Southampton, Southampton, United Kingdom
- 6Centre for Biological Sciences, University of Southampton, Southampton, United Kingdom
Advances in satellite tracking and archival technologies now allow marine animal movements and behavior to be recorded at much finer temporal scales, providing a more detailed ecological understanding that can potentially be applicable to conservation and management strategies. Pelagic sharks are commercially exploited worldwide with current concerns that populations are declining, however, how pelagic sharks use exploited environments remains enigmatic for most species. Here we analyzed high-resolution dive depth profiles of two pelagic shark species with contrasting feeding strategies to investigate movement patterns in relation to environmental heterogeneity. Seven macropredatory blue (Prionace glauca) and six plankton-feeding basking (Cetorhinus maximus) sharks were tagged with pop-off satellite-linked archival tags in the North Atlantic Ocean to examine habitat use and investigate the function of dives. We grouped dives of both species into five major categories based on the two-dimensional dive profile shape. Each dive-shape class presented similar frequency and characteristics among the two species with U- and V-shaped dives predominating. We tested the spatial occurrence of different U- and V-shape dive parameters in response to environmental field gradients and found that mean depth and mean depth range decreased with increasing levels of primary productivity (chlorophyll “a”), whereas ascent velocities displayed a positive correlation. The results suggest that a planktivore and a macropredator responded behaviourally in similar ways to environmental heterogeneity. This indicates fine-scale dive profiles of shark species with different feeding strategies can be used to identify key marine habitats, such as foraging areas where sharks aggregate and which may represent target areas for conservation.
Introduction
There are over 500 described species of shark (Compagno, 2001) that range in body size from the dwarf lantern shark Etmopterus perryi, that is ~0.18 m in length when mature, to the world's largest fish, the whale shark Rhincodon typus that reaches up to 18 m long. Sharks employ a range of feeding strategies, from macropredation biting, to ram-, suction-, and filter-feeding (Frazetta, 1994; Motta and Wilga, 2001). Whilst most sharks are trophic generalists, feeding on a broad number of prey species (Nemeth, 1997; Platell et al., 1998; Motta and Huber, 2012), filter-feeding sharks are specialists that capture zooplankton prey (Wilga et al., 2007). Nonetheless, despite marked differences in feeding behavior, recent studies have shown that some large pelagic sharks and teleost fish, including tuna and billfish, display highly conserved movement patterns that are thought primarily to represent searching and foraging behaviors (Sims et al., 2008; Humphries et al., 2010). These species were shown to switch between characteristic movement patterns as different habitat types were occupied, with movement patterns appearing to be theoretically optimal for the likely prey abundances encountered in the particular habitats (Humphries et al., 2010, 2016). However, such similarities in movement pattern in relation to environmental variations have not been studied in detail across sharks with different feeding strategies.
Technological advances of the past few decades have led to the development of a range of electronic instruments for tracking large marine predators. Archival tags, in particular, can record data at high temporal resolutions (sub-second) and have been used to determine movements and environmental preferences, identify behavioral patterns such as seasonal migrations or diel changes (Schaefer et al., 2007; Walli et al., 2009; Humphries et al., 2010; Gleiss et al., 2011b, 2013; Nakamura et al., 2011; Queiroz et al., 2012; Afonso and Hazin, 2015; Campana et al., 2015) and also, understand the underlying observed spatial dynamics (Sims et al., 2006, 2008) and interactions with fisheries (Queiroz et al., 2016). Linking movement patterns to habitat use remains, however, a challenging task. Detailed records of prey abundance and distribution and accurate indices of feeding are difficult to obtain for the majority of species and although visual assessment of prey capture is possible for some species (Seminoff et al., 2006; Elliott et al., 2008), in most cases, indirect parameters have been used as a proxy (e.g., gastric or visceral temperature changes, mouth/beak opening or head/jaw movement, accelerometer signatures; Sepulveda et al., 2004; Gleiss et al., 2011a, 2013; Nakamura et al., 2011, 2015; Carroll et al., 2014; Nakamura and Sato, 2014). For efficient foraging by predators, patterns of habitat use are assumed to reflect the distribution, density and quality of prey resources (Stephens and Krebs, 1986; Austin et al., 2006; Carroll et al., 2017). Therefore, horizontal and vertical movements of marine predators in addition to the frequency of dives, their persistence and other characteristics are expected to be related to distinct activities such as foraging or traveling (e.g., Horodysky et al., 2007; Thomson et al., 2011; Dragon et al., 2012). For example, plankton-feeding basking sharks Cetorhinus maximus tracked at the surface when foraging were shown to spend about twice as much time feeding in areas where the densities of zooplankton were about three times greater; in contrast, when zooplankton levels fell below a lower threshold density sharks ceased feeding and moved to other locations on straighter, non-meandering courses (Sims and Quayle, 1998).
Two-dimensional dive profiles may appear simplistic in their depiction of a behavior that occurs in a three-dimensional (3D) environment, but they have been shown to provide valuable information on the behavior of diving animals (Bost et al., 2007). Two fundamental dive types have been identified in several species based on their distinctive “V” and “U” shapes, and have been observed for pinnipeds (e.g., Beck et al., 2003; Halsey et al., 2007), marine turtles (e.g., Hochscheid et al., 1999; Seminoff et al., 2006) and seabirds (e.g., Tremblay and Cherel, 2000; Cook et al., 2011) to fish (e.g., Horodysky et al., 2007; Houghton et al., 2009). For these predators, V-shaped dives are thought to correspond to transiting or prey searching behaviors: by swimming up and down through the water column, thus crossing between different depth layers, animals may increase the probability of detecting olfactory cues, since odor trails essentially propagate in the ocean horizontally (Carey and Scharold, 1990; Pade et al., 2009). On the other hand, U-shaped dives are thought to typify foraging behavior. The time an optimally foraging animal spends in a specific area is assumed to be related to its prey richness (Stephens and Krebs, 1986; Mori et al., 2005), hence U dives are thought to correspond to prey patch exploitation because this type is characterized by a bottom phase of prolonged duration at a relatively constant depth, likely reflecting foraging on aggregated prey patches (Austin et al., 2006). Indeed, some studies in pinnipeds and penguins have shown a positive correlation between food intake and high duration of the bottom phase in U-shaped dives (Carroll et al., 2014; Viviant et al., 2014). Whale sharks have also been found to dive at steeper angles during U-shaped dives, thus maximizing time foraging in a horizontally restricted area (Gleiss et al., 2011b). In general, this supports the hypothesis that dive characteristics, such as bottom duration or depth, may reflect the distribution of prey resources (Lesage et al., 1999; Baechler et al., 2002).
The majority of studies on dive shape classification have been conducted with air-breathing vertebrates (pinnipeds, cetaceans, turtles and seabirds), and only a few have focused on predatory fish. This is most likely related to the difficulty of identifying individual dives in the time series of pelagic fish, since they spend most of their time, if not all, below the sea surface and may not regularly ascend to the surface (Wilson and Block, 2009). Nevertheless, with the increasing sophistication of tags deployed on pelagic fish, a growing number of studies indicate that significant patterns of vertical behavior exist in large pelagic fish and, thus, should be equally good candidates to explore habitat utilization using dive shape analysis (Horodysky et al., 2007; Wilson and Block, 2009).
Two main approaches have been used to classify the 2D shape of dives, either manual classification (e.g., Hochscheid et al., 1999; Hassrick et al., 2007; Schaefer et al., 2007; Wilson and Block, 2009) or non-visual statistical methods such as cluster analysis, artificial neural networks, principal components analysis, discriminant function analysis or random-forest algorithm, among others (e.g., Schreer and Testa, 1996; Beck et al., 2003; Davis et al., 2003; Mcintyre et al., 2011). Even though statistical techniques are considered more efficient for analysing large data sets, a manually classified training sample is usually required to generate or validate the classification functions, becoming substantially more complex and requiring considerable effort and statistical knowledge to design and develop the best approach (Halsey et al., 2007; Cook et al., 2011). The visual categorization of dives is more simplistic, essentially considering the time-depth shape of the dive. However, this approach can be as valuable in identifying characteristics in dives that might represent important behavioral indicators and which may be missed by statistically driven automated methods (Schreer and Testa, 1996; Malcolm and Duffus, 2000; Wilson and Block, 2009).
Analysing dive data from two shark species with highly divergent feeding strategies would test the general validity of the dive-shape approach for identifying foraging during dives by pelagic sharks. The basking shark is the second largest fish species and broadly occurs in boreal to warm-temperate seas of the continental and insular shelves circumglobally (Compagno, 2001). Basking sharks are apex predators in a relatively short food chain (phytoplankton-zooplankton-shark) and feed by forward swimming with a widely opened mouth to overtake particulate zooplankton, a strategy known as ram filter feeding (Sims, 2000). The short food chain thus offers the potential for linking pelagic shark movements to prey fields directly (Sims and Quayle, 1998; Sims et al., 2006), or at least to other environmental gradients thought to be closely correlated with zooplankton density, e.g., chlorophyll “a” and phytoplankton (Sims et al., 2003). This is not generally possible for pelagic macropredatory sharks because environmental fields of their schooling fish prey for example are very difficult to obtain over sufficiently large scales to support analysis in relation to pelagic shark movements and behavior (for exceptions see Makris et al., 2006, 2009). Previous biotelemetry studies in the North Atlantic have revealed that basking sharks undertake extensive horizontal and vertical movements associated with oceanic and inner-shelf frontal zones, areas typically characterized by high primary production and zooplankton densities (Sims et al., 2003; Skomal et al., 2009; Curtis et al., 2014; Doherty et al., 2017), and also highlighted behavioral shifts in vertical movements linked to changes in the behavior of zooplankton (Sims et al., 2005). In contrast to filter feeding, the blue shark (Prionace glauca) is an oceanic, ram-feeding macropredator occurring in all tropical and temperate seas; in the Atlantic Ocean, blue sharks range from Newfoundland to Argentina in the west, over the entire mid-Atlantic, and from Norway to South Africa in the east (Compagno, 1984; Motta and Huber, 2012). Similarly, past biologging studies have shown that tracked blue sharks display large-scale movements with increased residence in productive frontal areas and also structure vertical activity patterns in response to particular habitat types (Campana et al., 2011; Queiroz et al., 2012, 2016; Vandeperre et al., 2014), whilst occupying an extensive vertical depth range (deepest record to date is 1706 m, this study; Figure S1).
The ability to detect potential foraging areas by analysing the types and distributions of dive profiles (shapes) can be a valuable tool to identify key marine habitats. Therefore, using archival data from pop-off satellite-linked archival transmitter (PSAT) tags deployed on blue and basking sharks in the North Atlantic Ocean, the present study aimed to (1) characterize the 2D shape of dives performed by both species and, (2) analyse the relationship between specific dive characteristics and oceanographic gradients.
Methods
Archival Tagging
Blue and basking sharks were tagged with PSAT tags in the North Atlantic Ocean (basking sharks with PAT versions 2 to 4 and blue sharks with Mk10 tags; Wildlife Computers, WA, USA). Basking sharks (n = 25) were tagged between May 2001 and June 2004 in two locations: the English Channel off Plymouth and in an area comprising Lower Loch Fyne and the northern Clyde Sea, Scotland; blue sharks (n = 43) were tagged between July 2006 and August 2011 in three main areas: the English Channel off south-western England, in the mid-Atlantic region and in the north-western Atlantic. Detailed capture and tagging methods used for all basking and blue sharks S7–S10 (between 2006 and 2009) are described in Sims et al. (2003) and Queiroz et al. (2012), respectively. All tagging procedures were approved by the Marine Biological Association (MBA) Animal Welfare and Ethical Review Body (AWERB) and licensed by the UK Home Office, English Nature and Scottish Natural Heritage. During 2010 and 2011 blue sharks were captured in international waters using a commercial longline and tagged in a vertical position alongside the vessel, with the tags attached with a monofilament loop through the first dorsal fin. All tags incorporated a data logger that recorded pressure, water temperature and light-level. These parameters were sampled at varying intervals (1 min for C. maximus and from 1 to 10 s for P. glauca). Tags were programmed to detach from the shark at a pre-designated time. The full archival data set was only accessible when the tags were physically retrieved, which occurred for a total of six basking and seven blue sharks (Table 1).
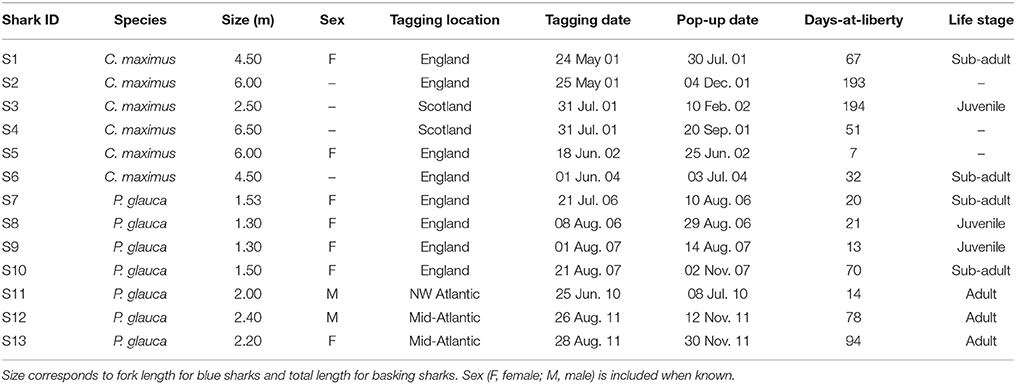
Table 1. Summary data of the six basking and seven blue sharks from which archival tags were recovered.
Track Geolocation
Track reconstruction was estimated using archived light-level data after the tags were recovered; the geolocation procedure for basking sharks was previously described by Sims et al. (2003). In short, daily maximal rates of change in light intensity were used to estimate the local time of midnight or midday for longitude calculations (inconsistent longitude estimates resulting from dive-induced light-intensity changes, as well as consecutive longitude estimations >3° apart, were discarded). Latitude was then estimated along the longitude, by matching minimum and maximum water temperatures recorded by the tag to sea surface temperature (SST) values on remote-sensing images. The final estimated geolocations were then filtered for depth or swim-speed anomalies (maximum dive depth recorded for the day of each position was compared with the known seabed depth on that position; distance between consecutive positions was also analyzed by a speed filter). To obtain a regular time series, gaps between consecutive dates in the raw tracking data were linearly interpolated to one position per day. The movement of tagged blue sharks was initially reconstructed using software provided by the manufacturer (WC-GPE, global position estimator program suite). Anomalous longitude estimates resulting from dive-induced shifts in the estimated timings of dawn and dusk from light curves were automatically discarded from the dataset using software provided by the manufacturer (WC-GPE); latitude estimates were subsequently iterated for the previously obtained longitudes. An integrated state-space model [unscented Kalman filter—UKFSST (Lam et al., 2008) using spatially complete NOAA Optimum Interpolation Quarter Degree Daily SST Analysis data] was then applied to correct the raw geolocation estimates and obtain the most probable track. A regular time-series of locations was estimated using a continuous-time correlated random walk Kalman filter [Johnson et al. (2008); using code written for R (crawl package)]. UKFSST geolocations were parameterized with standard deviation (SD) constants (K) which produced the smallest mean deviation from concurrent Argos positions as described by Sippel et al. (2011).
Dive Profile Analysis
Visualization and analyses of the time series of depth data were performed in R, using both the diveMove package and custom-written programming routines. Depth data were routinely corrected for pressure-sensor drift assuming that the minimum depth recorded by the sensor represented the surface. Dives were defined as starting when the fish descended below a depth of 10 m for basking sharks and 50 m for blue sharks; a depth threshold was necessary to avoid classifying between-dive surfacing events as dives (which are not restricted to the surface in gill-breathers). The threshold value was different between species because blue sharks exhibited constant ranging behavior in the top 50 m, whereas basking sharks remained closer to the surface, similar to whale sharks (Thums et al., 2013).
From a primary visual examination of the two-dimensional dive time series, along with a literature review (e.g., Seminoff et al., 2006; Wilson and Block, 2009; Cook et al., 2011; Thomson et al., 2011), standard dive shape classes consistently performed by the sharks were defined (Figure 1) and were afterwards visually assigned to every dive. Briefly, U-shaped dives were square or parabolic, with well-defined descent and ascent phases and a distinct, relatively flat bottom phase. V-shaped dives had very little time spent at maximum depth of the dive prior to ascent. W-shaped dives presented 2–4 undulations during the bottom phase (depth change >10% of maximum dive depth and depth difference between the peaks <20% of maximum dive depth). LV-shaped dives (“left-V”) consisted of a V-dive with a “stop” phase in the ascent (steep descent and a brief initial ascent followed by a clear “stop” in ascent, where it remained at a relatively constant depth, and a steep final ascent to the surface), whereas RV-shaped dives (“right-V”) were the reverse of LV (brief initial descent followed by a clear “stop” and a steep final descent to the maximum depth prior to ascent). Dives that did not conform to any of these five types were assigned to a sixth class designated as “Other.” Shape classification was always performed by the same person and conducted blind without previous knowledge of the geolocation data associated with each dive. The following dive statistics were assessed for each dive: dive duration; bottom phase duration; bottom phase mean depth; maximum depth; mean depth of the “stop” in ascent or descent phase, for LV- and RV-shaped dives, respectively; descending and ascending speeds. For each individual shark, a transition matrix showing the probability of changing from one dive shape class at time t to any other at time (t + 1) was then calculated using a custom made routine in R software. Transition matrices are used to assess whether there was temporal correlation in dive classes, or if they were performed randomly in time.
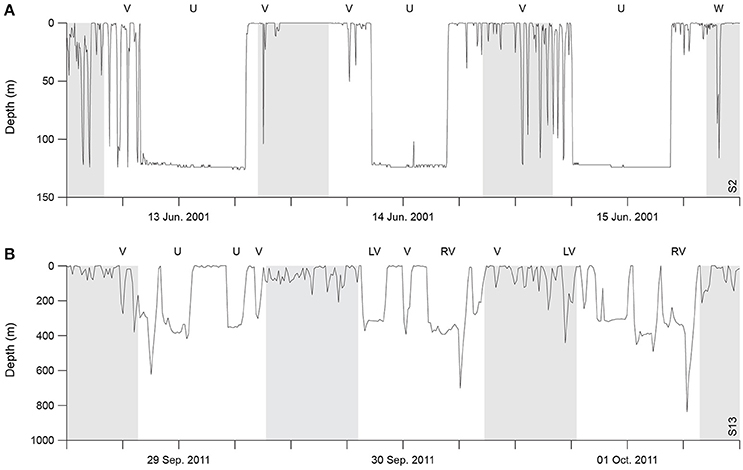
Figure 1. Time-depth profiles of the five dive shape classes considered in this study. The dive classes were commonly performed by both basking (A) and blue (B) sharks; shaded areas denote night-time.
Spatial Integration of Dive Profiles
To account for the spatial error inherent to light-level geolocations, daily regular time series were randomly resampled (100 times) along reported longitudinal and latitudinal Gaussian error fields; 0.89° and 0.50° in longitude, and 1.47° and 0.56° in latitude, for basking and blue sharks, respectively (Teo et al., 2004; Sippel et al., 2011). To test whether U- and V-shaped dives were linked to foraging, resampled geolocations (100 replicates for each tracked shark) were then combined with satellite-derived monthly merged chlorophyll “a” levels (used as a proxy for prey density; 0.25° spatial resolution), acquired from GlobColour (European Space Agency, ESA) and a daily mean value calculated. Similarly, daily averages of the dive statistics obtained in the previous section were calculated, with the exception of dive duration and bottom phase duration for which total (accumulated) time was estimated. To analyse the spatial relationship between primary productivity [chlorophyll “a” (CHL) levels] and estimated parameters of U- and V-shaped dives, Generalized Linear Mixed Model (GLMM) analysis with penalized Quasi-Likelihood parameter estimation (PQL; to account for non-normal error distributions) was used (Venables and Ripley, 2002; Austin et al., 2006). Even though there are several methods of inference in GLMMs, the PQL approach is the most commonly used (Bolker et al., 2009; Jang and Lim, 2009) so was employed here. The U- and V-shaped dives were chosen for this analysis due to their high prevalence in the time series (Figure S2).
In each model, individual sharks (shark ID) was set as a random factor, while CHL and dive parameters were set as fixed effect factors. An autocorrelation structure of order 1 (corAR1) was used to account for the temporal correlation in the dataset (Zuur et al., 2009). For U-shape dives the tested parameters were: accumulated bottom phase duration, bottom phase mean depth and SD, mean descent and ascent speeds. Since V-shaped dives have reduced or absent bottom phases, the variables tested for this type were: accumulated dive duration, maximum depth and SD, mean descent and ascent speeds. Since model residuals were not homoscedastic, both independent (CHL) and dependent (dive parameters) variables were log transformed (log10(x+1)) and the model refitted to stabilize the variance (Zuur et al., 2009; Figure S3). GLMM models were fitted with a normal (Gaussian family) distribution. Finally, to evaluate model performance the concordance index (C-index; Harrell et al., 1984) was calculated using R (Hmisc package). The C-index estimates the probability of concordance between predicted and observed responses and varies between 0.5 and 1.0 with the following classification: excellent concordance >0.9; good, 0.9–0.8; reasonable, 0.8–0.7; poor, 0.7–0.6, and unsuccessful 0.6–0.5 (Swets, 1988). Model results are given in the following format: β ± SD, P, C-index, where β is a measure of the slope of the relationship.
Results
Fine-scale archival records were successfully obtained for seven blue and six basking sharks (Table 1; Figure 2). However, horizontal movements were reconstructed for a total of four basking sharks since shark #4 and #6 remained in the proximity of the tagging area (the Clyde Sea and off Plymouth, respectively) for the tracking duration. The retrieved data comprised a total of 544 tracking days for basking sharks and 310 days for blue sharks. Tagged basking sharks ranged in length from 2.5 to 6.5 m (total length), with only two females being sexed with certainty. A total of five female and two male blue sharks were tagged off south-west England, near the mid-Atlantic ridge and in the western North-Atlantic, with body-lengths ranging from 1.3 to 2.2 m and 2.0 to 2.4 m (fork length), for females and males respectively.
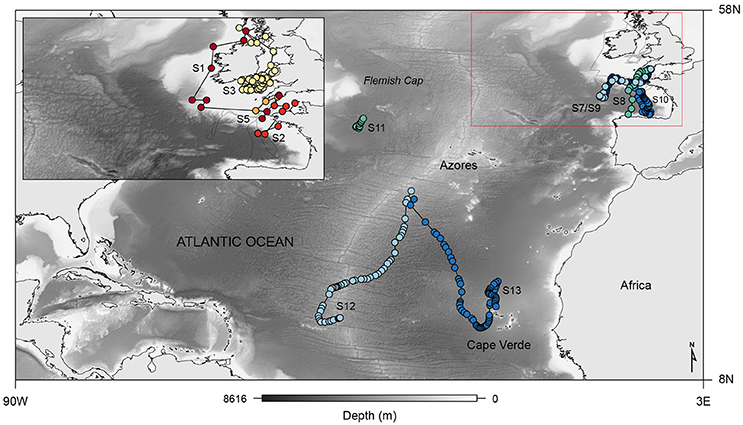
Figure 2. Map showing the general movement patterns of four basking (S1, S2, S3, and S5; top-left inset) and seven blue (S7–S13) sharks tagged with PSAT tags from which archival data was retrieved, overlaid on bathymetry; red box outlines the eastern North Atlantic area, which is shown in detail in the upper left corner.
Dive Shape Characterization
A total of 7,207 individual dives were identified for the tracked basking sharks, which performed on average 22.85 ± 11.50 dives per day (range: 12.92–37.19). Blue sharks performed a total of 6,479 dives (mean of 21.89 ± 9.34 dives per day; range: 9.64–38.27). Dives were categorized into five general types common to all basking and blue sharks, labeled U-, V-, W-, LV-, and RV-shaped dives (Figure 1). Overall, the frequency of total dive time for each dive shape were similar between the two species (Figures 3A,B). U- and V-shaped dives were the most commonly performed by both species (~70% of the total number of dives). V-shaped dives alone represented 49 and 42% of total dives in frequency for basking and blue sharks respectively. The V-shaped dives accounted for a low percentage of total dive time, whereas U-shaped dives comprised ~60% of dive time in both species. W, LV, and RV dives each represented <5% by frequency and <8% of total dive time in both basking and blue sharks. Irregular dives (class “Other”) represented around 17 and 20% of dives in frequency, and 24 and 10% in proportion of dive time, for basking and blue sharks respectively. It is also noteworthy that three basking sharks spent large amounts of time continuously submerged at depth and hence, no discrete dives were identified during such periods.
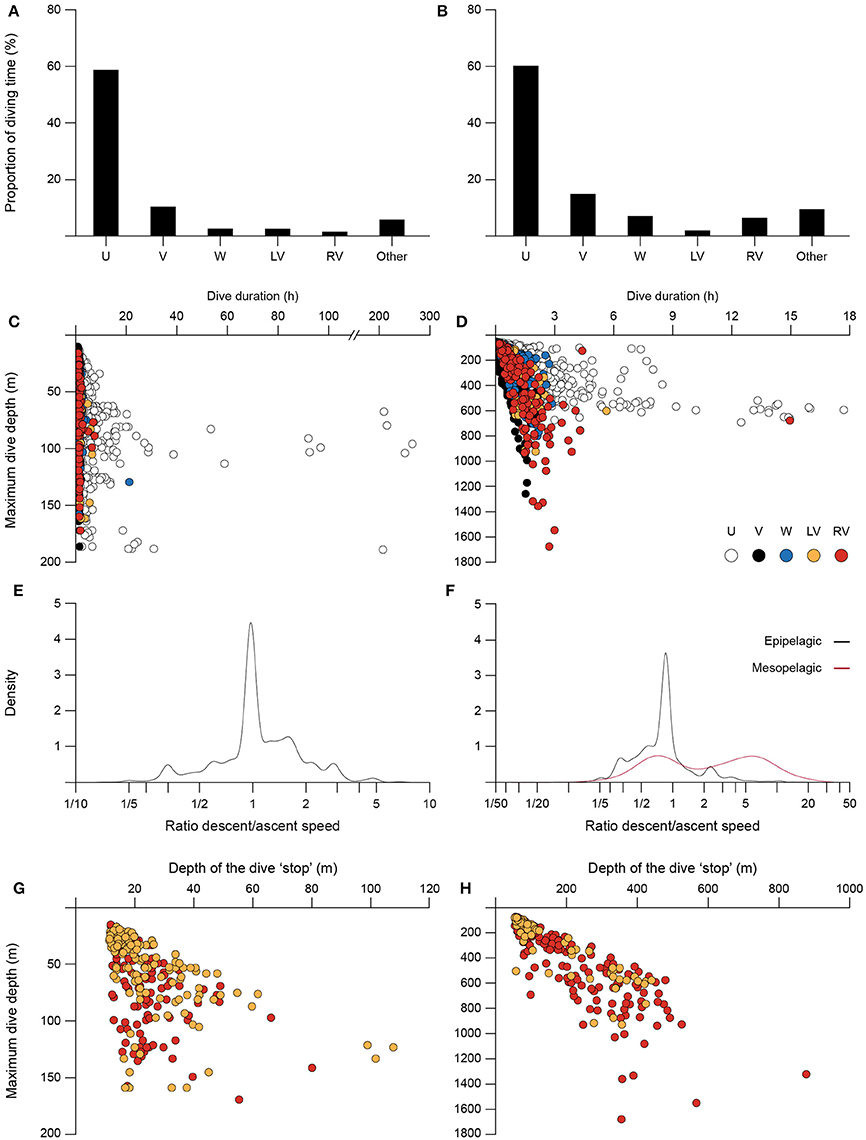
Figure 3. General characteristics of the five dive shape classes, using pooled data of all basking and blue sharks. Basking (A) and blue (B) sharks' average proportion of diving time spent performing each dive class. Maximum dive depth as a function of total dive duration for basking (C) and blue (D) sharks, color-coded by dive shape (each point corresponds to a single dive). Density distributions of the ratio descent/ascent speed for V-shaped dives of basking (E) and blue (F) sharks; blue sharks epipelagic (0-200 m; black) and mesopelagic (>200 m; red) dives are represented as separate groups. Maximum dive depth as a function of mean depth of the “stop” phase for LV- and RV-shaped dives of basking (G) and blue (H) sharks (each point corresponds to a single dive).
Characteristics of the dive classes for the two species are given in Figures 3C–H. U dives represented the longest dive durations in both species, with some dives extending for several hours (up to a few days in basking sharks; Figures 3C,D). While in basking shark dives (including U-shaped) were performed to a wide range of depths, from the top 10 m to almost 200 m, in blue sharks U dives displayed the shortest range in maximum dive depth. V-shaped dives were very similar in the two species, being generally short (<2 h) but representing an extensive depth range, to a maximum of 184 m in basking sharks and 1,260 m in blue sharks (Figures 3C,D). W, LV and RV dives showed intermediate duration and maximum depth ranges when compared to U or V dives, except for blue sharks' RV dives which had the largest depth range (max. 1,679 m; Figure 3D). Although during V-shaped dives vertical velocities up to about 4.9 m s−1 were occasionally observed in blue sharks, in general, velocities were lower for both blue and basking sharks (0.33–0.80 m s−1 for blue; 0.17–0.32 m s−1 for basking). No statistical differences were found between descent/ascent velocities for both basking sharks and epipelagic dives (0–200 m) in blue sharks (t-test for unequal variances, p > 0.05); for both species the descent/ascent ratio was close to 1 (Figures 3E,F). However, significant differences were observed in blue sharks when comparing the descent/ascent velocities in mesopelagic (>200 m) V dives, with deeper dives having greater descent velocities (Figure 3F, mesopelagic mean ratio = 4.33; t-test for unequal variances, t = 5.92, p < 0.05).
With regards to LV and RV dives, we found a significant positive correlation for both species between the mean depth of the “stop” phase in ascent or descent, respectively, and the maximum depth of the dive (basking sharks, Figure 3G; LV-shaped: Spearman's rank correlation coefficient ρ = 0.68, p < 0.001, n = 139; RV-shaped: ρ = 0.55, p < 0.001, n = 141; blue sharks, Figure 3H; LV-shaped: ρ = 0.90, p < 0.001, n = 85; RV-shaped: ρ = 0.89, p < 0.001, n = 173).
Transition matrices, with estimated probabilities of changing from one dive class to another over time, showed temporal autocorrelation in dive shape classes and, strikingly, transition probabilities were similar for both species (Tables 2, 3). When exhibiting U shaped dives a shark would most likely continue performing the same type, but, if it changed, it would switch to a V dive. Sharks performing V-shaped dives were expected to remain displaying this class, and if they changed it would likely be to a U-shaped dive. W, LV, and RV dives were almost always followed by V dives, and less frequently by U shaped or irregular dives. Irregular dives were usually performed consecutively, or followed by V and also U dives. Moreover, temporal autocorrelation in dive shape classes was also observed.
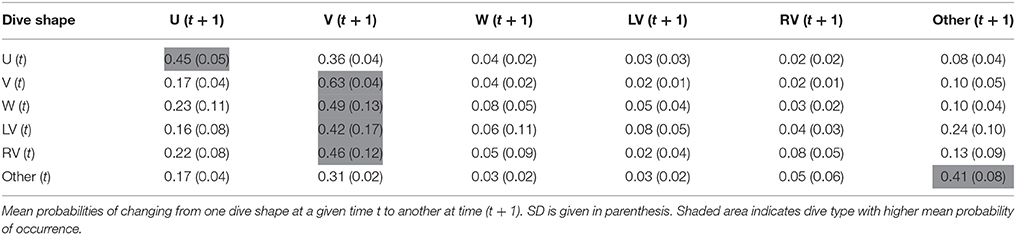
Table 2. Transition matrix averaged for the six basking sharks.
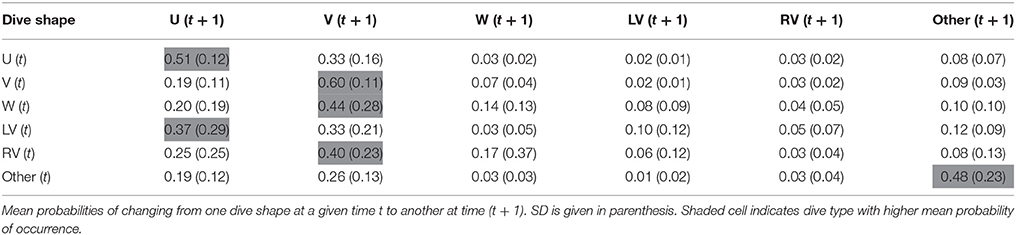
Table 3. Transition matrix averaged for the seven blue sharks.
Spatial Distribution of Dive Shapes
Overall, we found similar patterns in the variation of dive parameters for both blue and basking sharks when moving between habitats with different primary production (and likely with different prey distributions). GLMM analysis showed that U-shaped mean bottom depth and SD, V-shaped mean maximum depth and SD were significantly and negatively affected by CHL levels (Figure 4; Table 4). Moreover, ascent rates (for both species and regardless of dive type) significantly increased with increasing levels of CHL. Descent rates in blue sharks were negatively influenced by CHL levels, whereas, for basking sharks, descent speeds showed no variation in U-shape dives but tended to increase with CHL concentration in V-shaped dives (Figure 5). Finally, CHL levels had no effect on the bottom/dive time duration in basking sharks but had a weak positive effect on the bottom phase duration of U-shaped dives and a negative effect on the V dive's duration in blue sharks (Table 4). In general, model performances were moderate to low.
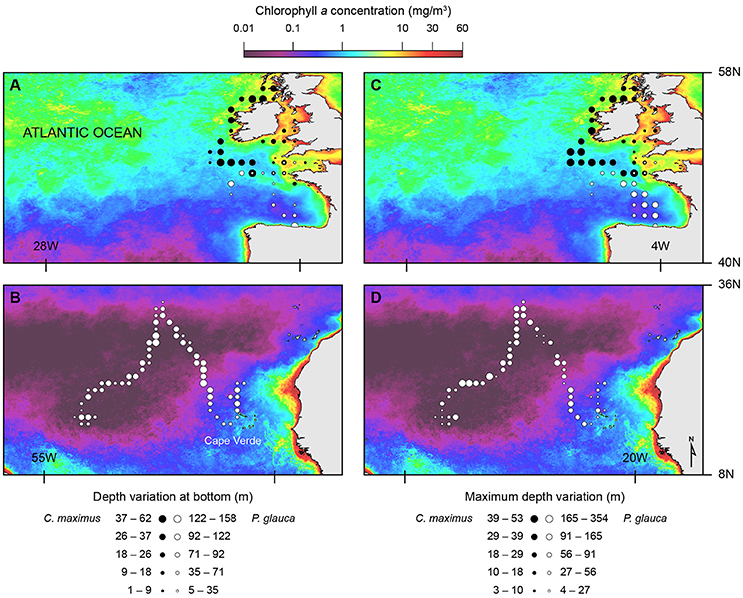
Figure 4. Spatial distribution for two dive parameters overlaid on chlorophyll a mean concentration (2001-2011). Depth variation at bottom phase of U-shaped dives (A,B) and maximum depth variation of V-shaped dives (C,D) for basking (black circles) and blue (white circles) sharks.
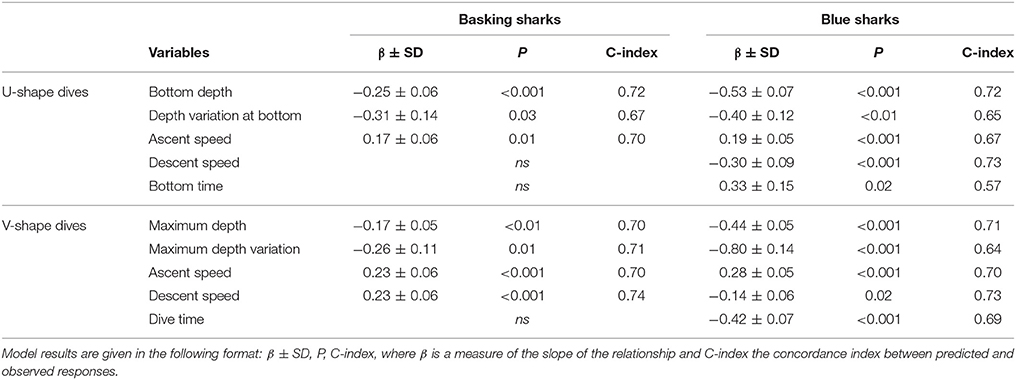
Table 4. Results of the GLMM model for different U and V dive parameters for basking (left) and blue (right) sharks.
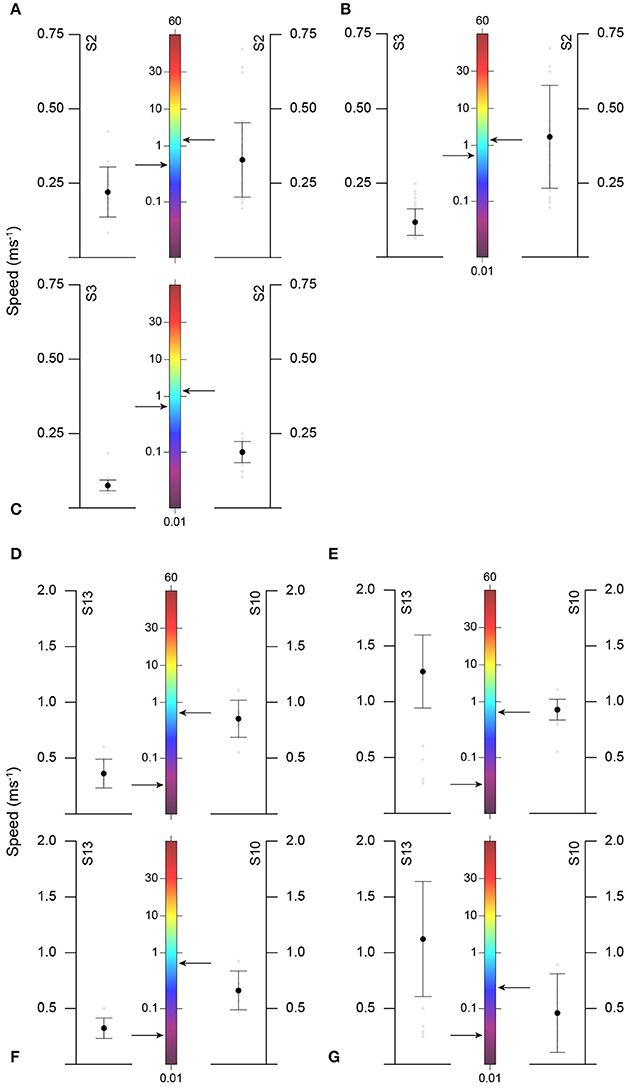
Figure 5. Comparison of mean (± SD) ascent and descent speeds of basking (A–C) and blue (D–G) sharks with chlorophyll a mean concentration (arrow) for different time periods/sharks. Ascent speeds for V- (A,D) and U-shaped (C,F) dives; Descent speeds for V- (B,E) and U-shaped (G) dives.
Discussion
The majority of the 7,207 individual dives could be grouped into five common categories, which represented similar characteristics for the two species studied. Results showed that U-shaped (typically of extended duration; up to several hours or days) and V-shaped dives (of short duration; <2 h) accounted for ~70% of all dives performed by blue and basking sharks. Descent/ascent speed ratios during V-shaped dives were generally low for both species, but high speeds of about 4.9 ms−1 were observed in blue sharks. Additionally, characteristics of U- and V-shaped dives also changed with environmental field gradients, with mean depth and changes in mean depth generally decreasing with increasing levels of chlorophyll, whereas ascent speeds displayed a positive correlation.
Dive Shape Characterization
All dive shape classes observed here have been previously identified for several diving species (e.g., Tremblay and Cherel, 2000; Baechler et al., 2002; Seminoff et al., 2006; Dragon et al., 2012; Viviant et al., 2014). However, most studies, and particularly the few conducted thoroughly on pelagic fish (Horodysky et al., 2007; Wilson and Block, 2009), have focused mainly on the two most frequent U and V-shaped dive types. In our study, U and V dives were also the most commonly performed by both blue and basking sharks. U dives alone comprised a very high proportion of total diving time in all individuals and were generally performed consecutively and often over several days. Both species displayed U dives of prolonged bottom phase, sometimes extending for several hours (or days in basking sharks), which were typically performed within a uniform depth layer (see section below). It is likely that the U-shaped dives of both species were linked to foraging on aggregated prey patches at depth. This interpretation is supported by theoretical expectations and empirical results from previous studies.
According to optimal foraging theory, the time a forager spends in a specific prey patch is likely related to its richness (Stephens and Krebs, 1986). Likewise, previous studies demonstrate that at small spatial scales tracked basking sharks were found to filter-feed selectively on the richest, most profitable plankton patches, choosing to remain longer in areas that contained the highest densities of zooplankton available in the area, namely of large species such as Calanus sp. (Sims et al., 1997; Sims and Quayle, 1998). Moreover, a positive correlation between prey intake and duration of the bottom phase has also been found for harbor seals (Phoca vitulina; Baechler et al., 2002) and for penguins (Carroll et al., 2014). Although other functions, such as resting and traveling, have been proposed for U-shaped dives in marine turtles and seals (Hochscheid et al., 1999; Baechler et al., 2002; Seminoff et al., 2006), such dive functions seem to be less likely to apply to large predatory fish. U-shaped dives confined to a certain depth for extended periods of time have been observed in white marlin Kajikia albida (Horodysky et al., 2007) and Atlantic bluefin tuna Thunnus thynnus Wilson and Block (2009), associated with exploiting aggregated prey. Taken together, our results suggest U-shaped dives of tracked basking and blue sharks emerged when sharks dived and remained at a specific depth, most likely to forage on prey aggregated in discrete horizontal layers.
V-shaped dives, with short durations at depth, are thought to correspond to exploratory or transiting behaviors (Horodysky et al., 2007; Wilson and Block, 2009; Gleiss et al., 2011b, 2013). It is likely that, by swimming up and down through the water column and crossing between different depth layers, foraging sharks may increase the probability of detecting olfactory cues, since odor trails propagate in the ocean in a horizontal plane owing to current shear between different density layers (Carey and Scharold, 1990; Pade et al., 2009). Moreover, V dives of basking and blue sharks in this study were performed to a wide range of depths, further suggesting an exploratory function. Blue sharks are known to feed on several squid species, including bathypelagic species such as vampire squid Vampyroteuthis infernalis and Mastigoteuthis sp. (N. Queiroz et al., unpublished data). Some of these species often remain motionless or weakly swimming in the water column (Seibel et al., 1997). Consequently, blue sharks may be able to feed on them while performing deep, fast movements through the water column. In fact, burst swimming and prey capture events were observed during consecutive V-shaped dives (“yo-yo”) in tiger sharks (Nakamura et al., 2011).
Initial studies suggested that V dives were also linked to energy saving strategies; by swimming at slow speeds during the descent (taking advantage of buoyancy to glide) and ascending with higher locomotory activity, negatively buoyant animals would minimize the cost of travel (Weihs, 1973; Holland, 1990). However, in the current study, descent/ascent velocities ratio of blue sharks changed from 1 to higher values (up to 40-fold higher descent than ascent velocities) in V-shaped dives below the epipelagic area, with similar dives being observed for blue, mako and tiger sharks (Carey and Scharold, 1990; Sepulveda et al., 2004; Nakamura et al., 2011). Taken together, these results suggest that energy saving is not the primary explanation of V dives (Nakamura et al., 2011). Oscillatory swimming has also been related to thermoregulation; for example, whale sharks have been found to adjust time spent near the surface to regain heat lost during repeated excursions to deep, colder water (Thums et al., 2013). A final interpretation is linked to a potential role of V-shaped dives in navigation through the detection of magnetic fields, or sensing different water masses for directional information (Klimley et al., 2002). Nevertheless, regardless of the functions proposed, this dive type was commonly performed by both blue and basking sharks, suggesting that it may be a ubiquitous search strategy exhibited by both epipelagic planktivores and macropredators (Gleiss et al., 2011a).
W-shaped dives generally occurred coupled with V dives and presented similar depth distributions, implying that both dives types are associated with the same behavior and may have similar functions (Dragon et al., 2012). In fact, Baechler et al. (2002) suggest that V and U are primary dive shapes and that other dive types are simple variations, differing in descent or ascent ratio, presence of undulations, maximum depth or dive duration. LV-shaped dives consisted of a V-dive with a “stop” phase in the ascent. This class of dive has been described in studies analysing the diving profiles of green Chelonia mydas and loggerhead Caretta caretta turtles (Hochscheid et al., 1999; Seminoff et al., 2006; Thomson et al., 2011). An additional type was observed in the present study, herein designated an RV-shaped dive, which is a mirror image of LV, having the “stop” phase during the descent. It is worth noting that this shape of dive has been represented graphically, namely in the diving profile of southern elephant seals (Slip et al., 1994) and recently reported for Antarctic fur seals (Viviant et al., 2014). In blue sharks, we found that the mean depth of the “stop” phase of LV and RV dives was often similar to the mean bottom phase depth of U-shaped dives. It is therefore possible that LV and RV dives might correspond to foraging on aggregated prey at certain depth layers; hence the “stop” phase, preceding or following exploratory V-type events. Interestingly, prey capture events in Antarctic fur seals were observed during the V phase of RV dives and linked with seals pursuing prey from above as they moved into deeper waters to escape (Viviant et al., 2014). The significant positive correlation between the mean depth of the “stop” phase and the maximum dive depth detected in both classes of dives, for basking and blue sharks in this study, also indicates that additional functions may be attributed; a similar correlation was also observed by Hochscheid et al. (1999) in green turtles. The latter authors proposed that the “stop” in the ascent would serve either as stationary mid-water resting or an energy conservation strategy of transiting turtles. As mentioned above, it has been proposed that marine animals can optimize their costs of transport by taking advantage of their negative buoyancy and passively sink down to a certain depth, and then actively ascend to the surface (Videler and Weihs, 1982; Williams et al., 2000; Gleiss et al., 2011b). It is therefore possible that blue and basking sharks' LV and RV dives represent a similar energy conservation strategy. The sharks may be gliding during the “stop” phase, optimizing their locomotory movements while traveling between prey patches or exploring new habitats.
Spatial Distribution of Dive Shape and Conservation Perspectives
Large-scale frontal areas often exhibit high spatial gradients (e.g., temperature) as well as enhanced vertical circulation with such physical discontinuities often leading to increased primary productivity and prey aggregation in fronts by convergence processes (Le Fèvre, 1986; Murphy, 1995). Hence, fronts represent regions of forage accumulation (Olson et al., 1994). In the northeast Atlantic, predictable productive areas are associated with bathymetric features (e.g., shelf-edge), tidal mixing and wind-driven upwelling fronts [reviewed by Scales et al. (2014)] where top predators are known to aggregate (Tittensor et al., 2010) including the species we tracked (e.g., Sims and Quayle, 1998; Queiroz et al., 2012, 2016). In this study we found that when approaching high chlorophyll areas, both the bottom phase of U dives and maximum depth of V dives decreased, as well as the variation in targeted depth. A reduction in diving depth in regions of high surface CHL concentration has been previously observed (Dragon et al., 2010; Jaud et al., 2012) and thought to be related with greater light attenuation within the water column, allowing prey to be closer to surface. The results of the present study in two different shark species support this interpretation. Moreover, a reduced variation in the targeted bottom/maximum depth of U and V dives also suggest that prey associated with high CHL areas are found at more predictable depths and that sharks likely maximize foraging success by concentrating their activity at depths where prey may be encountered. Overall, diving speeds also increased in productive areas (with the exception of descent rates in blue sharks); indeed, intensification of search behavior is thought to be associated with encounters with high quality prey patches (Dragon et al., 2012). Higher vertical transit rates have also been linked to a greater number of prey capture attempts, and thus foraging activity, in a marine predator (Viviant et al., 2014). For blue sharks, descent speeds were greater in oligotrophic zones; quicker descent speeds likely lead to higher probabilities of detecting sparse prey (see previous section). Nonetheless, descent speeds in productive areas were similar to ascent speeds (but see Figures 5D–G) and thus, vertical movement rates for blue sharks in higher CHL concentration areas remained high.
The weak effect of increasing CHL concentrations on bottom duration was unexpected as many studies have found that most feeding events take place during the bottom phase of dives (e.g., Mori et al., 2005; Austin et al., 2006; Viviant et al., 2014). Poor model results for this parameter were likely related with inter-individual variability, which is often high in tracking studies (Queiroz et al., 2010; Viviant et al., 2014). For example, tracked blue sharks displayed extended bottom time durations in oligotrophic areas (Figure S4). If indeed bottom time is a proxy for intensive foraging, it suggests sharks were able to forage on sporadic prey aggregations. Also, basking sharks are known to feed for prolonged periods of time at the surface during spring/summer months (e.g., Sims and Quayle, 1998; Sims, 2000); in the present study, surface time duration in spring/summer (March to August) was positively influenced by higher CHL concentrations (albeit with low model performance; β ± SD = 0.69; P = 0.03; C-index = 0.54), which suggests bottom time was probably not a good foraging indicator for this species.
Inter-individual differences in behavior is critical for pelagic predators as they are subjected to variations in the distribution and availability of resources (Wilson and Block, 2009; Rayner et al., 2010). Nonetheless, despite different feeding strategies we found similar foraging tactics and spatial changes in dive shapes of basking and blue sharks which, linked with similar studies on marine mammals, birds, turtles and fish, proposes a general movement response to environmental heterogeneity.
In the current study, the occurrence of dive shapes was not random, with the different dive types frequently performed in series (transition matrix in Tables 2, 3). This indicates that the data were temporally correlated, which was also confirmed by the results of the correlogram for each variable (Figure S5). Autocorrelation is common when working with satellite tracking data and needs to be considered (Koper and Manseau, 2012). Therefore, GLMM models, similar to the one here performed, have been extensively used in tracking studies since temporal correlation can be included (e.g., Austin et al., 2006; Bailleul et al., 2007; Sleeman J. C. et al., 2010; Sleeman J. et al., 2010; Koper and Manseau, 2012; Viviant et al., 2014).
This study highlights the usefulness and applicability of using high-resolution dive data and environmental information to improve our understanding of behavioral and space use patterns at finer scales. For example, by combining dive profiles with horizontal movements and oceanographic gradients we found that blue sharks in the North Atlantic forage closer to the surface in productive areas, where surface longliners also concentrate their activities (Queiroz et al., 2012). Hence, frontal regions are areas of higher risk given the increased vertical overlap between predatory sharks and longlining hooks. Analysing dive shapes may therefore provide a significant contribution to the identification of key habitats for this species and potential marine protected areas, that can help reduce interactions with commercial fisheries and consequently reduce catch rates. It is worth noting that there are several aspects related to the shape of dive profiles, namely horizontal path and acceleration within each dive that cannot be examined when analysing archival data recorded by PSAT tags alone.
Therefore, further approaches should consider the inclusion of additional information whenever possible, such as video recordings, gastric temperature/pH changes, accelerometer data, to help us evaluate the reliability of our inferences regarding dive functions and habitat use. Moreover, further studies would allow us to understand how dive shapes could be related with other (not mutually exclusive) functions (discussed above) and assess their relative importance both inter- and intra-specifically.
Author Contributions
NQ undertook fieldwork, collected and analyzed data and co-wrote the paper. CV carried out data analysis. AC carried out data analysis. ES undertook fieldwork and collected data. GM undertook fieldwork and collected data. NH contributed to data analysis. DS undertook fieldwork, collected and analyzed data and co-wrote the paper.
Funding
Research was supported by the UK Natural Environment Research Council “Oceans 2025” Strategic Research Programme (DS), the Save Our Seas Foundation (DS), UK Department for Environment Food and Rural Affairs (Defra) (DS), a Marine Biological Association Senior Research Fellowship (DS), FEDER funds via the Operational Programme for Competitiveness Factors—COMPETE, National Funds via Fundação para a Ciência e a Tecnologia (FCT) under PTDC/MAR/100345/2008 and Compete FCOMP-01-0124-FEDER-010580 (NQ, DS), Project “Biodiversity, Ecology and Global Change” co-financed by North Portugal Regional Operational Programme 2007/2013 (ON.2—O Novo Norte), under the National Strategic Reference Framework (NSRF) via the European Regional Development Fund (ERDF) (NQ), an FCT Investigator Fellowship (IF/01611/2013) (NQ) and Isabel Barreto human resources programme of the Government of Galicia (GM).
Conflict of Interest Statement
The authors declare that the research was conducted in the absence of any commercial or financial relationships that could be construed as a potential conflict of interest.
The reviewer ACG and handling Editor declared their shared affiliation, and the handling Editor states that the process nevertheless met the standards of a fair and objective review.
Supplementary Material
The Supplementary Material for this article can be found online at: http://journal.frontiersin.org/article/10.3389/fmars.2017.00239/full#supplementary-material
References
Afonso, A. S., and Hazin, F. H. (2015). Vertical movement patterns and ontogenetic niche expansion in the tiger shark, Galeocerdo cuvier. PLoS ONE 10:e0116720. doi: 10.1371/journal.pone.0116720
Austin, D., Bowen, W. D., Mcmillan, J. I., and Iverson, S. J. (2006). Linking movement, diving, and habitat to foraging success in a large marine predator. Ecology 87, 3095–3108. doi: 10.1890/0012-9658(2006)87[3095:LMDAHT]2.0.CO;2
Baechler, J., Beck, C. A., and Bowen, W. D. (2002). Dive shapes reveal temporal changes in the foraging behaviour of different age and sex classes of harbour seals (Phoca vitulina). Can. J. Zool. 80, 1569–1577. doi: 10.1139/z02-150
Bailleul, F., Charrassin, J., Ezraty, R., Girardardhuin, F., Mcmahon, C., Field, I., et al. (2007). Southern elephant seals from Kerguelen Islands confronted by Antarctic Sea ice. Changes in movements and in diving behaviour. Deep Sea Res. II Top. Stud. Oceanogr. 54, 343–355. doi: 10.1016/j.dsr2.2006.11.005
Beck, C. A., Bowen, W. D., Mcmillan, J. I., and Iverson, S. J. (2003). Sex differences in the diving behaviour of a size-dimorphic capital breeder: the grey seal. Anim. Behav. 66, 777–789. doi: 10.1006/anbe.2003.2284
Bolker, B. M., Brooks, M. E., Clark, C. J., Geange, S. W., Poulsen, J. R., Stevens, M. H., et al. (2009). Generalized linear mixed models: a practical guide for ecology and evolution. Trends Ecol. Evol. 24, 127–135. doi: 10.1016/j.tree.2008.10.008
Bost, C. A., Handrich, Y., Butler, P. J., Fahlman, A., Halsey, L. G., Woakes, A. J., et al. (2007). Changes in dive profiles as an indicator of feeding success in king and Adélie penguins. Deep Sea Res. II Top. Stud. Oceanogr. 54, 248–255. doi: 10.1016/j.dsr2.2006.11.007
Campana, S. E., Dorey, A., Fowler, M., Joyce, W., Wang, Z., Wright, D., et al. (2011). Migration pathways, behavioural thermoregulation and overwintering grounds of blue sharks in the northwest Atlantic. PLoS ONE 6:e16854. doi: 10.1371/journal.pone.0016854
Campana, S. E., Fisk, A. T., and Klimley, A. P. (2015). Movements of Arctic and northwest Atlantic Greenland sharks (Somniosus microcephalus) monitored with archival satellite pop-up tags suggest long-range migrations. Deep Sea Res. II Top. Stud. Oceanogr. 115, 109–115. doi: 10.1016/j.dsr2.2013.11.001
Carey, F. G., and Scharold, J. V. (1990). Movements of blue sharks (Prionace glauca) in depth and course. Mar. Biol. 106, 329–342. doi: 10.1007/BF01344309
Carroll, G., Cox, M., Harcourt, R., Pitcher, B. J., Slip, D., and Jonsen, I. (2017). Hierarchical influences of prey distribution on patterns of prey capture by a marine predator. Funct. Ecol. doi: 10.1111/1365-2435.12873. [Epub ahead of print].
Carroll, G., Slip, D., Jonsen, I., and Harcourt, R. (2014). Supervised accelerometry analysis can identify prey capture by penguins at sea. J. Exp. Biol. 217, 4295–4302. doi: 10.1242/jeb.113076
Compagno, L. J. V. (1984). FAO species catalogue. Vol. 4. Sharks of the world. An annotated and illustrated catalogue of shark species known to date. Part 2. Carcharhiniformes. FAO Fisheries Synopsis 4, 251–655.
Compagno, L. J. V. (2001). Sharks of the world. An annotated and illustrated catalogue of shark species known to date. Volume 2. Bullhead, mackerel and carpet sharks (Heterodontiformes, Lamniformes and Orectolobiformes). FAO Species Catalogue for Fishery Purposes No. 1, 269.
Cook, T. R., Hamann, M., Pichegru, L., Bonadonna, F., Grémillet, D., and Ryan, P. G. (2011). GPS and time-depth loggers reveal underwater foraging plasticity in a flying diver, the Cape Cormorant. Mar. Biol. 159, 373–387. doi: 10.1007/s00227-011-1815-3
Curtis, T., Zeeman, S., Summers, E., Cadrin, S., and Skomal, G. (2014). Eyes in the sky: linking satellite oceanography and biotelemetry to explore habitat selection by basking sharks. Anim. Biotelemetry 2:12. doi: 10.1186/2050-3385-2-12
Davis, R. W., Fuiman, L. A., Williams, T. M., Horning, M., and Hagey, W. (2003). Classification of Weddell seal dives based on 3-dimensional movements and video-recorded observations. Mar. Ecol. Prog. Ser. 264, 109–122. doi: 10.3354/meps264109
Doherty, P., Baxter, J., Gell, F., Godley, B., Graham, R., Hall, G., et al. (2017). Long-term satellite tracking reveals variable seasonal migration strategies of basking sharks in the north-east Atlantic. Sci. Rep. 7:42837. doi: 10.1038/srep42837
Dragon, A. C., Bar-Hen, A., Monestiez, P., and Guinet, C. (2012). Horizontal and vertical movements as predictors of foraging success in a marine predator. Mar. Ecol. Prog. Ser. 447, 243–257. doi: 10.3354/meps09498
Dragon, A.-C., Monestiez, P., Bar-Hen, A., and Guinet, C. (2010). Linking foraging behaviour to physical oceanographic structures: Southern elephant seals and mesoscale eddies east of Kerguelen Islands. Prog. Oceanogr. 87, 61–71. doi: 10.1016/j.pocean.2010.09.025
Elliott, K. H., Woo, K., Gaston, A. J., Benvenuti, S., Dall'antonia, L., and Davoren, G. K. (2008). Seabird foraging behaviour indicates prey type. Mar. Ecol. Prog. Ser. 354, 289–303. doi: 10.3354/meps07221
Frazetta, T. H. (1994). Feeding mechanisms in sharks and other elasmobranchs. Adv. Comp. Environ. Physiol. 18, 31–57. doi: 10.1007/978-3-642-57906-6_3
Gleiss, A. C., Jorgensen, S. J., Liebsch, N., Sala, J. E., Norman, B., Hays, G. C., et al. (2011a). Convergent evolution in locomotory patterns of flying and swimming animals. Nat. Commun. 2:352. doi: 10.1038/ncomms1350
Gleiss, A. C., Norman, B., and Wilson, R. P. (2011b). Moved by that sinking feeling: variable diving geometry underlies movement strategies in whale sharks. Funct. Ecol. 25, 595–607. doi: 10.1111/j.1365-2435.2010.01801.x
Gleiss, A. C., Wright, S., Liebsch, N., Wilson, R. P., and Norman, B. (2013). Contrasting diel patterns in vertical movement and locomotor activity of whale sharks at Ningaloo Reef. Mar. Biol. 160, 2981–2992. doi: 10.1007/s00227-013-2288-3
Halsey, L. G., Bost, C. A., and Handrich, Y. (2007). A thorough and quantified method for classifying seabird diving behaviour. Polar Biol. 30, 991–1004. doi: 10.1007/s00300-007-0257-3
Harrell, F. E., Lee, K. L., Califf, R. M., Pryor, D. B., and Rosati, R. A. (1984). Regression modelling strategies for improved prognostic prediction. Stat. Med. 3, 143–152. doi: 10.1002/sim.4780030207
Hassrick, J. L., Crocker, D. E., Zeno, R. L., Blackwell, S. B., Costa, D. P., and Le Boeuf, B. J. (2007). Swimming speed and foraging strategies of northern elephant seals. Deep Sea Res. II Top. Stud. Oceanogr. 54, 369–383. doi: 10.1016/j.dsr2.2006.12.001
Hochscheid, S., Godley, B. J., Roderick, A. C., and Wilson, R. P. (1999). Reptilian diving: highly variable dive patterns in the green turtle Chelonia mydas. Mar. Ecol. Prog. Ser. 185, 101–112. doi: 10.3354/meps185101
Holland, K. N. (1990). Horizontal and vertical movements of yellowfin and bigeye tuna associated with fish aggregating devices. Fish. Bull. 88, 493–507.
Horodysky, A. Z., Kerstetter, D. W., Latour, R. J., and Graves, J. E. (2007). Habitat utilization and vertical movements of white marlin (Tetrapturus albidus) released from commercial and recreational fishing gears in the western North Atlantic Ocean: inferences from short duration pop-up archival satellite tags. Fish. Oceanogr. 16, 240–256. doi: 10.1111/j.1365-2419.2007.00419.x
Houghton, J. D. R., Liebsch, N., Doyle, T. K., Gleiss, A. C., Lilley, M. K. S., Wilson, R. P., et al. (2009). Harnessing the sun: testing a novel attachment method to record fine scale movements in ocean sunfish (Mola mola). Tagging Track. Marine Anim. Electron. Devices Rev. Methods Technol. Fish Biol. Fish. 9, 229–242. doi: 10.1007/978-1-4020-9640-2_14
Humphries, N. E., Queiroz, N., Dyer, J. R. M., Pade, N. G., Musyl, M. K., Schaefer, K. M., et al. (2010). Environmental context explains Lévy and Brownian movement patterns of marine predators. Nature 465, 1066–1069. doi: 10.1038/nature09116
Humphries, N. E., Schaefer, K. M., Fuller, D. W., Phillips, G. E. M., Wilding, C., and Sims, D. W. (2016). Scale-dependent to scale-free: daily behavioural switching and optimized searching in a marine predator. Anim. Behav. 113, 189–201. doi: 10.1016/j.anbehav.2015.12.029
Jang, W., and Lim, J. (2009). A numerical study of PQL estimation biases in generalized linear mixed models under heterogeneity of random effects. Comm. Statist. Simul. Comput. 38, 692–702. doi: 10.1080/03610910802627055
Jaud, T., Dragon, A. C., Garcia, J. V., and Guinet, C. (2012). Relationship between chlorophyll a concentration, light attenuation and diving depth of the Southern elephant seal Mirounga leonina. PLoS ONE 7:e47444. doi: 10.1371/journal.pone.0047444
Johnson, D. S., London, J. M., Lea, M.-A., and Durban, J. W. (2008). Continuous-time correlated random walk model for animal telemetry data. Ecology 89, 1208–1215. doi: 10.1890/07-1032.1
Klimley, A. P., Beavers, S. C., Curtis, T. H., and Jorgensen, S. J. (2002). Movements and swimming behavior of three species of Sharks in La Jolla Canyon, California. Environ. Biol. Fishes 63, 117–135. doi: 10.1023/A:1014200301213
Koper, N., and Manseau, M. (2012). A guide to developing resource selection functions from telemetry data using generalized estimating equations and generalized linear mixed models. Rangifer 32, 195–204. doi: 10.7557/2.32.2.2269
Lam, C., Nielsen, A., and Sibert, J. (2008). Improving light and temperature based geolocation by unscented Kalman filtering. Fish. Res. 91, 15–25. doi: 10.1016/j.fishres.2007.11.002
Lesage, V., Hammill, M. O., and Kovacs, K. M. (1999). Functional classification of harbor seal (Phoca vitulina) dives using depth profiles, swimming velocity, and an index of foraging success. Can. J. Zool. 77, 74–87. doi: 10.1139/z98-199
Makris, N. C., Ratilal, P., Jagannathan, S., Gong, Z., Andrews, M., Bertsatos, I., et al. (2009). Critical population density triggers rapid formation of vast oceanic fish shoals. Science 323, 1734–1737. doi: 10.1126/science.1169441
Makris, N. C., Ratilal, P., Symonds, D. T., Jagannathan, S., Lee, S., and Nero, R. W. (2006). Fish population and behavior revealed by instantaneous continental shelf-scale imaging. Science 311, 660–663. doi: 10.1126/science.1121756
Malcolm, C. D., and Duffus, D. A. (2000). Comparison of subjective and statistical methods of dive classification using data from a time-depth recorder attached to a gray whale (Eschrichtius robustus). J. Cetacean Res. Manage. 2, 177–182.
Mcintyre, T., Bornemann, H., Plötz, J., Tosh, C. A., and Bester, M. N. (2011). Water column use and forage strategies of female southern elephant seals from Marion Island. Mar. Biol. 158, 2125–2139. doi: 10.1007/s00227-011-1719-2
Mori, Y., Watanabe, Y., Mitani, Y., Sato, K., Cameron, M. F., and Naito, Y. (2005). A comparison of prey richness estimates for Weddell seals using diving profiles and image data. Mar. Ecol. Prog. Ser. 295, 257–263. doi: 10.3354/meps295257
Motta, P. J., and Huber, D. R. (2012). “Prey capture behavior and feeding mechanics of elasmobranchs,” in Biology of Sharks and their Relatives, 2nd Edn, eds J. C. Carrier, J. A. Musick, and M. R. Heithaus (Boca Raton, FL: CRC Press), 153–209.
Motta, P. J., and Wilga, C. D. (2001). Advances in the study of feeding behaviors, mechanisms, and mechanics of sharks. Environ. Biol. Fishes 60, 131–156. doi: 10.1023/A:1007649900712
Murphy, E. J. (1995). Spatial structure of the Southern Ocean ecosystem: predator-prey linkages in Southern Ocean food webs. J. Anim. Ecol. 64, 333–347. doi: 10.2307/5895
Nakamura, I., and Sato, K. (2014). Ontogenetic shift in foraging habit of ocean sunfish Mola mola from dietary and behavioral studies. Mar. Biol. 161, 1263–1273. doi: 10.1007/s00227-014-2416-8
Nakamura, I., Goto, Y., and Sato, K. (2015). Ocean sunfish rewarm at the surface after deep excursions to forage for siphonophores. J. Anim. Ecol. 84, 590–603. doi: 10.1111/1365-2656.12346
Nakamura, I., Watanabe, Y. Y., Papastamatiou, Y. P., Sato, K., and Meyer, C. G. (2011). Yo-yo vertical movements suggest a foraging strategy for tiger sharks Galeocerdo cuvier. Mar. Ecol. Prog. Ser. 424, 237–246. doi: 10.3354/meps08980
Nemeth, D. H. (1997). Modulation of attack behavior and its effect on feeding performance in a trophic generalist fish, Hexagrammos decagrammus. J. Exp. Biol. 200, 2155–2164.
Olson, D. B., Hitchcock, G. L., Mariano, A. J., Ashjian, C. J., Peng, G., Nero, R. W., et al. (1994). Life on the edge: marine life and fronts. Oceanography 7, 52–60. doi: 10.5670/oceanog.1994.03
Pade, N. G., Queiroz, N., Humphries, N. E., Witt, M. J., Jones, C. S., Noble, L. R., et al. (2009). First results from satellite-linked archival tagging of porbeagle shark, Lamna nasus: area fidelity, wider-scale movements and plasticity in diel depth changes. J. Exp. Mar. Biol. Ecol. 370, 64–74. doi: 10.1016/j.jembe.2008.12.002
Platell, M. E., Potter, I. C., and Clarke, K. R. (1998). Resource partitioning by four species of elasmobranchs (Batoidea: Urolophidae) in coastal waters of temperate Australia. Mar. Biol. 131, 719–734. doi: 10.1007/s002270050363
Queiroz, N., Humphries, N. E., Mucientes, G., Hammerschlag, N., Lima, F. P., Scales, K. L., et al. (2016). Ocean-wide tracking of pelagic sharks reveals extent of overlap with longline fishing hotspots. Proc. Natl. Acad. Sci. U.S.A. 113, 1582–1587. doi: 10.1073/pnas.1510090113
Queiroz, N., Humphries, N. E., Noble, L. R., Santos, A. M., and Sims, D. W. (2010). Short-term movements and diving behaviour of satellite-tracked blue sharks Prionace glauca in the northeastern Atlantic Ocean. Mar. Ecol. Prog. Ser. 406, 265–279. doi: 10.3354/meps08500
Queiroz, N., Humphries, N. E., Noble, L. R., Santos, A. M., and Sims, D. W. (2012). Spatial dynamics and expanded vertical niche of blue sharks in oceanographic fronts reveal habitat targets for conservation. PLoS ONE 7:e32374. doi: 10.1371/journal.pone.0032374
Rayner, M. J., Hartill, B. W., Hauber, M. E., and Phillips, R. A. (2010). Central place foraging by breeding Cook's petrel Pterodroma cookii: foraging duration reflects range, diet and chick meal mass. Mar. Biol. 157, 2187–2194. doi: 10.1007/s00227-010-1483-8
Scales, K. L., Miller, P. I., Hawkes, L. A., Ingram, S. N., Sims, D. W., Votier, S. C., et al. (2014). On the front line: frontal zones as priority at-sea conservation areas for mobile marine vertebrates. J. Appl. Ecol. 51, 1575–1583. doi: 10.1111/1365-2664.12330
Schaefer, K. M., Fuller, D. W., and Block, B. A. (2007). Movements, behavior, and habitat utilization of yellowfin tuna (Thunnus albacares) in the northeastern Pacific Ocean, ascertained through archival tag data. Mar. Biol. 152, 503–525. doi: 10.1007/s00227-007-0689-x
Schreer, J. F., and Testa, J. W. (1996). Classification of Weddell seal diving behavior. Mar. Mamm. Sci. 12, 227–250. doi: 10.1111/j.1748-7692.1996.tb00573.x
Seibel, B. A., Thuesen, E. V., Childress, J. J., and Gorodezky, L. A. (1997). Decline in pelagic cephalopod metabolism with habitat depth reflects differences in locomotory efficiency. Biol. Bull. 192, 262–278. doi: 10.2307/1542720
Seminoff, J. A., Jones, T. T., and Marshall, G. J. (2006). Underwater behaviour of green turtles monitored with video-time-depth recorders: what's missing from dive profiles? Mar. Ecol. Prog. Ser. 322, 269–280. doi: 10.3354/meps322269
Sepulveda, C. A., Kohin, S., Chan, C., Vetter, R., and Graham, J. B. (2004). Movement patterns, depth preferences, and stomach temperature of free-swimming juvenile mako sharks, Isurus oxyrinchus, in the Southern California Bight. Mar. Biol. 145, 191–199. doi: 10.1007/s00227-004-1356-0
Sims, D. W. (2000). Filter-feeding and cruising swimming speeds of basking sharks compared with optimal models: they filter-feed slower than predicted for their size. J. Exp. Mar. Biol. Ecol. 249, 65–76. doi: 10.1016/S0022-0981(00)00183-0
Sims, D. W., and Quayle, V. A. (1998). Selective foraging behaviour of basking sharks on zooplankton in a small-scale front. Nature 393, 460–464. doi: 10.1038/30959
Sims, D. W., Fox, A. M., and Merrett, D. A. (1997). Basking shark occurrence off south-west England in relation to zooplankton abundance. J. Fish Biol. 51, 436–440. doi: 10.1111/j.1095-8649.1997.tb01677.x
Sims, D. W., Southall, E. J., Humphries, N. E., Hays, G. C., Bradshaw, C. J. A., Pitchford, J. W., et al. (2008). Scaling laws of marine predator search behaviour. Nature 451, 1098–1102. doi: 10.1038/nature06518
Sims, D. W., Southall, E. J., Richardson, A. J., Reid, P. C., and Metcalfe, J. D. (2003). Seasonal movements and behaviour of basking sharks from archival tagging: no evidence of winter hibernation. Mar. Ecol. Prog. Ser. 248, 187–196. doi: 10.3354/meps248187
Sims, D. W., Southall, E. J., Tarling, G. A., and Metcalfe, J. D. (2005). Habitat-specific normal and reverse diel vertical migration in the plankton-feeding basking shark. J. Anim. Ecol. 74, 755–761. doi: 10.1111/j.1365-2656.2005.00971.x
Sims, D. W., Witt, M. J., Richardson, A. J., Southall, E. J., and Metcalfe, J. D. (2006). Encounter success of free-ranging marine predator movements across a dynamic prey landscape. Proc. R. Soc. Lond. B Biol. Sci. 273, 1195–1201. doi: 10.1098/rspb.2005.3444
Sippel, T., Holdsworth, J., Dennis, T., and Montgomery, J. (2011). Investigating behaviour and population dynamics of striped marlin (Kajikia audax) from the southwest Pacific Ocean with satellite tags. PLoS ONE 6:e21087. doi: 10.1371/journal.pone.0021087
Skomal, G. B., Zeeman, S. I., Chisholm, J. H., Summers, E. L., Walsh, H. J., Mcmahon, K. W., et al. (2009). Transequatorial migrations by basking sharks in the western Atlantic Ocean. Curr. Biol. 19, 1019–1022. doi: 10.1016/j.cub.2009.04.019
Sleeman, J., Meekan, M., Fitzpatrick, B., Steinberg, C., Ancel, R., and Bradshaw, C. (2010). Oceanographic and atmospheric phenomena influence the abundance of whale sharks at Ningaloo Reef, Western Australia. J. Exp. Mar. Biol. Ecol. 382, 77–81. doi: 10.1016/j.jembe.2009.10.015
Sleeman, J. C., Meekan, M. G., Wilson, S. G., Polovina, J. J., Stevens, J. D., Boggs, G. S., et al. (2010). To go or not to go with the flow: environmental influences on whale shark movement patterns. J. Exp. Mar. Biol. Ecol. 390, 84–98. doi: 10.1016/j.jembe.2010.05.009
Slip, D. J., Hindell, M. A., and Burton, H. R. (1994). “Diving behavior of Southern elephant seals from Macquarie Island: an overview,” in Population Ecology, Behavior, and Physiology, eds. B. J. Le Boeuf and R. M. Laws (Los Angeles, CA: University of California Press), 253–270.
Swets, J. A. (1988). Measuring the accuracy of diagnostic systems. Science 240, 1285–1293. doi: 10.1126/science.3287615
Teo, S. L. H., Boustany, A. M., Blackwell, S. B., Walli, A., Weng, K. C., and Block, B. A. (2004). Validation of geolocation estimates based on light level and sea surface temperature from electronic tags. Mar. Ecol. Prog. Ser. 283, 81–98. doi: 10.3354/meps283081
Thomson, J. A., Heithaus, M. R., and Dill, L. M. (2011). Informing the interpretation of dive profiles using animal-borne video: a marine turtle case study. J. Exp. Mar. Biol. Ecol. 410, 12–20. doi: 10.1016/j.jembe.2011.10.002
Thums, M., Meekan, M., Stevens, J., Wilson, S., and Polovina, J. (2013). Evidence for behavioural thermoregulation by the world's largest fish. J. R. Soc. Interface. 10:20120477. doi: 10.1098/rsif.2012.0477
Tittensor, D. P., Mora, C., Jetz, W., Lotze, H. K., Ricard, D., Berghe, E. V., et al. (2010). Global patterns and predictors of marine biodiversity across taxa. Nature 466, 1098–1101. doi: 10.1038/nature09329
Tremblay, Y., and Cherel, Y. (2000). Benthic and pelagic dives: a new foraging behaviour in rockhopper penguins. Mar. Ecol. Prog. Ser. 204, 257–267. doi: 10.3354/meps204257
Vandeperre, F., Aires-Da-Silva, A., Fontes, J., Santos, M., Serrao Santos, R., and Afonso, P. (2014). Movements of blue sharks (Prionace glauca) across their life history. PLoS ONE 9:e103538. doi: 10.1371/journal.pone.0103538
Venables, W. N., and Ripley, B. D. (2002). Modern Applied Statistics with S. New York, NY: Springer.
Videler, J. J., and Weihs, D. (1982). Energetic advantages of burst-and-coast swimming of fish at high speeds. J. Exp. Biol. 97, 169–178.
Viviant, M., Monestiez, P., and Guinet, C. (2014). Can we predict foraging success in a marine predator from dive patterns only? Validation with prey capture attempt data. PLoS ONE 9:e88503. doi: 10.1371/journal.pone.0088503
Walli, A., Teo, S. L. H., Boustany, A., Farwell, C. J., Williams, T., Dewar, H., et al. (2009). Seasonal movements, aggregations and diving behavior of Atlantic bluefin tuna (Thunnus thynnus) revealed with archival tags. PLoS ONE 4:e6151. doi: 10.1371/journal.pone.0006151
Weihs, D. (1973). Mechanically efficient swimming techniques for fish with negative buoyancy. J. Mar. Res. 31, 194–209.
Wilga, C. D., Motta, P. J., and Sanford, C. P. (2007). Evolution and ecology of feeding in elasmobranchs. Integr. Comp. Biol. 47, 55–69. doi: 10.1093/icb/icm029
Williams, T. M., Davis, R. W., Fuiman, L. A., Francis, J., Le Boeuf, B. J., Horning, M., et al. (2000). Sink or swim: strategies for cost-efficient diving by marine mammals. Science 288, 133–136. doi: 10.1126/science.288.5463.133
Keywords: foraging behavior, ocean fronts, pelagic sharks, satellite telemetry, dive shapes
Citation: Queiroz N, Vila-Pouca C, Couto A, Southall EJ, Mucientes G, Humphries NE and Sims DW (2017) Convergent Foraging Tactics of Marine Predators with Different Feeding Strategies across Heterogeneous Ocean Environments. Front. Mar. Sci. 4:239. doi: 10.3389/fmars.2017.00239
Received: 14 March 2017; Accepted: 14 July 2017;
Published: 02 August 2017.
Edited by:
Lars Bejder, Murdoch University, AustraliaReviewed by:
Adrian C. Gleiss, Murdoch University, AustraliaRob Harcourt, Macquarie University, Australia
Copyright © 2017 Queiroz, Vila-Pouca, Couto, Southall, Mucientes, Humphries and Sims. This is an open-access article distributed under the terms of the Creative Commons Attribution License (CC BY). The use, distribution or reproduction in other forums is permitted, provided the original author(s) or licensor are credited and that the original publication in this journal is cited, in accordance with accepted academic practice. No use, distribution or reproduction is permitted which does not comply with these terms.
*Correspondence: Nuno Queiroz, bnVuby5xdWVpcm96QGNpYmlvLnVwLnB0
David W. Sims, ZHdzQG1iYS5hYy51aw==