 Adi Zweifler
 Derya Akkaynak
 Tali Mass
 Tali Treibitz
- 1Marine Technologies Department, Leon H. Charney School of Marine Sciences, University of Haifa, Haifa, Israel
- 2Marine Biology Department, Leon H. Charney School of Marine Sciences, University of Haifa, Haifa, Israel
- 3Interuniversity Institute of Marine Sciences, Eilat, Israel
Recruitment is a fundamental process that influences coral population dynamics as well as reef community structure. To date, coral recruitment success rates are poorly quantified because survey methods are labor-intensive and require manual interpretation. Thus, they are prone to human errors and have low repeatability—a gap we aim to bridge in this research. Since both corals and their symbiotic algae contain fluorescent pigments (chlorophyll and fluorescent proteins), we used the non-invasive Fluorescence Imaging System (FluorIS) and developed a methodology to acquire daytime fluorescent photographs and identify coral recruits in them. We tested our method by monitoring 20 random quadrats at two sites in the Gulf of Aqaba, Israel. The quadrats were surveyed once a month for 8 months in order to track the settlement, mortality and survival rates of new coral recruits. We demonstrate daytime imaging using our method and identification of coral recruits as small as 1 mm in diameter, in a 20 × 20 cm quadrat. Our results show that this photographic method reduces surveyor errors and improves precision. The surveys revealed that on average, there are ~2 new coral recruit settlements (<2 cm) for a quadrat (40 cm2) per month and that 83% of them survive the first month. Our study suggests a relative stability in the Gulf of Aqaba coral population during the survey period. The ability to survey recruits during the day using low-cost, easy-to-use photographic equipment has the potential to contribute significantly to the standardization of coral reef monitoring and management tools, at a time when the world's coral reefs are declining due to local and global stressors.
Introduction
Recruitment and formation of new juvenile coral colonies indicate good conditions for development and growth of coral reefs and is essential to their recovery (Glassom et al., 2004; Baird et al., 2006). Coral recruitment success is most commonly quantified by examination of artificial settlement plates. The plates are easy to use, as the recruits are inspected in the lab using a microscope under UV light. However, this method does not allow continuous monitoring because the plates are taken out for inspection (Mundy, 2000; Soong et al., 2003; Field et al., 2007). In addition, they were shown to be biased (Yerushalmi, 2016). Alternatively, in situ visual surveys are also conducted (Edmunds et al., 1998; Miller et al., 2000; Martinez and Abelson, 2013). Both of these methods are labor-intensive and time-consuming (Piniak et al., 2005; Shlesinger and Loya, 2016). Settlement plates require manual and microscopic examination of the surface, while many visual surveys rely on fluorescence and are therefore conducted at night using specialized equipment (Piniak et al., 2005; Roth and Knowlton, 2009; Salinas-de-Leon et al., 2011; Martinez and Abelson, 2013). Small-scale macro photography has also been used for imaging coral recruits (Edmunds et al., 1998). In the larger scale, using photographic surveys of the seabed is becoming a common method for mapping reef communities (Shihavuddin et al., 2013; Cardini et al., 2015). Advances in computer vision have enabled the processing and automated annotation of these large-scale coral reef surveys (Stokes and Deane, 2009; Beijbom et al., 2012, 2016), offering a powerful alternative to manually annotated visual surveys (Singh et al., 2004; Beijbom et al., 2015). However, such large-scale photographic surveys are impractical and are rarely used for coral recruits, which are very small and often cryptic under natural light, making them difficult to detect with traditional photographic techniques (Baird et al., 2006).
Most scleractinian coral and their symbiotic algae (Symbiodinium spp.) contain fluorescent pigments including GFP-like fluorescent proteins (FPs) and chlorophyll, respectively, that fluoresce under UV or blue light (Alieva et al., 2008). The FluorIS system was shown to acquire high resolution, wide field-of-view (FOV) in situ images of coral fluorescence during daytime (Treibitz et al., 2015). This system uses a modified consumer camera, which images both the green (520–630 nm), and red (630–800 nm) broadband components of the fluorescence spectra that correspond to the emission spectra of green, GFP-like fluorescence proteins and chlorophyll-a, respectively. The use of fluorescence has recently been shown to improve accuracy in automated image annotation of coral colonies (Beijbom et al., 2016). Fluorescence imaging is conducted through the use of filtered excitation strobes that emit short wavelengths, usually UV or blue light with emission maxima at 420–620 nm, and a barrier filter that is mounted on the camera lens to block reflected light (Mazel, 1997). At night, only fluorescence excited by the strobes is recorded. During the day, an additional additive signal from the ambient light is recorded (Treibitz et al., 2015). The reflected ambient component, which is not filtered by the barrier filter, appears in the image in green or yellow and is mixed with the fluorescence signal, as seen in Figure 1D. Consequently, most studies detecting fluorescence in situ take place at night to avoid ambient light illumination (Piniak et al., 2005; Baird et al., 2006). Treibitz et al. (2015) showed that fluorescence could be imaged during daytime by subtracting the ambient light image (captured with the strobes off).
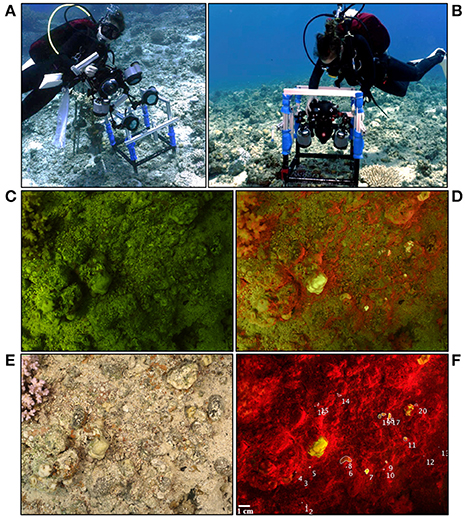
Figure 1. (A) A diver attaching the FluorIS to a custom-made frame in order to (B) image co-located image pairs (ambient and fluorescence) after positioning the frame. (C) Ambient image (blue strobes off) and (D) Fluorescence image (blue strobes on) taken using the FluorIS. (E) Reflectance image taken under white illumination with a standard camera. All images were taken during daytime at the Inter University Institute (IUI), Gulf of Eilat, Israel at 8 m depth. Quadrat size is 20 × 20 cm. (F) Fluorescence image after subtracting image (C) from image (D). Numbers represent coral recruits marked using the MATLAB code developed for this study.
In this study we optimized the FluorIS with specific components for surveying coral recruits under 2 cm in diameter (Figure 1), automated ambient light subtraction, and developed a custom software, “RecruitTracker” (Akkaynak, 2017), that improves the efficiency and accuracy of image analysis. We implemented the method in long-term field surveys for recording coral recruit settlement and survival. Our results show that this method reduces errors in identification caused by other fluorescent organisms and/or surveyor errors. In addition, during our surveys we were able to record the settlement, growth, and mortality of coral recruits from 1 mm in diameter and up. Our results indicate relative stability in coral recruit population in the Gulf of Aqaba, with high survival rates of 75% during the first month after settlement.
Materials and Methods
Imaging System
We used a fluorescence imaging system constructed of two cameras: the FluorIS (Treibitz et al., 2015) for fluorescence imaging, and a standard camera for reflectance (white light) imaging (Table S1). Both systems consist of a Nikon D810 camera and a Nikkor 35 mm f1.8 lens, and were enclosed in a Hugyfot (Erembodegem, Belgium) housing with a fisheye dome port for diving. In the FluorIS system, the camera was modified by replacing the IR filter over its sensor with a clear filter that transmits the entire light spectrum the sensor is sensitive to (roughly 300–1200 nm). The IR internal filter strongly attenuates long wavelengths above 650 nm in order to imitate the human visual system, which is not sensitive to these wavelengths. The presence of this filter limits chlorophyll-a fluorescence imaging by standard off-the-shelf cameras. Four INON Z240 strobes with blue EX-INON filters (NightSea) were used as excitation sources for fluorescence. Since the modified FluorIS camera has an expanded spectral range in the long wavelengths (>650 nm), an additional Schott BG39 filter was mounted on the strobes to block IR wavelengths that pass through the primary excitation filter. A yellow Tiffen #12 barrier filter was mounted on the camera's lens in order to block the blue light reflected from the strobes. The reflectance images were taken with two INON Z240 strobes with no additional filters on the strobe or on the camera.
Development of the Imaging System
In order to determine the lens and field-of-view of the camera system and estimate the size of detectable coral recruits, we tracked 10 Stylophora pistillata recruits for a month, from settlement or until they reached 2cm in diameter, using both fluorescence and reflectance imaging in a controlled environment aquarium. We collected planula from adult S. pistillata colonies located in front of the Interuniversity Institute for Marine Sciences (IUI), Eilat, Israel (Red Sea, 29°30′.07 N, 34°55′.02 E) during April-May 2015, following peak release (Shlesinger et al., 1998). Planula were transferred to the lab and held in a 70 × 70 × 70 cm controlled environment aquarium. The temperature in the aquarium was maintained at ~25°C, which is close to seawater values for April-May in the Gulf of Aqaba (Shaked and Genin, 2012). Light was set to ~150–200μm q m2 s−1 on a 12:12 h light:dark cycle. The coral recruits were fed every 2 days with freshly hatched Artemia. We placed a custom made frame on top of the aquarium, which fixed the camera in a permanent position, mid-aquarium above the surface (Figure S1). Once a week a set of images was taken using the FluorIS and the standard camera with a Nikkor 24–70 mm lens in several zoom settings (24, 35, 50, and 70 mm). Following this experiment, we chose to use a 35 mm lens with a 20 × 20 cm FOV, where the camera is 30 cm above the ground.
In situ Deployment of the Imaging System
A custom-made frame was built from aluminum profiles to enable rapid and easy attachment and release of the imaging modules holding the cameras and strobes. The frame was attached to a 50 × 50 cm quadrat, with four, 70 cm long legs. The height of the frame could be adjusted in order to increase resolution by reducing the quadrat size. In order to image a 20 × 20 cm quadrat, the camera holder was located 30 cm above the ground and the 20 × 20 cm quadrat was demarcated within the original quadrat by string. The quadrat itself was elevated 10 cm above the ground to minimize disturbance to the reef while acquiring the pictures (Figures 1A,B).
Image Subtraction for Daytime Fluorescence
In order to eliminate the reflectance and fluorescence from ambient light in daytime imaging, we used the ambient light subtraction method (Treibitz et al., 2015). This method uses two images taken with the FlourIS; one with the blue strobes on (Iday), and one with the blue strobes off (Iambient). The fluorescent image is obtained by subtracting the strobes-off image from the strobes-on image (Fstrobes = Iday−Iambient). The subtraction will only succeed if these images are perfectly aligned with each other. Even though the camera was placed on a frame positioned on the seabed, there were still small movements that caused slight differences between the images. In Treibitz et al. (2015) the images were aligned manually. In the present case, to overcome these movements and register the image pairs automatically, we developed an image registration algorithm written in MATLAB (Mathworks, Inc.; Akkaynak, 2017). In this algorithm, the fluorescence image is warped into the ambient light image, i.e., it is stretched and resized such that prominent image features are aligned in both images, using a projective transformation. The transformation is computed using matches of SURF (Speeded Up Robust Feature) keypoints (Bay et al., 2008) filtered with RANSAC (RANdom SAmple Consensus, (Zuliani, 2008). The SURF local feature detector function finds corresponding points between two images, allowing them to be rotated and scaled with respect to each other. RANSAC finds the transformation on which the most pairs agree on, and discards the pairs that did not (Figures 2A,B). This is the transformation that is used for warping. As opposed to standard image registration applications, the challenge in this case is that the images are from different sources (i.e., fluorescent and ambient). Hence, in our code, RecruitTracker (Akkaynak, 2017), we modified some of the parameter values used in standard registration to match these differences. In addition, although the images were taken subsequently, we sometimes experienced small intensity changes in the ambient light between the image pair. We compensated for that by automatically calculating the ambient light gain by limiting the number of allowed negative values in the subtraction result. After registration, the strobes-off image was subtracted from the strobes-on image. The result of the subtraction is a fluorescence image excited solely by the blue strobes (Figures 1F, 2D). We conducted the same image registration process with the reflectance image as well.
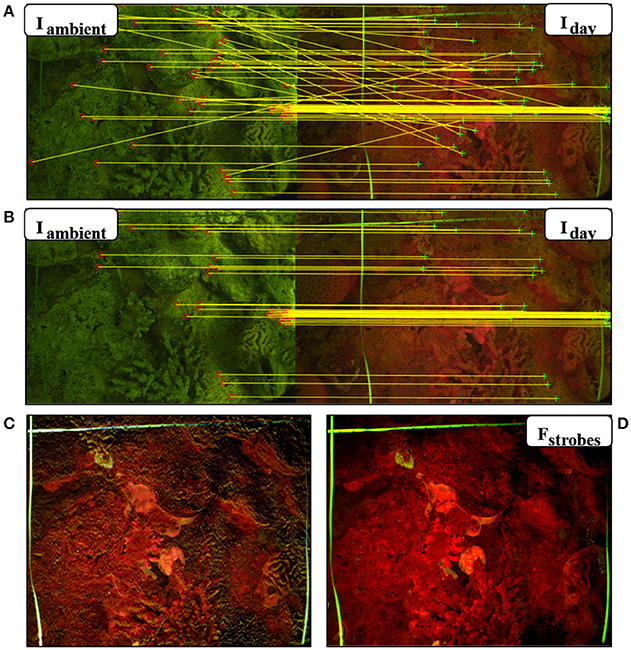
Figure 2. Automatic ambient light subtraction. (A,B) Fluorescence image pairs taken during the day using the FluorIS, with the blue strobes off (Iambient) and blue strobes on (Iday). (A) Matching interest points found using SURF descriptors in the algorithm before RANSAC. (B) Matching points after RANSAC. Ambient signal in Iambient helps find the matching interest points. (C) Result of image subtraction without registration. The image is not sharp and is missing the fine details. (D) Fstrobes = Iday − Iambient is the result of the automatic subtraction algorithm with registration. It exhibits high contrast and detail.
In situ Imaging
In order to find the optimal imaging depth and time most suitable for daytime imaging in local conditions, 400 co-located reflectance and fluorescence image pairs were captured randomly during daytime. A set of images was taken every 2 m between 4 and 15 m at 8:00 a.m., 12:00 and 16:00 p.m. These times of day represent the three significant directions and intensities of sunrays at the Gulf of Aqaba. The purpose of this test was to assess the effect of different light intensities on the quality of ambient light subtraction for daytime images.
To examine whether the fluorescence signal excited by the blue strobes is strong in relation to the ambient light, we calculated the ratio of pixel intensities between the fluorescence image to the ambient one in the red and green channels. The fluorescent pixels were determined by thresholding the fluorescence image after subtraction using a dynamic threshold (using the MATLAB function multithresh, based on Otsu, 1979). After thresholding, we conducted a pixel-wise division of the fluorescent image by the ambient light image. This yielded a ratio image for each image pair (fluorescence and ambient). Figure 3 depicts the histogram of the resulting ratio for all pixels identified as fluorescent in all image pairs acquired during the long-term field study (N = 275).
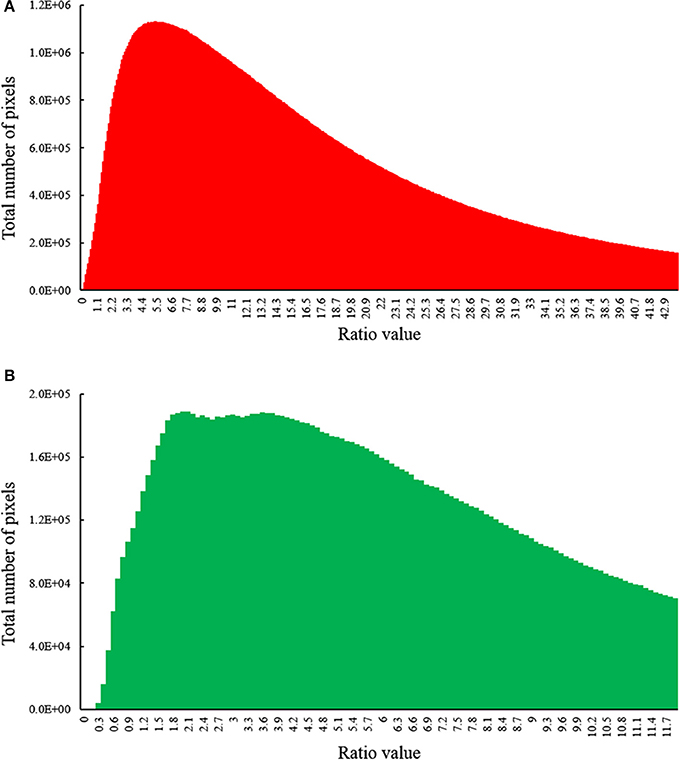
Figure 3. Histogram of ratio values between the fluorescence image (Fstrobes) to the ambient image (Iambient) in (A) red channel (chlorophyll) and (B) green channel (GFP) for all image pairs photographed during our survey (n = 275). The fluorescence is mostly in the order of the ambient light or higher, resulting in high signal-to-noise-ratio in the subtracted images. Histograms depict fluorescent pixels only.
Sensitivity Test
To test the sensitivity of our method in comparison to visual surveys, we asked three experienced coral biologists to participate in a survey in which they draw a sketch of the coral recruits in a given quadrat under ambient light and fluorescent light during daytime, while diving. Forty-eight random quadrats were imaged both in fluorescence and reflectance mode and in addition, the divers draw detailed sketches of the coral recruits they identified in the same imaged quadrat in situ, during the dive in which the images were acquired. Each diver scanned the quadrat twice: first in ambient light and then using a blue strobe and a yellow filter mask over his diving mask. Corals found in the second scan were added to the same drawing with a special mark. The reflectance images, the fluorescence images and the drawings were compared.
Long-Term Survey
Following the finalization of the experiment parameters, field surveys were conducted once a month between September 2015 and May 2016 with an additional survey in September 2016. The survey period covers the peak spawning season of most of the coral species at the Gulf of Aqaba (Shlesinger et al., 1998). Forty quadrats were chosen randomly at 8–10 m depth in the coral reef in front of the IUI and in a Marine Protected Area (MPA), in the Gulf of Aqaba, Israel. Twenty 20 × 20 cm quadrats were photographed at each site. Each quadrat was imaged with the FluorIS and with the reflectance camera. In order to return to the same quadrats month after month, we used a transect line in the MPA whereas at the IUI we marked the quadrats' locations with white epoxy glue marking the frame's corners.
Image Annotation
We designed a graphical user interface in MATLAB to allow the user to manually draw a contour around each coral recruit on the fluorescence image (subtraction result) of a given quadrat (Akkaynak, 2017). The program automatically calculates a pixel-to-cm ratio for each image using the 1 cm markings on a rope that was photographed in each image as a scale bar. All images had a resolution of 4,928 × 7,380 pixels, in which 1 cm corresponded to 250 pixels on average. Small variations were observed due to the vertical placement of the frame and the rope. Once the user marks all recruits, the program saves the following outputs: an image with the contours marked, a binary mask (i.e., a map) containing the coordinates of the contours of each coral, and a spreadsheet with the recruit's number and area in cm2. The areas of the coral recruits in cm2 were calculated from their areas in pixels, using the pixel-to-cm ratio extracted from each image. To detect the recruits that did not express GFP, we used the reflectance image of the annotated quadrat as a source of verification. The coordinates of the contours were saved in the binary masks in order to return to the same corals for future analysis. We eliminated corals with major axis diameters greater than 2 cm, which roughly limited the area of the largest recruits to be π * (1 cm)2 = 3.14 cm2, assuming they were circular.
Statistical Analysis
Since our results did not meet the ANOVA normality assumption, a Kruskal-Wallis test was performed to obtain the method sensitivity results and a Friedman's test for non-parametric repeated measures was performed to obtain coral recruits settlement and survival results. No transformations were made to the data. All statistical analyses were done with IBM SPSS 23, with α set to 0.05.
Results
Fluorescence Imaging of Recruits During the Day
Using the FluorIS, we successfully recorded wide field-of-view fluorescence images of coral recruits from 0.001 cm2 (~1 mm in diameter) during daytime in a quadrat of 20 × 20 cm. The automatic registration algorithm for image subtraction (Figure 2) was successful on 92% of the image pairs, and on the rest, we could perform the subtraction with manual registration; thus, all acquired images were used for the subsequent analysis. We were able to image during daytime in a wide range of ambient light intensities. The quadrats were located at depths from 5 to 12 m where the spectral irradiance of GFP measured at noon at 520 nm can typically be between 85 and 155 μW cm−2 nm−1 and for chlorophyll at 680 nm, the spectral irradiance is typically between 0 and 95 μW cm−2 nm−1 (Eyal et al., 2015). We identified that for daytime conditions our camera's ISO should range between 200 and 400, the aperture at a max of f/8 and the shutter speed at 1/200th. Since we imaged 30 cm above the ground, which is rather close, the signal from the strobes is strong in relation to the ambient light. The images are a combination of fluorescent and ambient light, thus the fluorescence level in the original image cannot be adjusted by, for example, changing the exposure time. For the image subtraction to be meaningful, the fluorescence signal should be above camera sensitivity. Therefore, we compared the fluorescence intensity to the ambient light intensity. Histograms of this ratio (Figure 3) show that not only the fluorescence signal is above camera sensitivity but it is also usually stronger than the ambient signal (i.e., ratio above 1). As red attenuates much faster than green in the water column, the fluorescence compared to reflectance from the sun is stronger in the red channel. Nevertheless, green fluorescence also had a strong signal compared to the ambient one.
Method Sensitivity
In each quadrat, coral recruits were identified in the fluorescence image, reflectance image and in the drawing with and without the blue flashlight, as demonstrated in Figure 4A. A strong correlation was found between the fluorescence imaging method and the other methods (Spearman's test, n = 48, P < 0.001, rs > 0.5) (Figure 4B). The number of recruits counted in the fluorescence images is 24% higher than the number counted in the drawings executed with and without the blue flashlight (Kruskal-Wallis test, p < 0.01, df = 3, chi-square = 11.75) (Figure 4C). A comparison of the drawings executed with and without the blue flashlight, reveals no significant difference in the coral recruit count (Kruskal-Wallis test, p = 0.8, df = 1, chi-square = 0.07). In 93% of the fluorescence images we found the same or more coral recruits in comparison to the other methods. From the recruits identified in the reflectance images, 11% did not exhibit a fluorescence signal.
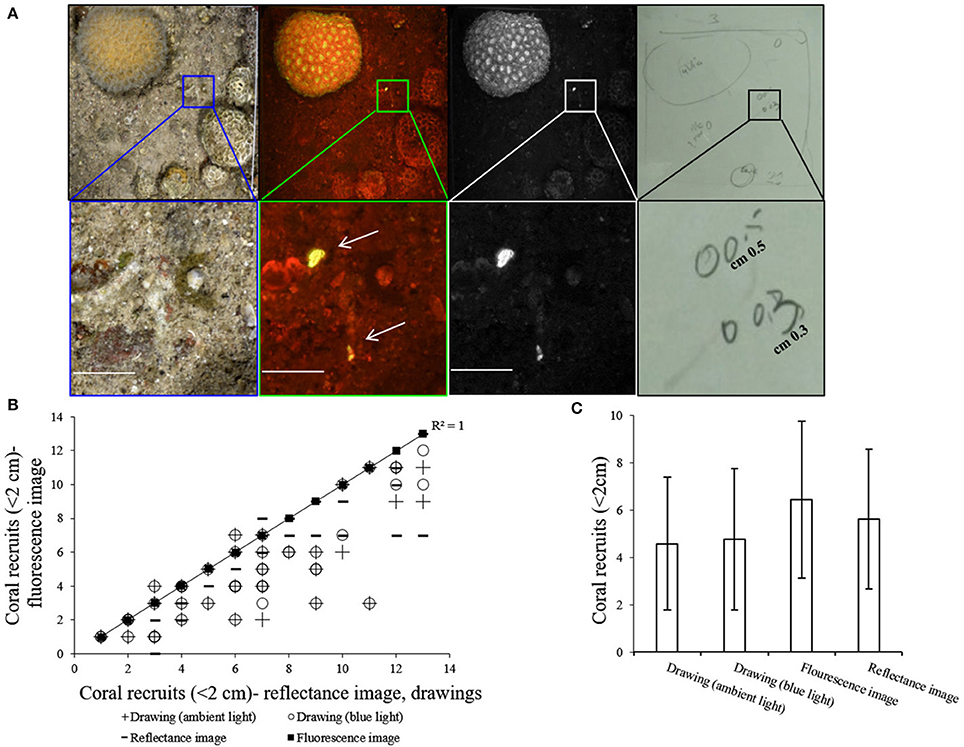
Figure 4. (A) Top row (left to right)–reflectance image, fluorescence image, green channel of fluorescence image, and drawing of the same quadrat. Bottom row- magnification of the inset at the top row shows two coral recruits that were identified and drawn by the diver and are clearly seen in the fluorescence image compared to the reflectance image in which it is difficult to locate them (all scale bars are 1 cm). (B) Correlation between number of coral recruits counted in each of the fluorescence images to the number of coral recruits counted with the other methods on the same quadrat. Y axis = fluorescence image, X axis = drawing (ambient light), drawing (blue light), and reflectance image. Trendline (R2 = 1) represents least-squares linear regression of fluorescence imaging vs. other methods (n = 48). (C) Mean number (±SD) of coral recruits counted with each of the methods (n = 48).
Settlement and Survival
The average number of new recruit settlements every month in the MPA and at the IUI is presented in Figure 5A. The MPA showed the greatest amount of new settlements in November 2015, significantly differing from the period between March to September 2016 (Friedman's test, p < 0.01, chi-square = 26.7, df = 7, n = 18). At the IUI, the largest amount of new settlements was recorded in December 2015 and differed significantly from the period between February and September 2016 (Friedman's test, p < 0.01, chi-square = 36.46, df = 7, n = 7) (Figure 5A2). An average of 83 and 67% of the new recruits survived their first month in the MPA and at the IUI respectively (Figure 5B). An average of 43 and 47% of the coral recruits survived the entire year in the MPA and at the IUI respectively (Figure 5B). During our 8-months survey, we recorded an average of 2.35 and 2.43 new recruit settlement per 40 cm2 month−1 at the IUI and in the MPA respectively (Figure 6).
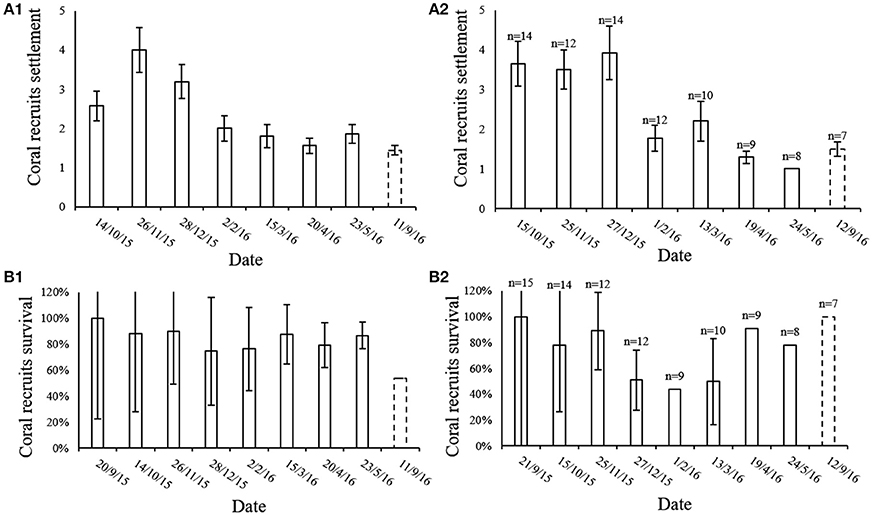
Figure 5. (A) Mean number (±SE) of coral recruits settled in the 20 × 20 cm quadrat during each month of our survey both in the (A1) MPA (n = 18) and in the (A2) IUI sites. September 2015 is t = 0 and therefore not shown. (B) Percentage (mean ± SE) of coral recruits that survived their first month during the 8 month of survey at the reserve (n = 18) (B1) and at the IUI (B2). Since September 2015 is t = 0 we assume the survival for that month is 100%. Dashed line representing September 2016 emphasizes the 4 month gap from last survey and the return to the survey sites after 1 year.
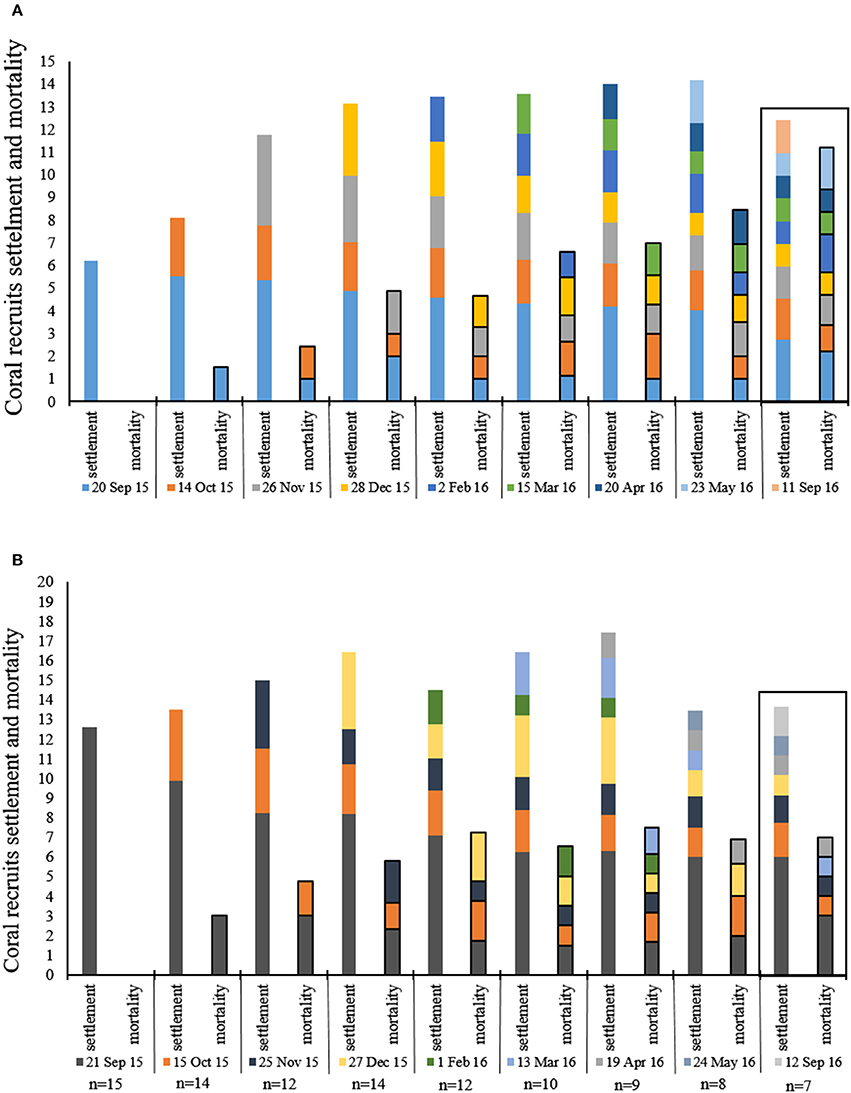
Figure 6. Mean number (20 × 20 cm quadrat) of coral recruits settlement and mortality during each month of the survey. Each color represents 1 month in which new recruites were recorded, the same color follows the same recruits signifies their survival and mortlity from month to month. (A) reserve (n = 18), (B) IUI. Box around September 2016 emphasizes the 4 month gap from last survey and the return to the survey sites after 1 year.
Fusion, Growth and Competition
Throughout our surveys we recorded several distinct phenomena: (1) Within 3 months, two Montipora verrucosa recruits had fused to form one colony (Figure 7A). Due to the algae bloom observed during March-May, it was difficult to detect the fusion in the reflectance images taken during those months; however, in the fluorescence images the fused colony is clearly detected. (2) Using RecruitTracker (see image annotation in methods), we were able to calculate the area of the coral recruits that were marked in cm2; therefore, growth rate can be calculated (Figure 7B). This example displays a Porites sp. recruit that grew by ~0.036 cm2 within 1 year. (3) survival and death of two adjacent recruits, Porites sp. and Echinopora tiranesis (Figure 7C). From September 2015 to March 2016 both recruits look healthy and grew naturally however, in April the E. tiranesis started shrinking and by September 2016 both recruits had died.
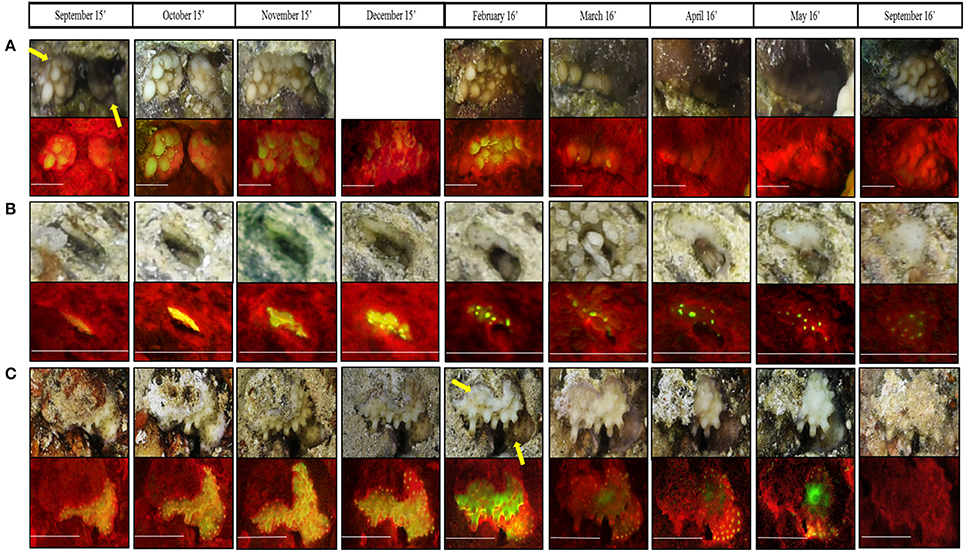
Figure 7. Magnification of three phenomena recorded both in fluorescence and reflectance imaging during the present surveys; (A) Two Montipora verrucosa recruits fused to one colony from November 2015, (B) the growth of Porites sp. in 0.036 cm2 during the survey period, and (C) competition between Porites sp. (botom coral) to Echinopora tiranesis (top coral). All scale bars are 0.5 cm. In (A) December 2015 reflectance image is missing since the camera moved while imaging so the coral was cutout of the image.
Discussion
Compared to previous surveys of coral recruits, the fluorescence imaging method developed in this study enables in situ, high resolution, wide field-of-view daytime fluorescence imaging of coral recruits. We demonstrated that using the FlourIS imaging system with RecruitTracker improved surveys of coral recruits in a spatial and temporal scale. Our method can be used for various research applications and enables further ecological and physiological studies of coral recruits by simplifying large-scale daytime fluorescence surveys.
Until recently, fluorescence imaging systems were limited either by resolution (Winters et al., 2009), spatial coverage of the measurements and/or ease of operation (Mazel, 1997; Mazel et al., 2003). Using a high-resolution camera with a wide-angle lens enabled us to identify small recruits (from ~1 mm in diameter) in a relatively large field-of-view (20 × 20 cm). The system is built with off-the-shelf components and is easy to use and replicate, allowing standardization and widespread use.
The ability to conduct daytime surveys has several advantages for the diver, including safety, ease of navigation, coverage of larger areas, spotting subjects from a distance and reducing fatigue (Zawada and Mazel, 2014). Thus, one of our main goals was to achieve daytime fluorescence imaging. This required overcoming two challenges. First, we implemented automatic registration of the fluorescent and ambient light images, which has not been previously demonstrated. This was not an easy task as the images are from different sources. Nevertheless, our algorithm (RecruitTracker) achieved high success rate of 92%. As opposed to nighttime fluorescence images, the fact that ambient light signal exists in the original fluorescence image works in our benefit and aids in the automatic registration (Figure 2). Second, when imaging during daytime, if the fluorescence signal is significantly lower than the ambient sunlight, the subtraction results in a noisy, less useful, image. To overcome this, we used a wide-angle lens (rather than a macro lens), which allowed us to place the camera very close to the seabed (30 cm). This resulted in high irradiance from the strobes on the coral and hence a strong fluorescence signal in comparison to the subtracted ambient signal (Figure 3). In this case, it was important to use a camera that had high sensitivity and bit-depth. These two system characteristics yield a high signal-to-noise-ratio in the fluorescence image (Treibitz et al., 2015).
Another challenge we faced while developing the system was the fact that fluorescence is not species-specific and there are other organisms besides corals that contain fluorescent pigments, e.g., algae, sponges, and worms. This, combined with user error, could lead to high error rates (Piniak et al., 2005). Many taxa have diverse fluorescent pigments, which helps to distinguish them from scleractinian recruits. In addition, there are corals that express a very weak GFP signal if any, (e.g., Porites sp.) (Roth et al., 2010) whose identification was only possible by their texture and shape in the fluorescence images. Light intensity is known to modulate pigmentation in corals of the species Acroporidae, Merulinidae, and Pocilloporidae (D'Angelo et al., 2008). However, here we do not aim to follow quantitative changes, but use the fluorescence to find the recruits. If high taxonomic resolution is required, utilizing the FluorIS along with a standard reflectance camera is essential (Baird et al., 2006). We followed this recommendation and compared each recruit identified in the fluorescence image to a high-resolution reflectance image. One inherent limitation of in situ imaging surveys is the fact that we can only photograph the surface of the reef, and cannot see recruits that settle on the side or beneath rocks.
We demonstrated the higher precision of this system in comparison to regular images and visual surveys. The advantages of using an imaging method over a visual survey are that field-time is reduced, images can be taken by a diver with no taxonomic expertise (or an autonomouse vehicle) and re-examined by multiple observers for accurate analysis, and potentially be analyzed by automated annotation programs (Edmunds et al., 1998; Piniak et al., 2005; Burgess et al., 2010). We have shown here that by using our fluorescence images we found more coral recruits compared to the amount we would have found using only reflectance images and diver observations. In addition, due to the camera's high resolution and modification carried out on the FluorIS, expanding spectral range in the long wavelengths, errors in identification caused by other fluorescent organisms and/or surveyor errors were significantly reduced (Figure 4). Moreover, the number of non-fluorescent recruits was ~11%. This suggests that to speed identification, it can be done only on the fluorescence images, with a cross-check to the reflectance images to verify that the fluorescent organism is indeed a coral recruit.
In this study, we covered most of the known reproduction periods of the dominant corals in the northern part of the Gulf of Aqaba. The spawning is known to be a year round process, in which the different coral species have different spawning dates (Shlesinger et al., 1985, 1998). We found relative stability in recruitment/mortality rates with high survival rates at the two surveyed sites (Figure 6). The coral reefs in the Gulf of Aqaba have been reported in decline and at risk of collapse, due to both local and global stressors (Glassom et al., 2004, 2006; Loya, 2004; Abelson et al., 2005). Nevertheless, our results are in line with a recent study (Shlesinger and Loya, 2016) which suggested that the reefs in Eilat (Gulf of Aqaba) are recovering. It is likely that our findings are an underestimation of the actual rates since we only surveyed a one-year reproduction period. Therefore, consistent in situ monitoring studies should be performed to reveal the full picture of the settlement and survival of coral recruits in order to estimate the true status of the reef.
We recorded 16% less survival during the first month at the IUI site in comparison to the MPA. The two sites are only a few 100 m away from each other. Nevertheless, they differ in the following parameters: the MPA was declared by the Israeli Nature and Parks Authority 20 years ago and has been closed to the public since, whereas the IUI area is subject to frequent diving activity. In addition, the topography of the reef at the MPA is more complex and three-dimetional whereas at the IUI the reef is mostly flat. These facts can explain the lower survival rates during the first month after settlement at the IUI in comparision to the MPA. Extensive human activity, structural complexity and availability of substrate for settlement was reported to have an important impact on the recruitment process at different locations (Hughes and Connell, 1999; Alvarez-Filip et al., 2011). Based on our data, we estimate ~72 recruits settled per m2 year−1. This result significantly differs from other studies conducted on natural substrate such as Shlesinger and Loya (2016), who conducted their surveys at the same sites and found ~15 recruits per m2 year−1. Other studies found ~7 recruits per m2 year−1 at the Great Barrier Reef (Connell et al., 1997; Hughes et al., 2007) and ~4 recruits per m2 year−1 in the western Atlantic (Smith, 1992; Miller et al., 2000).
Significant differences between similar studies using different methods were demonstrated by Abelson et al. (2005) and Yerushalmi (2016), as well as inconsistent findings in recruitment studies using different experimental protocols. Yerushalmi (2016) showed significant differences in number and in species distribution between artificial and natural substrate of coral recruit settlement, the author reported more recruits on artificial substrate as opposed to more species diversity on natural substrate. Moreover, several studies that examined coral recruitment processes in the Gulf of Aqaba using in situ settlement plates followed by microscopic analysis (Glassom et al., 2004, 2006; Abelson et al., 2005; Martinez and Abelson, 2013), presented significantly different recruit numbers at the same study site. In this study, we demonstrated these biases by showing different recruit counts when using different methods. We counted more recruits with our method due to its higher precision. Hence, there is a crucial need for a standardized method of recruitment assessment in coral reefs worldwide (Abelson and Gaines, 2005), which could be fulfilled by our method.
In this study, we also showed that various phenomena and morphological changes in recruits could be tracked using our imaging system (Figure 7). For example, we were able to record fusion, also known as a chimerism, of two recruits. This could open the way for a larger genomic study on chimerism in coral reefs. Chimerism is known to exist in several marine colonial animals from different phyla including sponges, cnidarians, bryozoans and tunicates, as well as in protists and plants. To date, the amount of chimerism in reef corals in situ is unknown (Heyward and Stoddart, 1985; Rinkevich and Weissman, 1987; Puill-Stephan et al., 2009). In addition, the ability to calculate growth rate with a non-distractive method in situ is crucial for large scale monitoring. The growth rate of Porites sp. recruit presented here (~0.036 cm2 year−1) corresponds with the growth rates of Porites sp. known from the Great Barrier Reef and the Gulf of Aqaba (Lough and Barnes, 1997; Al-Rousan and Felis, 2013). We have to note, that since corals are three dimensional whereas the images taken by this method are two dimensional, natural changes in the environment such as seasonal algal blooms, which cover large areas of the substrate, changes in the quadrat positioning and camera angle can affect the calculation.
Coral recruitment, particularly settlement patterns and survival rates, has been long identified as a vital process in the ability of reefs to recover from anthropogenic and natural disturbances (Hughes et al., 2007, 2010; Urvoix et al., 2012). Therefore, understanding the recruitment process is essential for developing suitable reef conservation and management strategies. We believe that our low-cost, non-destructive, and easy-to-use method will help standardize surveys and long-term monitoring of coral recruits. In addition, it can be applied via underwater vehicles for rapid and automated surveys. In the future, we plan to develop automatic annotation methods to speed up image analysis. The recorded data can be easily uploaded to create universal databases contributing to improved understanding of this vital and delicate life stage in the coral's life cycle. This will help predict the destiny of coral reefs that are at risk of decline due to numerous environmental stressors.
Author Contributions
TT conceived the project, built the system, and advised algorithm development. AZ led lab and in situ experiments, performed data analysis, and provided consent for the publication of the identifiable images. TM helped and advised throughout the experiments and contributed to experiment design and data collection and analysis. DA wrote the image annotation code and helped in field experiments. AZ. TT, TM, and DA wrote the manuscript.
Funding
The study was supported by the Leona M. and Harry B. Helmsley Charitable Trust, the Maurice Hatter Foundation and Paul Amir Foundation. DA was also funded by the IUI post-doctoral fellowship.
Conflict of Interest Statement
The authors declare that the research was conducted in the absence of any commercial or financial relationships that could be construed as a potential conflict of interest.
Acknowledgments
We thank the Leona M. and Harry B. Helmsley Charitable Trust, the Maurice Hatter Foundation and Paul Amir Foundation. AZ was an Awardee of the Hollis Gear Award—American Academy of Underwater Sciences (AAUS). A special thanks to Aviel Nahum for writing the image subtraction code. We thank the Interuniversity Institute for Marine Sciences in Eilat, Israel, for their hospitality and the use of their facilities, as well as Deborah Levi, Dotan Shreiber, Maayan Neder, Sivan Haviv, Tom Shlesinger, and Tal Cohen for their generous assistance during dives in Eilat. We also thank Avigdor Abelson and Stephane Martinez for their guidance regarding the data analysis and to Ido Itzhaki for assisting with the statistical analysis. The study was performed in accordance with regulations and guidelines set by the Israeli Nature and Parks Authority.
Supplementary Material
The Supplementary Material for this article can be found online at: http://journal.frontiersin.org/article/10.3389/fmars.2017.00273/full#supplementary-material
References
Abelson, A., and Gaines, S. (2005). A call for a standardized protocol of coral recruitment research and outlines for its conception. Mar. Pollut. Bull. 50, 1745–1748. doi: 10.1016/j.marpolbul.2005.09.046
Abelson, A., Olinky, R., and Gaines, S. (2005). Coral recruitment to the reefs of Eilat, Red Sea: temporal and spatial variation, and possible effects of anthropogenic disturbances. Mar. Pollut. Bull. 50, 576–582. doi: 10.1016/j.marpolbul.2005.02.021
Akkaynak, D. (2017). dakkaynak/recruitTracker: Original Version of recruit Tracker [Data Set]. doi: 10.5281/zenodo.583534
Alieva, N. O., Konzen, K. A., Field, S. F., Meleshkevitch, E. A., Hunt, M. E., Beltran-Ramirez, V., et al. (2008). Diversity and evolution of coral fluorescent proteins. PLoS ONE 3:e2680. doi: 10.1371/journal.pone.0002680
Al-Rousan, S., and Felis, T. (2013). Long-term variability in the stable carbon isotopic composition of Porites corals at the northern Gulf of Aqaba, Red Sea. Palaeogeogr. Palaeoclimatol. Palaeoecol. 381–382, 1–14. doi: 10.1016/j.palaeo.2013.03.025
Alvarez-Filip, L., Cote, I. M., Gill, J. A., Watkinson, A. R., and Dulvy, N. K. (2011). Region-wide temporal and spatial variation in Caribbean reef architecture: is coral cover the whole story? Glob. Chang. Biol. 17, 2470–2477. doi: 10.1111/j.1365-2486.2010.02385.x
Baird, A. H., Salih, A., and Trevor-jones, A. (2006). Fluorescence census techniques for the early detection of coral recruits. Coral Reefs 25, 73–76. doi: 10.1007/s00338-005-0072-7
Bay, H., Ess, A., Tuytelaars, T., and Van Gool, L. (2008). Speeded-Up Robust Features (SURF). Comput. Vis. Image Underst. 110, 346–359. doi: 10.1016/j.cviu.2007.09.014
Beijbom, O., Edmunds, P. J., Kline, D. I., Mitchell, B. G., and Kriegman, D. (2012). “Automated annotation of coral reef survey images,” in Proceedings of the IEEE Computer Society Conference on Computer Vision and Pattern Recognition (Washington, DC).
Beijbom, O., Edmunds, P. J., Roelfsema, C., Smith, J., Kline, D. I., Neal, B. P., et al. (2015). Towards automated annotation of benthic survey images: variability of human experts and operational modes of automation. PLoS ONE 10:e0130312. doi: 10.1371/journal.pone.0130312
Beijbom, O., Treibitz, T., Kline, D. I., Eyal, G., Khen, A., Neal, B., et al. (2016). Improving automated annotation of benthic survey images using wide-band fluorescence. Sci. Rep. 6:23166. doi: 10.1038/srep23166
Burgess, S. C., Osborne, K., Sfiligoj, B., and Sweatman, H. (2010). Can juvenile corals be surveyed effectively using digital photography?: implications for rapid assessment techniques. Environ. Monit. Assess. 171, 345–351. doi: 10.1007/s10661-009-1282-1
Cardini, U., Van Hoytema, N., Schuhmacher, H., Wild, C., and Naumann, M. S. (2015). 37 Years later: revisiting a Red Sea long-term monitoring site Biodiversity. Coral Reefs 34:1111. doi: 10.1007/s00338-015-1321-z
Connell, J. H., Hughes, T. P., and Wallace, C. C. (1997). A 30-year study of coral abundance, recruitment, and disturbance at several scales in space and time. Ecol. Monogr. 67, 461–488. doi: 10.1890/0012-9615(1997)067[0461:AYSOCA]2.0.CO;2
D'Angelo, C., Denzel, A., Vogt, A., Matz, M. V., Oswald, F., Salih, A., et al. (2008). Blue light regulation of host pigment in reef-building corals. Mar. Ecol. Prog. Ser. 364, 97–106. doi: 10.3354/meps07588
Edmunds, P. J., Aronson, R. B., Swanson, D. W., Levitan, D. R., and Precht, W. F. (1998). Photographic versus visual census techniques for the quantification of juvenile corals. Bull. Mar. Sci. 62, 937–946.
Eyal, G., Wiedenmann, J., Grinblat, M., D'Angelo, C., Kramarsky-Winter, E., Treibitz, T., et al. (2015). Spectral diversity and regulation of coral fluorescence in a mesophotic reef habitat in the Red Sea. PLoS ONE 10:e0128697. doi: 10.1371/journal.pone.0128697
Field, S. N., Glassom, D., and Bythell, J. (2007). Effects of artificial settlement plate materials and methods of deployment on the sessile epibenthic community development in a tropical environment. Coral Reefs 26, 279–289. doi: 10.1007/s00338-006-0191-9Glassom
Glassom, D., and Chadwick, N. E. (2006). Recruitment, growth and mortality of juveniles corals at Eilat, northern Red Sea. Mar. Ecol. Prog. Ser. 318, 111–122. doi: 10.3354/meps318111
Glassom, D., Zakai, D., and Chadwick-Furman, N. E. (2004). Coral recruitment: a spatio-temporal analysis along the coastline of Eilat, northern Red Sea. Mar. Biol. 144, 641–651. doi: 10.1007/s00227-003-1243-0
Heyward, A. J., and Stoddart, J. A. (1985). Genetic structure of two species of Montipora on a patch reef: conflicting results from electrophoresis and histocompatibility. Mar. Biol. 85, 117–121. doi: 10.1007/BF00397429
Hughes, T. P., Graham, N. A. J., Jackson, J. B. C., Mumby, P. J., and Steneck, R. S. (2010). Rising to the challenge of sustaining coral reef resilience. Trends Ecol. Evol. 25, 633–642. doi: 10.1016/j.tree.2010.07.011
Hughes, T. P., Rodrigues, M. J., Bellwood, D. R., Ceccarelli, D., Hoegh-Guldberg, O., McCook, L., et al. (2007). Phase shifts, herbivory, and the resilience of coral reefs to climate change. Curr. Biol. 17, 360–365. doi: 10.1016/j.cub.2006.12.049
Hughes, T. P., and Connell, J. H. (1999). Multiple stressors on coral reefs: a long-term perspective. Limnol. Oceanogr. 44, 864–877. doi: 10.4319/lo.1999.44.3_part_2.0932
Lough, J. M., and Barnes, D. J. (1997). Several centuries of variation in skeletal extension, density and calcification in massive Porites colonies from the Great Barrier Reef: a proxy for seawater temperature and a background of variability against which to identify unnatural change. J. Exp. Mar. Biol. Ecol. 211, 29–67. doi: 10.1016/S0022-0981(96)02710-4
Loya, Y. (2004). “The coral reefs of Eilat-past, present and future: three decades of coral community structure studies,” in Coral Health and Disease, eds E. Rosenberg and Y. Loya (Berlin; Heidelberg: Springer), 1–34.
Martinez, S., and Abelson, A. (2013). Coral recruitment: the critical role of early post-settlement survival. ICES J. Mar. Sci. 70, 1294–1298. doi: 10.1093/icesjms/fst035
Mazel, C. (1997). Coral fluorescence characteristics: excitation/emission spectra, fluorescence efficiencies, and contribution to apparent reflectance. Ocean Opt. XIII, 2963. doi: 10.1117/12.266450
Mazel, C. H., Strand, M. P., Lesser, M. P., Crosby, M. P., Coles, B., and Nevis, A. J. (2003). High resolution determination of coral reef bottom cover from multispectral fluorescence laser line scan imagery. Limnol. Oceanogr. 48, 522–534. doi: 10.4319/lo.2003.48.1_part_2.0522
Miller, M. W., Weil, E., and Szmant, A. M. (2000). Coral recruitment and juvenile mortality as structuring factors for reef benthic communities in Biscayne National Park, Coral Reefs 19, 115–123. doi: 10.1007/s003380000079
Mundy, C. N. (2000). An appraisal of methods used in coral recruitment studies. Coral Reefs 19, 124–131. doi: 10.1007/s003380000081
Otsu, N. (1979). A threshold selection method from gray-level histograms. IEEE Trans. Syst. Man Cybern. 9, 62–66. doi: 10.1109/TSMC.1979.4310076
Piniak, G. A., Fogarty, N. D., Addison, C. M., and Kenworthy, W. J. (2005). Fluorescence census techniques for coral recruits. Coral Reefs 24, 496–500. doi: 10.1007/s00338-005-0495-1
Rinkevich, B., and Weissman, I. L. (1987). Chimeras in colonial invertebrates - a synergistic symbiosis or somatic-cell and germ-cell parasitism. Symbiosis 4, 117–134.
Roth, M. S., and Knowlton, N. (2009). Distribution, abundance, and microhabitat characterization of small juvenile corals at Palmyra Atoll. Mar. Ecol. Prog. Ser. 376, 133–142. doi: 10.3354/meps07787
Roth, M. S., Latz, M. I., Goericke, R., and Deheyn, D. D. (2010). Green fluorescent protein regulation in the coral Acropora yongei during photoacclimation. J. Exp. Biol. 213, 3644–3655. doi: 10.1242/jeb.040881
Salinas-de-Leon, P., Costales-Carrera, A., Zeljkovic, S., Smith, D. J., and Bell, J. J. (2011). Scleractinian settlement patterns to natural cleared reef substrata and artificial settlement panels on an Indonesian coral reef. Estuar. Coast. Shelf Sci. 93, 80–85. doi: 10.1016/j.ecss.2011.02.016
Shaked, Y., and Genin, A. (2012). Israel National Monitoring Program at the Gulf of Eilat. Eilat: The Interuniversity Institute for Marine Sciences.
Shihavuddin, A. S. M., Gracias, S. M. N., Garcia, R., Gleason, A., and Gintert, B. (2013). Image-based Coral Reef classification and thematic mapping. Remote Sens. 5, 1809–1841. doi: 10.3390/rs5041809
Shlesinger, T., and Loya, Y. (2016). Recruitment, mortality, and resilience potential of scleractinian corals at Eilat, Red Sea. Coral Reefs 35, 1357–1368. doi: 10.1007/s00338-016-1468-2
Shlesinger, Y., Goulet, T. L., and Loya, Y. (1998). Reproductive patterns of scleractinian corals in the northern Red Sea. Mar. Biol. 132, 691–701. doi: 10.1007/s002270050433
Shlesinger, Y., Loya, Y., Masters, W. M., and Simmons, A. (1985). Coral Community reproductive patterns: Red Sea versus the Great Barrier Reef. Science 14, 1333–1335. doi: 10.1126/science.228.4705.1333
Singh, H., Armstrong, R., Gilbes, F., Eustice, R., Roman, C., Pizarro, O., et al. (2004). Imaging coral I: imaging coral habitats with the SeaBED AUV. Subsurface Sens. Technol. Appl. 5, 25–42. doi: 10.1023/B:SSTA.0000018445.25977.f3
Smith, S. R. (1992). Patterns of coral recruitment and post-settlement mortality on bermuda's reefs: comparisons to Caribbean and pacific reefs. Integr. Comp. Biol. 32, 663–673. doi: 10.1093/icb/32.6.663
Soong, K., Chen, M., Chen, C., Dai, C., Fan, T., Li, J., et al. (2003). Spatial and temporal variation of coral recruitment in Taiwan. Coral Reefs 22, 224–228. doi: 10.1007/s00338-003-0311-8
Puill-Stephan, E., Willis, B. L., van Herwerden, L., and van Oppen, M. J. H. (2009). Chimerism in wild adult populations of the broadcast spawning coral Acropora millepora on the Great Barrier Reef. PLoS ONE 4:e7751. doi: 10.1371/journal.pone.0007751
Stokes, M. D., and Deane, G. B. (2009). Automated processing of coral reef benthic images. Limnol. Oceanogr. Methods 7, 157–168. doi: 10.4319/lom.2009.7.157
Treibitz, T., Neal, B. P., Kline, D. I., Beijbom, O., and Roberts, P. L. D. (2015). Wide field-of-view fluorescence imaging of Coral Reefs. Sci. Rep. 5, 1–5. doi: 10.1038/srep07694
Urvoix, L., Fauvelot, C., and Bouchon, C. (2012). “Monitoring of coral larval recruitment on artificial settlement plates at three different depths using genetic identification of recruits (Guadeloupe Island),” in Proceedings of the 65th Gulf and Caribbean Fisheries Institute (Santa Marta), 114–120.
Winters, G., Holzman, R., Blekhman, A., Beer, S., and Loya, Y. (2009). Photographic assessment of coral chlorophyll contents: Implications for ecophysiological studies and coral monitoring. J. Exp. Mar. Biol. Ecol. 380, 25–35. doi: 10.1016/j.jembe.2009.09.004
Yerushalmi, M. (2016). Assessing Coral Recruitment Properties in Eilat's Reef using DNA Barcoding Tools. Master's thesis, University of Haifa, Haifa
Keywords: underwater imaging, ecological monitoring, recruitment, survival, survey
Citation: Zweifler A, Akkaynak D, Mass T and Treibitz T (2017) In situ Analysis of Coral Recruits Using Fluorescence Imaging. Front. Mar. Sci. 4:273. doi: 10.3389/fmars.2017.00273
Received: 25 January 2017; Accepted: 08 August 2017;
Published: 05 September 2017.
Edited by:
Zvy Dubinsky, Bar-Ilan University, IsraelReviewed by:
Ulisse Cardini, Stazione Zoologica Anton Dohrn, ItalyJörg Wiedenmann, University of Southampton, United Kingdom
Copyright © 2017 Zweifler, Akkaynak, Mass and Treibitz. This is an open-access article distributed under the terms of the Creative Commons Attribution License (CC BY). The use, distribution or reproduction in other forums is permitted, provided the original author(s) or licensor are credited and that the original publication in this journal is cited, in accordance with accepted academic practice. No use, distribution or reproduction is permitted which does not comply with these terms.
*Correspondence: Tali Mass, dG1hc3NAdW5pdi5oYWlmYS5hYy5pbA==
Tali Treibitz, dHRyZWliaXR6QHVuaXYuaGFpZmEuYWMuaWw=