 Rafael Rasse1,2*
 Giorgio Dall'Olmo2,3
 Jason Graff4
 Toby K. Westberry4
 Virginie van Dongen-Vogels4
 Michael J. Behrenfeld4
- 1Centro de Ciencias Atmosféricas y Biogeoquímica, Instituto Venezolano de Investigaciones Científicas, Caracas, Venezuela
- 2Plymouth Marine Laboratory, Plymouth, United Kingdom
- 3National Centre for Earth Observation, Plymouth Marine Laboratory, Plymouth, United Kingdom
- 4Department of Botany and Plant Pathology, Oregon State University, Corvallis, OR, United States
Empirical relationships between particulate organic carbon (POC) and inherent optical properties (IOPs) are required for estimating POC from ocean-color remote sensing and autonomous platforms. The main relationships studied are those between POC and particulate attenuation (cp) and backscattering (bbp) coefficients. The parameters of these relationships can however differ considerably due to differences in the methodologies applied for measuring IOPs and POC as well as variations in particle characteristics. Therefore, it is important to assess existing relationships and explore new optical proxies of POC. In this study, we evaluated empirical relationships between surface POC and IOPs (cp, bbp and the particulate absorption coefficient, ap) using an extensive dataset collected during two Atlantic Meridional Transect (AMT 19 and 22) cruises spanning a wide range of oceanographic regimes. IOPs and POC were measured during the two cruises using consistent methodologies. To independently assess the accuracy of the POC-IOPs relationships, we predicted surface POC for AMT-22 using relationships developed based on independent data from AMT-19. We found typical biases in predicting POC ranging between 2–3, 4–9, and 6–13% for cp, bbp, and ap, respectively, and typical random uncertainties of 20–30%. We conclude that (1) accurate POC-cp and POC-bbp relationships were obtained due to the consistent methodologies used to estimate POC and IOPs and (2) ap could be considered as an alternative optical proxy for POC in open-ocean waters, only if all physiological variability in the POC:chl ratio could be modeled and used to correct ap.
Introduction
The biological carbon pump (BCP) is a wide suite of processes through which marine biota remove carbon dioxide from the surface ocean by transporting particulate organic carbon (POC) toward the marine sediments (Volk and Hoffert, 1985). This mechanism contributes to mitigating the earth's climate and affects the main oceanic biogeochemical cycles (Sarmiento and Gruber, 2006). To overcome insufficient spatial and temporal resolution of traditional POC observations, inherent optical properties (IOPs) have been applied as proxies of POC to fully comprehend the key physical and biogeochemical processes that control the BCP (e.g., Bishop et al., 2004; Honjo et al., 2008; Bishop and Wood, 2009).
Particulate beam attenuation (cp), backscattering (bbp), and absorption (ap) coefficients are IOPs used as optical proxies of POC (Gardner et al., 1993; Stramski et al., 1999; Wozniak et al., 2011). The advantage of applying the IOPs as POC proxies is that these optical properties are retrievable from space and/or by autonomous platforms (Lee et al., 1996; Bishop et al., 2002), which allows prediction of POC-fluxes with a greater temporal and spatial resolution than conventional methods (e.g., Bishop et al., 2004; Bishop and Wood, 2009; Briggs et al., 2011; Estapa et al., 2013; Dall'Olmo and Mork, 2014). One of the main limitations of these methods is that they depend on establishing robust empirical relationships between POC and IOPs.
Numerous studies have been devoted to evaluating the relationship between POC and cp (Loisel and Morel, 1998; Bishop, 1999; Claustre et al., 1999; Mishonov et al., 2003; Gardner et al., 2006) and bbp (Stramski et al., 1999, 2008; Balch et al., 2010; Cetinić et al., 2012). These studies have demonstrated that the derived relationships could differ considerably, which in turn affects the accuracy with which POC is predicted. For example, Gardner et al. (2006) found that the slope of the linear regression between POC and cp(660) varied between 10 and 42% for different regions of the North Atlantic. More recently, Cetinić et al. (2012) found good linear relationships (R2 = 0.83) between POC and cp(660) and bbp(550) during the North Atlantic Bloom Experiment (NABE), however their relationships are considerably different from previous ones derived for the North Atlantic (Gardner et al., 2006; Balch et al., 2010). These discrepancies may be due to the spatio-temporal variability of phytoplankton-particle assemblages (e.g., particle size, shape, and chemical composition) and the different methodologies applied to measure POC and IOPs (e.g., Boss et al., 2015 and references therein). Thus, it has been suggested that a single global algorithm cannot accurately predict POC (Gardner et al., 2006; Cetinić et al., 2012). Alternatively, robust global relationships may be achieved by exploiting consistent protocols to measure POC and IOPs over a wide range of oceanic conditions and particle assemblages (e.g., Gardner et al., 2006).
Most in-situ studies have focused on the relationship between POC and bbp or cp, but there is little information on the utility of ap as a POC proxy (Stramski et al., 2008; Allison et al., 2010a). As with bbp, ap can be derived from satellite ocean color data (e.g., Mitchell et al., 2014). In contrast, cp can only be indirectly estimated from remote sensing, which introduces additional uncertainties on predicted POC. Uncertainties in bbp retrieval from remote sensing still remain and instruments for in-situ measurements of bbp may not be sensitive enough for the open ocean (Twardowski et al., 2007; Dall'Olmo et al., 2012). Thus, POC-bbp relationships may be noisier than POC-cp relationships.
Recently, Allison et al. (2010a,b) found a robust relationship between estimates of in situ POC and blue-green reflectance ratio in the open Southern Ocean. Stramski et al. (2008) developed a similar relationship using data from the Pacific and Atlantic oceans. Allison et al. (2010a) suggested that the variability of the green reflectance ratio is mainly driven by the particle absorption coefficient. Similar results were found in more optically-complex waters between POC and ap(440) (Wozniak et al., 2011). The main goals of the current study are to evaluate the potential factors controlling the accuracy of POC-IOPs relationships (bbp and cp) in the surface open ocean and the reliability of ap as POC proxy. To this aim, we develop and compare empirical relationships between surface POC and IOPs (ap, bbp, and cp) using an extensive data set collected during two Atlantic Meridional Transect (AMT) cruises, during which we applied rigorous and consistent protocols to determine IOPs and POC. More specifically, we (1) evaluate the potential sources of uncertainties in POC measurements, and (2) estimate the accuracy of the POC-IOPs relationships developed in this and earlier studies, and discuss the reasons that explain the differences observed between them. From the latter analysis, we highlight that the application of consistent methodologies to measure POC and bio-optical variables is needed to accurately predict POC from POC-IOPs relationships.
Materials and Methods
Description of the Study Area
Data were collected during AMT-19 (28th October to 22nd November 2009) and AMT-22 (11th October to 20th November 2012). Both cruises spanned the wide range of oceanographic regimes found at latitudes between ~46°N−46°S (Figure 1).
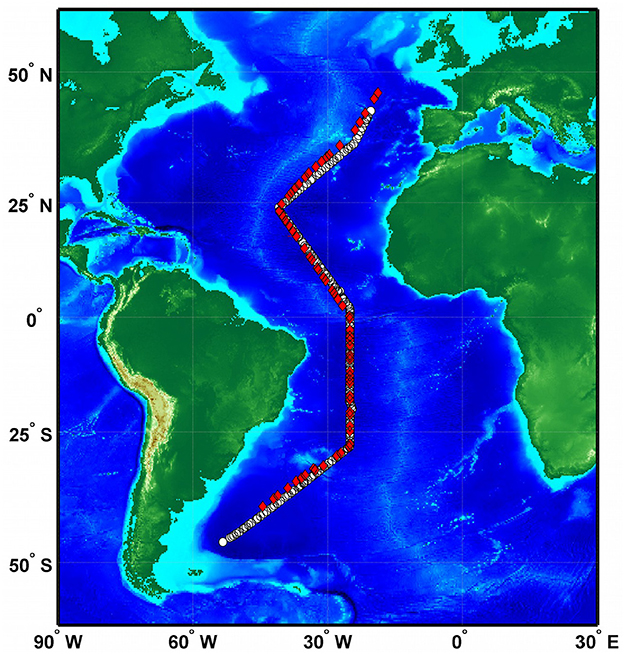
Figure 1. Sampling location for AMT-19 (red diamonds) and AMT-22 (white circles).
Chlorophyll a and Underway Optical Measurements
Chlorophyll a
Chlorophyll-a concentration was estimated optically and by means of high performance liquid chromatography (HPLC). Surface seawater was collected from the ship's clean seawater supply and filtered through pre-combusted (4 h at 450°C) 25-mm Whatman GF/F filters (1–4 liters, depending on the trophic status of the water masses). Samples were flash-frozen in liquid nitrogen, stored at −80°C and then analyzed using HPLC analysis (Van Heukelem and Thomas, 2001; Mueller et al., 2003). The concentration of total chlorophyll-a was calculated as the sum of the chlorophyll-a, monovinylchl-a, divinyl chlorophyll-a, and chlorophyllide-a (Figure 2).
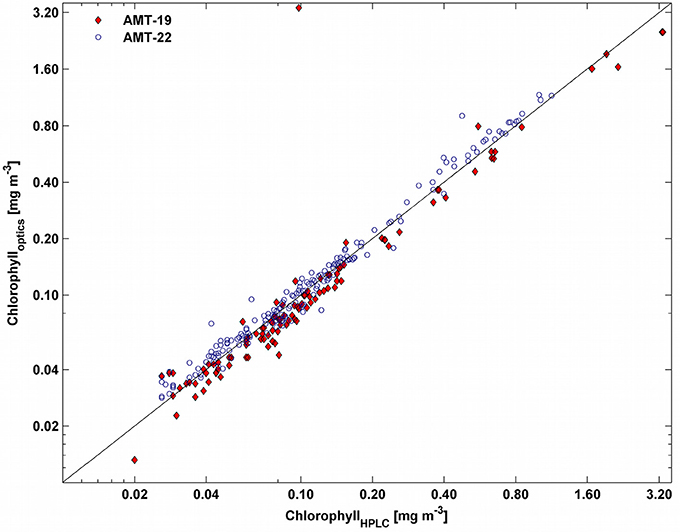
Figure 2. Relationship between chlorophyll-a determined by HPLC and that estimated optically (not bias corrected) for AMT-19 (red diamonds) and AMT-22 (blue circles). The black line indicates the 1:1 relationship.
Optically-derived chlorophyll-a was calculated using the height of the particle absorption peak at 676 nm following Boss et al. (2007), using data from both AC-9 and AC-s measurements during AMT-19 (Dall'Olmo et al., 2012) and using only AC-s data for AMT-22. Optically-derived chlorophyll-a concentration was validated by comparing it to the HPLC-based total chlorophyll-a (see Figure 2). Biases of −10 and +3% (median relative differences) were found for AMT-19 and AMT-22, respectively. These biases were then removed from the optically-derived chlorophyll concentrations for the rest of the analysis. This bias-corrected optically-derived chlorophyll-a is henceforth referred to as chlop whereas HPLC-based total chlorophyll-a is referred as chlhplc.
Beam Attenuation and Absorption Coefficients
Continuous optical measurements were collected on seawater pumped from a nominal depth of 5 m into the clean underway supply of the RRS James Cook. Bubbles were removed by means of two Vortex debubblers connected in series (model VDB-1G, Stony Brook, NY, USA).
During both cruises particulate beam attenuation coefficients (cp) were determined by two 25-cm WETLabs C-star transmissometers (526 and 650 nm). Hyperspectral cp and particulate absorption coefficients (ap) were also measured between 400 and 750 nm by a 25-cm WETLabs spectral absorption and attenuation meter (AC-s, 5-nm spectral sampling, 15-nm band pass). As explained in Dall'Olmo et al. (2012), during AMT-19 the AC-s instrument failed (~year day 298) and was replaced by a WETLabs AC-9 instrument (nine wavelengths between 412 and 715 nm, 10-nm band pass).
Particulate absorption and beam-attenuation coefficients, ap and cp, were determined by subtracting from the bulk signals those measured on 0.2-μm filtered (Cole Parmer nylon cartridge) seawater as previously described (Dall'Olmo et al., 2009, 2012; Slade et al., 2010).
Since the AC-9 has a band pass narrower than the AC-s (10 vs. 15 nm), differences are expected between ap spectra collected simultaneously by the two instruments (Dall'Olmo et al., 2012). To make the ap data derived from the AC-s comparable with those derived from the AC-9, we performed an intercalibration by computing the ratio of ap derived from the AC-s to ap derived from the AC-9 at the same chlop concentration (±10%) for different values of chlop concentrations (n = 25, logarithmically spaced between 0.03–5 mg m−3) and for the two wavelengths used in this analysis (i.e., 440 and 676 nm). The rationale for this comparison is that, even if collocated spectra of AC-9 and AC-s were not available, for a given chlop concentration, we expect that in the open ocean the ap spectra collected by AC-9 and AC-s should, to first order, be comparable. This similarity is a priori expected to be higher at 676 nm, where chl is the most important contributor to ap, than at 440 nm, where other optically-active constituents (e.g., detritus, accessory pigments) have higher contributions. We avoided green wavelengths due to the very low values of ap, which would significantly increase uncertainties. Average (± standard deviation) apACS:apAC9 ratios of 0.68 (±0.05) and 0.60 (±0.02) were found at 440 and 676 nm for AMT-22, and of 0.75 (±0.08) at 676 nm for AMT-19 irrespective of chlop. In contrast, during AMT-19 the average apACS:apAC9 ratios at 440 nm varied between 0.90 and 1.4 with chlop. To account for this variation, we fitted a second-order polynomial (R2 = 0.97) between the values of the ratio and chlop and used the fitted regression coefficients to calculate apACS:apAC9 ratios at 440 nm for any chlop value during AMT-19. We finally corrected the ap values measured by the AC-s instruments by dividing them by (1) the average ratios found for AMT-19 (at 676 nm) and AMT-22 (at 440 and 676 nm), and (2) the apACS:apAC9 ratios at 440 nm for a given chlop for AMT-19. These corrected ap values were used for the rest of the analysis.
Particulate Backscattering
Continuous measurements of the particulate backscattering coefficient (bbp) were carried out by means of a WETLabs ECO-BB3 meter (470, 526, and 660 nm) installed in a flow-through chamber as described in Dall'Olmo et al. (2009 and 2012). More details about the bbp determination as well as the calibration and characterization of the instrument can be found in Dall'Olmo et al. (2009 and 2012) and Behrenfeld et al. (2013, supplementary materials). During AMT-19 flow-through bbp(470;526) data were validated against in-situ bbp values measured with an independent instrument that was deployed on a profiling package (see details in Dall'Olmo et al., 2012). Biases of 16 and 13% and precisions of 6 and 7% were found between the two independent methods for the coincident bbp(470) and bbp(526) measurements, respectively and demonstrated that the underway system was clean during AMT-19. Unfortunately, we did not conduct a similar intercalibration during AMT-22.
Particulate Organic Carbon
Seawater samples (0.5–4 l) were collected from the ship's clean seawater supply (~5 m depth) and filtered through pre-combusted (4 h at 450°C) 25-mm Whatman GF/F filters under low vacuum (120 ≤ mmHg) by open-filter funnels. Each filter was stored in pre-combusted aluminum envelopes, frozen, and stored using the same protocol indicated for HPLC samples, and analyzed in the laboratory after the cruises.
Two methods were used to quantify the contribution of dissolved organic carbon (DOC) adsorbed on the filters (Moran et al., 1999; Gardner et al., 2003). This allowed us to assess their consistency and select the best method to estimate carbon mass retained by the filter blanks. The first method (“intercept-blanks”) consisted of filtering three volumes of seawater (0.5–1, 0.75–2, and 2–4) for each sample and regressing the mass of carbon measured on each filter vs. the corresponding volume. The intercept of this regression provided our first estimate of the blank (i.e., mass of carbon present on the filter due to DOC adsorption; Menzel, 1966; Abdel-Moati, 1990; Moran et al., 1999; Gardner et al., 2003; Liu et al., 2005, 2009; Turnewitsch et al., 2007). The second method (“filter-blanks”) consisted of re-filtering through a clean pre-combusted GF/F filter the filtrate from the sample with the intermediate volume (0.75–2l). These filter blanks were then stored and analyzed as the bulk POC samples.
To determine the POC concentration, filters were first fumed with hydrochloric acid (12N HCl) at room temperature and then POC was determined by standard high-temperature combustion technique (Knap et al, 1996). The cruise-specific average mass of carbon calculated by the intercept-blanks method was removed from each sample as in Cetinić et al. (2012). POC was finally computed as the average concentration derived from the three different volumes collected for each sample. We also estimated the average sample mass (POC signal) and mean filter-blank mass (blank) ratio to compute the relative contribution of the blank to the bulk POC signal. The POC signal-to-blank ratio was relatively low in oligotrophic regions (e.g., ~3, see Figure 3C). This therefore indicated that uncertainties in POC measurements could potentially increase in these areas (Moran et al., 1999). To increase the signal-to-noise ratio when it was lower than 3, we calculated POC by excluding the samples with the smallest volume (<1, Moran et al., 1999). Finally, to parameterize bio-optical models, we fitted power laws between POC and IOPs. We used log-transformed data to better resolve the bio-optical variability at small POC values as suggested by Campbell (1995).
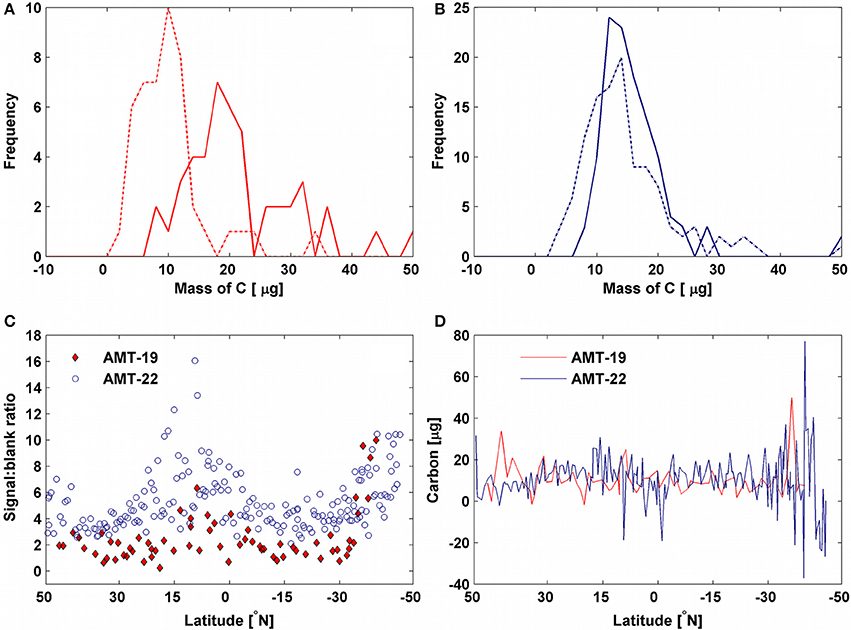
Figure 3. Frequency distribution of the mass of carbon measured by filter-blanks (solid lines) and calculated by intercept-blanks (dash-dot lines) for (A) AMT-19 (red) and (B) AMT-22 (blue). Latitudinal variability of the (C) ratio between mass of carbon in the intermediate-volume samples and mass of carbon in the filter blanks obtained from the corresponding filtrate and (D) mass of carbon on the filter blanks calculated by intercept-blanks for AMT-19 (red) and AMT-22 (blue), respectively.
Results
Chlorophyll a
Chlorophyll concentration ranged between 0.02–1.42 and 0.03–1.26 mg m−3 for AMT-19 and AMT-22, respectively (Figure 4A). Similarly, during both expeditions chlhplc showed a latitudinal pattern which followed the well-established biogeographical provinces of the Atlantic Ocean (Longhurst, 1998) as in previous AMT cruises (Tarran et al., 2006; Aiken et al., 2009).
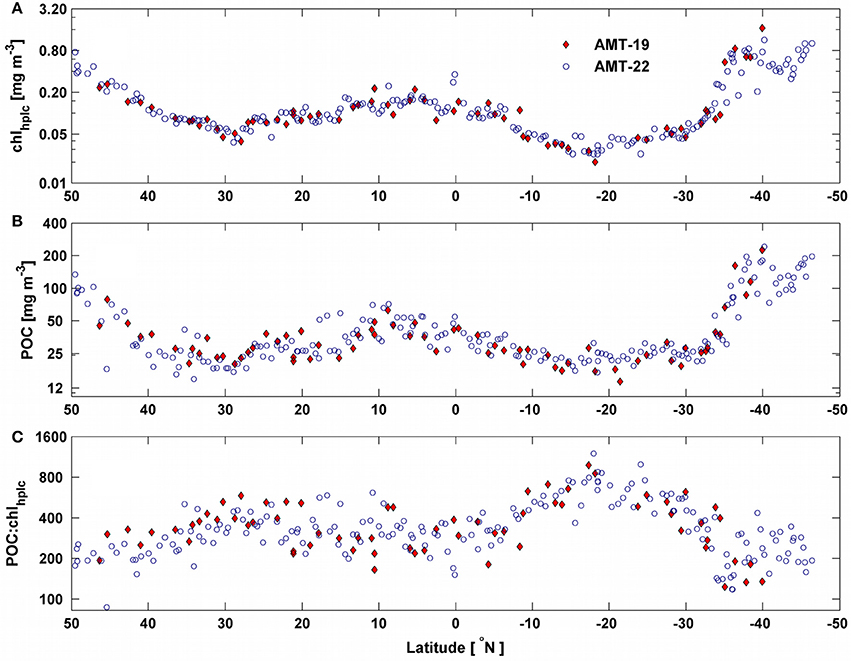
Figure 4. Latitudinal variability of (A) chlhplc; (B) POC and (C) POC:chlhplc ratio for AMT-19 (red diamonds) and AMT-22 (blue circles). Note that all y-axes are in log scale.
POC Measurements
Mass of Carbon in Blanks
During AMT-22 both methods for determining the blank carbon mass produced consistent results, with average (±standard deviation) masses for the filter and intercept blanks of 15.5 ± 6.5 μg C (n = 196) and 14.9 ± 8.7 μg C (n = 114), respectively (Figure 3B). However, for AMT-19, filter-blanks [averages of 24.9 ± 17.9 μg C (n = 69)] were ~2.3 times larger than intercept-blanks [averages of 10.9 ± 8.7 μg C (n = 68), Figure 3A], indicating a potentially greater contamination of the filter blanks during AMT-19 relative to AMT-22. Nonetheless, the blank values determined in this study with either method were within (or lower than) the range of those reported in the literature (19–25 μg C; Menzel, 1966; Moran et al., 1999; Cetinić et al., 2012), which supports the rigorousness of our POC protocol (e.g., our coefficient of variation had a mean value of 0.06 and ranged between 0.01 and 0.26). Since the intercept-blank method produced values that were consistent between the two cruises, we used the average intercept-blanks calculated for each cruise separately to derive POC. During AMT-22 4% of the intercept-blanks were negative (Figure 3D) and these values were mostly located in productive areas of the Atlantic (63% of the negative intercepts were found where POC > 60 mg m−3). These negative values are discussed in section POC Blanks and Accuracy.
POC
The observed range of POC was consistent between the two cruises (15–230 mg m−3) and with previous studies for the Atlantic ocean (Poulton et al., 2006; Balch et al., 2010). POC showed a first-order spatial pattern similar (R2 = 0.83) to that of chlhplc (Figures 4A,B). However, the POC:chlhplc ratio showed an opposite latitudinal pattern (i.e., maxima in the most oligotrophic regions) and varied by a factor of 12 and 14 for AMT-19 and AMT-22, respectively (Figure 4C).
Inherent Optical Properties
All optical properties showed latitudinal patterns qualitatively similar to those of POC and chlhplc during both cruises (Figure 5). While cp(440) and ap(440) values overlapped during both cruises, bulk bbp(470) was on average 30% larger during AMT-19 than bbp(470) measured during AMT-22 for most of the transect (Figure 5). However, bulk bbp(470) matched when signals measured on 0.2-μm were subtracted from the AMT-19 bulk bbp(470) (see detailed explanations in Dall'Olmo et al., 2012). This result suggests that the backscattering signal measured on 0.2-μm water can be used to remove biases in flow-through backscattering measurements.
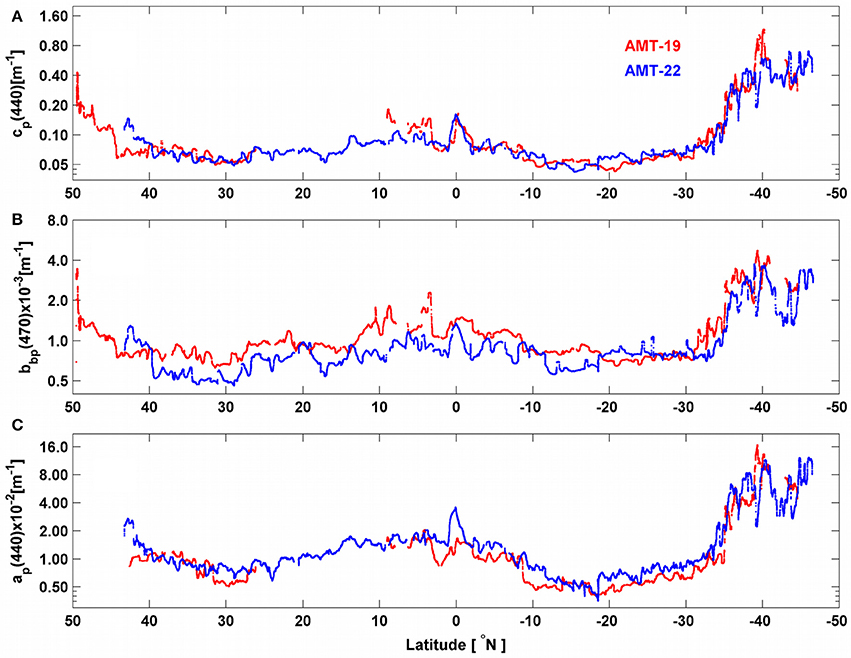
Figure 5. Spatial distribution of (A) cp(440), (B) bbp(470) and (C) ap(440) for AMT-19 (red points) and AMT-22 (blue points). Note that all y-axes are in logarithmic scale.
Observed IOPs were well correlated (R2 ranged between 0.71–0.91, Figure 6) with each other. In most cases, power law fits between IOPs and chlop were comparable with previous optical models, except for ap(440) vs. chlop where the slope was about 66% steeper than previously reported (equation 4 in Bricaud et al., 1998; Figures 7E,F).
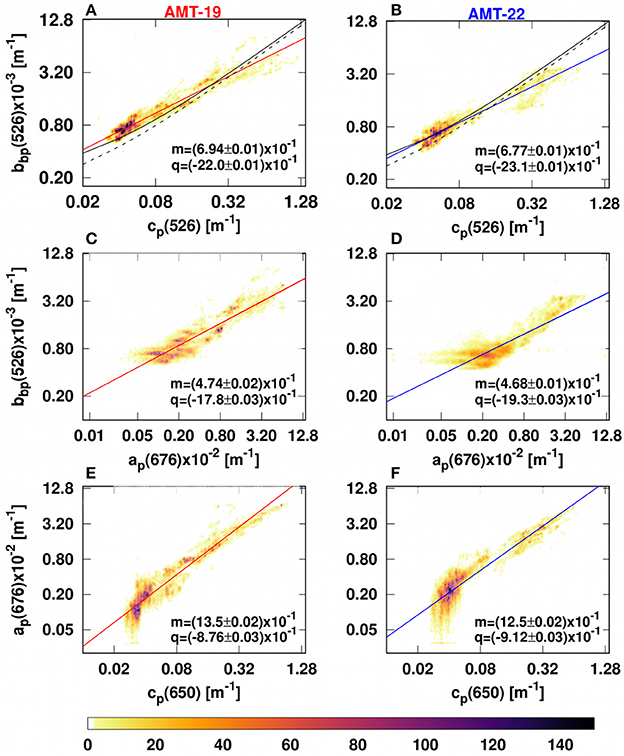
Figure 6. Bivariate histograms showing the relationships between IOPs during AMT-19 (left) and AMT-22 (right). (A,B) Describe bbp(526) vs. cp(526). (C,D) and (E,F) Describe bbp(526) vs. ap(676) and ap(676) vs. cp(650), respectively. The solid and dotted black lines in (A,B) are the prediction from Westberry et al. (2010) and Dall'Olmo et al. (2009) models, respectively. The solid red (left) and blue (right) lines are our best fits for AMT-19 and AMT-22, respectively. The colorbar indicates the number of data points per bivariate bin. Our relationships were fitted using a power law function (log10 (IOPs) = m × log10 (IOPs) + q). cp(650) values were measured by a C-star transmissometer.
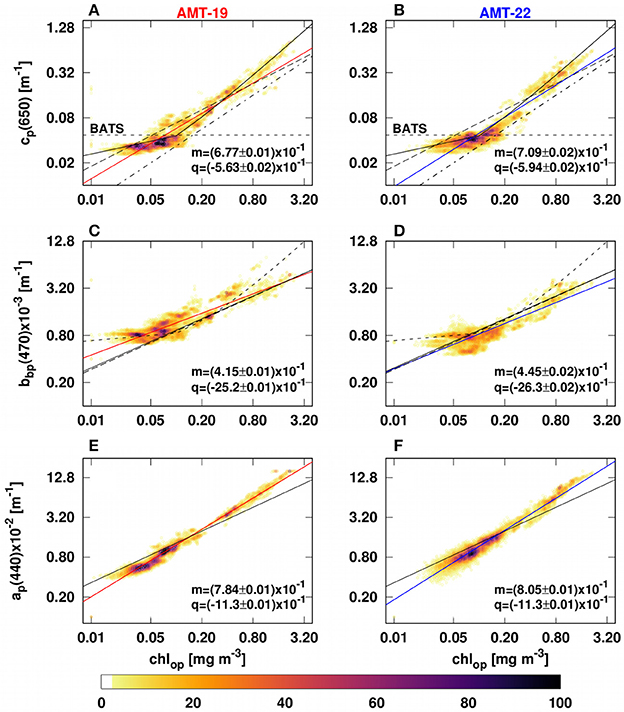
Figure 7. Bivariate histograms showing the relationships between IOPs and chlop during ATM-19 (left) and AMT-22 (right). (A,B) describe cp(650)-C-star vs. chlop. The solid, dashed and dash-dot lines in (A,B) are the linear fits reported by Behrenfeld and Boss (2006), Huot et al. (2008) and Loisel and Morel (1998), respectively. The dotted black line in (A,B) was reported by Behrenfeld and Boss (2006) and it shows that cp and chl are not correlated in the Bermuda Atlantic Time Series (BATS). (C,D) describe bbp(526) vs. chlop. The solid, dashed and dash-dot lines in (C,D) are the linear fits reported by Antoine et al. (2011), Dall'Olmo et al. (2009) and Huot et al. (2008), respectively. (E,F) describe ap(440) vs. chlop. The black line in (E,F) is the linear fit calculated by Bricaud et al. (1998). The solid red (left) and blue (right) lines are our best fits for AMT-19 and AMT-22, respectively. The color bar indicates the number of data points per bivariate bin. Our relationships were fitted using a power law function (log10(IOPs) = m × log10(chlop) + q).
POC and IOPs were correlated during both cruises (Figures 8, 9, Tables 1–3; R2 ranged between 0.76–0.95) regardless of the spectral region of the measurement, however, the accuracy of the derived POC-IOPs relationships varied between cruises (2–13%) and regions of the spectrum (Figures 8, 9, Tables 1–3).
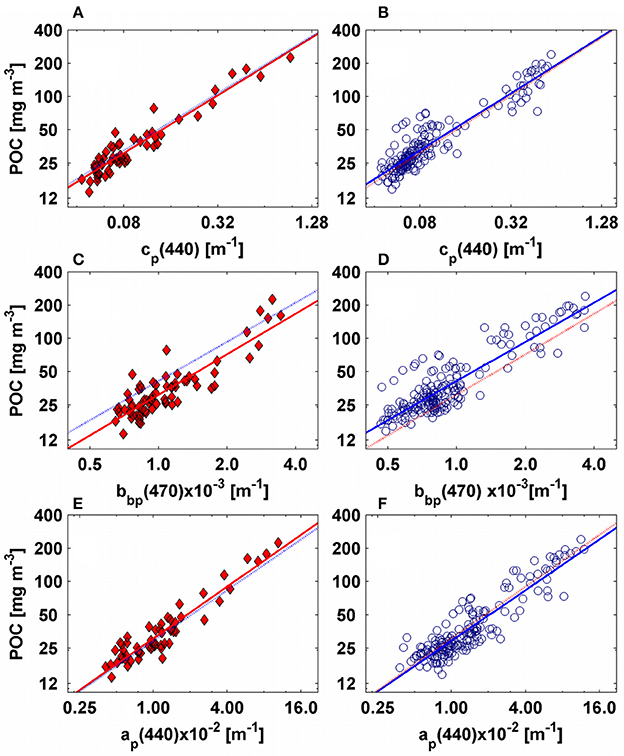
Figure 8. Empirical relationships between POC and IOPs for AMT-19 (left figures, red diamonds) and AMT-22 (right figures, blue circles). For all figures the solid red and blue lines represent our best fits calculated for AMT-19 and AMT-22, respectively. The dotted red and blue lines are the POC predicted by the AMT-19 and AMT-22 empirical relationships, respectively. Plots (A,B) present POC vs. cp(440), while (C,D) present POC vs. bbp(470). (E,F) are POC vs. ap(676).
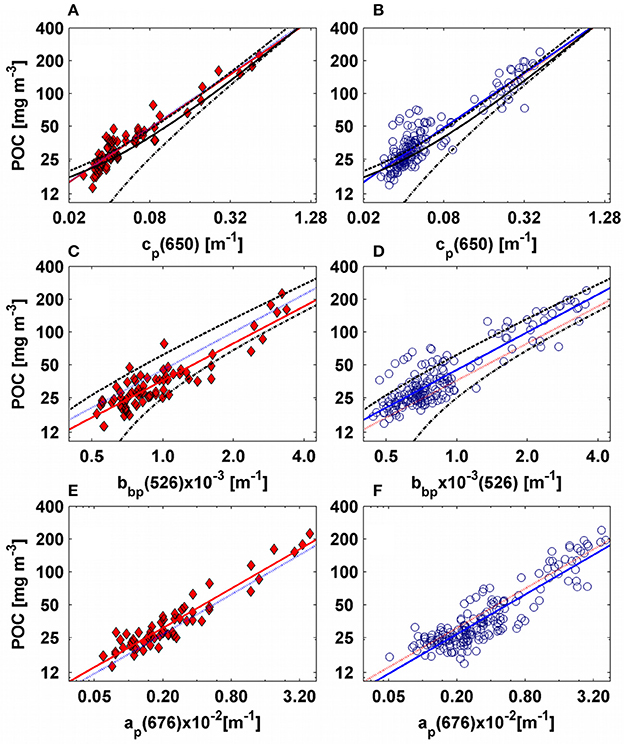
Figure 9. Empirical relationships between POC and IOPs for AMT-19 (left figures, red diamonds) and AMT-22 (right figures, blue circles). For all figures the solid red and blue lines represent our best fits calculated for AMT-19 and AMT-22, respectively. The dotted red and blue lines are the POC predicted by AMT-19 and AMT-22 relationships, respectively. The (A,B) present POC vs. cp(650)-C-star, while (C,D) are the POC vs. bbp(526). (E,F) are POC vs. ap(676). From (A–D) the dashed-dotted and dashed black lines are the linear fits reported by Cetinić et al. (2012) and Stramski et al. (2008) for the corresponding IOP (see Tables 2, 3). In (A,B) the solid black line is the model reported by Gardner et al. (2006)-global.
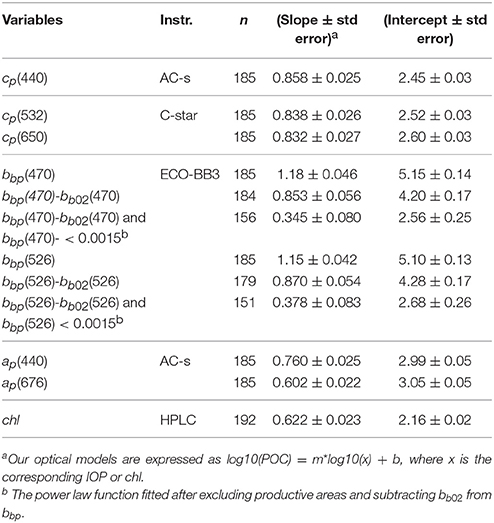
Table 1. Empirical relationships between POC, IOPs, and chl for AMT-22.
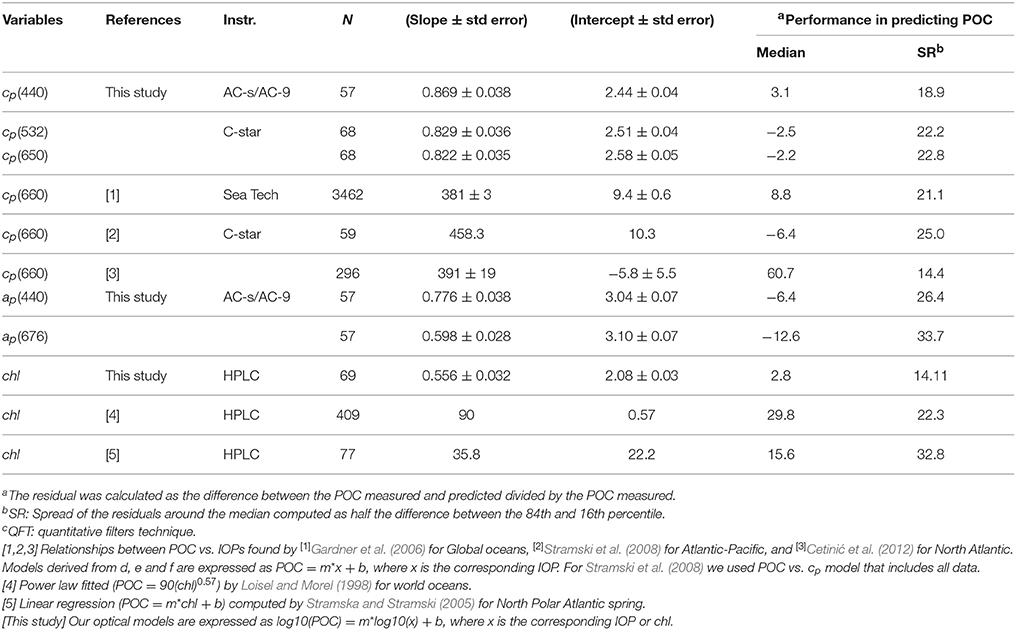
Table 2. Accuracy of AMT-19 bio-optical relationships to predict surface POC measured during AMT-22.
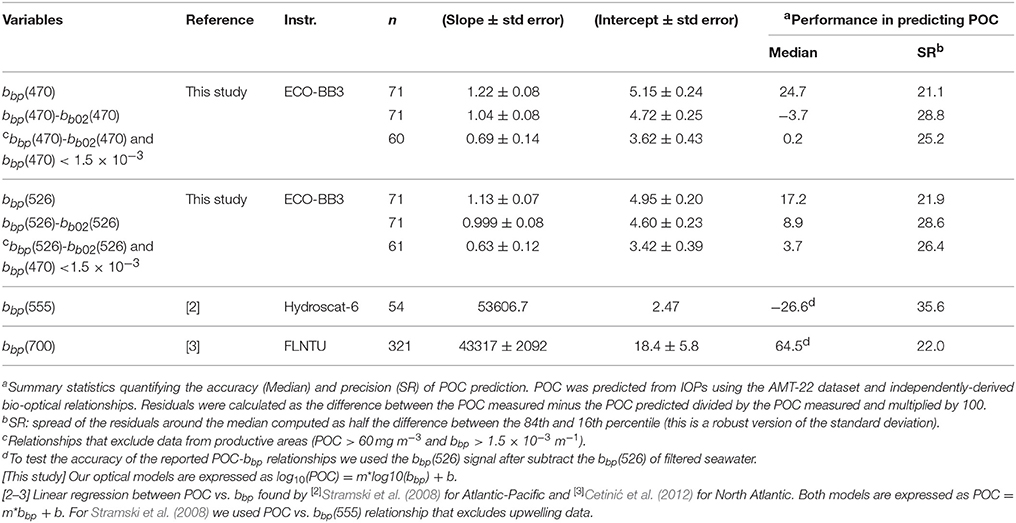
Table 3. Accuracy of POC-bbp models derived from AMT-19 in predicting surface POC measured during AMT-22.
Discussion
POC Blanks and Accuracy
Factors such as sample handling, vacuum pressure, and sample volume are known to introduce uncertainties in measured POC which, in turn, affect the accuracy of the relationships between POC and optical properties (e.g., Gardner et al., 2003 and references therein). In this study we followed recommendations from these previous studies to maximize the accuracy of our POC measurements (see section Particulate Organic Carbon). However, we also assessed how the blank varied between two methods (i.e., intercept-blanks and filter-blanks), along a latitudinal transect, as well as attempted to explain negative intercept-blanks in productive areas.
To explain why filter-blanks were larger than intercept-blanks, we hypothesize that by re-filtering the same seawater (as during the filtrate-blanks method) additional sources of contamination and/or uncertainties could be introduced. This may be particularly important in oligotrophic regions where POC is very low and the signal-to-blank ratio reaches its lowest values (Figure 3C). To minimize contamination of blanks, we recommend the use of two stacked GF/F filters as done in previous studies (Menzel, 1967; Liu et al., 2005, 2009; Cetinić et al., 2012), even though filtration times increase considerably.
We further evaluated the latitudinal patterns of the intercept-blanks. We found a large number (63%) of negative intercepts in the southern productive region of the AMT-22 transect (with POC ranging around 60–230 mg m−3, Figure 3D). Interestingly, the relationships between carbon mass and filtered volume resulting in negative intercepts were less linear (R2 statistics were: min = 0.921; median = 0.980; max = 0.997; n = 11) than for other samples along the transect (R2 statistics were: min = 0.965; median = 0.997; max = 0.999; n = 89; Figure 10). We hypothesize that this loss of linearity could be due to a saturation of the filters likely caused by the large concentrations of particulate carbon found in these regions. If this was indeed the case, then filters could have become more efficient at retaining POC resulting in the higher carbon masses per unit volume evident in Figure 10. These results indicate that the protocols for determining POC can still be improved.
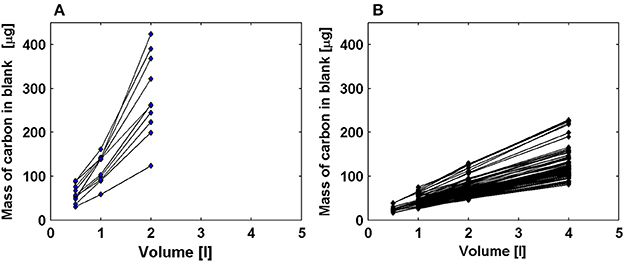
Figure 10. Relationship between mass of carbon and volume of seawater filtered for (A) data with negative intercepts significantly different from zero and located in high latitudes (POC > 60 mg m−3) and (B) data with positive intercepts significantly different from zero in oligotrophic areas (POC < 60 mg m−3). Figures only include data from AMT-22.
Toward this aim, we propose to use data from optical transmissometers (commonly available on the ship's rosette) to define the optimal volume of water to be filtered on GF/F filters for determining POC without saturating filters. Our data indicate that linearity in the carbon mass vs. filtered volume relationship was maintained at (1) relatively high values of POC and particulate beam-attenuation coefficient (122 ± 35 mg m−3 and 0.28 ± 0.06 m−1, respectively) when filtered water did not exceed 1 liter and (2) at low POC and cp(650) values (~29 ± 9 mg m−3 and ~0.04 ± 0.01 m−1, respectively) when up to 4 liters of seawater were filtered. Therefore, we propose an empirical relationship to estimate the maximum volume to be filtered for POC analysis (Vmax, in liters) based on cp(650) (from WETLabs C-star transmissometer, in m−1) and valid for cp(650) ranging between 0.02 and 0.46 m−1:
Using this empirical relationship, we predicted Vmax for all cases where the intercept was negative and for those positive intercept-blank values that were not significantly different from zero. We found that, in most cases, the Vmax was lower than the amount of seawater filtered (data not shown). Therefore, we recommend using this empirical relationship to estimate Vmax in future studies.
Comparison of IOPs Measurements and Existing Bio-optical Models
The relationships between bbp(526) and cp(650) vs. chlop observed for AMT-19 and AMT-22 (Figure 7) were in agreement with published bio-optical models (Bricaud et al., 1998; Huot et al., 2008; Dall'Olmo et al., 2009; Antoine et al., 2011). Similar results were also obtained for bbp(526) vs. cp(526) (Figures 6C,D). However, our power-law slopes for the ap(440)-chlop relationship were on average 66% steeper than that obtained by Bricaud et al. (1998) by their equation 4 (see our Figures 7E,F).
In open-ocean waters, the slope of the ap(440)-chl relationship is driven by the absorption of phytoplankton (aph) and non-algal particles (anap) (Bricaud et al., 1998). Nevertheless, aph would be the main factor determining the slope of the ap(440)-chl relationship because it accounts for about 73–80% of the total ap(440) (Bricaud et al., 1998; Allison et al., 2010a). Therefore, the slope of the ap(440)-chl relationship has been mainly attributed to the packaging effect and/or the variability of accessory pigments due to changes in the trophic status (Kirk, 1975; Morel and Bricaud, 1981; Bricaud et al., 1995). Our ap(440)-chlop relationship suggests that the package effect and/or the variability in accessory pigments may have a smaller influence than expected (Figures 7E,F). Alternatively, the steeper slope of our relationship could be due to an overestimation of ap(440) resulting from lower accuracy of the scattering correction in the blue region of the AC-meter data (Slade et al., 2010).
Another potentially important reason for our steeper slope could be the difference between the methods applied to measure ap(440). While we used optical data derived from the AC-s and AC-9 absorption and attenuation meters, Bricaud et al. (1998) employed the quantitative filter technique (QFT). The QFT concentrates particles on a filter and can result in optical pathlengths of up to 20 m (Trüper and Yentsch, 1967). This technique requires a correction for pathlength amplification (β factor), that, in most cases, is non-linear and known to introduce uncertainties (Bricaud and Stramski, 1990 and references therein; Allali et al., 1997). By contrast, the pathlength in an AC-s or AC-9 is 25 cm and no correction for pathlength amplification is needed. Testing whether this methodological difference explains the differences in the chl-driven ap(440) bio-optical model is however beyond the scope of this study.
Relationship between POC and chl
The main challenge in applying chl as POC proxy is the high spatio-temporal variability of the POC:chl ratio due to physiological photoacclimation, variations in the community composition and phytoplankton biomass, and possibly also from variations in the relative contribution of detritus and phytoplankton to the bulk POC (Behrenfeld et al., 2002, 2005, 2015; Gardner et al., 2006 and references therein). Thus, to accurately predict POC from chl, the POC-chl relationships must (implicitly or explicitly) parameterize the variability in the POC:chl ratio.
The AMT cruise spans a wide range of Atlantic regimes characterized by specific phytoplankton communities acclimated to specific environmental conditions (e.g., prokaryotes and micro-phytoplankton dominate oligotrophic gyres and high temperate latitudes, respectively), (Aiken et al., 2009; Martinez-Vicente et al., 2013; Graff et al., 2015). As a consequence, we found that the POC:chl ratio varied on average by a factor of 13 during both cruises, with its lowest and largest values in the productive areas and oligotrophic gyres, respectively (Figure 4C). Interestingly, we found similar POC:chl ratios at similar latitudes along the transect during both cruises, likely because we have sampled similar phytoplankton communities acclimated to similar environmental conditions. This similarity between the POC:chl ratios measured at similar latitudes during two independent AMT cruises, suggests that, although the measured range of POC:chl ratios is wide, this ratio is changing in a relatively predictable manner from 1 year to the next at a given latitude. Thus, it should possible to empirically model, at least part of, the variability of the POC:chl.
To test the above hypothesis, we quantified the accuracy of the POC-chl relationships by predicting surface POC for AMT-22 by means of the independently-derived power laws fitted from AMT-19 and others studies (see Tables 1, 2, Figure 11). Our POC-chlhplc relationship predicted surface POC with a median error (calculated as the difference between the POC measured minus the POC predicted divided by the POC measured and multiplied by 100) that was between 6- and 11-fold lower than those calculated from previous studies (Table 2). We propose that this relatively high level of accuracy is achieved because our model is implicitly parameterizing some of the factors (e.g., community composition, phytoplankton biomass among others) affecting the variability in POC:chl ratio along the Atlantic transect during this period of the year. However, we cannot argue that this model will accurately predict POC during different seasons or in other ocean regions, because of the expected high variability in the POC:chl ratio (Behrenfeld et al., 2002, 2005, 2015). For example, in oligotrophic regions (e.g., chl < 0.10 mg m−3) this model could underestimate POC (see Figures 7A,B, 9A,B, 11 in this study and Figures 5B,C in Behrenfeld and Boss, 2006), because in these areas the temporal variability in chl, and thus in the POC:chl ratio, is mostly driven by intracellular changes in phytoplankton pigmentation and not by changes in carbon biomass (Behrenfeld and Boss, 2003, 2006). In other words, we cannot expect that our POC-chl relationship will predict POC in regions where pigment concentrations are driven by photoacclimation. To demonstrate this, we regressed POC vs. chl using only data with chl < 0.1 mg m−3 and found that the two variables are poorly correlated (R2 ranged between 0.14 and 0.33).
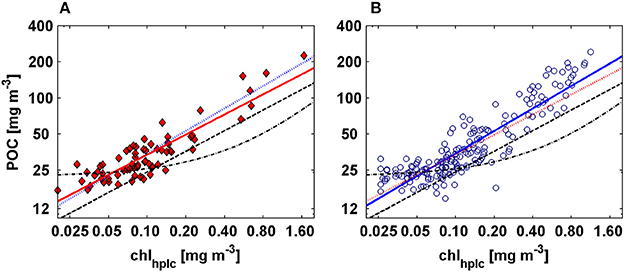
Figure 11. Power law relationship fitted between POC vs. chlhplcfor AMT-19 (red diamonds) and AMT-22 (blue circles). The solid red and blue lines represent our best power law fits calculated for AMT-19 and AMT-22, respectively. Dashed and dashed-dotted black lines are the relationships computed by Loisel and Morel (1998) and Stramska and Stramski (2005), whereas the dotted red and blue lines are the POC predicted from AMT-19 and AMT-22 POC-chlhplc models, respectively.
Relationships between POC and IOPs
Particulate Beam Attenuation Coefficient
The POC-cp relationship has been extensively tested in the literature (e.g., Gardner et al., 2006; Cetinić et al., 2012 and references therein) and it has been shown that its slope can vary by up to 1.8-fold between open-ocean regions (Gardner et al., 2006). The power-law fit computed here was similar in the three spectral regions and the POC-cp(650) relationship (cp derived from WETLabs C-star transmissometer) was consistent with previous studies, regardless of whether cp was derived with the same or different (e.g., Sea Tech) transmissometers (Figures 9A,B). To compute the accuracy with which the POC-cp(650) relationship can predict surface POC, we used the method described above for the POC-chlhplc relationship. We found that the POC-cp(650) relationship developed using AMT-19 data can predict the POC values of AMT-22 with a median error of −2.2%, which was similar or lower than that computed from most published relationships (see Table 2). In addition, our POC-cp relationships have typical uncertainties comparable to our POC-chlhplc relationship (Table 2).
On the other hand, the lower predictive accuracy of the POC-cp(660) relationship proposed by Cetinić et al. (2012) could be due to the specific temporal and environmental conditions of their study (e.g., North Atlantic spring bloom, dominance of diatoms). If this was the case, then this relationship may need to be considered specific for the North Atlantic bloom periods. Cetinić et al. (2012) report that the lowest POC-cp slopes are found in areas with larger phytoplankton communities (e.g., diatoms with low carbon-cell volume ratio), whereas their largest slopes are found in ocean regions where smaller phytoplankton dominate (e.g., pico-eukaryotes). Similarly, DuRand et al. (2002) indicate that cp per unit of carbon may increase with phytoplankton cell size. Our data are consistent with these earlier studies in that prediction errors of the POC-cp(660) relationship derived by Cetinić et al. (2012) tend to decrease in highly-productive areas (POC > 60 mg m−3, Figures 9A,B) dominated by larger phytoplankton communities.
The POC-cp relationship has the advantage that cp(660) has been measured during the last decade from oceanographic rosettes. However, cp cannot be derived directly from satellite data and optical transmissometers are not routinely deployed on autonomous platforms. Thus, there is still a need to evaluate other optical proxies of POC.
Factors Affecting Prediction of POC from Particulate Backscattering Coefficient
As with all inherent optical properties, particulate backscattering covaries to first order with the concentration of suspended matter, but it is also sensitive to changes in particle composition and size, which vary spatially and temporally as a result of external events (e.g., atmospheric deposition) as well as physical (e.g., aggregation-disaggregation) and biogeochemical processes (e.g., mineralization-dissolution) (Stramski et al., 2004a). In addition, it is challenging to measure bbp in the open ocean with high accuracy because of limitations of current sensors (Twardowski et al., 2007; Dall'Olmo et al., 2012). This optical property, however, has the advantages of being retrievable from ocean-color remote sensing and being measured in situ by autonomous platforms. Thus, bbp has been used as a proxy of POC in open-ocean waters where optical properties are dominated by biogenic organic matter (Morel and Prieur, 1977; Smith and Baker, 1978; Stramski et al., 2008).
We computed power-law fits between POC and bbp for two spectral regions (470 and 526 nm, Tables 1, 3, Figures 8, 9). We found that the slopes of the relationships were almost equivalent between the cruises (Tables 1, 3), and we thus concluded that the underway system was also clean during AMT-22 (see also the section Particulate Backscattering). However, the POC-bbp(470) relationship derived during AMT-19 predicted POC with the largest median error (25%, Table 3). Dall'Olmo et al. (2012) reported that during AMT-19 relatively large bbp signals were measured on 0.2-μm filtered seawater, likely due to a small, but unidentified bias in their bbp measurements. We therefore subtracted the 0.2μm filtered signal (bb02) from bbp to re-evaluate our POC relationships (Figure 12). Resultant median errors for the POC-bbp(470) and POC-bbp(526) relationships decreased by 7- and 2-fold, respectively (Table 3, Figure 12). These results indicate that even small biases in bbp measurements can significantly affect the accuracy of the POC-bbp relationship.
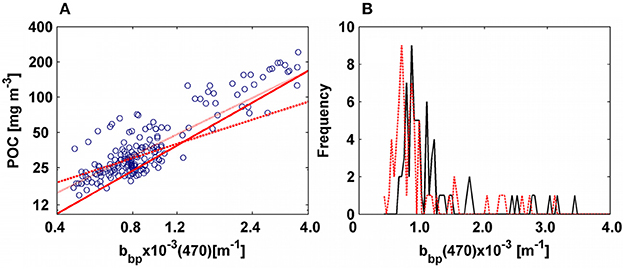
Figure 12. (A) Correlation between POC and bbp(470). Blue circles are data from AMT-22. Solid red line is the power law fitted for AMT-19. Dotted red line is the power function computed after subtracting bb02 from bbp. Dashed red line is the power law function fitted after excluding productive areas and subtracting bb02 from bbp. (B) Relative distribution of bbpfor AMT-19. Solid black line is the bbp data and dashed red line is bbp minus bb02.
Additional factors that can affect the accuracy of POC-bbp relationships between independent studies are: (1) uncertainties of POC estimates, (2) uncertainties in bbp measurements, and (3) variability in the particles assemblages between regions (Gardner et al., 2006; Stramski et al., 2008; Cetinić et al., 2012). Published POC-bbp relationships predict biased estimates (by ~±60%) of surface POC measured during AMT-22 (Table 3, Figure 9). The POC-bbp(555) relationship proposed by Stramski et al. (2008) is based on data collected in waters similar to those found during AMT (e.g., similarly to our dataset, POC, POC:chl and bbp/bp ratios measured by Stramski et al. (2008), range between 12 and 270 mg m−3, 100–1,000, and 0.007–0.018, respectively). This relationship, however, was developed using bbp data measured by Hydroscat-6 and a-βeta sensors (calibrated by the plaque method) installed on a CTD-rosette, whereas we used an ECO-BB sensor (calibrated by the micro-sphere method) installed in a flow-through chamber connected to the ship's underway system (see detail description in Dall'Olmo et al., 2009, 2012). The prediction error of the Stramski et al. (2008) POC-bbp(555) relationship (median error of −27%) was slightly higher than that found in this study (Table 3). However, their prediction error was within the range (in absolute value) of the uncertainties in bbp measurements (20–40%, Dall'Olmo et al., 2012). We therefore suggest that the difference between the POC-bbp relationships derived from Stramski et al. (2008) and in this study could be due to the different methods applied to measure bbp(526), as well as uncertainties in bbp measurements. This hypothesis is supported by the agreement found between the POC-cp relationships of Stramski et al. (2008) and in this study in the red spectral region (Table 2, Figure 9).
The Cetinić et al. (2012) POC-bbp(700) relationship underestimated by 60% the POC measured during AMT-22 and we hypothesize this is due to the different protocols used for measuring bbp and/or different wavelengths (for example, see Table 3), as explained above. However, the difference between the structural compositions of the particles between studies seems to be a significant factor determining the accuracy of their POC-bbp relationships. For example, large phytoplankton assemblages predominated (diatoms with low carbon:volume-cell ratio) in Cetinić et al. (2012), whereas small and large phytoplankton assemblages were included in our case. Interestingly, and similar to what was found for the POC-cp(660) relationship, the relative errors in POC prediction derived from their POC-bbp(700) relationship fell to the lowest values in productive areas (Figure 9).
It is also reasonable to suggest that uncertainties in the Cetinić et al. (2012) POC measurements (POC < 60 mg m−3) could be another factor that contributed to the difference between their predicted POC and those measured for AMT-22 in oligotrophic regions (Figure 9). For example, to increase the POC signal-to-blank ratios and decrease potential uncertainties in places with low POC concentration (POC <60 mg m−3, see sections Particulate Organic Carbon and Figure 3C), we calculated POC by using samples with the largest volume of seawater filtered (the volumes of the samples were ≥2 l for 80% (n = 296) of our POC measurements in these areas). As a result, low standard deviations were found for oligotrophic POC concentration (POC concentration in oligotrophic regions (mean ± standard deviation) = (27.2 ± 1.42) mg m−3; n = 148). In contrast, Cetinić et al. (2012) calculated POC by using smaller volumes (1.1 l) than those used here for a similar range of POC (<60 mg m−3). This in turns could decrease their POC signal-to-blank ratios and increase the errors in their POC measurements (Moran et al., 1999).
During both cruises, we sampled trophic states (oligotrophic and eutrophic) characterized by different POC concentration and structural composition of the particle assemblages. For example, the greatest POC concentration and the lowest POC:chlhplc ratios were found in the productive areas (Figure 4). In these areas, large phytoplankton cells are also typically observed. Therefore, the influence of POC concentration and particle assemblages in the accuracy of POC-bbp relationships was assessed by excluding POC and bbp data from productive areas (POC >60 mg m−3, which is equivalent to ~bbp > 1.5 × 10⁻³ m−1) and by re-evaluating the relationships. The prediction error of the POC-bbp relationships did not decrease significantly (only by 4%, Table 3), because approximately 80% of our data are located in oligotrophic regions. However, with the revised relationships the POC was underestimated by 55% (±14) in productive areas (Figure 12). Similarly, Stramski et al. (2008) found that their POC-bbp(500) slope decreased by 1.3-fold when they excluded POC-bbp data from productive upwelling regions. These results corroborate the suggestion that, to derive robust global POC-bbp relationships, it is important to include POC-bbp data from different trophic states (e.g., Gardner et al., 2006).
Predicting POC from Particulate Absorption Coefficient
The variability in the particulate absorption coefficient is driven by the variability in particulate organic and inorganic components (phytoplankton biomass, biogenic detritus, bacteria, atmospheric dust), (Bricaud et al., 1998; Stramski et al., 2004b). Because POC potentially comprises all the organic components mentioned above and because the concentration of inorganic material is generally low in the surface open-ocean, we expect to find correlations between POC and ap. As an example, a relatively strong relationship exists between POC and remote-sensing reflectance ratios and the latter quantity is mainly dependent on ap in the surface open-ocean (Allison et al., 2010a). Indeed, in our study, the relationships based on ap predicted POC with a median error of −6.4 and −12.6% in the blue and red spectral regions, respectively (Table 2). The POC-ap relationships, however, also depends on the variability in POC:chl ratios, because ap is mostly driven by phytoplankton pigments in the surface open ocean (Bricaud et al., 1998; Allison et al., 2010a), (section Relationship between POC and chl). Therefore, the arguments that explain why we can predict POC from ap in this study, and why we cannot warrant application of this model to other seasons or other ocean regions, are the same as described above for the POC chl relationship (section Relationship between POC and chl). Nevertheless, the median prediction error of ap(440) is similar to those computed for cp and bbp (Tables 2, 3), and ap(440) can be retrieved from remote sensing (e.g., Mitchell et al., 2014). We therefore suggest that, similarly to chl, ap could be used as a global POC proxy, only when the factors affecting the variability in the POC:chl ratio are accounted for in the bio-optical model (e.g., Behrenfeld et al., 2015; Arteaga et al., 2016).
Conclusions
We found empirical POC-IOPs relationships that can predict independently-measured POC with a median error of about ±10%. We showed that our POC-IOPs relationships predicted POC with equal or greater precision than those predicted from previous POC-IOPs and POC-chl relationships. We conclude that the differences found between POC-cp and POC-bbp relationships from previous studies and those found here, were due to differences between (1) the protocols applied for measuring POC and IOPs, and (2) the characteristics of the particle assemblages in the sampled ocean regions.
To our best knowledge, we reported for the first time POC-ap relationships for the surface oligotrophic open ocean. We found that the POC-ap(440) relationship predicted POC with accuracy comparable to those predicted from the traditional ones (e.g., POC-bbp, POC-cp, and POC-chl). However, we warn that before ap(440) or chl could be considered as alternative POC proxies, bio-optical models should account for the factors driving the large variability in POC:chl ratio that is expected due to physiological photoacclimation.
We finally conclude that our POC-bbp and POC-cp relationships are robust and can estimate POC in surface open-ocean waters of the Atlantic with the accuracies of the order of 10%.
Author Contributions
The dataset used in this study was collected by the Oregon State University Group (GD, JG, TW, VvD-V, and MB) and processed by RR and GD. RR developed and tested the empirical relationships, and wrote the first version of the manuscript. All authors commented on and contributed to the improvement of the final version of the manuscript.
Conflict of Interest Statement
The authors declare that the research was conducted in the absence of any commercial or financial relationships that could be construed as a potential conflict of interest.
The reviewer ML and handling Editor declared their shared affiliation
Acknowledgments
The authors would like to thanks to the UK National Academy and to the Royal Society for the support provided by the Newton International Fellowships grant NF150203, and to the Partnership for Observation of the Global Oceans (POGO) for the training support provided by the POGO Visiting Fellowship for training on-board the Atlantic Meridional Transect 24. This study is a contribution to the international IMBER project and was supported by the UK Natural Environment Research Council National Capability funding to Plymouth Marine Laboratory and the National Oceanography Centre, Southampton. This is contribution number 292 of the AMT programme.
References
Abdel-Moati, A. R. (1990). Adsorption of dissolved organic carbon (DOC) on glass fiber filters during particulate organic carbon (POC) determination. Water Res. 24, 763–764. doi: 10.1016/0043-1354(90)90033-3
Aiken, J., Pradhan, Y., Barlow, R., Lavender, S., Poulton, A., Holligan, P., et al. (2009). Phytoplankton pigments and functional types in the Atlantic Ocean: a decadal assessment, 1995–2005. Deep Sea Res. 56, 899–917. doi: 10.1016/j.dsr2.2008.09.017
Allali, K., Bricaud, A., and Claustre, H. (1997). Spatial variations in the chlorophyll-specific absorption coefficients of phytoplankton and photosynthetically active pigments in the equatorial Pacific. J. Geophys. Res. Oceans 102, 12413–12423.
Allison, D. B., Stramski, D., and Mitchell, B. G. (2010a). Empirical ocean color algorithms for estimating particulate organic carbon in the Southern Ocean. J. Geophys. Res. Oceans 115:C06002. doi: 10.1029/2009JC006040
Allison, D. B., Stramski, D., and Mitchell, B. G. (2010b). Seasonal and interannual variability of particulate organic carbon within the Southern Ocean from satellite ocean color observations. J. Geophys. Res. Oceans 115:C10044. doi: 10.1029/2009JC005347
Antoine, D., Siegel, D. A., Kostadinov, T., Maritorena, S., Nelson, N. B., Gentili, B., et al. (2011). Variability in optical particle backscattering in contrasting bio-optical oceanic regimes. Limnol. Oceanogr. 56, 955–973. doi: 10.4319/lo.2011.56.3.0955
Arteaga, L., Pahlow, M., and Oschlies, A. (2016). Modeled Chl:C ratio and derived estimates of phytoplankton carbon biomass and its contribution to total particulate organic carbon in the global surface ocean. Glob. Biogeochem. 30, 1791–1810. doi: 10.1002/2016GB005458
Balch, W. M., Bowler, B. C., Drapeau, D. T., Poulton, A. J., and Holligan, P. M. (2010). Biominerals and the vertical flux of particulate organic carbon from the surface ocean. Geophys. Res. Lett. 37, L22605. doi: 10.1029/2010GL044640
Behrenfeld, M. J., and Boss, E. (2003). The beam attenuation to chlorophyll ratio: an optical index of phytoplankton physiology in the surface ocean? Deep Sea Res. I 50 1537–1549. doi: 10.1016/j.dsr.2003.09.002
Behrenfeld, M. J., and Boss, E. (2006). Beam attenuation and chlorophyll concentration as alternative optical indices of phytoplankton biomass. J. Mar. Res. 64, 431–451. doi: 10.1357/002224006778189563
Behrenfeld, M. J., Boss, E., Siegel, D. A., and Shea, D. M. (2005). Carbon-based ocean productivity and phytoplankton physiology from space. Glob. Biogeochem. 19, GB1006. doi: 10.1029/2004GB002299
Behrenfeld, M. J., Hu, Y., Hostetler, C. A., Dall'Olmo, G., Rodier, S. D., Hair, J. W., et al. (2013). Space-based lidar measurements of global ocean carbon stocks. Geophys. Res. Lett. 40, 4355–4360. doi: 10.1002/grl.50816
Behrenfeld, M. J., Marañón, E., Siegel, D. A., and Hooker, S. B. (2002). Photoacclimation and nutrient-based model of light-saturated photosynthesis for quantifying oceanic primary production. Mar. Ecol. Prog. Ser. 228, 103–117. doi: 10.3354/meps228103
Behrenfeld, M. J., O'Malley, R. T., Boss, E. S., Westberry, T. K., Graff, J. R., Halsey, K. H., et al. (2015). Revaluating ocean warming impacts on global phytoplankton. Nat. Clim. Change 6, 323–330. doi: 10.1038/nclimate2838
Bishop, J. K. (1999). Transmissometer measurement of POC. Deep Sea Res. 46, 353–369. doi: 10.1016/S0967-0637(98)00069-7
Bishop, J. K., Davis, R. E., and Sherman, J. T. (2002). Robotic observations of dust storm enhancement of carbon biomass in the North Pacific. Science 298, 817–821. doi: 10.1126/science.1074961
Bishop, J. K. B., and Wood, T. J. (2009). Year-round observations of carbon biomass and flux variability in the Southern Ocean. Global Biogeochem. Cycles 23:GB2019. doi: 10.1029/2008GB003206
Bishop, J. K., Wood, T. J., Davis, R. E., and Sherman, J. T. (2004). Robotic observations of enhanced carbon biomass and export at 55 S during SOFeX. Science 304, 417–420. doi: 10.1126/science.1087717
Boss, E., Guidi, L., Richardson, M. J., Stemmann, L., Gardner, W., Bishop, J. K., et al. (2015). Optical techniques for remote and in-situ characterization of particles pertinent to GEOTRACES. Prog. Oceanogr. 133, 43–54. doi: 10.1016/j.pocean.2014.09.007
Boss, E. S., Collier, R., Pegau, W. S., Larson, G., and Fennel, K. (2007). “Measurements of spectral optical properties and their relation to biogeochemical variables and processes in Crater Lake, Crater Lake National Park, OR,” in Long-term Limnological Research and Monitoring at Crater Lake, eds G. L. Larson, R. W. Collier, and M. W. Buktenica (Dordrecht: Springer), 149–159.
Bricaud, A., Babin, M., Morel, A., and Claustre, H. (1995). Variability in the chlorophyll-specific absorption coefficients of natural phytoplankton: analysis and parameterization. J. Geophys. Res. Oceans 100, 13321–13332. doi: 10.1029/95JC00463
Bricaud, A., Morel, A., Babin, M., Allali, K., and Claustre, H. (1998). Variations of light absorption by suspended particles with chlorophyll a concentration in oceanic (case 1) waters: analysis and implications for bio-optical models. J. Geophys. Res. Oceans 103, 31033–31044.
Bricaud, A., and Stramski, D. (1990). Spectral absorption coefficients of living phytoplankton and nonalgal biogenous matter: a comparison between the Peru upwelling area and the Sargasso Sea. Limnol. Oceanogr. 35, 562–582.
Briggs, N., Perry, M. J., Cetinić, I., Lee, C., D'Asaro, E., Gray, A. M., et al. (2011). High-resolution observations of aggregate flux during a sub-polar North Atlantic spring bloom. Deep Sea Res. Part I 58, 1031–1039. doi: 10.1016/j.dsr.2011.07.007
Campbell, J. W. (1995). The lognormal distribution as a model for bio-optical variability in the sea. J. Geophys. Res. Oceans 100, 13237–13254.
Cetinić, I., Perry, M. J., Briggs, N. T., Kallin, E., D'Asaro, E. A., and Lee, C. M. (2012). Particulate organic carbon and inherent optical properties during 2008 North Atlantic Bloom experiment. J. Geophys. Res. Oceans 117:C06028. doi: 10.1029/2011JC007771
Claustre, H., Morel, A., Babin, M., Cailliau, C., Marie, D., Marty, J. C., et al. (1999). Variability in particle attenuation and chlorophyll fluorescence in the tropical Pacific: scales, patterns, and biogeochemical implications.). J. Geophys. Res. Oceans 104, 3401–3422.
Dall'Olmo, G., Boss, E., Behrenfeld, M. J., and Westberry, T. K. (2012). Particulate optical scattering coefficients along an Atlantic Meridional Transect. Opt. Express 20, 21532–21551. doi: 10.1364/OE.20.021532
Dall'Olmo, G., and Mork, K. A. (2014). Carbon export by small particles in the Norwegian Sea. Geophys. Res. Lett. 41, 2921–2927. doi: 10.1002/2014GL059244
Dall'Olmo, G., Westberry, T. K., Behrenfeld, M. J., Boss, E., and Slade, W. H. (2009). Significant contribution of large particles to optical backscattering in the open ocean. Biogeosciences 6, 947–967. doi: 10.5194/bg-6-947-2009
DuRand, M. D., Green, R. E., Sosik, H. M., and Olson, R. J. H. (2002). Diel variations in optical properties of Micromonas pusilla (Prasinophyceae). J. Phycol. 38, 1132–1142. doi: 10.1046/j.1529-8817.2002.02008.x
Estapa, M. L., Buesseler, K., Boss, E., and Gerbi, G. (2013). Autonomous, high-resolution observations of particle flux in the oligotrophic ocean. Biogeosciences 10, 5517–5531. doi: 10.5194/bg-10-5517-2013
Gardner, W. D., Mishonov, A. V., and Richardson, M. J. (2006). Global POC concentrations from in-situ and satellite data. Deep Sea Res. Part II 53, 718–740. doi: 10.1016/j.dsr2.2006.01.029
Gardner, W. D., Richardson, M. J., Carlson, C. A., Hansell, D., and Mishonov, A. V. (2003). Determining true particulate organic carbon: bottles, pumps and methodologies. Deep Sea Res. Part II 50, 655–674. doi: 10.1016/S0967-0645(02)00589-1
Gardner, W. D., Walsh, I. D., and Richardson, M. J. (1993). Biophysical forcing of particle production and distribution during a spring bloom in the North Atlantic. Deep Sea Res. Part II 40, 171–195. doi: 10.1016/0967-0645(93)90012-C
Graff, J. R., Westberry, T. K., Milligan, A. J., Brown, M. B., Dall'Olmo, G., van Dongen-Vogels, V., et al. (2015). Analytical phytoplankton carbon measurements spanning diverse ecosystems. Deep Sea Res. Part I 102, 16–25. doi: 10.1016/j.dsr.2015.04.006
Honjo, S., Manganini, S. J., Krishfield, R. A., and Francois, R. (2008). Particulate organic carbon fluxes to the ocean interior and factors controlling the biological pump: a synthesis of global sediment trap programs since 1983. Prog. Oceanogr. 76, 217–285. doi: 10.1016/j.pocean.2007.11.003
Huot, Y., Morel, A., Twardowski, M. S., Stramski, D., and Reynolds, R. A. (2008). Particle optical backscattering along a chlorophyll gradient in the upper layer of the eastern South Pacific Ocean. Biogeosciences 5, 495–507. doi: 10.5194/bg-5-495-2008
Kirk, J. (1975). A theoretical analysis of the contribution of algal cells to the attenuation of light within natural waters. I. General treatment of suspensions of pigmented cells. New Phytol. 75, 11–20. doi: 10.1111/j.1469-8137.1975.tb01366.x
Knap, A. H., Michaels, A., Close, A. R., Ducklow, H., and Dickson, A. G. (eds.) (1996). Protocols for the Joint Global Ocean Flux Study (JGOFS) core measurements, Manuals IOC Guides 29, United Nation Education Science and Culture Organization (Paris), 170.
Lee, Z. P., Carder, K. L., Peacock, T. G., Davis, C. O., and Mueller, J. L. (1996). Method to derive ocean absorption coefficients from remote-sensing reflectance. Appl. Opt. 35, 453–462. doi: 10.1364/AO.35.000453
Liu, Z., Cochran, J. K., Lee, C., Gasser, B., Miquel, J. C., and Wakeham, S. G. (2009). Further investigations on why POC concentrations differ in samples collected by Niskin bottle and in situ pump. Deep Sea Res. Part II 56, 1558–1567. doi: 10.1016/j.dsr2.2008.12.019
Liu, Z., Stewart, G., Cochran, J. K., Lee, C., Armstrong, R. A., Hirschberg, D. J., et al. (2005). Why do POC concentrations measured using Niskin bottle collections sometimes differ from those using in-situ pumps? Deep Sea Res. Part I 52, 1324–1344. doi: 10.1016/j.dsr.2005.02.005
Loisel, H., and Morel, A. (1998). Light scattering and chlorophyll concentration in case 1 waters: a reexamination. Limnol. Oceanogr. 43, 847–858. doi: 10.4319/lo.1998.43.5.0847
Martinez-Vicente, V., Dall'Olmo, G., Tarran, G., Boss, E., and Sathyendranath, S. (2013). Optical backscattering is correlated with phytoplankton carbon across the Atlantic Ocean. Geophys. Res. Lett. 40, 1154–1158. doi: 10.1002/grl.50252
Menzel, D. W. (1966). Bubbling of sea water and the production of organic particles: a re-evaluation. Deep Sea Res. Oceanogr. Abstr. 13, 963–966. doi: 10.1016/0011-7471(76)90913-X
Menzel, D. W. (1967). Particulate organic carbon in the deep sea. Deep Sea Res. Oceanogr. Abstr. 14, 229–238. doi: 10.1016/0011-7471(67)90008-3
Mishonov, A. V., Gardner, W. D., and Richardson, M. J. (2003). Remote sensing and surface POC concentration in the South Atlantic. Deep Sea Res. Part II 50, 2997–3015. doi: 10.1016/j.dsr2.2003.07.007
Mitchell, C., Cunningham, A., and McKee, D. (2014). Remote sensing of particulate absorption and their biogeochemical interpretation: a case study in the Irish Sea. Remote Sens. Environ. 152, 74–82. doi: 10.1016/j.rse.2014.06.003
Moran, S. B., Charette, M. A., Pike, S. M., and Wicklund, C. A. (1999). Differences in seawater particulate organic carbon concentration in samples collected using small-and large-volume methods: the importance of DOC adsorption to the filter blank. Mar. Chem. 67, 33–42. doi: 10.1016/S0304-4203(99)00047-X
Morel, A., and Bricaud, A. (1981). Theoretical results concerning light absorption in a discrete medium, and application to specific absorption of phytoplankton. Deep Sea Res. 28, 1375–1393. doi: 10.1016/0198-0149(81)90039-X
Morel, A., and Prieur, L. (1977). Analysis of variations in ocean color. Limnol. Oceanogr. 22, 709–722. doi: 10.4319/lo.1977.22.4.0709
Mueller, J. L., Fargion, G. S., McClain, C. R., Pegau, S., Zanefeld, J. R. V., Mitchell, B. G., et al. (2003). “Ocean optics protocols for satellite ocean color sensor validation, revision 4, volume IV: Inherent optical properties: Instruments, characterizations, field measurements and data analysis protocols,” in NASA Tech. Memo. 2003 – 211621/Rev4, Vol. II, eds J. L. Mueller, G. S. Fargion, and C. R. McClain (Greenbelt, MD: NASA GSFC), 56.
Poulton, A. J., Sanders, R., Holligan, P. M., Stinchcombe, M. C., Adey, T. R., Brown, L., et al. (2006). Phytoplankton mineralization in the tropical and subtropical Atlantic Ocean. Global Biogeochem. Cycles 20:GB4002. doi: 10.1029/2006GB002712
Sarmiento, J. L., and Gruber, N. (2006). Ocean Biogeochemical Dynamics. Princeton, NJ: Princeton University Press
Slade, W. H., Boss, E., Dall'Olmo, G., Langner, M. R., Loftin, J., Behrenfeld, M. J., et al. (2010). Underway and moored methods for improving accuracy in measurement of spectral particulate absorption and attenuation. J. Atmos. Ocean Tech. 27, 1733–1746. doi: 10.1175/2010JTECHO755.1
Smith, R. C., and Baker, K. S. (1978). The bio-optical state of ocean waters and remote sensing. Limnol. Oceanogr. 23, 247–259. doi: 10.4319/lo.1978.23.2.0247
Stramska, M., and Stramski, D. (2005). Variability of particulate organic carbon concentration in the north polar Atlantic based on ocean color observations with Sea-viewing Wide Field-of-view Sensor (SeaWiFS). J. Geophys. Res. Oceans 110(C10). doi: 10.1029/2004jc002762
Stramski, D., Boss, E., Bogucki, D., and Voss, K. J. (2004a). The role of seawater constituents in light backscattering in the ocean. Prog. Oceanogr. 61, 27–56. doi: 10.1016/j.pocean.2004.07.001
Stramski, D., Reynolds, R. A., Babin, M., Kaczmarek, S., Lewis, M. R., Röttgers, R., et al. (2008). Relationships between the surface concentration of particulate organic carbon and optical properties in the eastern South Pacific and eastern Atlantic Oceans. Biogeosciences 5, 171–201. doi: 10.5194/bg-5-171-2008
Stramski, D., Reynolds, R. A., Kahru, M., and Mitchell, B. G. (1999). Estimation of particulate organic carbon in the ocean from satellite remote sensing. Science 285, 239–242. doi: 10.1126/science.285.5425.239
Stramski, D., Wozniak, S. B., and Flatau, P. J. (2004b). Optical properties of Asian mineral dust suspended in seawater. Limnol. Oceanogr. 49, 749–755. doi: 10.4319/lo.2004.49.3.0749
Tarran, G. A., Heywood, J. L., and Zubkov, M. V. (2006). Latitudinal changes in the standing stocks of nano- and picoeukaryotic phytoplankton in the Atlantic Ocean. Deep Sea Res. Part II 53, 1516–1529. doi: 10.1016/j.dsr2.2006.05.004
Trüper, H., and Yentsch, C. S. (1967). Use of glass fiber filters for the rapid preparation of in vivo absorption spectra of photosynthetic bacteria. J. Bacteriol. 94, 1255–1256.
Turnewitsch, R., Springer, B. M., Kiriakoulakis, K., Vilas, J. C., Arístegui, J., Wolff, G., et al. (2007). Determination of particulate organic carbon (POC) in seawater: the relative methodological importance of artificial gains and losses in two glass-fiber-filter-based techniques. Mar. Chem. 105, 208–228. doi: 10.1016/j.marchem.2007.01.017
Twardowski, M. S., Claustre, H., Freeman, S. A., Stramski, D., and Huot, Y. (2007). Optical backscattering properties of the “clearest” natural waters. Biogeosciences 4, 1041–1058. doi: 10.5194/bg-4-1041-2007
Van Heukelem, L., and Thomas, C. S. (2001). Computer-assisted high-performance liquid chromatography method development with applications to the isolation and analysis of phytoplankton pigments. J. Chromatogr. A 910, 31–49. doi: 10.1016/S0378-4347(00)00603-4
Volk, T., and Hoffert, M. I. (1985). “Ocean Carbon Pumps: Analysis of Relative Strengths and Efficiencies in Ocean-Driven Atmospheric CO2 Changes,” in The Carbon Cycle and Atmospheric CO2: Natural Variations Archean to Present, Geophysical Monograph Series, Vol. 32, eds E. T. Sundquist and W. S. Broecker (Washington, DC: AGU), 99–110.
Westberry, T. K., Dall'Olmo, G., Boss, E., Behrenfeld, M. J., and Moutin, T. (2010). Coherence of particulate beam attenuation and backscattering coefficients in diverse open ocean environments. Opt. Express 18, 15419–15425. doi: 10.1364/OE.18.015419
Keywords: particulate organic carbon, inherent optical properties, optical proxies, empirical relationships, Atlantic Ocean
Citation: Rasse R, Dall'Olmo G, Graff J, Westberry TK, van Dongen-Vogels V and Behrenfeld MJ (2017) Evaluating Optical Proxies of Particulate Organic Carbon across the Surface Atlantic Ocean. Front. Mar. Sci. 4:367. doi: 10.3389/fmars.2017.00367
Received: 25 May 2017; Accepted: 31 October 2017;
Published: 16 November 2017.
Edited by:
Katja Fennel, Dalhousie University, CanadaReviewed by:
Emmanuel Devred, Fisheries and Oceans Canada, CanadaMarlon R. Lewis, Dalhousie University, Canada
Copyright © 2017 Rasse, Dall'Olmo, Graff, Westberry, van Dongen-Vogels and Behrenfeld. This is an open-access article distributed under the terms of the Creative Commons Attribution License (CC BY). The use, distribution or reproduction in other forums is permitted, provided the original author(s) or licensor are credited and that the original publication in this journal is cited, in accordance with accepted academic practice. No use, distribution or reproduction is permitted which does not comply with these terms.
*Correspondence: Rafael Rasse, cmFyQHBtbC5hYy51aw==; cmpyYXNzZUBnbWFpbC5jb20=