 Lisa Felgentreu
 Günther Nausch
 Franziska Bitschofsky
 Monika Nausch
 Detlef Schulz-Bull1
- 1Department of Marine Chemistry, Leibniz-Institute of Baltic Sea Research, Warnemünde, Germany
- 2Department of Marine Biology, Leibniz-Institute of Baltic Sea Research, Warnemünde, Germany
Phosphorus (P) is a key factor forcing eutrophication in limnic and marine systems, and all monitoring programs for water quality accordingly include P determinations. However, traditional monitoring does not allow an analysis of the different components involved in the P cycle taking place in the water column. Nonetheless, the implementation of measures addressing eutrophication requires a full understanding of the processes involved in the transformation and transport of P, in all its chemical forms. In this study, the P categories present in a river and its estuary in northern Germany, which discharge into the Baltic Sea, were characterized. Using the molybdenum blue method we found that the classification of P into the traditional fractions (DIP, DOP, POP) applied in the ocean cannot be applied to turbid waters such as rivers because interferences between the fractions seems to occur. Therefore a new nomenclature has been introduced. In addition to total phosphorus (TP) and dissolved molybdate-reactive phosphorus (DRP; previously referred to as inorganic phosphorus), dissolved non-molybdate-reactive phosphorus (DNP), particulate molybdatereactive phosphorus (PRP), and particulate non-molybdate-reactive phosphorus (PNP) were distinguished. The high spatial and temporal variations in the proportions of these forms with respect to the TP concentration well-demonstrate the complexity of the P cycle and the involved P fractions and emphasize the need for expanded monitoring approach. The potential of eutrophication could be underestimated if not all P categories were considered. With the new operational nomenclature the common and standardized molybdenum blue reaction could be used to implement the analysis of various P components into regular monitoring programs.
Introduction
To address eutrophication in European waters and adopt measures aimed at restoring their good ecological status, the European Water Framework Directive and the European Marine Strategy Framework Directive were established. However, phosphorus (P) is a critical element forcing eutrophication in aquatic systems throughout the world, especially in surface waters (OECD, 1982; Hecky and Kilham, 1988). Moreover, eutrophication is reinforced by the presence of internal P cycles, for example, the P released from the sediment under anoxic conditions.
Both the cycling of P and the intense P transformations in the environment have been characterized and include biotic (uptake and release by organisms) and abiotic (adsorption onto and desorption from particles, precipitation and dissolution, advection and diffusion) processes in which both dissolved and particulate P forms are generated. In the literature, these functionally distinct forms of organic and inorganic P that make up the P cycle have been variably named (Jarvie et al., 2002; Withers and Jarvie, 2008; Worsfold et al., 2016). Traditional terms for the same P component include orthophosphate (ortho-P), dissolved inorganic P (DIP), or simply phosphate (), but also soluble reactive P (SRP/srP), dissolved reactive P (DRP), filterable reactive P (FRP), and molybdate-reactive P (MRP) are used. While at times confusing, the use of operational (e.g., FRP, used in analytical determinations) and functional (e.g., DIP, as applied to analyses of an ecosystem or microbial forms) terminologies can also be possible. The functional differentiation of organic and inorganic P requires a big effort which takes much time. It is hardly realizable to measure organic P in its entirety rather its single compounds like DNA and RNA or ATP which have a minor part in the DOP (Unger et al., 2013). Furthermore, when using the molybdenum blue method, labile P components other than DIP, e.g., labile organic P or colloidal bound P, may also be bound to the molybdenum blue complex (Rigler, 1968; Stainton, 1980; Haygarth and Sharpley, 2000; Jarvie et al., 2002).
Our studies within the PhosWaM project (phosphorus from the source to the sea) have focused on the Warnow catchment area (Figure 1), specifically: (1) P fractions in the Warnow river and its estuary, as a transition zone between an agrarian catchment area and the Baltic Sea, and (2) P fluxes, especially with respect to the transport and exchange of P with coastal waters. Rivers play a key role in transporting and processing P from source to sea (Withers and Jarvie, 2008), especially when diffuse sources are the main factor for eutrophication after the elimination of point sources. During the second half of the twentieth century, environmental inputs of P have increased worldwide (Gustafsson et al., 2012). Despite numerous efforts to reduce nutrient inputs (Backer et al., 2010) into the coastal waters of the southern Baltic Sea, inputs of P have led to a shift in the trophic status and the degree of eutrophication remains high (Nausch et al., 2011). Effective measures are therefore needed to control P inputs reaching rivers and estuaries characterized by high organic loads. Although a large number of monitoring programs targeting the nutrient status of these waters are in place, they typically measure only two forms of P, total P (TP) and DIP (Baldwin, 1998; Jarvie et al., 2002; Jescovitch et al., 2017; Stammler et al., 2017). However, because all P fractions can contribute to eutrophication and all of them can be successfully targeted for reduction, the proportions of each one must be considered. For example, among the various forms of P, dissolved organic P is counted to be the most relevant P source for the growth of algae and bacteria during the productive season (Nausch and Nausch, 2006) and is therefore a major contributor to eutrophication.
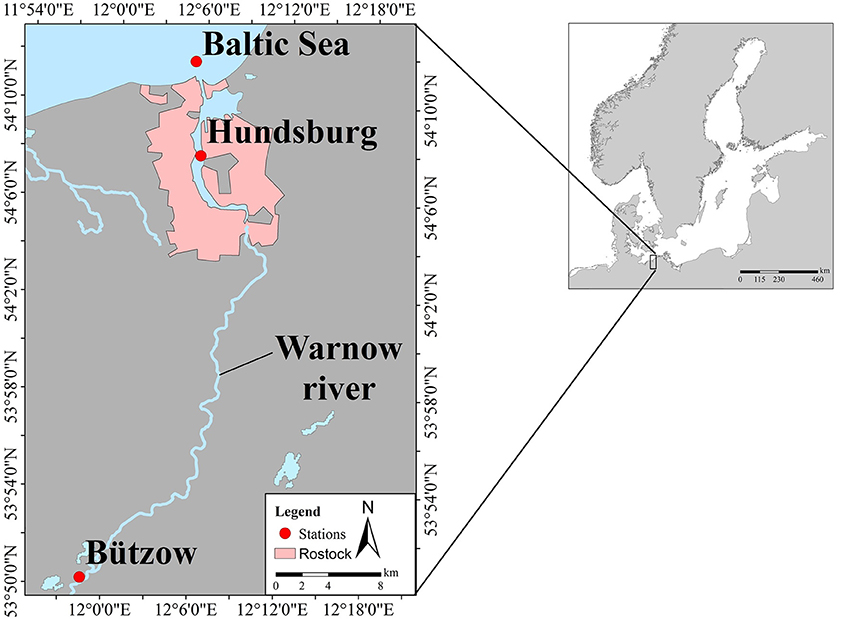
Figure 1. Study area showing the three stations in a lowland catchment area in northern Germany: Bützow (Warnow river), Hundsburg (Warnow estuary, city of Rostock), and Baltic Sea (coastal zone of Baltic Sea).
Reducing the P that contributes to eutrophication requires a revised approach to P monitoring and is one of the primary aims of the PhosWaM project. In this study we demonstrate the importance of measuring the various components of P and their implementation into regular monitoring measures. Therefore, we introduce a nomenclature for the different operational P forms, one that is tailored to those in the turbid riverine and estuarine waters of the investigated area (lowland agricultural dominated catchment) and applicable to similar areas. Additionally, the nomenclature is more accurate according to the widely common and standardized molybdenum blue colorimetric method.
Materials and Methods
Phosphorus (P) categories were analyzed in surface water samples taken monthly since August 2016 along the river Warnow and its estuary to the Baltic Sea (Figure 1). The Warnow river, in which the sampling station “Bützow” is located, has a low current velocity. The Warnow estuary, where the station “Hundsburg” is located, is a typical partially mixed estuary. The sampling station “Baltic Sea” is located at the mouth of the river in the coastal zone of the Baltic Sea.
Our newly established nomenclature differentiates P categories based on their dissolved and particulate forms. The detection of dissolved P is standardized using the molybdenum blue colorimetric method (Murphy and Riley, 1962), which should quantify the amount of DIP, also referred to as ortho-P or SRP. However, when used in a water sample, the molybdenum blue can also bind labile P components as described above (Rigler, 1968; Stainton, 1980; Haygarth and Sharpley, 2000; Jarvie et al., 2002). Using the molybdenum blue method in unfiltered and filtered estuarine and river water samples resulted in remarkable different P values, indicating the presence of a labile particulate P forms, the particulate molybdate-reactive P fraction (PRP). It thus became evident that the traditionally measured and named fractions were not suitable for use in the lowland catchment area investigated in this study. Hence, we developed a detection scheme (Figure 2) and renamed the traditional terms of P categories (Table 1).
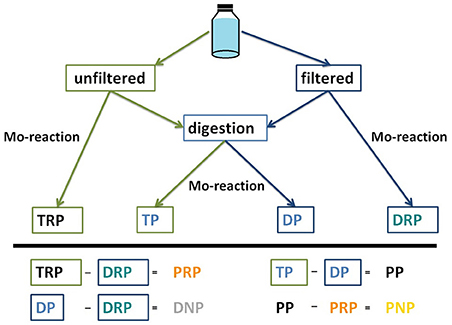
Figure 2. Scheme used in the detection of the various phosphorus (P) fractions. Mo-reaction, reaction of phosphate with molybdate whereby a blue phosphomolybdate complex is generated; TP, total P; DP, total dissolved P; PP, total particulate P; TRP, total molybdate-reactive P; DRP, dissolved molybdate-reactive P; PRP, particulate molybdate-reactive P; DNP, dissolved non-molybdate-reactive P; PNP, particulate non-molybdate-reactive P.
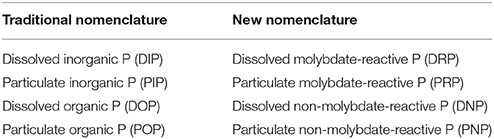
Table 1. Comparison of the traditional and new nomenclatures used to describe the different phosphorus (P) categories.
Analysis of Molybdate-Reactive Phosphorus Categories
For these components the water sample should be analyzed as soon as possible after sampling (Jarvie et al., 2002). Dissolved P and particulate P are separated by filtration (maximum 250 ml) over precombusted (4 h at 450°C) filters (GF/F-filter, retention range 0.7 μm) using a vacuum pressure constantly adjusted to 850 hPa. The P concentrations are measured in duplicates using the molybdenum blue colorimetric method (Murphy and Riley, 1962) in which a blue phosphomolybdate complex is formed. The reaction requires a reductant, typically acidified ascorbic acid solution, and a mixed reagent consisting of ammonium heptamolybdate tetrahydrate-solution, potassium antimony tartrate-solution, and 50% sulfuric acid. The procedure generally follows that of Koroleff (1983) but with the following modifications. After the addition of 1 ml of the mixed reagent to a 50 ml water sample, the absorbance at a wavelength of 885 nm is immediately measured to obtain a turbidity blank. This is followed by the addition of 0.5 ml of the reductant to the sample-reagent mixture. Over a period of 20–60 min (depending on the ambient temperature) the P in the sample reacts with the molybdate to form a bluish complex. The absorbance of this sample is then measured again at 885 nm and the P concentration calculated according to Koroleff (1983).
The concentration of the dissolved molybdate-reactive P (DRP) in the filtrate is determined together with the concentration of total molybdate-reactive P (TRP) in the unfiltered water sample. The difference between the TRP and DRP values is the amount of particulate molybdate-reactive P (PRP).
The calibration curve, which is renewed with every new regent and reductant solution, for this method is linear up to 10 μM, and in the present study the detection limit was reached at an absorbance of 0.007 (equal to ca. 0.07 μM), measured in a 5 cm cuvette. The measured standard (potassium-dihydrogen phosphate) has a concentration of 5 μM which fitted in a 10%–variance. At least one blank and one standard was applied at every measurement.
Analysis of Total Phosphorus Categories
The determination of TP and total dissolved P (DP) requires a digestion of the sample so that all of the P in the sample is converted to DRP. The previously frozen (−20°C), stored water samples (exact 40 ml) were thawed and then transferred to Teflon PFA®-bottles. The digestion is achieved by the addition of an oxidant (4 ml), usually potassium peroxydisulfate (Koroleff, 1983). The oxidation was done in an alkaline medium.
The digestion was carried out in a lab-microwave. In this study, the CEM MARS Xpress and the following protocol were used: After a short initialization phase of a few seconds, the oxidant-containing samples were subjected to a 70 min heating phase during which they were heated to 180°C. This temperature was held for 50 min, after which the samples were cooled down over 30 min in the microwave to 70–80°C. The amount of DRP in the completely cooled samples was then measured using the molybdenum blue colorimetric method, in a mixture containing 0.8 ml of reductant and reagent. The samples were analyzed as duplicates.
The TP concentration was determined in the unfiltered water sample, and the DP concentration in the filtrate. The total particulate P (PP) concentration was calculated as the difference between TP and DP.
Every new solution of the oxidant is calibrated with standards concentrated between 0 and 20 μM. In each digestion two to three blanks and two 2 μM-standard (glucose-6-phosphate) were included. The detection limit was reached at an absorbance of 0.008 (equal to ca. 0.08 μM), measured in a 5 cm cuvette. The variance of the 2 μM-standard was within the 5% of the reference value. The measurement of the standard was linear up to a concentration of 15 μM.
Analysis of Non-molybdate-reactive Phosphorus Categories
The two non-molybdate-reactive P categories were determined by calculation. Dissolved non-molybdate-reactive P (DNP) was defined as the difference between DP and DRP. Thus, the particulate non-molybdate-reactive P (PNP) was calculated out as the difference between PP and PRP (Figure 2).
Results
In our area of investigation (Figure 1) the concentration of the different P categories vary seasonally and spatially. In general the TP concentrations decreased from the Warnow river to the Baltic Sea (Table 2) and thus so did the various P fractions, except PRP, which increased toward the Baltic Sea. The contribution to TP of the measured P forms varied over a wide range. Thus, at the river station (Bützow, Figure 1) DRP concentrations ranged between 2.4 and 65.7%, DNP concentrations between 0 and 100%, PRP concentrations between 7.5 and 53.4%, and PNP concentrations between 0 and 55.8%. Similarly high variations were measured at the estuarine station (Hundsburg, Figure 1), where the DRP concentrations were between 0.3 and 100%, the DNP and PRP concentrations between 0 and 100%, and the PNP concentrations up to 78.6%. At the “Baltic Sea” station (Figure 1), DRP and PRP, as molybdate-reactive P fractions, accounted for 0–100%, and DNP and PNP, as non-molybdate-reactive P fractions, for 0–56.5 and 0–56.7%, respectively. According to this we calculated the difference of the mean values of TP and DRP, as the traditional measured P components (Table 3) to show the importance of measuring the different P categories. In “Bützow,” the river station, the TP and DRP values differed with 1.97 μM. At the station in the estuary the difference was with 1.62 μM lower and at the “Baltic Sea” station was a TP-DRP-difference of 0.44 μM. In addition, the DNP concentrations as mean values also decreased from 0.38 μM in the river (Bützow) to 0.26 μM at the “Baltic Sea.”
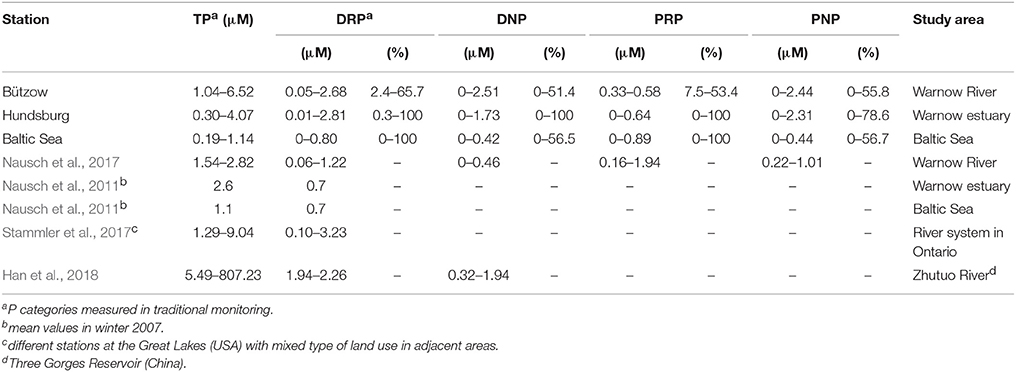
Table 2. The variability of the concentration ranges of the phosphorus (P) fractions at the different stations of the study vs. that reported in the literature for different study areas.
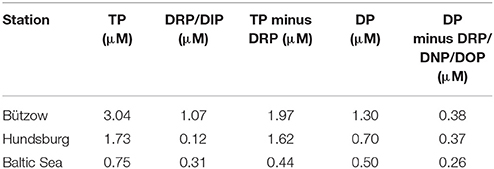
Table 3. Differences of TP and DRP/DIP as traditional monitoring parameter in comparison with differences of DP and DRP (DNP/DOP) at the three stations of the study area as mean values from September 2016 to 2017.
Seasonal variations were exemplified by the data from February 2017 and June 2017 (Figure 3). Additional abiotic parameters (water temperature, rainfall, wind, and discharge) and biotic parameters (chlorophyll a and seston) were given in Table 4. In February 2017 it was stormy during the sampling at the stations “Hundsburg” and “Baltic Sea” and also in June 2017 at the river station in “Bützow.” Moreover, the salinity situation was different in the 2 months (Figure 4). In February, the water column was locally nearly totally mixed at the different stations. In June, however, the water column was a bit stratified with freshwater (1 to 8 g kg−1) at the surface and saltwater (8 to 10/11 g kg−1) below the surface layer to the bottom layer. Furthermore, the chlorophyll a concentration was higher in February 2017 than in June 2017 at the stations “Bützow” (25.10 μg l−1 in February and 8.76 μg l−1 in June) and “Baltic Sea” (4.05 μg l−1 in February and 2.63 μg l−1 in June). In contrast, the Secchi depth at “Hundsburg” and “Baltic Sea” were in February deeper than in June. At all stations TP concentration is higher in June than in February. In February the particulate fractions dominated both at the “Baltic Sea” (~60% PRP from a TP of 0.89 μM) and the river (~20% PRP and 50% PNP from a TP of 2.01 μM) stations. By contrast, at the estuary station the dissolved fractions dominated (~50% DRP and 30% DNP from a TP of 1.07 μM). In June, the conditions were reversed. At the “Baltic Sea” station (TP = 0.95 μM), DRP accounted for ~40% and DNP for ~30%, and at the river station (TP = 3.03 μM) DRP for 60% and DNP for ~20%. At the estuary (TP = 1.96 μM), PNP dominated, with ~60%.
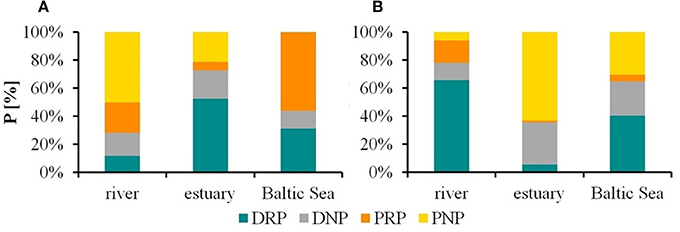
Figure 3. Proportions (%) of the phosphorus (P) categories as a function of total P at the three study sites (Warnow River “Bützow,” its estuary “Hundsburg,” and the southern Baltic Sea “Baltic Sea”) during two different seasons: (A) February 2017, (B) = June 2017. DRP, dissolved molybdate-reactive P; DNP, dissolved non-molybdate-reactive P; PRP, particulate molybdate-reactive P; PNP, particulate non-molybdate-reactive P.
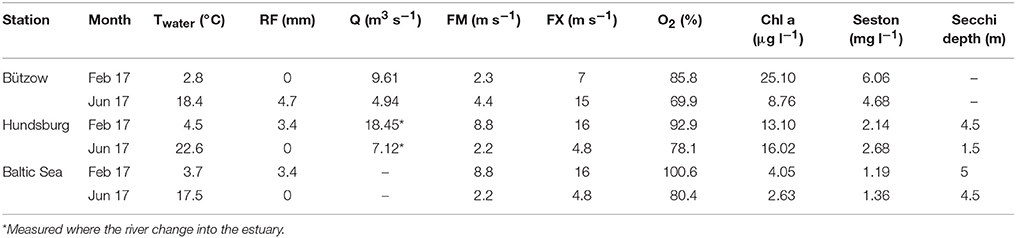
Table 4. Abiotic and biotic parameter during sampling in February 2017 (Feb 17) and June 2017 (Jun 17) at the three stations of the study area; Twater, water temperature in °C; RF, rainfall as daily mean value in the area around the city of Rostock in mm; Q, discharge as daily mean value in m3 s−1; FM, mean wind velocity measured at the DWD-weather station in Rostock-Warnemünde in m s−1; FX, maximum wind velocity measured at the DWD-weather station in Rostock-Warnemünde in m s−1; O2, oxygen saturation in %; Chl a, chlorophyll a concentration in μg l−1; Seston, content of seston in mg l−1.
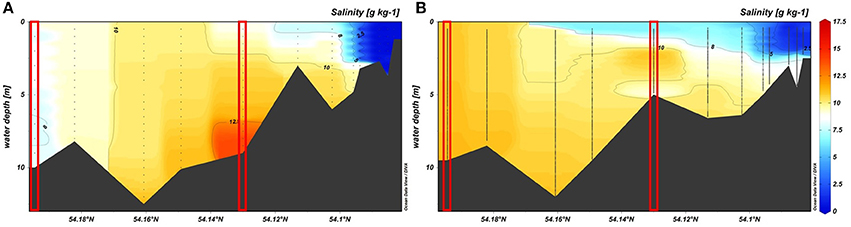
Figure 4. Salinity profiles in the Warnow estuary in (A) February 2017 and (B) June 2017; red lined boxes mark the stations “Baltic Sea” and “Hundsburg”.
Discussion
Detection of Different Phosphorus Categories and Their Impact
The nomenclature presented herein is an operational one and was developed to address the large variety of terms used to describe the same P form, and the resulting confusion (Table 5). The terms we introduced for the different P categories are consistent for us and our further work in the project. Moreover, it allows a more accurate description of the P fractions usually detected in monitoring programs (Table 2), especially in eutrophic waters with high amount of particles like our study area (Table 3). It does not replace the functional terms of organic and inorganic P forms, which are chemically-defined on the bonding of P with carbon. Instead, the proposed nomenclature has its antagonist in the traditional nomenclature (Table 1). Nevertheless, the functional terms of P categories could not be differentiated accurately by the common and standardized molybdenum blue colorimetric method.
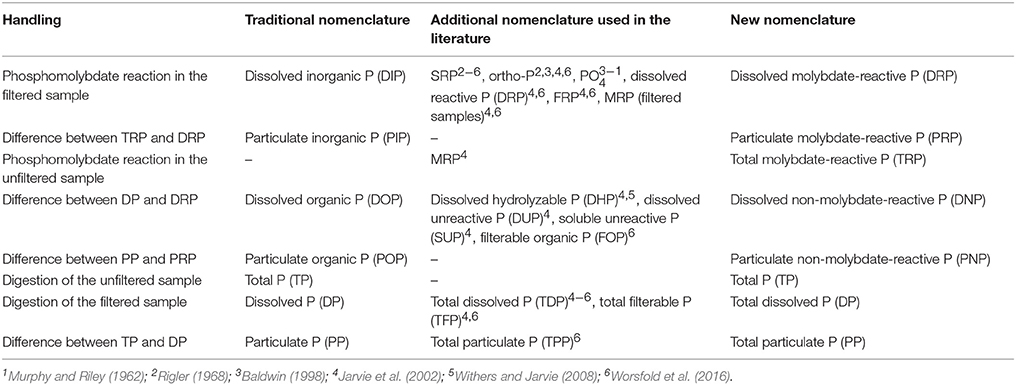
Table 5. Overview of the various nomenclatures and the terms used to detect the various phosphorus (P) categories.
While the molybdenum blue colorimetric method for the analytical detection of P categories has been used for many years, discrepancies have often been reported (e.g., Murphy and Riley, 1962; Rigler, 1968; Baldwin, 1998). For example, the terms SRP and ortho-P have been variably used to refer often to the same P fraction (Table 5; Jarvie et al., 2002) although they do not describe the same fraction (Rigler, 1968; Stainton, 1980). Their synonymous use may reflect the fact that labile forms of organic P might be hydrolyzed in the acidic milieu of the molybdenum blue reaction (Rigler, 1968; Baldwin, 1998; Jarvie et al., 2002). Additionally, the P associated with colloids could be released during the reaction between molybdate and phosphates (Stainton, 1980; Baldwin, 1998). Therefore, a consistent operational nomenclature is necessary to prevent misinterpretation of results from molybdenum blue method. For example, DNP is indeed DOP but it will be underestimated because an amount of it is measured with the DRP which is dominated by DIP. In literature most studies and environmental reports refer to functional terms of P forms (e.g., organic, inorganic), which are also detected by molybdenum blue method (e.g., Nausch and Nausch, 2006).
In the traditional monitoring praxis as well as in most environmental studies (Table 2) only TP and DRP (after introduced nomenclature) are measured. On this basis the ecological status of an aquatic system is evaluated and potential aquatic management measures are developed. The DRP is presumed to be the P category available for phytoplankton and therefore the main source for eutrophication. Table 3 shows, that with ~40 to 50% of TP the DRP amount in the aquatic environment is not specified. This results in an underestimation of eutrophication potential, since at least DNP is known to be bioavailable (Nausch and Nausch, 2006). An advantage of the additional measurement of TRP is the calculation of PRP, which, as demonstrated by our results, plays an important role in the P cycle of the study area, especially during regeneration periods. Furthermore, because PRP is bound in labile form to particulate material, it is potentially bioavailable.
A problem of the method occurs with the unfiltered water samples which often had a high turbidity as we worked in waters with a high level of eutrophication (Nausch et al., 2011). The presence of particles that remain after the digestion can result in an underestimation of TP (Jarvie et al., 2002). In this study, this was avoided by exemplarily diluting the samples to a median sample:Milli-Q water ratio of 4:3 and 1:2.
Furthermore, because of the pressure exerted by the vacuum pump during the filtration (Rigler, 1968), the cells might collapse such that P of particulate origin contaminates the dissolved P fractions. This would lead to an underestimation of the particulate P fractions. To avoid this problem, we prevented crowding of the cells as described above.
Apparently, the traditional nomenclature is adaptable in less eutrophic waters or rather in waters with less turbidity like the station “Baltic Sea” (Table 3). Here, the difference between TP and DRP/DIP are less and the amount of particulate P is negligible. Thus, the proposed P categories could be used in waters with less turbidity but are advisable in waters with a high level of eutrophication and particles.
Differentiation of the Phosphorus Categories
The P fractions (TP and DRP) of the traditional monitoring (Nausch et al., 2011; Stammler et al., 2017; Han et al., 2018) and that of the extended programs (Nausch et al., 2017, own data) are highly variable, regardless of the chosen study area (Table 2). This was evidenced by the similar ranges of our own data from the estuary and the Baltic Sea and the mean TP and DRP values reported by Nausch et al. (2011). Especially in summer, the export of dissolved P forms out of the Warnow river may support primary production in the estuary and the southern Baltic Sea. Therefore, the proportion of PNP increased. The general trend of a decrease in TP towards the Baltic Sea suggested either the dilution of inflowing Baltic Sea water (Figure 4) or smaller inflows in the municipal area of Rostock together with the sedimentation of particulate P forms. In a seasonal comparison, the TP concentrations were higher in June 2017 than in February 2017. The reason therefore is a higher biomass in June than in February. In February the phytoplankton is dominant whereas in June the community consists of phytoplankton and zooplankton. Additionally, the Secchi depth is lower in June than in February which points to higher biomass in June.
In contrast to TP the PRP fraction was larger in February than in June at all three stations. This may have been a consequence of the high turbidity caused by a storm event that occurred during sampling in February, especially at the station “Baltic Sea.” Higher turbidity and PRP concentrations could be positively correlated because dissolved P adsorb on particular material like on resuspended sediment (Stainton, 1980). Except for the river station, the amount of PNP in February was less than in June, most likely due to particulate material that was autochthonously built and not exported. Moreover, the chlorophyll a concentration was in “Bützow” in February higher than in June so that the high PNP data could be explained by a possible phytoplankton bloom.
The values of the TP and DRP concentrations reported by Stammler et al. (2017) in their study of the river system associated with the Great Lakes (USA) and by Han et al. (2018), who analyzed P concentrations in the Three Gorges Reservoir (China), were higher than those determined at the Warnow stations representing the Baltic Sea and the Warnow estuary but also analyzed by Nausch et al. (2011). They were also higher than those measured in a portion of the Warnow catchment area (Nausch et al., 2017). This large variety in TP and DRP may reflect regional differences between the different study areas. Additionally, according to Stammler et al. (2017), the deviation in the range of P values is allegeable by the different sampling rhythms. The data used in that study were collected between 1979 and 2011, with monthly sampling during the growing season (April to November). Our data were obtained from monthly samples collected between September 2016 and September 2017. On the other hand, Han et al. (2018) used data from four samplings timed according to the water cycle of the examined reservoir. In that study, sampling was performed in October 2014 (impounding period), January 2015 (high water level period), July 2015 (low water level period), and April 2016 (sluicing period).
Our results demonstrate that the various P forms occurring in aquatic systems depend on the season and the hydrology. Further research is needed to specify the single P components and their function within the P cycle. They also showed that the transformation processes taking place between the single P fractions are not reflected in the traditional monitoring, which detect only TP and DRP concentrations.
Conclusion
In traditional monitoring programs, only TP and DRP concentrations are measured. This does not reflect the diversity and complexity of P cycle in aquatic environment and underestimates the eutrophication potential. The determination of all P categories is important both for comparison to data reported in the literature and to own data within a single multi-year study. However, because P forms are not stable, spatially and even within the same season, all P categories must be measured if effective nutrient reduction is to be successfully implemented. Additionally, an understanding of the function of the individual P components, such as their bioavailability, is important to determine to identify their contribution to eutrophication.
Furthermore, it is necessary to communicate research results to stake holders and implement the measurement of all P categories into monitoring strategies. Therefore, a simple and standardized method and concise nomenclature is helpful. The molybdenum blue reaction is a common and standardized method to determine P. The operative nomenclature, we presented in this study, based on reactivity of P with molybdenum blue. This should simplify research communication and prevent misinterpretation due to the functional terms of organic and inorganic P given to operational differentiated P components.
Author Contributions
All authors were involved in contributing the conception and design of the study and performed the experiments; FB and LF analyzed the data; LF wrote the first and following drafts of the manuscript; DS-B supported LF during the writing process with ideas for the manuscript design. All authors are involved in manuscript revision, read, and approved the submitted version.
Conflict of Interest Statement
The authors declare that the research was conducted in the absence of any commercial or financial relationships that could be construed as a potential conflict of interest.
Acknowledgments
We thank Christoph Kamper and Carmen Esser for their technical assistance in the lab. Additionally, we thank Sandra Jahn who aided during the development of the filtration scheme. This study is part of the PhosWaM project (Phosphorus from source to sea—Integrated phosphorus and water resources management for sustainable water protection), funded by the Federal Ministry of Education and Research, Germany (FKZ 033W042A). It also was performed within the scope of the Leibniz ScienceCampus Phosphorus Research Rostock.
Abbreviations
DHP, dissolved hydrolysable phosphorus; DIP, dissolved inorganic phosphorus; DNP, dissolved non-molybdate-reactive phosphorus; DP, (total) dissolved phosphorus; DRP, dissolved reactive phosphorus, dissolved molybdate-reactive phosphorus (new); DUP, dissolved unreactive phosphorus; FOP, filterable organic phosphorus; FRP, filterable reactive phosphorus; MRP, molybdate reactive phosphorus; ortho-P, orthophosphate; P, phosphorus; PNP, particulate non-molybdate-reactive phosphorus; , phosphate; PP, particulate phosphorus; PRP, particulate molybdate-reactive phosphorus; SRP/srP, soluble reactive phosphorus; SUP, soluble unreactive phosphorus; TDP, total dissolved phosphorus; TFP, total filterable phosphorus; TP, total phosphorus; TPP, total particulate phosphorus; TRP, total molybdate-reactive phosphorus.
References
Backer, H., Leppänen, J. M., Brusendorff, A. C., Forsius, K., Stankiewicz, M., Mehtonen, J., et al. (2010). HELCOM Baltic Sea Action Plan – A regional programme of measures for the marine environment based on the Ecosystem Approach. Mar. Pollut. Bull. 60, 642–649. doi: 10.1016/j.marpolbul.2009.11.016
Baldwin, D. S. (1998). Reactive “organic” phosphorus revisited. Water Res. 32, 2265–2270. doi: 10.1016/S0043-1354(97)00474-0
Gustafsson, B. G., Schenk, F., Blenckner, T., Eilola, K., Meier, H. E. M., Müller-Karulis, B., et al. (2012). Reconstructing the development of Baltic Sea Eutrophication 1850-2006. Ambio 41, 534–548. doi: 10.1007/s13280-012-0318-x
Han, C., Zheng, B., Qin, Y., Ma, Y., Yang, C., Liu, Z., et al. (2018). Impact of upstream river inputs and reservoir operation on phosphorus fractions in water-particulate phases in the Three Gorges Reservoir. Sci. Tot. Environ. 610, 1546–1556. doi: 10.1016/j.scitotenv.2017.06.109
Haygarth, P. M., and Sharpley, A. N. (2000). Terminology for phosphorus transfer. J. Environ. Qual. 29, 10–15. doi: 10.2134/jeq2000.00472425002900010002x
Hecky, R. E., and Kilham, P. (1988). Nutrient limitation of phytoplankton in freshwater and marine environments: a review of recent evidence on the effects of enrichment. Limnol. Oceanogr. 33(4Pt 2), 796–822. doi: 10.4319/lo.1988.33.4part2.0796
Jarvie, H. P., Withers, P. J. A., and Neal, C. (2002). Review of robust measurement of phosphorus in river water: sampling, storage, fractionation and sensitivity. Hydrol. Earth Syst. Sci. 6, 113–131. doi: 10.5194/hess-6-113-2002
Jescovitch, L. N., Boyd, C. E., and Whitis, G. N. (2017). Effects of mechanical aeration in the waste-treatment cells of split-pond aquaculture systems on water quality. Aquaculture 480, 32–41. doi: 10.1016/j.aquaculture.2017.08.001
Koroleff, F. (1983). “Determination of phosphorus,” in Methods of Seawater Analysis, 2nd Edn., eds K. Grasshoff, M. Ehrhardt, and K. Kremling (Weinheim: Verlag Chemie), 125–138, 168–169.
Murphy, J., and Riley, J. P. (1962). A modified single solution method for the determination of phosphate in natural waters. Anal. Chim. Acta 27(Suppl. C), 31–36. doi: 10.1016/S0003-2670(00)88444-5
Nausch, G., Bachor, A., Petenati, T., Voß, J., and Von Weber, M. (2011). Nährstoffe in den deutschen Küstengewässern der Ostsee und angrenzenden Gebieten. Meeresumwelt Aktuell Nord Ostsee 1, 1–16.
Nausch, M., and Nausch, G. (2006). Bioavailability of dissolved organic phosphorus in the Baltic Sea. Mar. Ecol. Prog. Ser. 321, 9–17. doi: 10.3354/meps321009
Nausch, M., Woelk, J., Kahle, P., Nausch, G., Leipe, T., and Lennartz, B. (2017). Phosphorus fractions in discharges from artificially drained lowland catchments (Warnow River, Baltic Sea). Agric. Water Manage. 187, 77–87. doi: 10.1016/j.agwat.2017.03.006
OECD (1982). Eutrophication of Waters: Monitoring, Assessment and Control. Paris: Organisation for Economic Co-Operation and Development (Publié en français sous le titre “Eutrophication des Eaux. Méthodes de Surveillance, d'Evaluation et de Lutte”).
Rigler, F. (1968). Further observations inconsistent with the hypothesis that the molybdenum blue method measures orthophosphate in lake water. Limnol. Oceanogr. 13, 7–13. doi: 10.4319/lo.1968.13.1.0007
Stainton, M. P. (1980). Errors in the molybdenum blue methods for determining ortho-phosphate in freshwater. Can. J. Fish. Aquat. Sci. 37, 472–478. doi: 10.1139/f80-061
Stammler, K. L., Taylor, W. D., and Mohamed, M. N. (2017). Long-term decline in stream total phosphorus concentrations: a pervasive pattern in all watershed types in Ontario. J. Great Lakes Res. 43, 930–937. doi: 10.1016/j.jglr.2017.07.005
Unger, J., Endres, S., Wannicke, N., Engel, A., Voss, M., Nausch, G., et al. (2013). Response of Nodularia spumigena to pCO(2) - Part 3: turnover of phosphorus compounds. Biogeosciences 10, 1483–1499. doi: 10.5194/bg-10-1483-2013
Withers, P. J., and Jarvie, H. P. (2008). Delivery and cycling of phosphorus in rivers: a review. Sci. Tot. Environ. 400, 379–395. doi: 10.1016/j.scitotenv.2008.08.002
Keywords: phosphorus categories, differentiation, detection, monitoring program, contribution to eutrophication, Baltic Sea
Citation: Felgentreu L, Nausch G, Bitschofsky F, Nausch M and Schulz-Bull D (2018) Colorimetric Chemical Differentiation and Detection of Phosphorus in Eutrophic and High Particulate Waters: Advantages of a New Monitoring Approach. Front. Mar. Sci. 5:212. doi: 10.3389/fmars.2018.00212
Received: 29 January 2018; Accepted: 29 May 2018;
Published: 19 June 2018.
Edited by:
Barbara Cade-Menun, Agriculture and Agri-Food Canada (AAFC), CanadaReviewed by:
Raghab Ray, University of Tokyo, JapanSheree J. Watson, University of Hawaii at Manoa, United States
Copyright © 2018 Felgentreu, Nausch, Bitschofsky, Nausch and Schulz-Bull. This is an open-access article distributed under the terms of the Creative Commons Attribution License (CC BY). The use, distribution or reproduction in other forums is permitted, provided the original author(s) and the copyright owner are credited and that the original publication in this journal is cited, in accordance with accepted academic practice. No use, distribution or reproduction is permitted which does not comply with these terms.
*Correspondence: Lisa Felgentreu, bGlzYS5mZWxnZW50cmV1QGlvLXdhcm5lbXVlbmRlLmRl