 Jacob Dums
 Colin Murphree
 Naresh Vasani1,2
 Danielle Young
 Heike Sederoff
- 1Department of Plant and Microbial Biology, North Carolina State University, Raleigh, NC, United States
- 2Memorial Sloan Kettering Cancer Center, New York, NY, United States
- 3Department of Plant Biology, Michigan State University, East Lansing, MI, United States
Algal biofuel production requires an input of synthetic nitrogen fertilizer. Fertilizer synthesized via the Haber-Bosch process produces CO2 as a waste by-product and represents a substantial financial and energy investment. Reliance on synthetic fertilizer attenuates the environmental significance and economic viability of algae production systems. To lower fertilizer input, the waste streams of algal production systems can be recycled to provide alternative sources of nitrogen such as amino acids to the algae. The halophytic green alga Dunaliella viridis can use ammonium (NH4+) derived from the abiotic degradation of amino acids, and previously, supplementation of NH4+ from glutamine (GLN) degradation was shown to support acceptable levels of growth and increased neutral lipid production compared to nitrate. To understand the effect of glutamine-released NH4+ on algae growth and physiology, metabolite levels, growth parameters, and transcript profiles of D. viridis cultures were observed in a time course after transition from media containing nitrate as a sole N source to medium containing GLN, glutamate (GLU), or a N-depleted medium. Growth parameters were similar between GLN (NH4+) and nitrate supplemented cultures, however, metabolite data showed that the GLN supplemented cultures (NH4+) more closely resembled cultures under nitrogen starvation (N-depleted and GLU supplementation). Neutral lipid accumulation was the same in nitrate and glutamine-derived NH4+ cultures. However, glutamine-derived NH4+ caused a transcriptional response in the immediate hours after inoculation of the culture. The strong initial response of cultures to NH4+ changed over the course of days to closely resemble that of nitrogen starvation. These observations suggest that release of NH4+ from glutamine was sufficient to maintain growth, but not high enough to trigger a cell transition to a nitrogen replete state. Comparative transcript profiling of the nitrogen-starved and nitrate-supplied cultures show an overall downregulation of fatty acid synthesis and a shift to starch synthesis and accumulation. The results indicate that a continuous, amino acid derived slow release of NH4+ to algae cultures could reduce the amount of synthetic nitrogen needed for growth, but optimization is needed to balance nitrogen starvation and cell division.
Introduction
Most nitrogen fertilizer used in agriculture and industrial algae production is produced by the Haber-Bosch process, which converts N2 from air into ammonia using high pressure and temperature. Hydrogen for the Haber-Bosch process originates from methane, resulting in the release of CO2 (Huo et al., 2012). Approximately 2.5% of the world’s energy output is used for the Haber-Bosch process. Reducing the use of synthetic nitrogen fertilizer would lower the environmental impact and improve the feasibility of algae production.
After oil extraction, spent algae biomass contains nitrogen that can be recycled. The major nitrogen-containing components in this biomass are proteins and polynucleotides. Digestion of the proteins can provide substantial amounts of amino acids (Huo et al., 2012). While some algae species like Cyclotella cryptica and Chlorella spp. can take up some free amino acids and grow heterotrophically (Hellebust and Liu, 1974; Sauer et al., 1983), other oil producing algae are more selective in their ability to grow on amino acids as a nitrogen source (Kirk and Kirk, 1978; Ietswaart et al., 1994; Hellio and Le Gal, 1998; Murphree et al., 2017). Dunaliella viridis was previously shown to be unable to take up free amino acids from the medium with exception of histidine as a direct nitrogen source. However, D. viridis can utilize NH4+ released from abiotic degradation of glutamine (GLN), tryptophan, and cysteine. Histidine-supplemented growth medium supports algae growth at low rates, while GLN supplementation of algae cultures enables sufficient growth with a relatively high lipid content in the cells (Murphree et al., 2017). The ability to provide NH4+ derived from deaminated amino acids like GLN, tryptophan, and cysteine can contribute to the recycling of organic nitrogen from the culture and reduce the input of synthetic nitrogen fertilizer. D. viridis like other Dunaliella species is sensitive to ammonia toxicity (Gutierrez et al., 2016; Murphree et al., 2017) and shows growth inhibition and cell death at concentrations above 1 mM. Therefore, using amino acids as a slow-release source of ammonium would limit ammonia toxicity.
Dunaliella viridis is a halophytic green alga that can accumulate large amounts of triacylglycerides (TAG) for biofuel production. Extraction of the TAGs can be achieved by osmotic shock (Wang et al., 2013), because Dunaliella spp. lack a cell wall. Its short generation time (<1 division per day), low freshwater requirement, and inducible lipid and starch production (Hosseini Tafreshi and Shariati, 2009; Srirangan et al., 2015) make Dunaliella spp. a desirable biofuel feedstock. Dunaliella spp. have been physiologically characterized for years (Oren, 2005; Ben-Amotz et al., 2009); however, only recently have there been attempts to explore transcriptomes of these algae under different environmental conditions such as: nitrogen starvation (Shin et al., 2015; Tan et al., 2016), salinity change (Fang et al., 2017), temperature (Srirangan et al., 2015), light (Shin et al., 2015; Srirangan et al., 2015), and heavy metals (Puente-Sanchez et al., 2016). Other transcriptomic studies have been used to explore gene content, but not transcriptional regulation (Rismani-Yazdi et al., 2011; Keeling et al., 2014; Matasci et al., 2014; Hong et al., 2017; Yao et al., 2017). As nitrogen starvation is a key inducer of lipid production in algae, changes in transcriptome profiles in response to changes in N-supply have been investigated in other algae like Chlamydomonas spp. or Nannochloropsis (Merchant et al., 2012; Vieler et al., 2012). Dunaliella spp. transcriptomes have only been characterized in response to NO3−, but not NH4+ (Shin et al., 2015; Tan et al., 2016). GLN is converted over time into pyroglutamate and NH4+ in medium used for Dunaliella cultivation and can support favorable growth and neutral lipid production in D. viridis (Murphree et al., 2017). However, the transcriptional regulation that differentiates NO3− and glutamine-derived ammonia (NH4+) supported growth are unknown.
Our experiments were designed to distinguish physiological, metabolic, and transcriptional changes in D. viridis cultures in response to a transition to different nitrogen sources in the medium, specifically amino acid (GLN) derived ammonium. Because amino acid-derived ammonium release is slow, the algae can survive and grow on GLN containing medium, while cultures supplemented with the same concentration of ammonium do not survive. An ammonium control was not included as it was anticipated to be lethal. Algae cultures supplemented with GLN produced relatively high levels of TAG due to a starvation response that followed an initial growth response. This work suggests that in principle nitrogen from spent biomass could be recycled to reduce the need for synthetic fertilizer in algae biofuel production.
Materials and Methods
Growth Conditions
Dunaliella viridis strain dumsii was grown in a modified Ben-Amotz medium (pH 7.5) as reported previously (Murphree et al., 2017). Experiments were performed in a Percival E-36L growth chamber under continuous cool white fluorescent light (125 μmol photons m2/s) at a temperature of about 23°C. A preliminary growth experiment was performed as previously (Murphree et al., 2017) to determine a GLN concentration suitable for sufficient growth and lipid production. Concentrations of 0, 1, 2, 3, 4, 5, 6, 7, 8, 9, 10, and 20 mM GLN were screened and 5 mM GLN (the original concentration from Murphree et al., 2017) was chosen for more detailed analysis (Supplementary Figure S1). Four experimental media (pH 7.5) were created with nitrogen sources of 5 mM KNO3, 5 mM L-glutamine (Sigma-Aldrich), 5 mM L-glutamate (Sigma-Aldrich), or no addition of KNO3 (Supplementary Figure S2). The L-glutamate condition was used to control for nitrogen starvation in the presence of an unused and stable amino acid (Murphree et al., 2017). Cultures for inoculation were grown for a week in the KNO3 experimental condition and were harvested by centrifugation (3500 × g, 6 min.) in mid-logarithmic phase. These cells were suspended in 450 ml of the proper experimental media in 1 l narrow-necked Erlenmeyer flasks to a concentration of 1 million cells/ml. Each of the four experimental cultures was duplicated to give two technical replicates and the entire experiment was repeated three times to provide three biological replicates.
Samples were taken in 24 h intervals starting at 3 h after inoculation (3, 27, and 51 h). Cultures were given 3 h to adjust to the new media to attempt to avoid effects from transfer shock in the data. In addition to the samples taken from the experimental cultures, half volume samples were taken in duplicate from the inoculum culture (INOC) right before inoculation. Sample collection consisted of aliquots taken for cell density/diameter/pH measurements (1 ml), RNA extraction (30 ml), neutral lipid fluorescence assay (5 ml), carbohydrate detection (100 ml), soluble protein assay (5 ml), and chlorophyll content measurement (1 ml) (Supplementary Figure S2). The aliquots for RNA, carbohydrate, and protein measurements were pelleted and flash frozen in liquid nitrogen for bulk processing. Cell density/diameter/pH, neutral lipid fluorescence assay, and chlorophyll content samples were processed immediately using the following protocols.
Cell Density/Diameter/pH Measurements
Cell density and diameter were determined using a TC10 Automated Cell Counter (Bio-Rad). Cell diameters were calculated from histogram data provided from the counter. Cells were grouped into 2 μm wide bins and an approximate average cell diameter was calculated from those data. The pH was measured with a Glass Semi-Micro Combination pH Electrode (Beckman Coulter) directly on the 1 ml cell suspension used for cell density/diameter measurements.
Chlorophyll
Chlorophyll content was quantified as described in Srirangan et al. (2015). A 1 ml aliquot of cells was pelleted (3500 × g) and 0.75 ml of supernatant was removed. 1 ml of 100% ethanol was added to the 250 μl pellet and the samples were vortexed. After incubating at room temperature for 10 min, the samples were vortexed again and centrifuged for 10 min at 13000 rpm. The absorbance of the supernatant (1 ml) was read at 652 nm in a BioSpectrometer basic (Eppendorf). The total chlorophyll concentration (in mg/ml) was calculated as A652 nm/36, where 36 is the extinction coefficient for chlorophyll A and B in ethanol (Arnon, 1949; Winter, 1993).
Soluble Protein
5 ml frozen pellets of cells were suspended in 1 ml of deionized water and soluble protein was extracted as described previously (Murphree et al., 2017). Briefly, frozen cells suspended in water were pelleted and the supernatant removed. The pellet was re-extracted with 1 ml of 0.1 N NaOH, incubated at room temperature with intermittent vortexing for 60 min, centrifuged (3500 × g), and the supernatants combined. Protein was quantified using the Micro BCATM Protein Assay Kit (ThermoFisher) on a plate reader (Biotek Synergy HT) (Srirangan et al., 2015). Protein concentrations were calculated using linear regression analysis against a bovine serum albumin standard curve ranging from 0 to 200 μg/ml.
Total Carbohydrate
100 ml culture were pelleted (3500 × g) and the supernatant discarded. The pellets were frozen until processing. Total carbohydrates were quantified by resuspending the pellets in 1 ml of water. A 1:100 dilution of the suspension with water was used for carbohydrate extraction and quantified using a microplate-adapted version of the Dubois method (Dubois et al., 1956). Briefly, 40 μl of cell dilutions were placed in 96-well polystyrene plates (Olympus Plastics) and then 40 μl of 5% w/v crystalline phenol/H2O was added and mixed. Plates were incubated for 15 min and then 200 μl of 95–98% H2SO4 was mixed into the samples. Absorption of the samples at 490 nm was detected in a plate reader (Biotek Synergy HT). All samples were prepared in triplicate and a standard curve of 5 to 500 μg/ml sucrose in H2O was used to calculate total carbohydrate content.
Neutral Lipids
Neutral lipids were detected in whole cells using a Nile Red dye-based assay as described in Murphree et al. (2017). Briefly, 5 ml culture samples were pelleted and suspended in 600 μl of fresh modified Ben-Amotz media. Samples were divided into 200 μl triplicates in 96-well polystyrene plates (Olympus Plastics) and Nile Red (9-diethylamino-5H-benzo(α)phenoxazine-5-one, Sigma-Aldrich) was added to a final concentration of 0.26 μM. Samples were incubated at room temperature in the dark for 15 min and then excited at 485 nm and detected at 590 nm in a plate reader (Biotek Synergy HT). Coconut oil standards of 5–100 μg/ml were used to calculate neutral lipid concentrations (Murphree et al., 2017).
Reference Transcriptome Annotation
Original transcriptome annotations for D. viridis strain dumsii were from a 2012 Blast2GO annotation run (Srirangan et al., 2015). Due to the advancements in the number of genomes sequenced and the expansion of annotation databases, the reference transcriptome was out-of-date. The newly released Dunaliella salina CCAP 19/18 genome, available through Phytozome (Polle et al., 2017), was used to re-annotate based upon similarity of D. viridis transcripts to D. salina proteins. The D. salina proteome was obtained from Phytozome on June 11, 2017 and converted to a Blast database within CLC Genomics Workbench version 10.01. Blastx was used to extract the best protein hit for each D. viridis transcript using the following parameters: maximum number of blast hits = 1; e-value cutoff = 10−1; low complexity filter = off. D. salina annotations were then ascribed to the D. viridis transcripts. Previous manual annotations were kept as they had already been confirmed. This rough annotation increased the number of annotated genes in D. viridis strain dumsii from 9400 to 13273. Genes highlighted in results figures were all checked for conflicts between the original and the new annotation, and conflicts were resolved by Blastx against the NCBI nonredundant (NR) protein database. Annotations are available in Supplementary Data Sheet S1.
RNA Extraction, Sequencing, and Quality Control
Total RNA was extracted from the 30 ml frozen pellets of the 39 samples using the RNeasy Plant Mini Kit (Qiagen) following standard procedures for use with a QIAcube (QIAgen, batch V1, serial #14666). DNA was removed from total RNA using RNase-Free DNase (Qiagen), and rRNA was depleted from the samples using the Ribo-ZeroTM Magnetic Kit (Plant Leaf) (Epicenter). After each processing step, RNA quality was confirmed using a Bioanalyzer RNA Pico Chip (Agilent). Strand specific cDNA libraries with 300–450 bp inserts were generated with the NEBNext® UltraTM Directional RNA Library Prep Kit for Illumina® (New England BioLabs). Sample libraries were barcoded using the TruSeq DNA LT Sample Prep Kit, Indexed Adapter Sequences (Illumina). Final quality of the libraries was confirmed using a Bioanalyzer DNA high sensitivity chip (Agilent). Libraries were split into 2 groups and submitted for single end 125 bp Illumina HiSeq 2500 sequencing runs in 2 flow cells at the North Carolina State University Genomic Sciences Laboratory (GSL). Quality control, filtering, and trimming were performed using FastQC and the FAST-X toolkit and resulted in an average loss of 3% of reads.
Mapping Reads
Reads from each sample were mapped to the previously de novo assembled reference transcriptome of D. viridis strain dumsii (Srirangan et al., 2015) using the RNA-Seq Analysis module of the CLC Genomics Workbench version 10.01. The reference transcriptome was modified to eliminate seven contaminating transcripts from tomato, and six transcripts were trimmed or eliminated due to previous adapter/index contamination in the original assembly. The RNA-Seq Analysis module, which uses an expectation-maximization (EM) algorithm like RSEM (Li and Dewey, 2011), was run with default parameters (mismatch cost = 2; insertion cost = 3; deletion cost = 3; length fraction = 0.8; similarity fraction = 0.8), and strand specificity was ignored. Since putative alternate splice transcripts are represented individually in the reference transcriptome, the “maximum number of hits for a read” was increased to 30 so that reads that matched the multiple transcripts were not discarded. As these putative transcripts are only predicted and not verified for D. viridis, gene counts are preferable to transcript differences. To obtain gene specific data, raw counts for each transcript were exported from the CLC Genomics Workbench, and the counts for each putative transcript of each gene were summed to give a total raw read count per gene. The total gene counts were then imported back into CLC Genomics Workbench for differential expression analysis using the Microarray Tools in CLC.
Differential Expression (DE) Analysis
Differential expression analysis was used to determine significant transcriptional differences between the four nitrogen sources, nitrate (NO3), nitrogen starvation (STAR), glutamate (GLU), and glutamine (GLN) at each of the three time points (3, 27, and 51 h) (Supplementary Figure S2). Comparisons were also made between the time points within each nitrogen source to determine transcriptional differences over time for a single nitrogen source. All samples were also compared to the INOC to provide a common comparison point (Supplementary Figure S2). DE analysis was performed using the “Empirical analysis of DGE” tool in CLC, which utilizes the edgeR version 3.4.0 implementation of Fisher’s Exact Test for two-group comparisons (Robinson et al., 2010). Only genes that had a total number of read counts > 5 within each comparison group were used to estimate tagwise dispersions, and the counts from biological replicates were averaged. Initial analysis showed all comparisons between the GLU and STAR conditions were not statistically different, and thus all comparisons were regenerated without GLU data. DE was considered significant based on the following parameters: False Discovery Rate (FDR) corrected p-value ≤ 0.05, log2 fold change ≥|1|, and the total read count for the gene within the comparison was > 75. Raw read files and total read counts are available through the Gene Expression Omnibus accession, GSE111548 (Dums et al., 2018). Log2 fold change values and FDR p-values for all comparisons are available in Supplementary Data Sheet 1.
Pathway Analysis
The genes for lipid synthesis, triacylglycerol synthesis, and starch metabolism pathways were extracted from previous work (Srirangan et al., 2015). Genes for nitrogen assimilation, the Calvin-Benson Cycle, and the Krebs Cycle were extracted using KEGG Orthology (KO) terms for those respective pathways (Kanehisa et al., 2017). Missing genes were manually obtained from the D. viridis transcriptome (Srirangan et al., 2015) using Chlamydomonas reinhardtii orthologs from the KO Database (November 27, 2017). Putative D. viridis mRNA sequences were manually translated with ExPASy translate tool (Artimo et al., 2012) and submitted for KO annotation using BlastKOALA (Kanehisa et al., 2016) to confirm that they were appropriate orthologs.
Results
The findings here confirm the results of prior work (Murphree et al., 2017), specifically that the supplementation of growth medium with GLU as the sole nitrogen source showed the same physiological, metabolic, and transcriptome phenotypes and profiles as cultures grown on N-deplete medium. GLU is not a source of nitrogen for D. viridis and does not serve as a slow-release source for ammonium. The nitrogen replete conditions of nitrate and glutamine (NH4+) demonstrated similar growth rates and metabolic data at 27 h, but statistically significant differences at 51 h. This general pattern was also reflected in the transcriptome data.
Glutamine Decreases Cell Diameter, but Not Cell Density
Cell density and diameter were measured to determine changes in cell division rates and cell volumes under each nitrogen treatment. The GLU and STAR treatments showed identical responses, with a 90% increase in cell density from 3 to 27 h (Figure 1A). GLN and NO3 supplementation show a 110% increase in cell density from 3 to 27 h which is significantly different from the nitrogen starved (GLU, STAR) conditions. Cells in both nitrogen replete treatments (GLN, NO3) continued to divide until 51 h, a 140% increase, while the nitrogen starved treatments (GLU, STAR) showed only a 15% increase (Figure 1A). Cultures containing GLN or NO3 showed an increase in cell size at 27 h over nitrogen-starved (GLU, STAR) cells; however, at 51 h cells provided with GLN were the same size as starved (GLU, STAR) cells, while the NO3-grown cells were larger (Figure 1B).
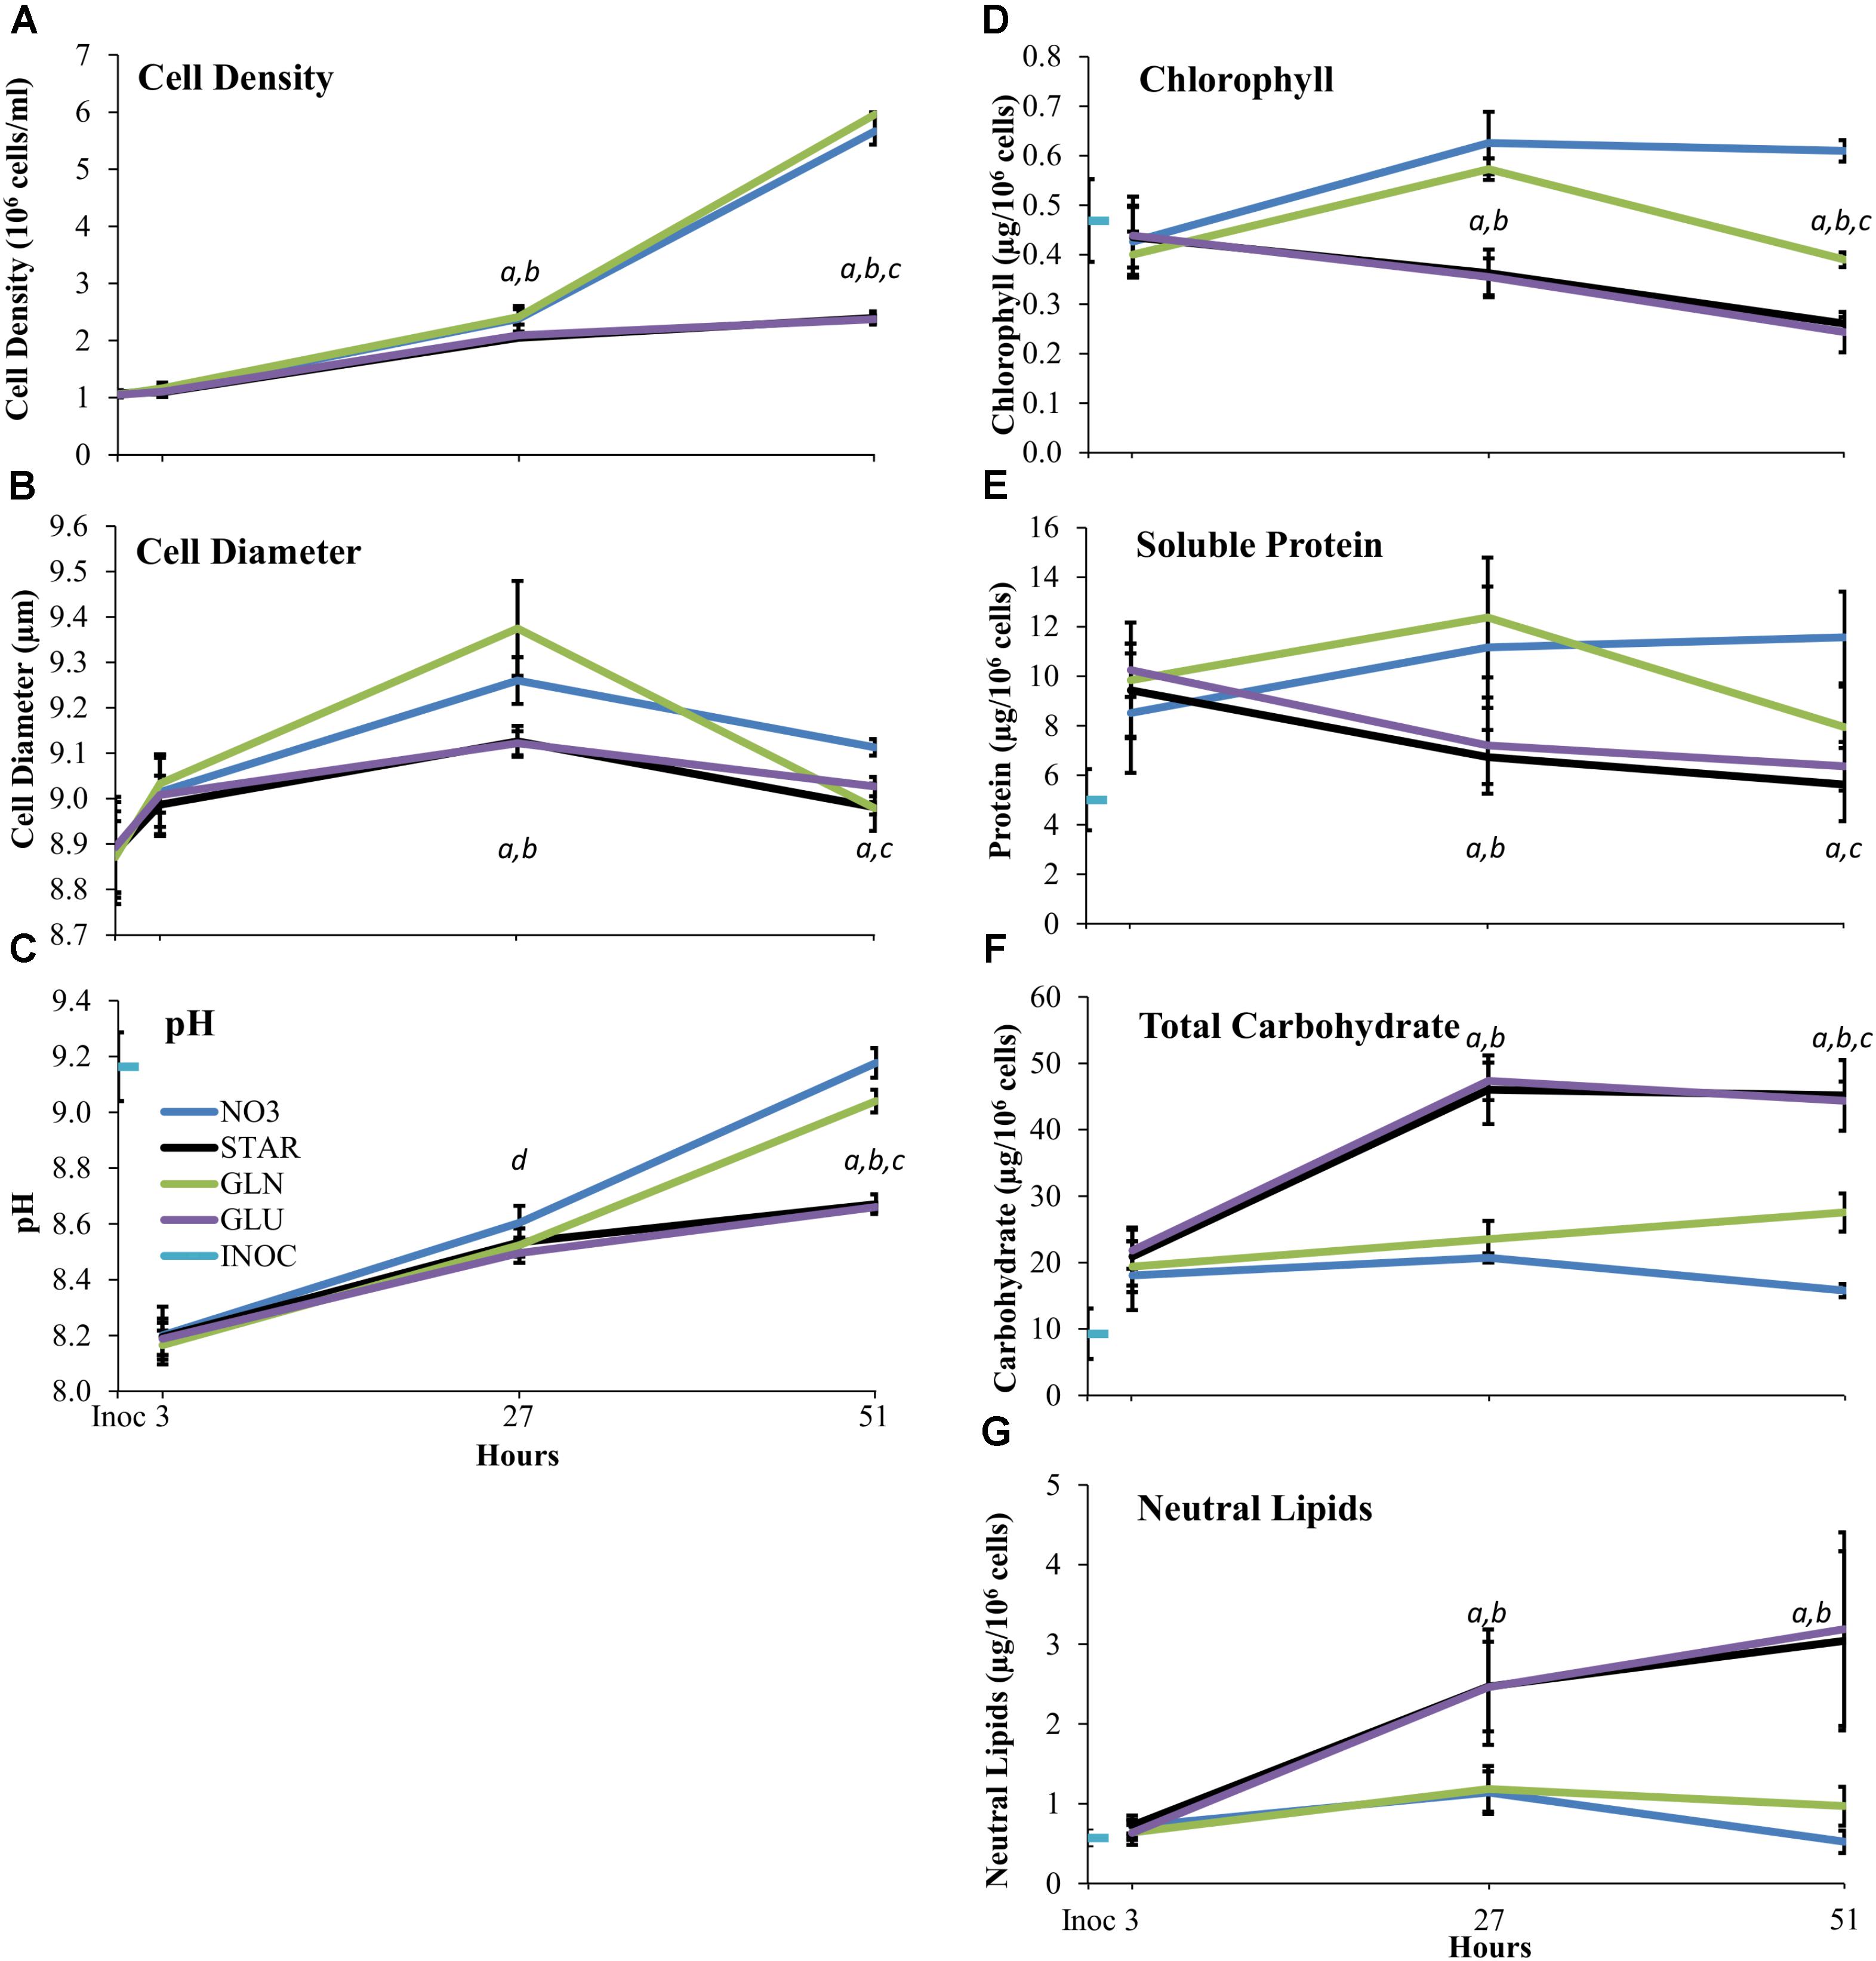
FIGURE 1. Cell Density (A) Cell Diameter (B) Media pH (C) Chlorophyll (D) Soluble Protein (E) Total Carbohydrate (F) and Neutral Lipid (G) over time on different nitrogen sources. The Inoc time point represents cell density (A) and diameter (B) of treatment cultures immediately after inoculation. For media pH (C) chlorophyll (D) soluble protein (E) total carbohydrate (F) and neutral lipid (G) the Inoc time point is the measurement of the inoculum culture immediately before inoculation. The 3, 27, and 51 h time points are the measurements at the time of the cell collections. Averages are based upon three biological replicates and error bars represent one standard deviation. Statistical difference between nitrogen treatments at each time point was determined using single factor ANOVA (p ≤ 0.05) followed by Tukey’s HSD. Significant difference within each time point is represented as follows: between NO3 and GLU/STAR (a), GLN and GLU/STAR (b), NO3 and GLN (c), and NO3 and GLU (d). Abbreviations: nitrate (GLN), no nitrogen (STAR), glutamine (GLN), glutamate (GLU), and inoculum (INOC).
Active Cell Division Resulted in Higher Media pH
Medium pH of the growing cultures was monitored to determine whether the nitrogen source accelerated or attenuated biological medium alkalization over time. All cultures experienced an initial decrease in pH as the INOC was at a higher pH than the fresh media. Each culture condition resulted in increased pH over time. At 51 h the nitrogen-starved conditions (GLU, STAR) had lower pH levels than the nitrogen-sufficient conditions (NO3, GLN) with NO3 showing increased alkalization beyond that of the GLN treatment (Figure 1C).
Nitrogen Starvation and Glutamine Result in Less Chlorophyll and Soluble Protein Than Nitrate
Dunaliella viridis cells supplemented with GLN showed an intermediate amount of chlorophyll per cell in comparison to NO3 and nitrogen starved (GLU, STAR) conditions. The nitrogen-starvation conditions (GLU, STAR) show a trend of decreasing cellular chlorophyll content whereas the nitrogen-sufficient (NO3, GLN) conditions show greater chlorophyll content per cell over the nitrogen starved (GLU, STAR) conditions (Figure 1D). At 27 h, GLN, and NO3 supplemented cultures have ∼67% more chlorophyll per cell than the starvation conditions (GLU, STAR). At 51 h, cells in the NO3 culture maintain their chlorophyll content while cells growing in the GLN culture show a decrease in chlorophyll content that is similar to the chlorophyll content the cells had at 3 h after inoculation. GLN-grown cells still maintain more chlorophyll than nitrogen-starved cells (GLU, STAR) (Figure 1D).
The changes in cellular soluble protein content during growth in the different media shows a very similar pattern to that of the chlorophyll content. Nitrogen starvation conditions (GLU, STAR) resulted in a decrease in cellular protein content over time, while nitrogen sufficiency (NO3, GLN) showed increased protein content. However, unlike chlorophyll, the protein content in GLN grown cells at 51 h was reduced to the equivalent level of the nitrogen starved cells (Figure 1E).
Glutamine Increases Carbohydrate Concentration Over Nitrate but Not Neutral Lipid Concentration
In microalgae, changes in carbon storage molecules are common under variable nitrogen conditions, especially the increase in carbon storage under nitrogen starvation (Schmollinger et al., 2014; Goncalves et al., 2016b). A similar response pattern was observed at 27 h after inoculation for total carbohydrate (Figure 1F) and neutral lipids (Figure 1G), where all carbon storage components showed a doubled or higher quantity when the cells were grown under nitrogen starvation (GLU, STAR).
After 51 h in the respective culture media, the cells show differences in the accumulation of carbon storage components. The total carbohydrate content of GLN-grown cells increased while the NO3-grown cells showed a decrease in total carbohydrate levels (Figure 1F). The GLN-grown cells accumulated an intermediate carbohydrate quantity between nitrogen starvation and nitrate conditions similar to chlorophyll content (Figure 1D). For neutral lipid content, there were slight decreases in neutral lipid content from 27 to 51 h in the nitrogen-replete conditions (NO3, GLN), while the cells grown under nitrogen-starvation conditions (GLU, STAR) continue to accumulate neutral lipids. Neutral lipid content in the cells of the NO3 and GLN supplemented cultures was not different at either 27 or 51 h (Figure 1G).
Nitrogen Starvation Results in Large Transcriptional Changes
We compared the different transcriptome profiles over time (INOC, 3, 27, and 51 h) (Supplementary Figure S3 and Supplementary Table S2) and between treatments at each time point (NO3, GLN, and GLU) (Figure 2). Overall, 7019 transcripts or 38% of the D. viridis transcriptome was differentially expressed (DE) in at least one comparison. At 3 h there were 64 uniquely DE genes between the three nitrogen treatments which increased to 3927 DE genes by 27 h (Figure 2). At 51 h 21.9% of the transcriptome or 4048 genes were DE. At 3 h the NO3 and STAR transcriptomes were significantly different from the GLN transcriptome, but not from each other. This changes at 27 h when there are 3562 DE gene between NO3 and STAR. At 27 h, only 20 DE genes were identified between GLN and NO3 treatments with 6 DE genes involved in nitrogen metabolism. However, the 2748 DE genes between STAR and GLN largely overlapped the NO3 vs. STAR comparison (Figure 2). At 51 h, NO3, and STAR maintained a large amount of DE genes at 3719. However, at 51 h DE genes between GLN and NO3 increased to 694 genes and the DE genes between GLN and STAR decreased to 1330 genes (Figure 2).
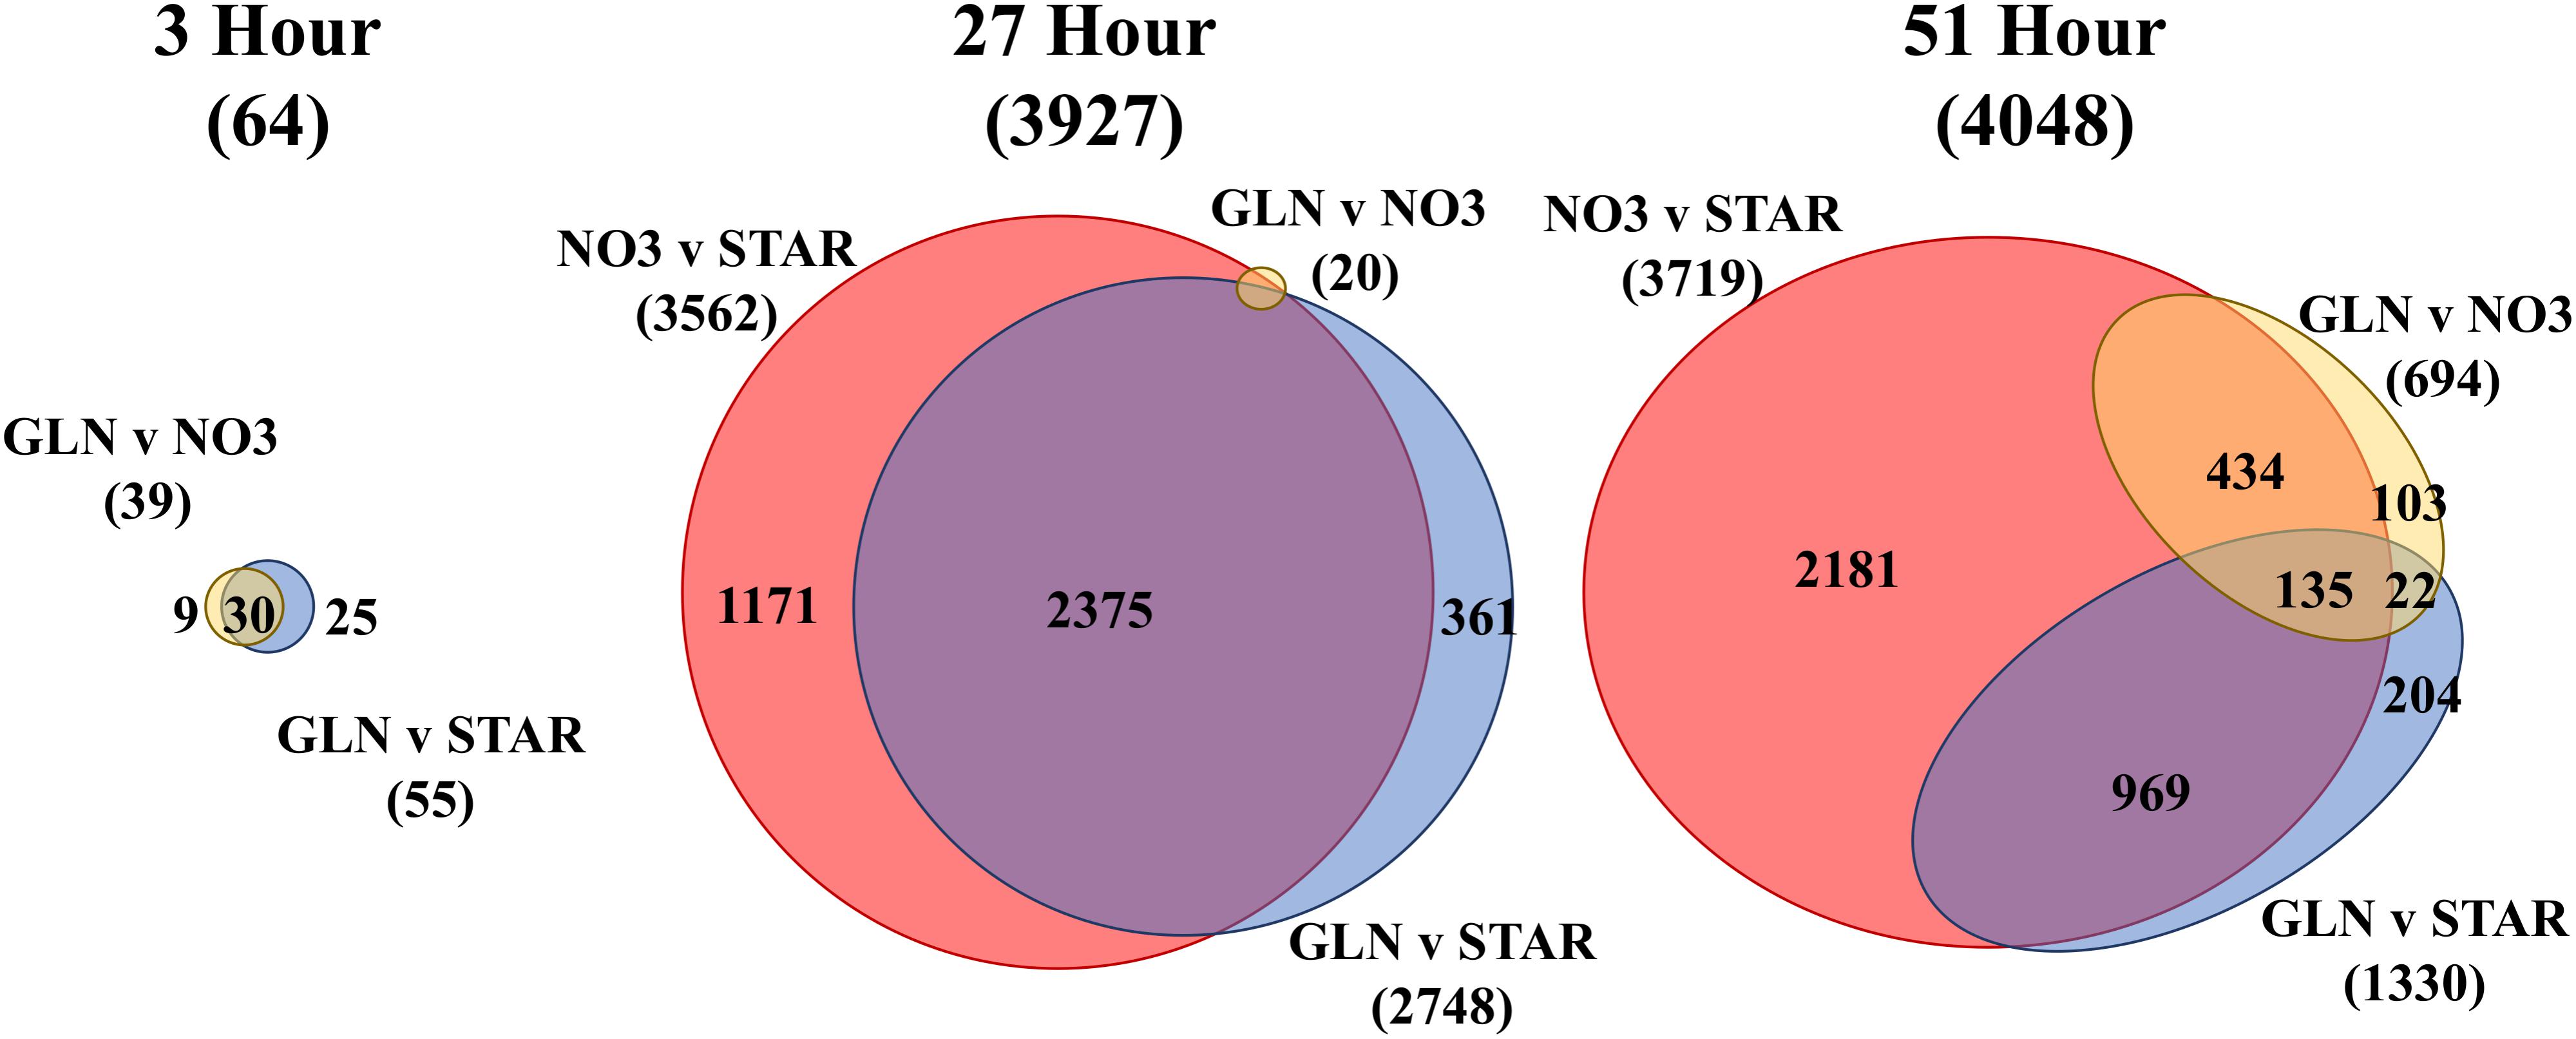
FIGURE 2. Euler diagrams of differentially expressed (DE) genes by nitrogen source. Each area-proportional Euler diagram represents differential expression between nitrogen conditions at each time point (3, 27, and 51 h) and are scaled to the 51 h comparison. The total number of DE genes in each comparison is displayed under each label. The number of shared genes for each comparison is displayed within the overlap region between comparisons. The color scheme represents the same nitrogen source comparison made among each time point. The 27 h diagram does not have all numbers displayed due to the small amount of DE genes for the GLN vs. NO3 condition. Full numerical output is in Supplementary Table S1. Euler diagrams created using eulerAPE (Micallef and Rodgers, 2014). Abbreviations: GLN, Glutamine; NO3, nitrate; STAR, nitrogen starvation.
Nitrogen Assimilation Genes Are Differentially Expressed in All Nitrogen Conditions and Over Time
When analyzing the genes involved in nitrogen assimilation, DE was determined by comparison of all transcript profiles to INOC so that the magnitude of response could be compared within nitrogen sources and across time. Overall, GLN and STAR show more dynamic responses over time than NO3, and since the INOC was grown with NO3 this response was expected.
The STAR condition at 3 h resulted in upregulation of several nitrate/nitrite porters (NNP), all ammonium transporters (AMTs), nitrate assimilation related 2 (NAR2), and the rhythm of chloroplast 40 (ROC40) transcription factor (Figure 3). At 27 h, all the NNP genes were downregulated in comparison to 3 h, while the AMTs, cytosolic glutamine synthetase (GS), NADH-dependent GLN oxoglutarate aminotransferase (GOGAT), and several regulatory proteins and transcription factor genes were upregulated. The upregulation of these genes was either maintained or increased at the 51 h time point, while the expression of the downregulated genes was maintained below the INOC expression levels (Figure 3).
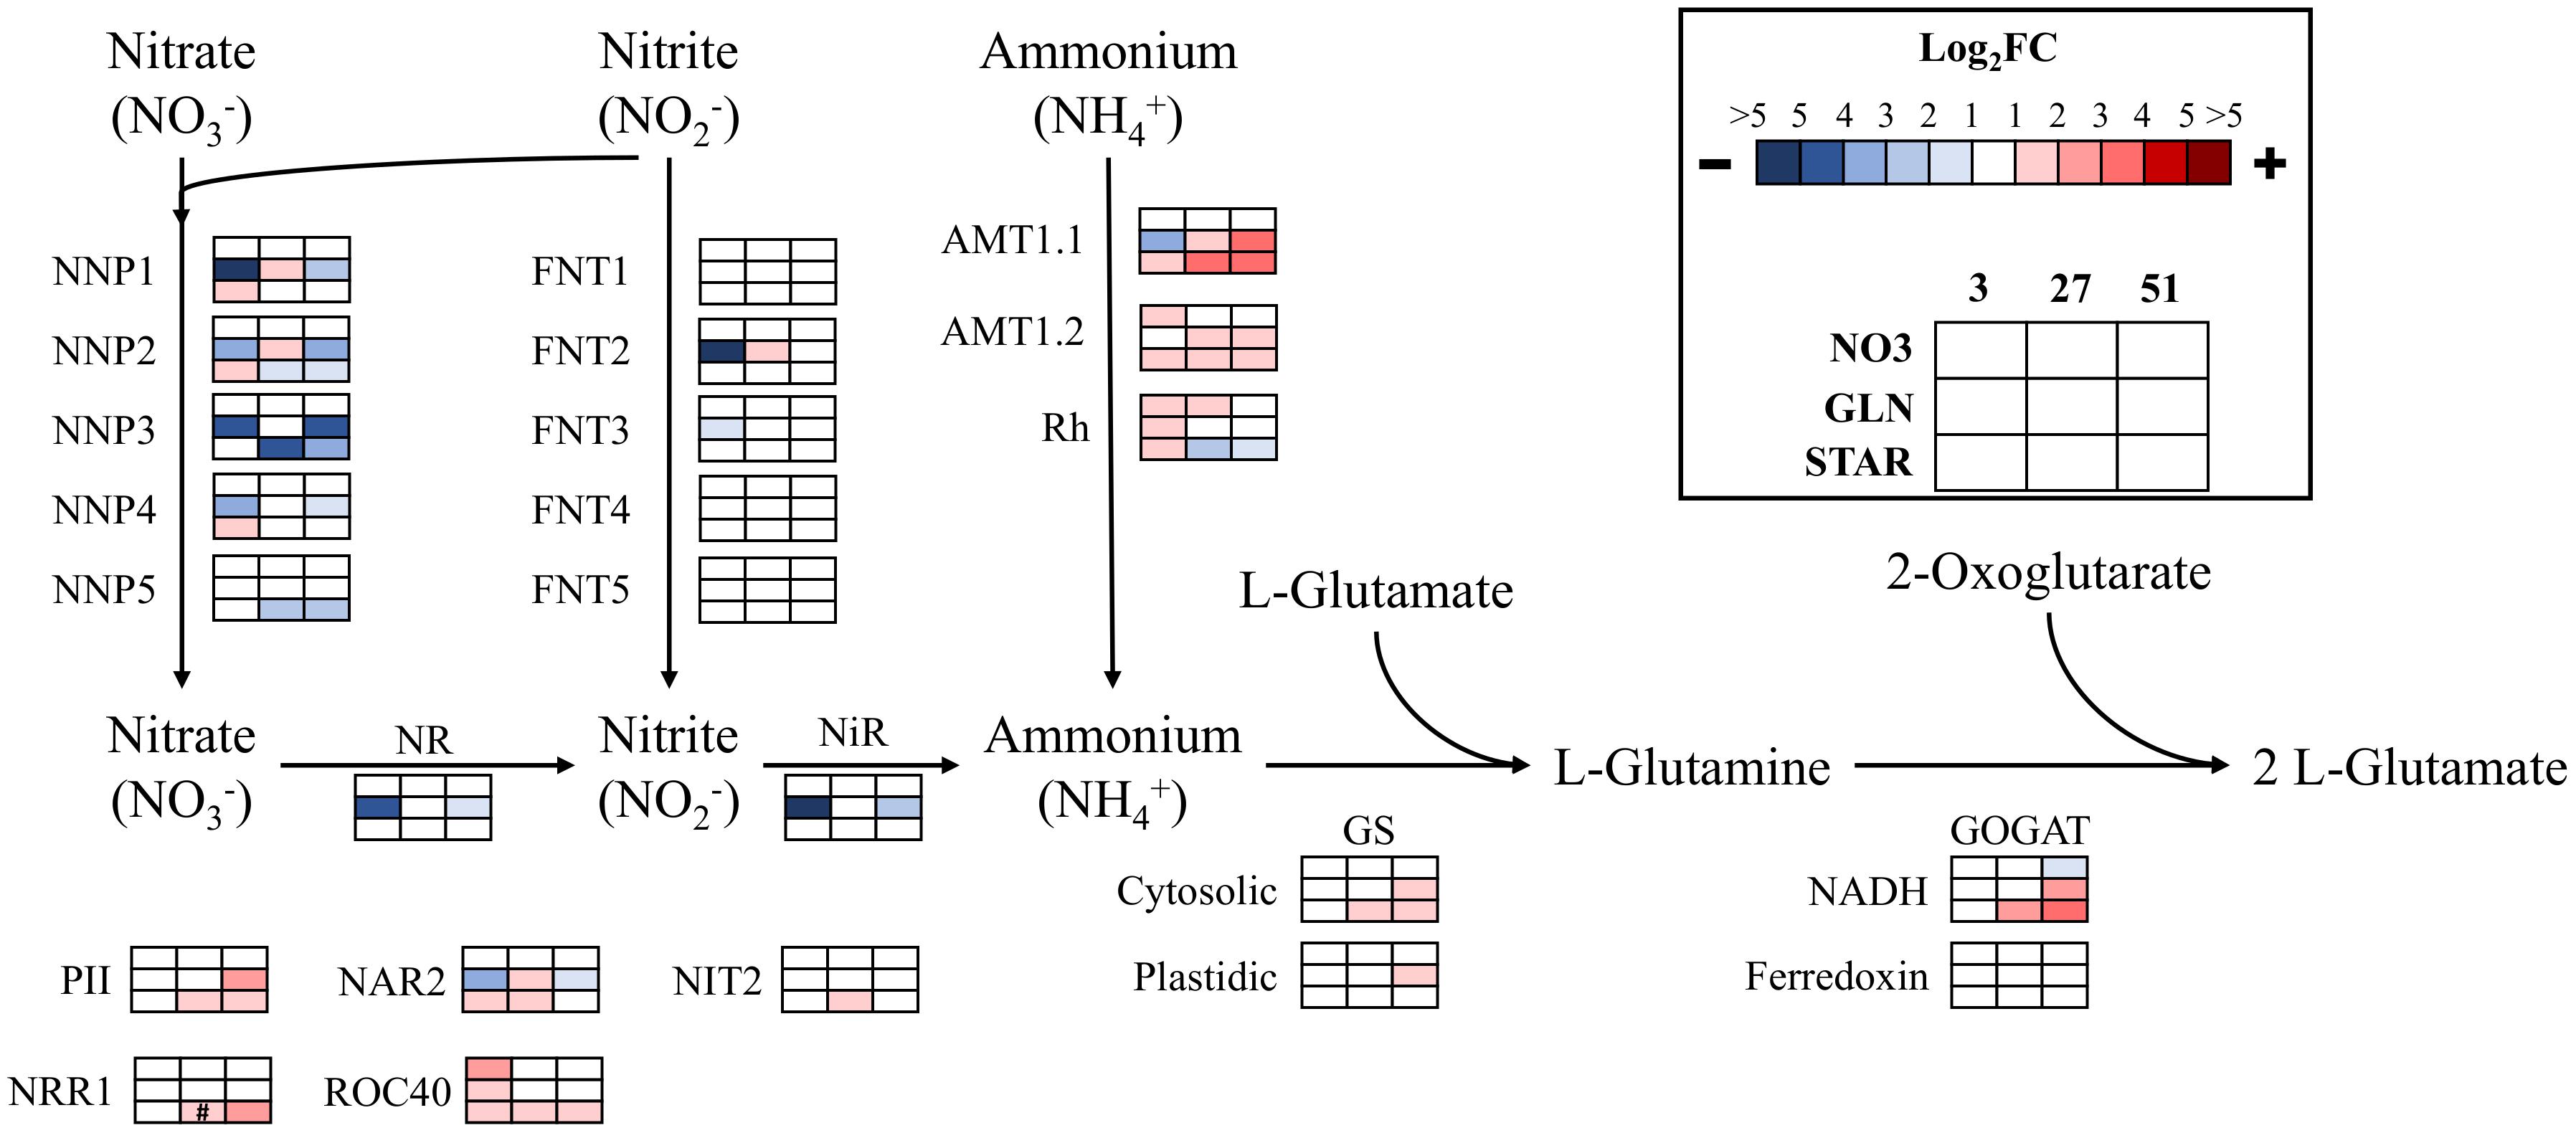
FIGURE 3. Expression of nitrogen assimilation genes over time. The log2 fold change values are presented as each value over the inoculum culture value. Comparisons are shown in each condition (NO3, GLN, and STAR) for the entire time course (3, 27, and 51 h). Blue represents downregulation in comparison to the inoculum and red is upregulation in comparison to the inoculum. Colored boxes with # symbols are not statistically significant. Expression data and transcript identities are in Supplementary Data Sheet 1. Gene abbreviations are NNP, nitrate/nitrite porter; NR, nitrate reductase; FNT, Formate/Nitrite Transporter Family; NiR, nitrite reductase; AMT, ammonium transporter; Rh, Rhesus protein; GS, glutamine synthetase; GOGAT, glutamine oxoglutarate aminotransferase; PII, Nitrogen regulatory protein PII; NAR2, nitrate assimilation related 2; NIT2, transcription factor NIT2; NRR1, nitrogen response regulator 1; ROC40, MYB-related transcription factor.
The GLN condition which represents glutamine-derived NH4+ or potentially glutamine resulted in downregulation of several NNPs, formate/nitrite transporter (FNT) 2, nitrate reductase, nitrite reductase, NAR2, and AMT1.1 at 3 h (Figure 3). The only gene upregulated was ROC40. In GLN at 27 h, most of the transcriptional repression was released, and several genes returned up to INOC levels or were upregulated above INOC. ROC40 was downregulated back to the inoculum level which was maintained through 51 h. For genes upregulated at 27 h, most were downregulated at 51 h, which represented a return to expression levels that were similar to their levels at 3 h. However, AMT1.1 was upregulated at 51 h along with other NH4+ metabolism genes (Figure 3).
Fatty Acid and Triacylglycerol Synthesis Gene Expression in Nitrogen Starvation
Since nitrogen starvation is a known inducer of lipid accumulation in algae, transcriptional regulation of TAG synthesis genes was analyzed for DE at all time points in STAR vs. NO3 samples. Genes for fatty acid synthesis were downregulated over time or remained unchanged in STAR cultures with malonyl-CoA ACP transacylase and ketoacyl-ACP synthase III being the most downregulated at 51 h (Figure 4). Genes involved in TAG metabolism showed a mixed response with 4 downregulated genes and 7 upregulated genes at 51 h (Figure 5). The fatty acid desaturase genes FAD6-2 and FAD7, as well as UDP-sulfoquinovose synthase and glycerol-3-P acyltransferase were reduced to half their transcript abundance. The upregulated genes encode digalactosyldiacylglycerol synthase, major lipid droplet protein, phosphatidate phosphatase, diacylglycerol kinase, and three lipases. The phosphatidate phosphatase gene PAP2 shows a large increase in transcript abundance at 27 h of about 180-fold and at 51 h of 128-fold (Figure 5), and is the most DE gene in the fatty acid/TAG metabolism pathway although its overall expression is low.
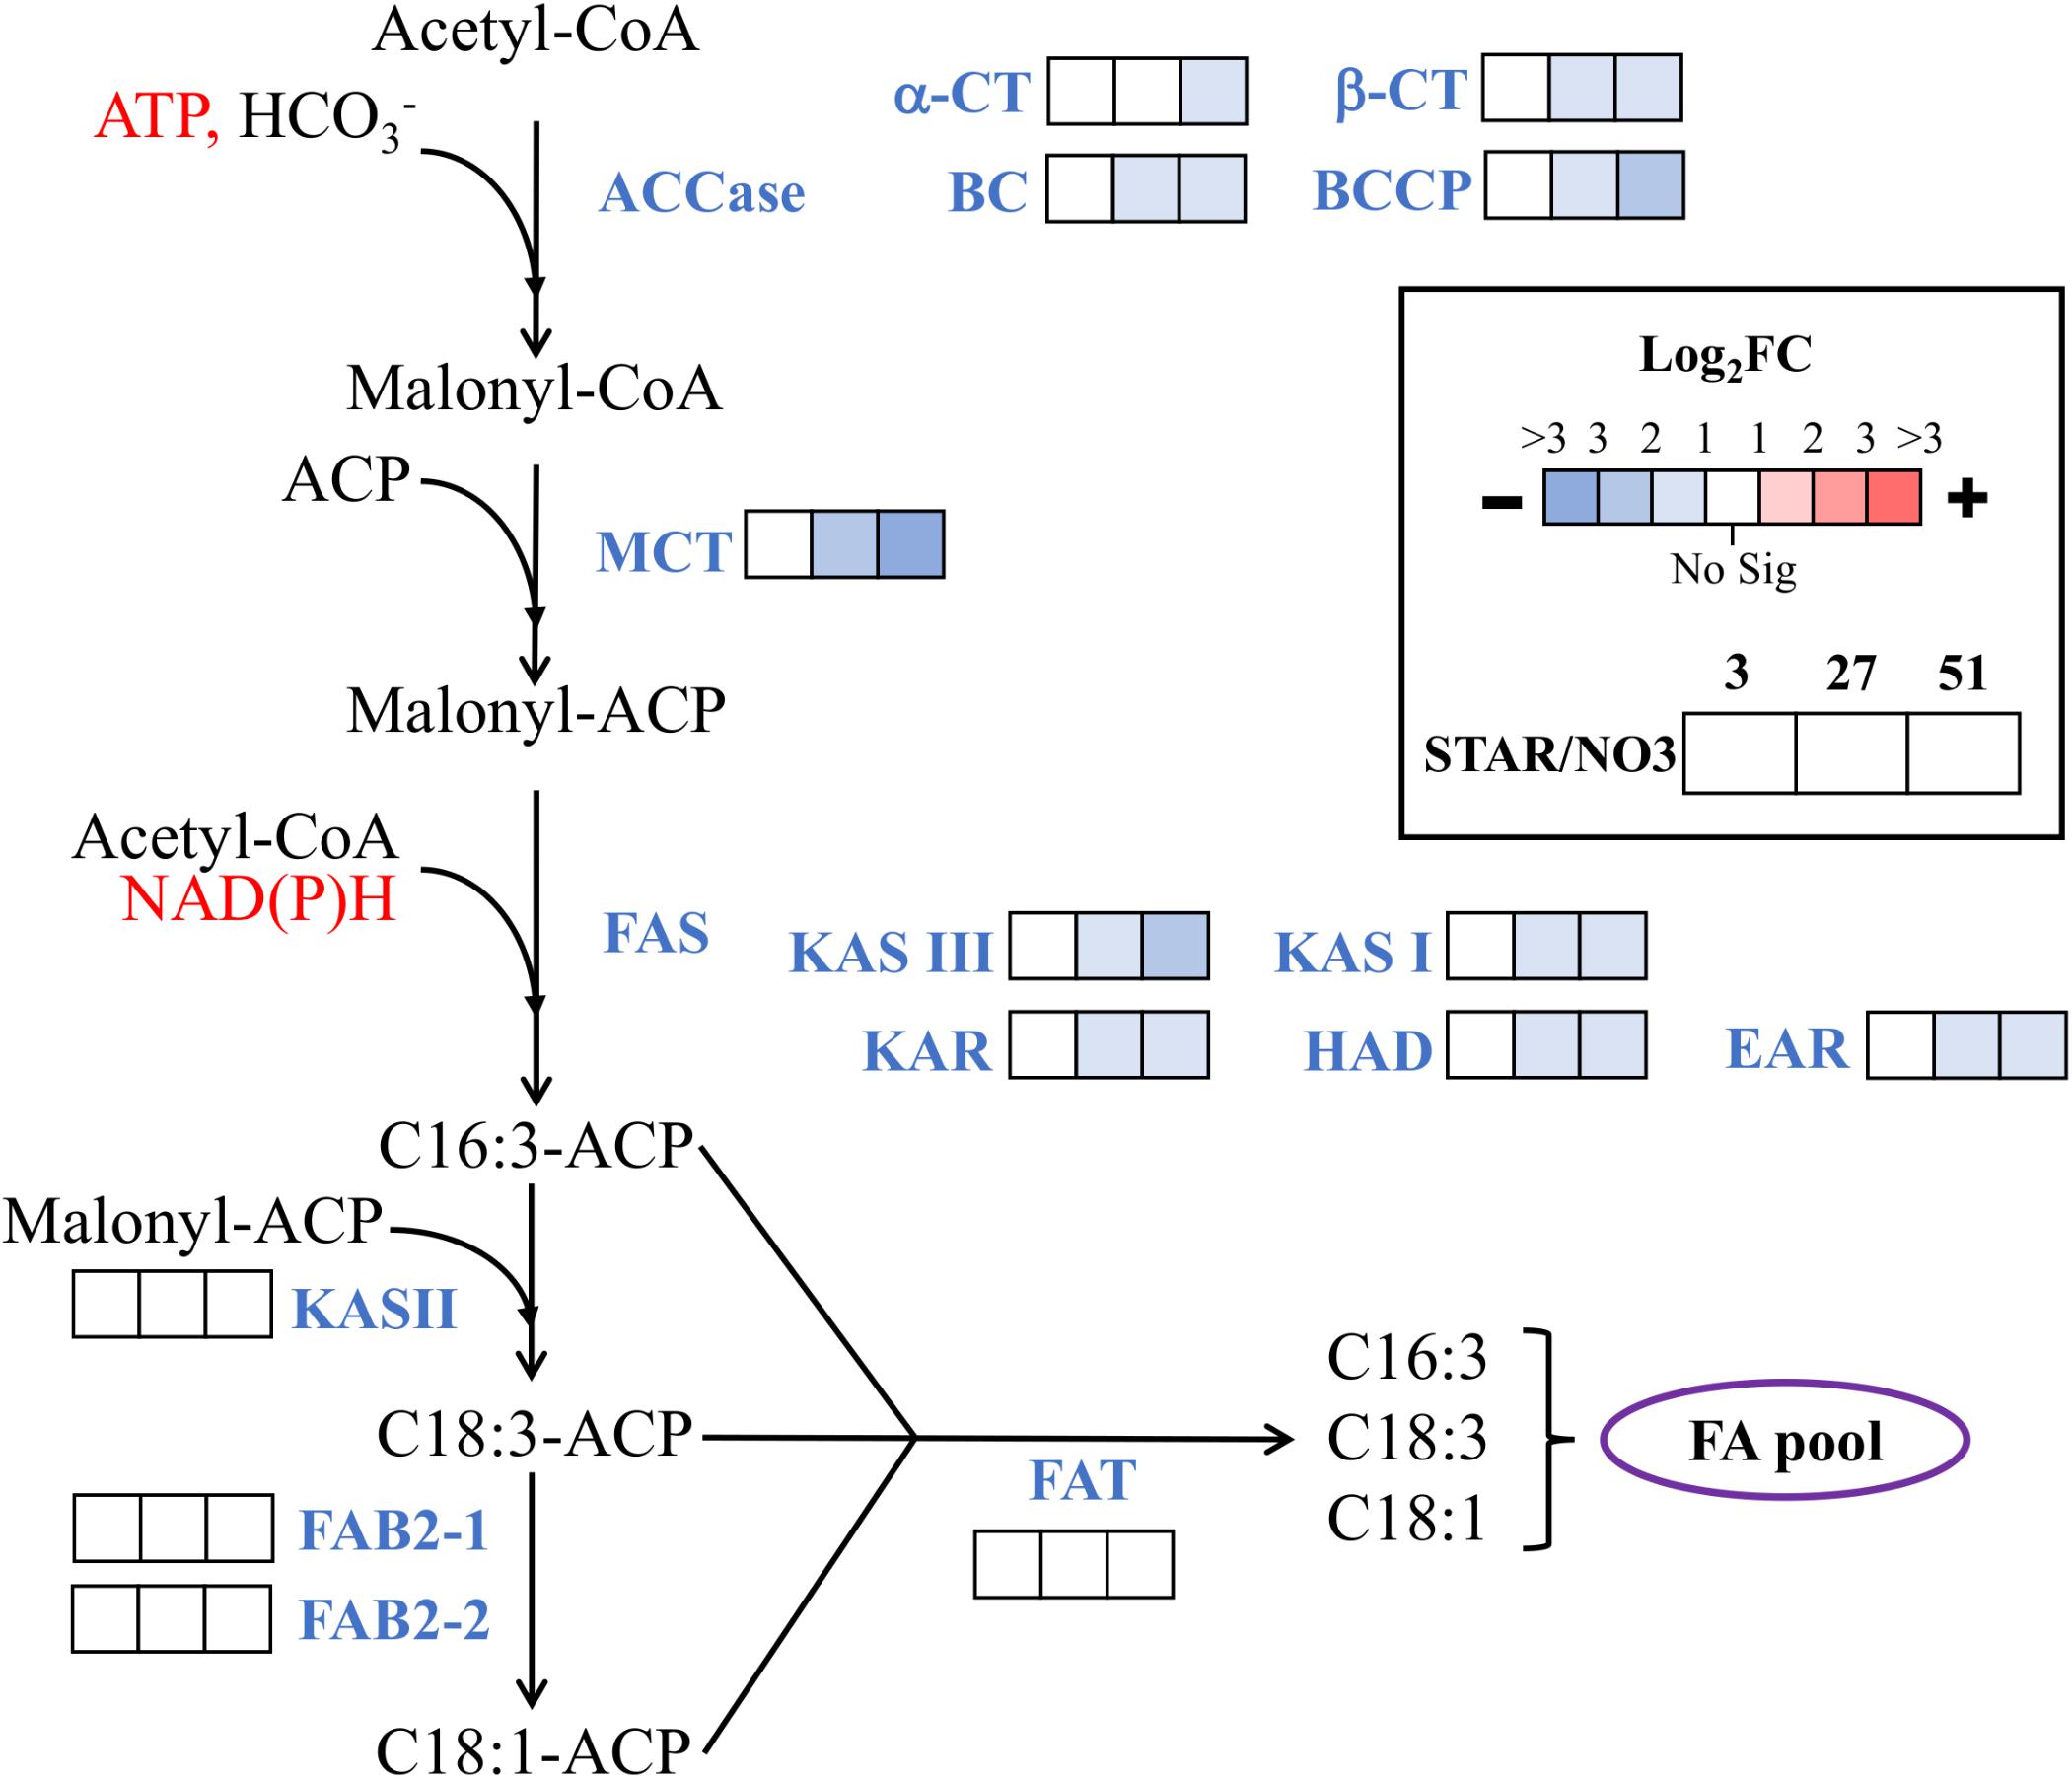
FIGURE 4. Expression of fatty acid synthesis genes during nitrogen starvation. The log2 fold change values are presented as STAR over NO3 for the 3, 27, and 51 h time points (left to right). Blue represents downregulation in comparison to NO3 and red is upregulation in comparison to NO3. White represents no significant differential expression. Fatty acids are labeled by the number of carbons:number of unsaturated bonds. Expression data and transcript identities are in Supplementary Data Sheet 1. Abbreviations are as follows: CoA, coenzyme A; ACP, acyl carrier protein; ACCase, acetyl-CoA carboxylase; α-CT, α-carboxyltransferase subunit; β-CT, β-carboxyltransferase subunit; BC, biotin carboxylase subunit; BCCP, biotin carboxyl carrier protein subunit; MCT, malonyl-CoA ACP transacylase; FAS, fatty acid synthase; KAS, ketoacyl-ACP synthase; KAR, ketoacyl-ACP reductase; HAD, hydroxyacyl-ACP dehydrase, EAR, enoyl-ACP reductase; FAB2, stearoyl-ACP-Δ9-desaturase; FAT, acyl-ACP thioesterase. Modified from Srirangan et al. (2015).
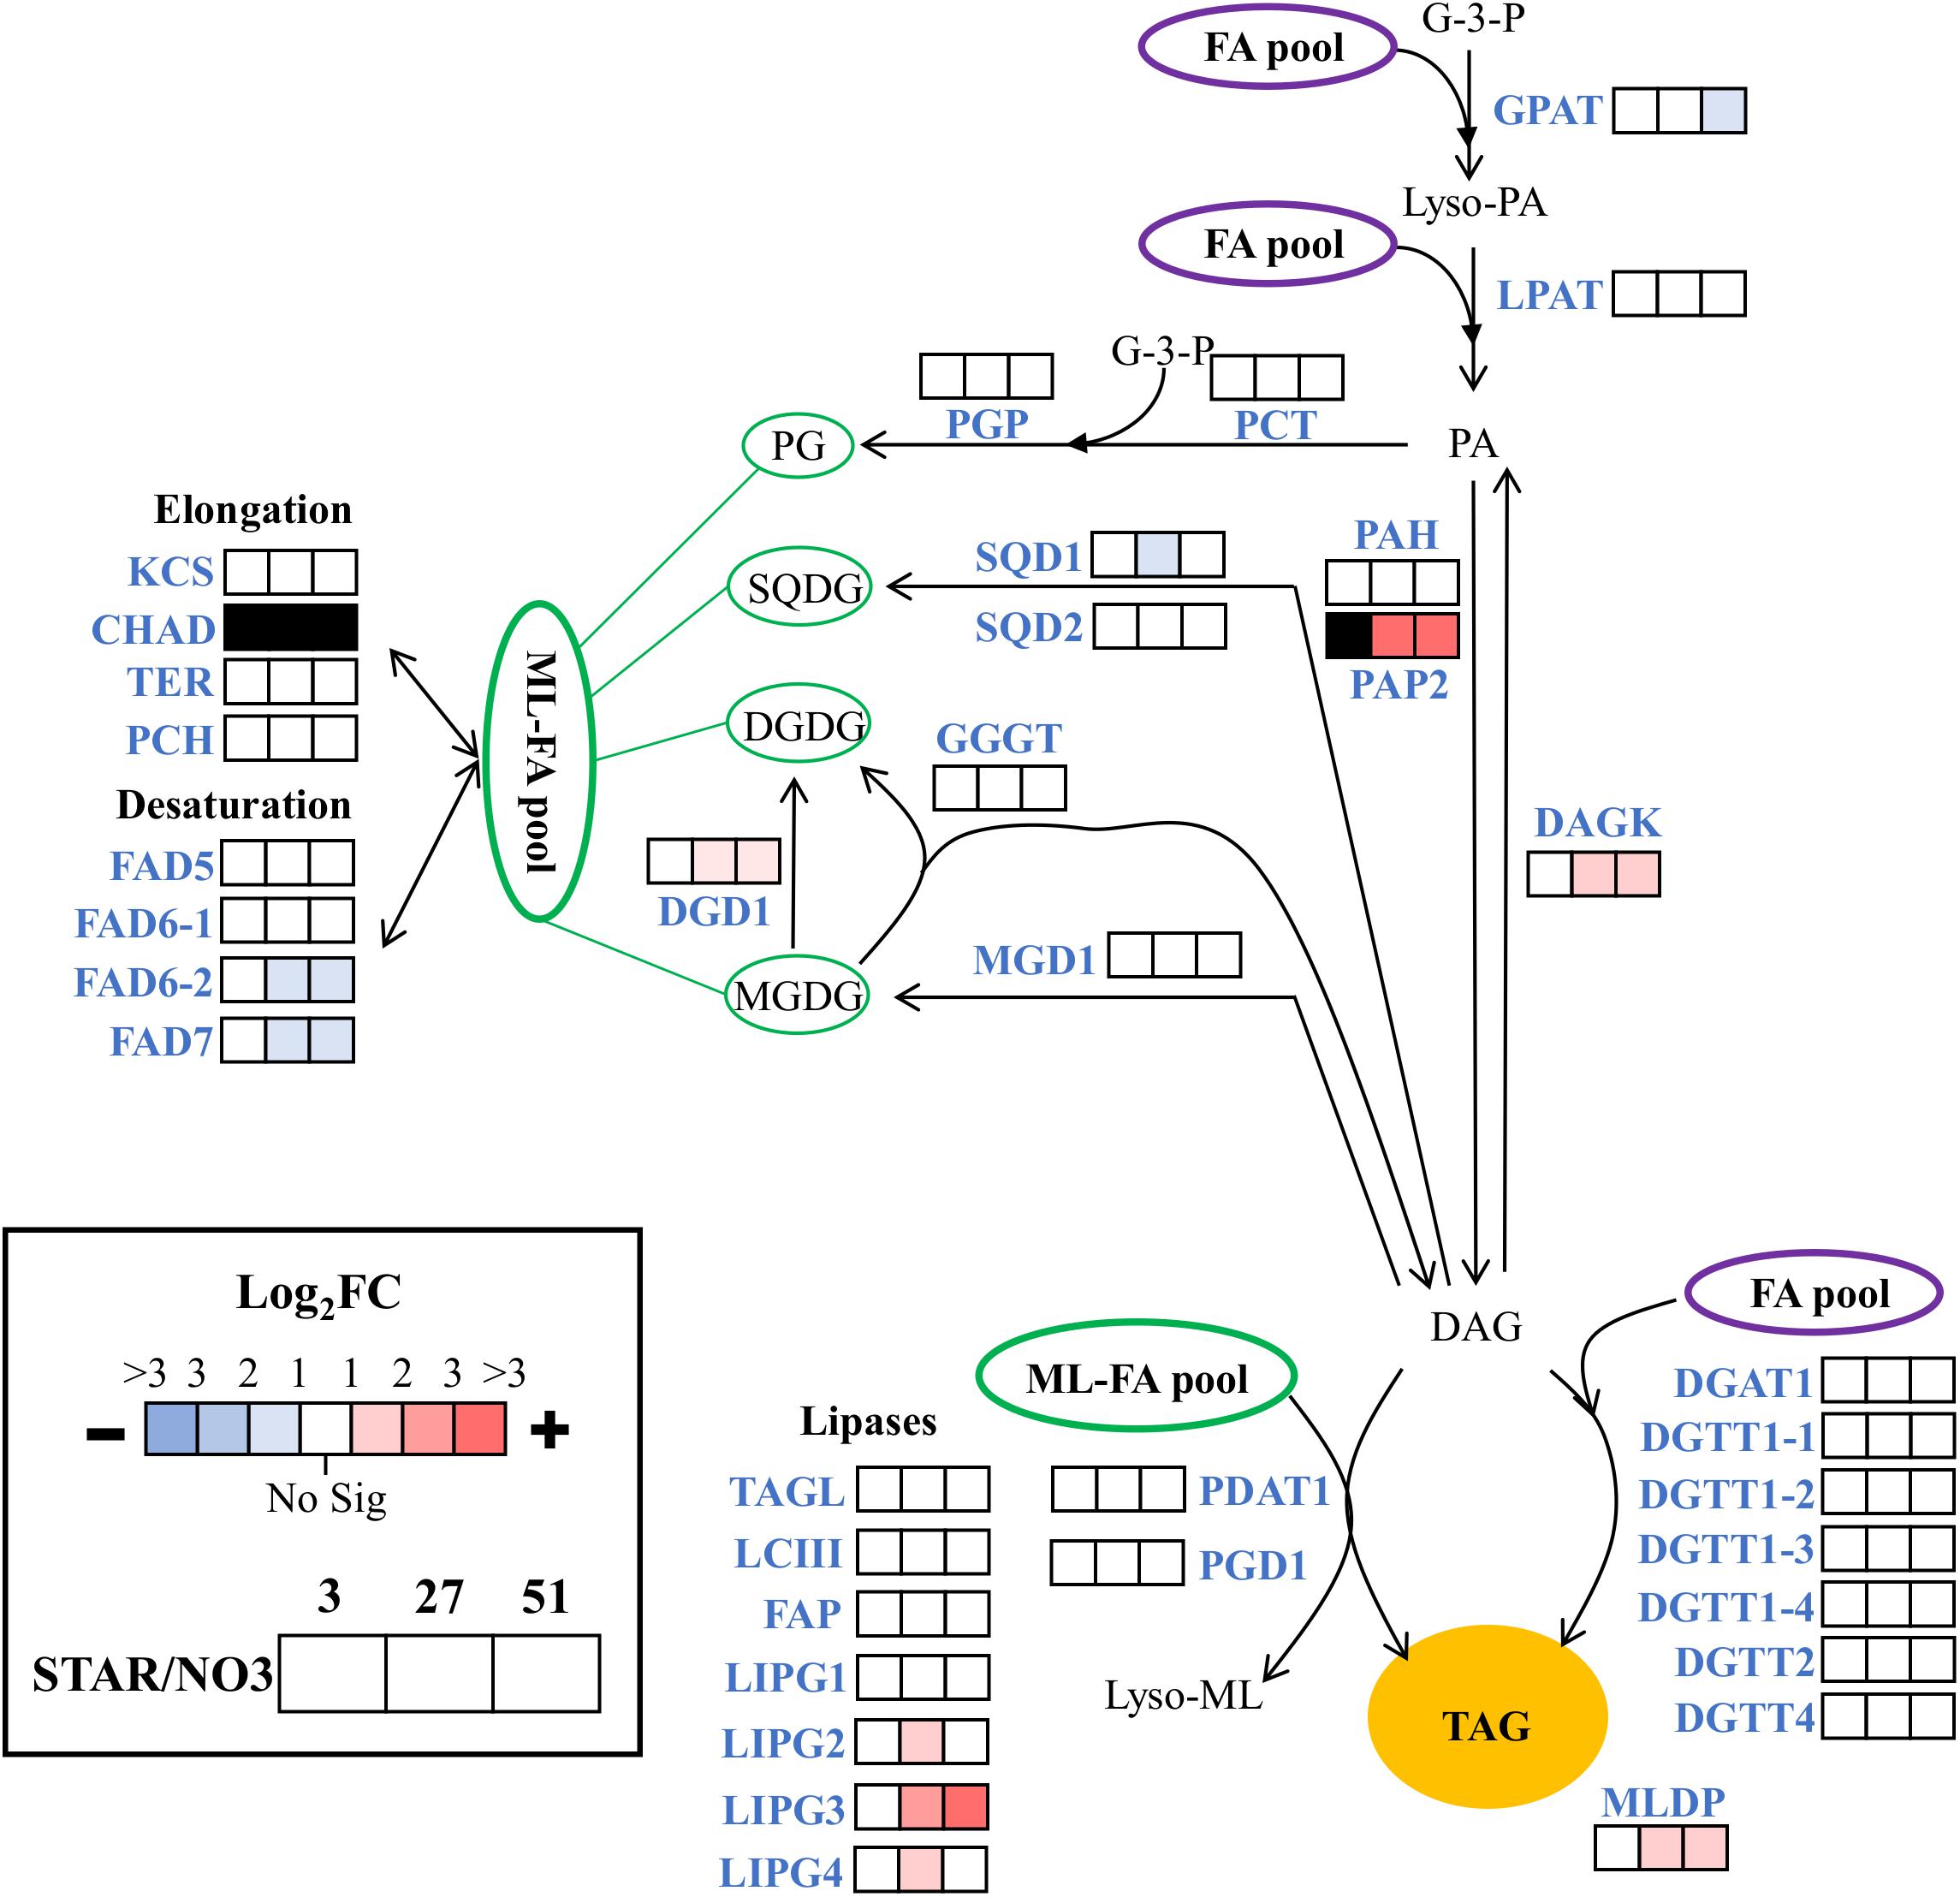
FIGURE 5. Expression of triacylglycerol metabolism genes during nitrogen starvation. The log2 fold change values are presented as STAR over NO3 for the 3, 27, and 51 h time points (left to right). Blue represents downregulation in comparison to NO3 and red is upregulation in comparison to NO3. White represents no significant differential expression. Black represents transcripts that lack sufficient raw reads to be trustworthy. Expression data and transcript identities are in Supplementary Data Sheet 1. Compounds include: PL, polar lipid; G-3-P, glycerol-3-phosphate; Lyso-PA, lyso-phosphatidic acid; PA, phosphatidic acid; PG, phosphatidylglycerol, SQDG, sulfoquinovosyldiacylglycerol; MGDG, monogalactosyldiacylglycerol; DGDG, digalactosyldiacylglycerol; DAG, diacylglycerol; TAG, triacylglycerol. Enzymes include: GPAT, glycerol-3-P acyltransferase; LPAT, lysophosphatidic, acid acyltransferase; PAP2, and PAH, phosphatidate phosphatase; DAGK, diacylglycerol kinase; DGAT and DGTT, diacylglycerol acyltransferase; PCT, CDP-diacylglycerol synthase; PGP, phosphatidylglycerolphosphate synthase; SQD1, UDP-sulfoquinovose synthase; SGD2, sulfolipid synthase; MGD1, monogalactosyldiacylglycerol synthase; DGD1, digalactosyldiacyglycerol synthase; PGD1, plastid galactoglycerolipid degradation 1; GGGT, galactolipid:galactolipid galactosyltransferase; PDAT1, phospholipid:diacylglycerol acyltransferase; MLDP, major lipid droplet protein; KCS, β-ketoacyl-CoA synthase; CHAD, 3-hydroxyacyl-CoA dehydrogenase; TER, Trans-2-enoyl-CoA reductase; PCH, Palmitoyl-CoA hydrolase; FAD5, MGDG specific palmitate Δ-7 desaturase; FAD6, ω-6 fatty acid desaturase; FAD7, ω-3 fatty acid desaturase; TAGL, triacylglycerol lipase; LCIII, class 3 lipase, FAP, class 3 lipase, LIPG, lipase. Modified from Srirangan et al. (2015).
Central Carbon Metabolism Shows High Transcriptional Activity Around Pyruvate
The regulation of carbon metabolism under nitrogen starvation is a salient consequence of a changing nitrogen environment. Therefore DE at the 51 h time point was compared between STAR and NO3 treatments. Expression levels between 27 and 51 h were nearly identical, so the 51 h time point was analyzed (Supplementary Data Sheet 1). The Calvin-Benson cycle shows mixed regulation with 9 genes being significantly DE. Ribose 5-phosphate isomerase 1, aldolase 1, and glyceraldehyde 3-phosphate dehydrogenase 1 are the most highly DE genes of the Calvin-Benson cycle with Log2FC values of, respectively, −2.4, 3.1, and 4.8 (0.2−, 8.6−, and 28-fold) changes in STAR over NO3 (Figure 6).
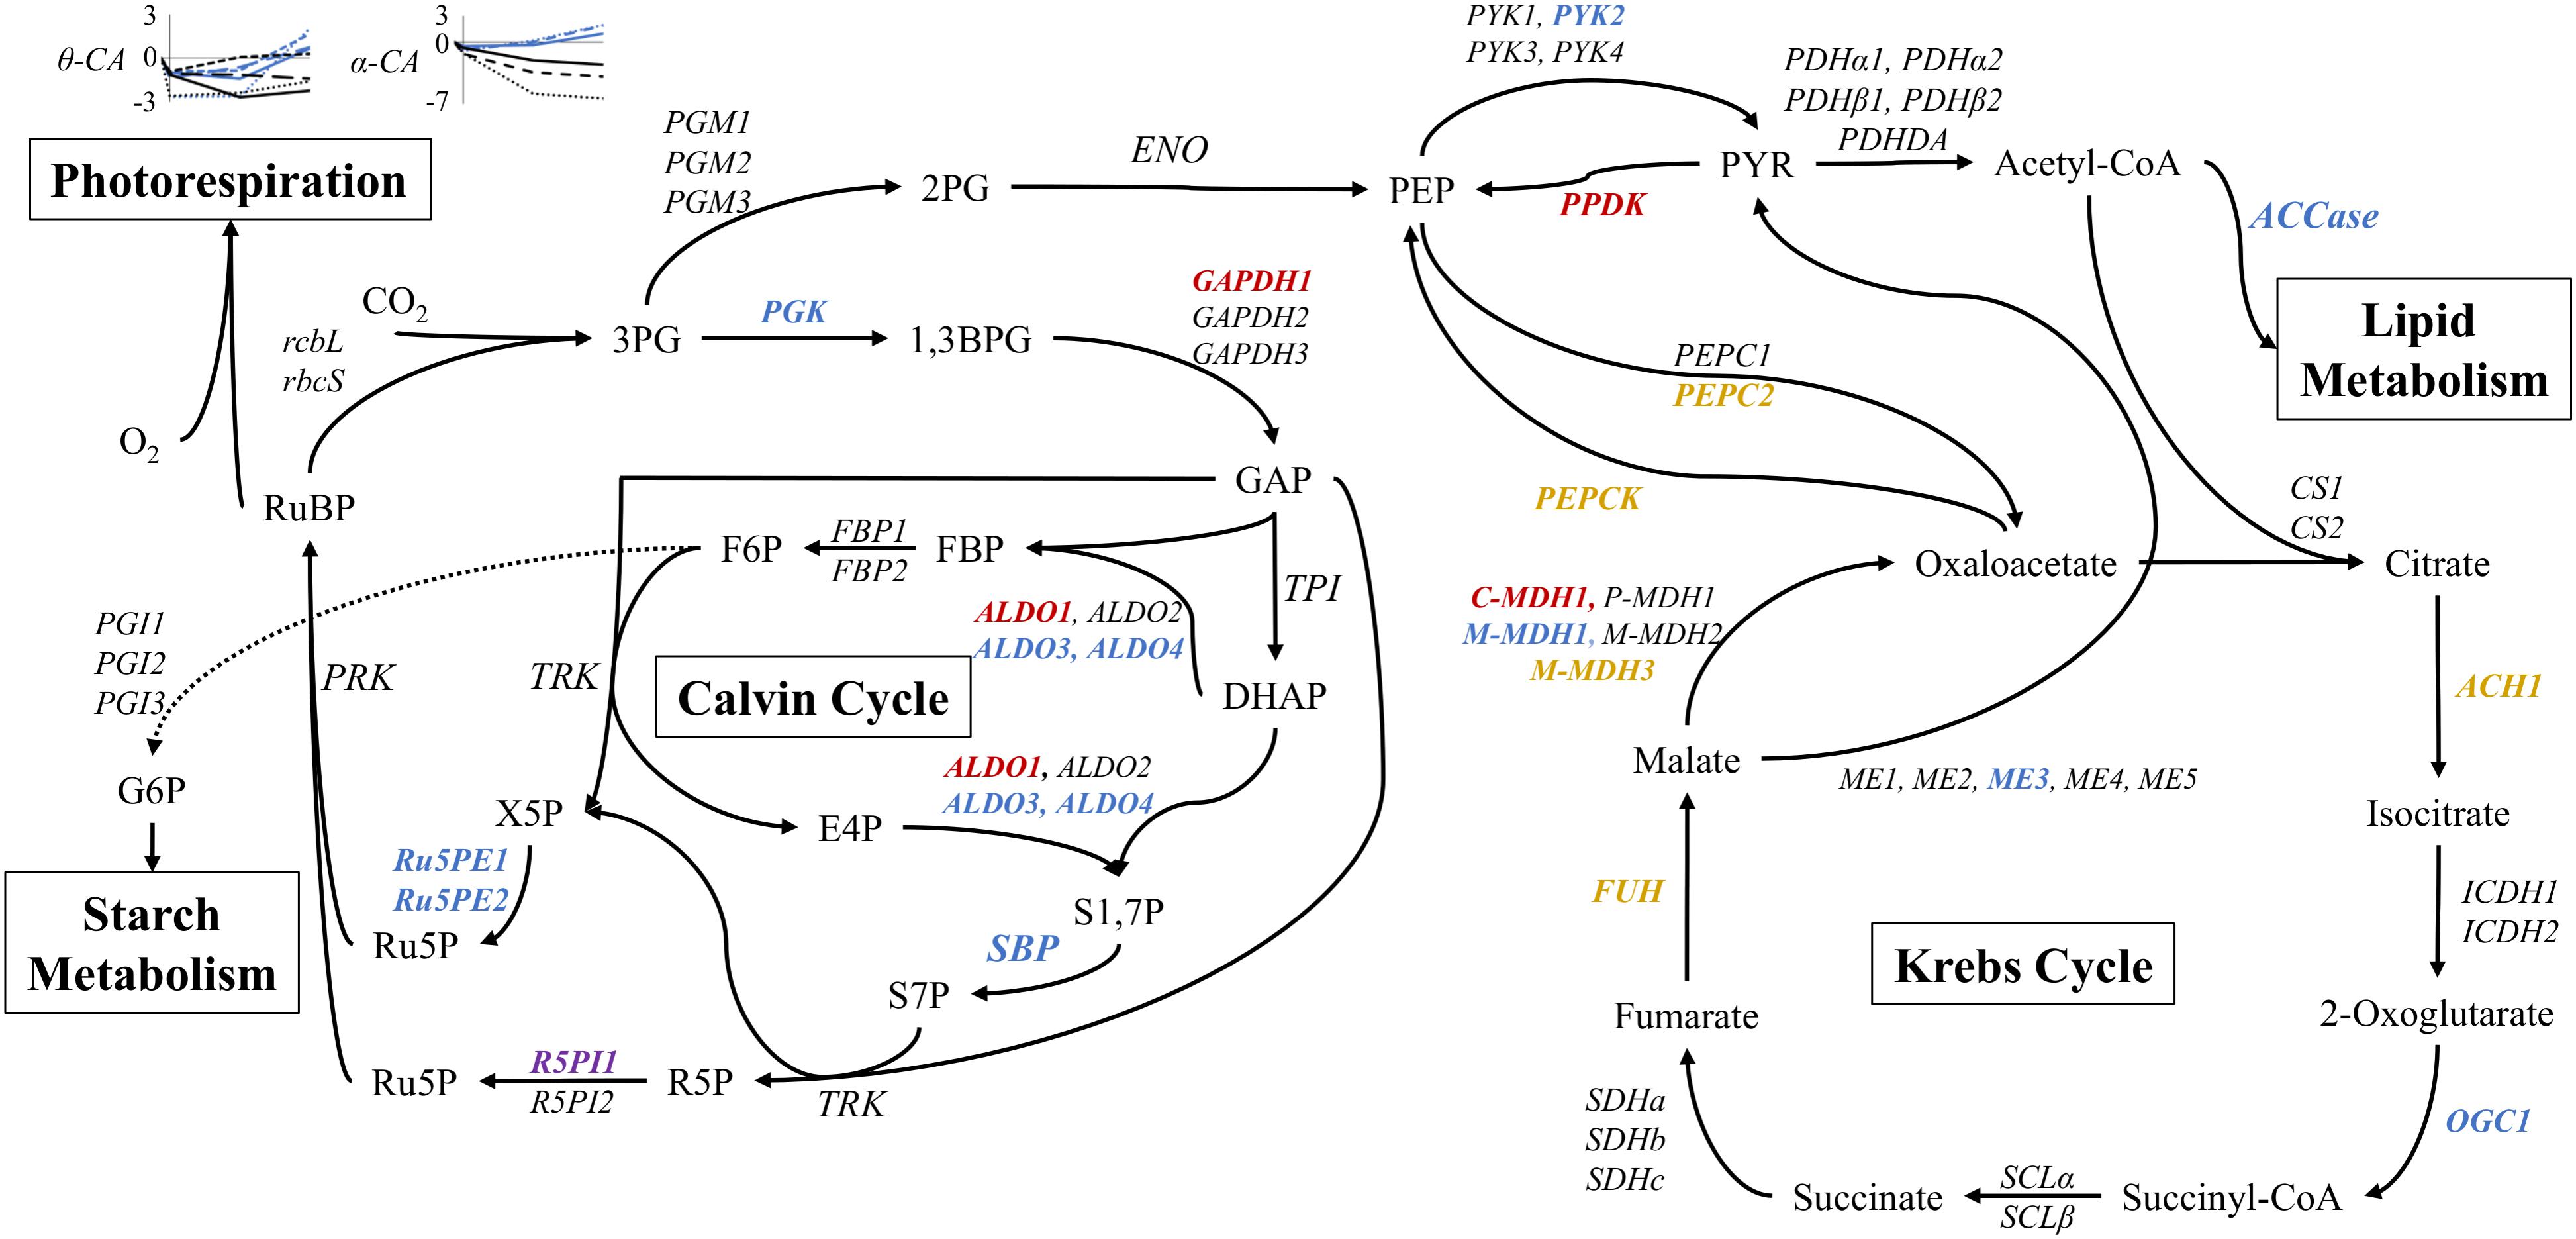
FIGURE 6. Expression of core carbon metabolism genes under nitrogen starvation at 51 h. Metabolites are displayed between pathway arrows. Enzymes are italicized and colored according to the log2FC value of STAR over NO3 at 51 h. Red represents log2FC of greater than 2, orange is 1 to 2, black is no significant change, blue is –1 to –2, and purple is less than –2. Expression of θ and α carbonic anhydrase (CA) genes are shown over time in the nitrogen starvation (black) and nitrate (blue) conditions. Each line pattern represents a different CA gene. All points are represented as log2FC values in comparison to the inoculum culture. Expression data and transcript identities are in Supplementary Data Sheet 1. Metabolite abbreviations are as follows: 3PG, 3-phosphoglycerate; 1,3BPG, 1,3-bisphosphoglycerate; GAP, glyceraldehyde 3-phosphate; DHAP, dihydroxyacetone phosphate; FBP, fructose 1,6-bisphosphate; F6P, fructose 6-phosphate; E4P, erythrose 4-phosphate; S1,7P, sedoheptulose 1,7-bisphosphate; S7P, sedoheptulose 7-phosphate; X5P, xylulose 5-phosphate; R5P, ribose 5-phosphate; Ru5P, ribulose 5-phosphate; RuBP, ribulose 1,5-bisphosphate; G6P, glucose 6-phosphate; 2PG, 2-phosphoglycerate; PEP, phosphoenolpyruvate; PYR, pyruvate. Enzyme abbreviations are as follows: rbcL, RuBisCO large subunit; rbcS, RuBisCO small subunit; PGK, phosphoglycerate kinase; GAPDH, glyceraldehyde 3-phosphate dehydrogenase; TPI, triose phosphate isomerase; ALDO, aldolase; FBP, fructose 1,6-bisphosphatase; SBP, sedoheptulose 1,7-bisphosphatase; TRK, transketolase; R5PI, ribose 5-phosphate isomerase; Ru5PE, ribulose 5-phosphate 3-epimerase; PRK, phosphoribulokinase; PGI, phosphoglucose isomerase; PGK, phosphoglycerate mutase; ENO, enolase; PYK, pyruvate kinase; PPDK, pyruvate dikinase; PDHα/β, pyruvate dehydrogenase; PDHDA, pyruvate dehydrogenase complex dihydrolipoamide acetyltransferase; ACCase, acetyl-CoA carboxylase; PEPC, phosphoenolpyruvate carboxylase; PEPCK, phosphoenolpyruvate carboxykinase; CS, citrate synthase; ACH, aconitate hydratase; ICDH, isocitrate dehydrogenase; OGC, 2-oxoglutarate dehydrogenase; SCL, succinyl-CoA ligase; SDH, succinate dehydrogenase; FUH, fumarate hydratase; MDH, malate dehydrogenase, cytosolic (C), plastidic (P), mitochondrial (M); ME, malic enzyme.
Regarding the Krebs cycle, most DE genes encoded enzymes involved in phosphoenolpyruvate (PEP), pyruvate, and oxaloacetate conversion (Figure 6). Downregulation of pyruvate kinase 2, mitochondrial malate dehydrogenase 1, and malic enzyme 3 was observed, although other isoforms of the same genes showed no change. More total genes were upregulated with pyruvate phosphate dikinase, PEP carboxylase, PEP carboxykinase, and mitochondrial and cytosolic malate dehydrogenase (M-MDH3, and C-MDH1) showing increases in transcription (Figure 6).
Lipid and starch metabolism branch off the Calvin and Krebs Cycles. The entry point for lipid metabolism, ACCase, shows downregulation in STAR (Figures 4, 6). Both starch synthesis and degradation are upregulated in STAR with the synthesis enzymes, starch synthase, and starch branching enzyme being more highly upregulated than the degradation enzymes α-amylase and starch phosphorylase (Supplementary Data Sheet 1).
Carbonic anhydrase (CA) transcription was also examined over time in comparison to INOC in both NO3 and STAR. Universally α-CAs and θ-CAs are downregulated between inoculation to the 3 h time point (Figure 6). For α-CAs, downregulation continued under STAR while in NO3 the α-CAs were upregulated at 27 and 51 h. The largest changes were observed for α-CA1 at 51 h which reached a Log2FC of −6.4 (0.01-fold) in STAR, and a Log2FC of 1.9 (3.7-fold) in NO3. The θ-CAs showed different patterns of expression, but in general by 51 h, expression of θ-CAs was higher in NO3 than STAR cultures (Figure 6).
Transcriptional Shift by Glutamine at 51 h
From 27 to 51 h, the number of DE genes between GLN and NO3 increased from 20 to 694 genes (Table 1). At this junction metabolic shifts were observed, warranting a closer look at patterns of expression of the 694 genes to discover what might be causing these shifts. 350 genes changed in response to GLN, whereas only 34 changed for NO3 (Table 1). Of the 34 DE NO3 genes, 23 were upregulated in NO3 and did not change in GLN. These genes consisted of heavy metal transporters and chaperones as well as carbonic anhydrases (CAs). 11 of the 34 genes were DE in both NO3 and GLN and regardless of expression pattern, all 11 genes had lower expression in GLN than NO3. Of the 339 genes that were only DE in GLN, 113 were downregulated and 226 were upregulated. The downregulated genes consisted of some nitrogen assimilation genes, protein synthesis and degradation, stress tolerance genes, porphyrin adjacent proteins, and lipid transport. The upregulated genes consisted of nitrogen assimilation genes, arginine biosynthesis, glycolysis, and protein degradation (Table 1).
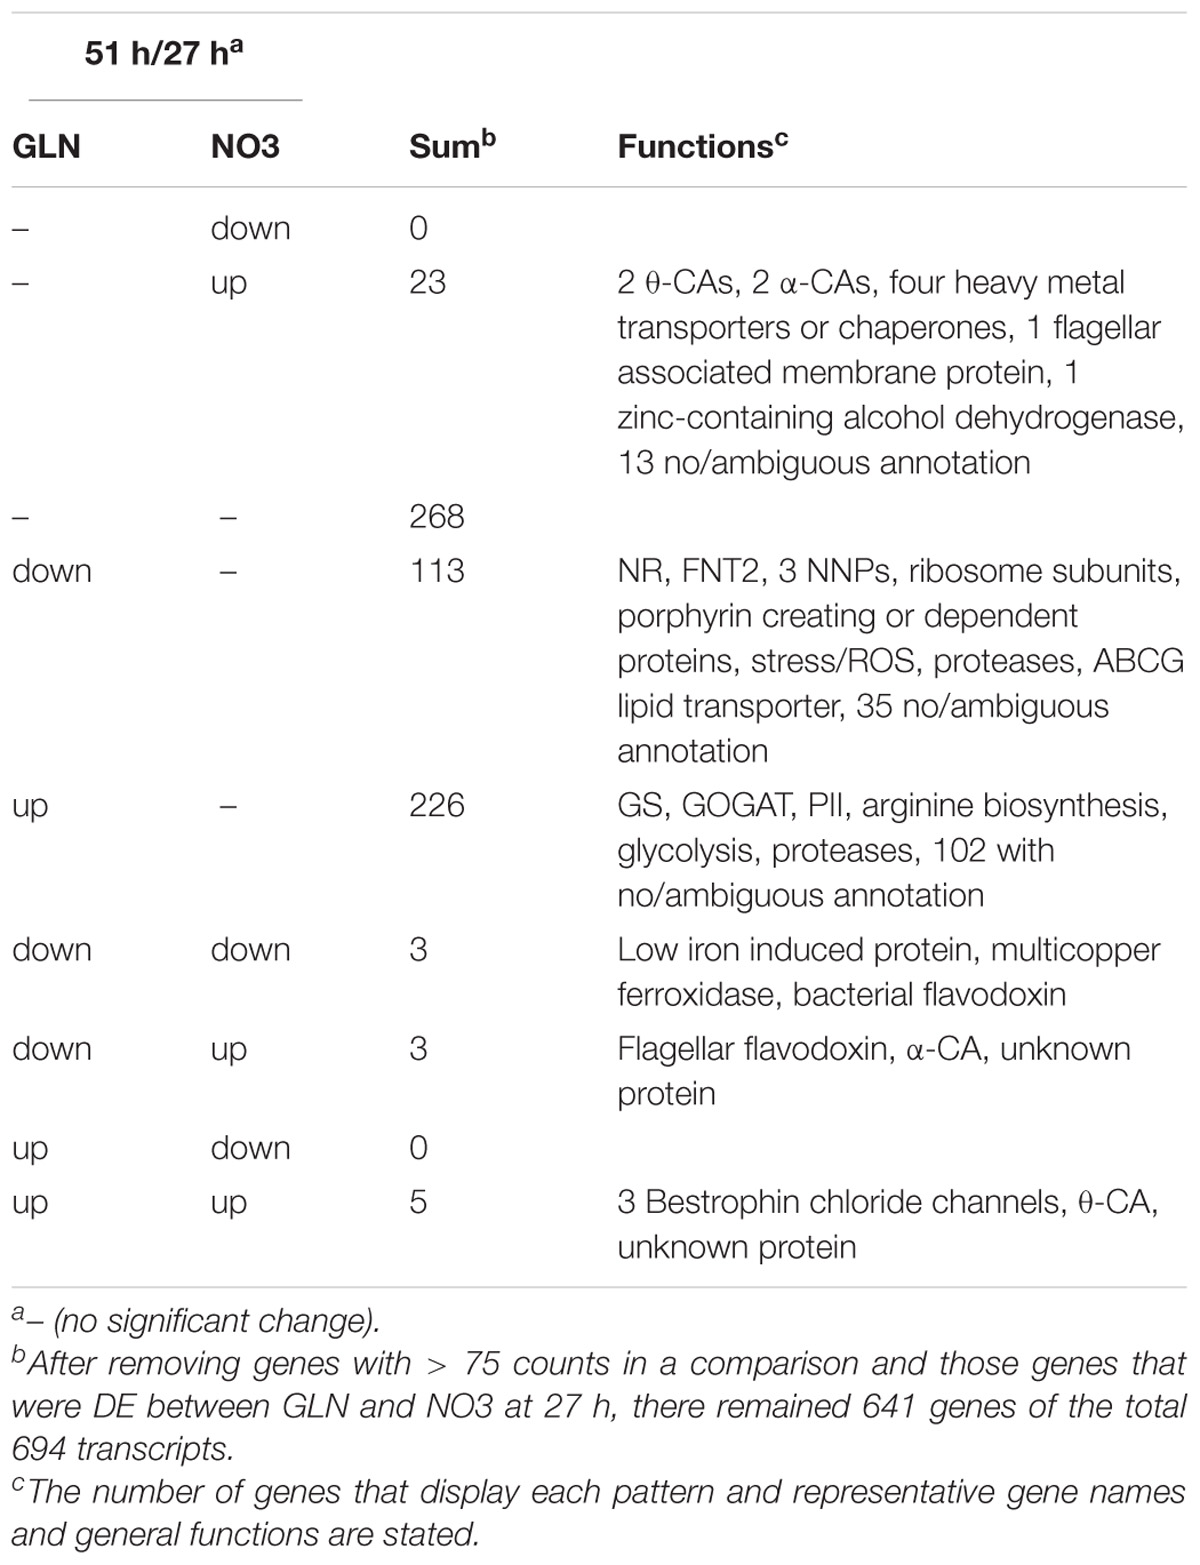
TABLE 1. Transcription patterns for differentially expressed genes in GLN and NO3.
Discussion
Transcriptional responses to nitrogen starvation are well described in several species of algae, but transcriptional responses to different nitrogen sources has not been previously investigated. This study was therefore intended to elucidate transcriptional changes associated with contrasting metabolic phenotypes observed between glutamine-grown and nitrate-grown Dunaliella. GLN is not directly taken up by Dunaliella, but decays into pyroglutamate and ammonium, the latter of which is likely transported across the cell membrane and assimilated (Murphree et al., 2017). GLN is therefore used here as a proxy for ammonium and serves as a comparison for D. viridis growth and metabolic/transcriptional responses to nitrate. Although GLN was intended solely as a proxy for ammonium, a potential exists for cells to react to GLN or pyroglutamate, although there is no evidence presented here that suggests that this is the case.
Glutamine Represents Starvation, Not Metabolic Differences Due to NH4+
A pattern emerged from the metabolic data: at 3 h all treatments were the same, at 27 h GLN and NO3 were equal and separate from STAR, and at 51 h NO3 and STAR maintained separation, but GLN shifted from the equal of NO3 toward the STAR condition. This was reflected in the cell diameter, pH, chlorophyll, protein, and carbohydrate data. Cell density and neutral lipid data maintained the separation of the 27 h time point. Similar results were demonstrated previously at 144 h after inoculation in D. viridis (Murphree et al., 2017). While much of the metabolic data showed a starvation response at 51 h for GLN, the equal cell density between GLN and NO3 suggested that NH4+ (GLN) grown cells had altered metabolism.
NH4+ has been shown to alter the metabolism of D. salina (Giordano and Bowes, 1997) and the transcriptional data at first suggested that this was true for D. viridis. However, over time the transcriptome profiles of GLN-grown cultures resembled less the patterns of the NO3-grown cultures and more like the STAR cultures (Figure 2). For example, the down regulation of the photosynthetic apparatus and chlorophyll biosynthesis is a hallmark of nitrogen deficiency (Schmollinger et al., 2014; Park et al., 2015; Tan et al., 2016) and is represented in the STAR and GLN conditions but not in NO3 (Table 1). This is seen in the metabolic data with chlorophyll content and protein content decreasing in GLN in comparison to NO3 (Figures 1D,E). The upregulation of arginine biosynthesis genes in NH4+ starved C. reinhardtii (Park et al., 2015) was comparably detected in the NO3− starved (STAR) and NH4+ starved (GLN) conditions of D. viridis (Table 1 and Supplementary Data Sheet 1). Modulation of the nitrogen assimilation genes accented the presence of NH4+ in the media as downregulation of genes at 3 h, release of the repression by 27 h, and a small downregulation at 51 h was observed (Figure 3). Repression of nitrogen assimilation genes in the presence of NH4+ is observable from cultures of C. reinhardtii (Camargo et al., 2007; Giordano and Raven, 2014; Sanz-Luque et al., 2015) and the modulation of these genes in D. viridis suggests that most or all NH4+ released from GLN was likely consumed by the cells by 27 h. This hypothesis is supported by the observation that GLN and STAR conditions had comparable transcriptional and metabolic phenotypes at 51 h. The evidence suggests that the release of NH4+ from GLN was too slow to maintain growth for 51 h and that the metabolic effects seen in the GLN condition are the consequence of nitrogen starvation rather than NH4+, the presence of residual GLN, or pyroglutamate.
Dunaliella viridis Responds Strongly to the Presence of Glutamine-Derived NH4+
Some of the most transcriptionally active sets of genes under these variable nitrogen conditions are involved in nitrogen assimilation. Modulation of nitrogen assimilation genes by NH4+ and nitrogen starvation is a well-characterized phenomenon in algae, especially in C. reinhardtii (Camargo et al., 2007; Giordano and Raven, 2014; Sanz-Luque et al., 2015). However, the transcriptional regulation of the nitrogen assimilation genes in Dunaliella spp. is little described except for qPCR data (Li et al., 2007; Song et al., 2011). As a nitrogen source, NH4+ requires less energy than NO3− to stably incorporate into a carbon scaffold (Arnold et al., 2015); however, NH3 is a potent electrochemical gradient uncoupler when present in cells, and in sufficiently high amounts is cytotoxic.
Dunaliella viridis responds strongly to the presence of glutamine-derived NH4+ by attenuating or increasing the expression of genes involved in NH4+ transport and assimilation. The short-term upregulation of NNPs was most likely an attempt to scavenge NO3−/NO2−, but with no additional NO3−/NO2−, they were downregulated in favor of the NH4+ uptake and metabolism genes (Schmollinger et al., 2014; Arnold et al., 2015). This is not unexpected, as NH4+ is less costly for the cells to incorporate than NO3−. It is plausible that the NIT2 transcription factor regulates these genes under nitrogen starvation as shown in C. reinhardtii (Camargo et al., 2007), although it should be noted that D. viridis NIT2 is not repressed by NH4+ like in C. reinhardtii (Camargo et al., 2007).
NH4+ released by GLN was associated with downregulation of NNPs, FNT nitrite transporters, NR, NiR, NAR2, and AMT1.1 (Figure 3). The downregulation of NO3−/NO2− assimilation genes in GLN suggests that D. viridis has a mechanism to prioritize assimilation of NH4+ over NO3−. The downregulation of AMT1.1 in the presence NH4+ potentially confounds this explanation; however, the toxicity of NH4+/NH3 may explain this response. In the presence of NH4+, D. viridis may in fact limit the uptake of NH4+ in order to minimize the cytotoxic effects of electrochemical decoupling, while allowing enough NH4+/NH3 into the cell that it can be assimilated into amino acids via the action of GS/GOGAT.
Under Nitrogen Starvation D. viridis Favors Starch Synthesis Over Lipid Synthesis
Like Dunaliella tertiolecta (Tan et al., 2016; Pick and Avidan, 2017), nitrogen starvation leads to an increase in both carbohydrate and neutral lipid content in D. viridis with a preference toward carbohydrate over lipid. It also appears that carbohydrate storage is a quicker or larger response in D. viridis since the partially starved GLN culture accumulated more carbohydrates than it did neutral lipids (Figures 1F,G). However, a time-course with higher temporal resolution would be necessary to identify the rapidity and magnitude of the metabolic shifts caused by these different treatments.
Nitrogen Starvation Regulation of Carbon Storage Is Similar to Other Green Algae
The mechanisms governing the ability of green algae species to control the partitioning of carbon storage under nitrogen starvation remain unclear (Goncalves et al., 2016b). C. reinhardtii and D. tertiolecta are the most closely related species to D. viridis for which there are salient investigations of carbon accumulation under nitrogen starvation. Comparable transcriptional patterns have been observed between these three algae, however, notable differences exist.
Accumulation of TAG in D. viridis is associated with transcriptional upregulation of the major lipid drop protein and the two transcription factors NRR1 and ROC40. This is a similar response as that of C. reinhardtii (Moellering and Benning, 2010; Boyle et al., 2012; Goncalves et al., 2016a). However, under nitrogen starvation C. reinhardtii upregulates several fatty acid synthesis genes while D. tertiolecta and D. viridis downregulate fatty acid synthesis genes (Figure 4; Yao et al., 2017). This observation leads to the erroneous prediction that less fatty acids would be synthesized and available for TAG synthesis in D. tertiolecta and D. viridis. Instead, the initial increase in TAG in Dunaliella spp. is suggested to come from recycling membrane lipids into TAG (Tan et al., 2016). Under nitrogen starvation, some algae are known to break down chloroplast membranes (Preininger et al., 2015), which are a source of fatty acids for TAG synthesis. These reactions are catalyzed by diacylglycerol acyltransferase genes (DGTT, DGAT, PDAT, and PGD) but no D. viridis homologs for these genes showed any change in expression. However, there were expression increases in putative lipase genes, which could be mobilizing fatty acids for incorporation into TAG (Boyle et al., 2012). Unfortunately, since only neutral lipid levels were measured in D. viridis, the difference between membrane recycling and de novo lipid synthesis cannot be distinguished, although it is certainly possible that both pathways occur.
Carbohydrates have been reported to be the major carbon storage compound in Dunaliella spp. (Slocombe et al., 2015; Tan et al., 2016; Figure 1F). The maintenance of accumulated carbohydrates in STAR seems to correlate with the upregulation of the starch anabolic enzymes, starch synthase and 1,4-α-glucan branching enzyme, which are slightly more upregulated than the catabolic enzymes, α-amylase and starch phosphorylase. In D. tertiolecta starch is primarily synthesized in the beginning of nitrogen starvation and then is degraded for fatty acid synthesis and TAG production under continuing nitrogen starvation (Pick and Avidan, 2017). Major turnover between starch and lipids took place after 72 h (Pick and Avidan, 2017) when all starch metabolism genes were upregulated (Tan et al., 2016). At 51 h, D. viridis both up and down regulates starch metabolism (Supplementary Data Sheet 1). This difference may be a consequence of the earlier time point used in this study, but could also stem from the use of continuous light as a growth condition, which has been shown to be disruptive of the typical diurnal starch metabolism regulation in D. viridis (Srirangan et al., 2015).
The Krebs Cycle is a common regulatory hub for carbon partitioning as it serves to provide most carbon skeletons for amino acid synthesis and degradation. In D. tertiolecta and C. reinhardtii, all enzymes of the Krebs Cycle are upregulated under nitrogen starvation (Park et al., 2015; Tan et al., 2016), whereas D. viridis shows a mixture of up and down-regulation of the Krebs Cycle. It is unclear as to where this mixed regulation originates from although differences in experimental design could be a factor. Under continuous light, D. viridis shows highly modified metabolism as continuous light eliminates diurnal cycles and also desynchronizes the cell cycle (Srirangan et al., 2015), so an interaction between light and nitrogen stress could cause the differences in Krebs Cycle regulation.
Two key metabolites derived from glycolysis, phosphoenolpyruvate (PEP) and pyruvate (PYR), are used to create acetyl-CoA, which can feed into the Krebs Cycle or fatty acid synthesis. As such, they are important regulatory molecules in partitioning of carbon into carbohydrates or lipids (Polle et al., 2014). Under nitrogen starvation, D. tertiolecta and C. reinhardtii both show an upregulation of the pyruvate dehydrogenase complex which creates acetyl-CoA from PYR and allows for the synthesis of fatty acids (Park et al., 2015; Tan et al., 2016). However, D. viridis does not show this regulatory pattern and the pyruvate dehydrogenase complex shows no change in transcription (Figure 6). When looking at the transcriptional program around PEP and PYR, it appears that D. viridis favors starch production by avoiding the build-up of PYR which can be converted into acetyl-CoA and eventually fatty acids. This avoidance of PYR comes in several different strategies. The first is stopping PYR production by downregulation of pyruvate kinase and malic enzymes. The upregulation of pyruvate phosphate dikinase suggests that if PYR is created it is converted into PEP to avoid conversion into acetyl-CoA. Another strategy is the upregulation of PEP carboxylase to convert PEP into oxaloacetate for the Krebs Cycle. The concurrent upregulation of PEP carboxykinase suggests that oxaloacetate being converted to PEP could be used to prompt gluconeogenesis and eventual starch synthesis. Although PYR is a critical metabolite, the transcriptional data suggest that D. viridis attempts to limit the pool of PYR by limiting production or converting PYR into alternate metabolites other than acetyl-CoA.
Putative pH Effects Are Detectable in Transcription Patterns of Batch Cultures
A disadvantage of batch culture is that conditions in the culture flask change over time as the organism interacts with the environment. Dunaliella alkalizes the environment as part of the dissolved inorganic carbon uptake mechanism (Shiraiwa et al., 1993). This creates a trend of increasing medium pH as cell density increases. Within the subset of DE genes at 51 h between GLN and NO3, several genes appeared to be regulated by the difference in pH between cultures, as they were DE in all nitrogen conditions from inoculum to 3 h when the pH fell from 9.2 to 8.2. They were also DE in the 51 h over 27 h comparison of the NO3 and GLN conditions when the pH between NO3 and GLN is significantly different (Table 1).
The Carbon Concentrating Mechanism (CCM) Reacts to pH and Nitrogen Starvation
Carbonic anhydrases are major constituents of the carbon concentrating mechanism (CCM) in algae (DiMario et al., 2018). In C. reinhardtii, CAs are upregulated under low CO2 conditions (Mackinder et al., 2017). In Dunaliella spp., low CO2 and high salt induce CA expression (Jeon et al., 2016) and in D. viridis continuous light induces α-CA expression (Srirangan et al., 2015). Nitrogen starvation also appears to be a regulating factor in D. viridis as the α-CA and θ-CA genes were all downregulated by nitrogen starvation. θ-CAs are homologs of the C. reinhardtii LCIB/LCIC proteins which are chloroplast stroma-localized and predicted to convert escaped CO2 from the pyrenoid back into HCO3− under low CO2 levels (Wang et al., 2015; Mackinder et al., 2017). It is likely that the θ-CAs are responding to pH because both GLN and NO3 had high pH values even though GLN had entered nitrogen starvation by 51 h. Interestingly, this increase in CA expression over time suggests CO2 starvation, even though the cells only grew for 51 h in a media with 50 mM HCO3−. It is possible that as the pH rises D. viridis interprets the shift in carbon species from H2CO3 to HCO3− to CO32− as CO2 starvation.
The CCM also requires the transport of inorganic carbon across multiple membranes. Recently, two thylakoid-localized bestrophin chloride channels were found to interact with LCIB/LCIC (θ-CAs) (Mackinder et al., 2017). Since human bestrophins are permeable to HCO3− and Cl− (Qu and Hartzell, 2008), Mackinder predicted that the bestrophins could function as the unknown HCO3− transporter from the thylakoid into the pyrenoid (Mackinder et al., 2017). Three D. viridis bestrophin homologs were upregulated over time as the pH increased in conjunction with the θ-CA homologs suggesting that this association and mechanism may also exist for the D. viridis CCM (Supplementary Data Sheet 1). In C. reinhardtii, the HLA3/LCI1 complex and LCIA reside, respectively, on the plasma and chloroplast membranes and are critical for proper transport of HCO3− (Mariscal et al., 2006; Yamano et al., 2015; Mackinder et al., 2017). However, none of the D. viridis homologs are regulated by increasing pH and the LCIA homolog (FNT2) appears to be solely reactive to NH4+ repression. Other putative bicarbonate transporters, Cl−/HCO3− antiporters (Bonar and Casey, 2008) and a CIA8 homolog (Machingura et al., 2017) show no difference in transcription in all conditions. This suggests that increasing pH may not be interpreted as CO2 limitation by D. viridis or that CCM regulation is different between C. reinhardtii and D. viridis.
Conclusion
The previously observed metabolic phenotype of growth on glutamine-derived NH4+ was not due to nitrogen source, but due to nitrogen starvation. The transcriptional data revealed clear similarities in transcript abundance between STAR and GLN, whereas the metabolic and growth phenotypes were less consistent and did not definitively show nitrogen starvation. The release of NH4+ from GLN proved to be sufficient to support 51 h of cell division, but did not maintain metabolic and transcriptional profiles resembling nitrogen sufficiency. Increased quantities of GLN over 5 mM could provide more overall nitrogen, which is expected to delay the starvation response. However, the issue of NH3 toxicity is important to consider. Partial nitrogen starvation may be advantageous for biofuel production because it supports simultaneous cell growth and accumulation of carbon storage metabolites (Lardon et al., 2009); however, it was beyond the bounds of this work to determine the optimal use of GLN. The nitrogen limitation response of D. viridis proved to be similar to other green algae and like D. tertiolecta, D. viridis preferentially stores carbohydrates rather than lipids although both are accumulated under nitrogen limitation. The complex transcriptional regulation under nitrogen starvation shows a potential carbon partitioning regulatory point where pyruvate availability is transcriptionally limited to stop acetyl-CoA synthesis, the precursor of fatty acid biosynthesis. This regulatory point could be used to direct carbon into starch production rather than lipid production.
Author Contributions
JD, CM, and HS involved in the conception and design of this project, were involved in the analysis and interpretation of the data, were responsible for critical revision of the article for important intellectual content. JD, CM, NV, and DY were involved in collection and assembly of data. JD wrote the initial draft of the manuscript. All authors were involved in final approval of the article.
Funding
This work was supported by a NSF Emerging Frontiers in Research and Innovation grant (NSF-EFRI #1332341).
Conflict of Interest Statement
The authors declare that the research was conducted in the absence of any commercial or financial relationships that could be construed as a potential conflict of interest.
Acknowledgments
We would like to thank Dr. Soundarya Srirangan for advice and thoughtful discourse. We would also like to thank the reviewers for feedback and improvement suggestions for this manuscript.
Supplementary Material
The Supplementary Material for this article can be found online at: https://www.frontiersin.org/articles/10.3389/fmars.2018.00311/full#supplementary-material
Footnotes
References
Arnold, A., Sajitz-Hermstein, M., and Nikoloski, Z. (2015). Effects of varying nitrogen sources on amino acid synthesis costs in arabidopsis thaliana under different light and carbon-source conditions. PLoS One 10:e0116536. doi: 10.1371/journal.pone.0116536
Arnon, D. I. (1949). Copper enzymes in isolated chloroplasts. polyphenoloxidase in beta vulgaris. Plant Physiol. 24, 1–15. doi: 10.1104/pp.24.1.1
Artimo, P., Jonnalagedda, M., Arnold, K., Baratin, D., Csardi, G., de Castro, E., et al. (2012). ExPASy: SIB bioinformatics resource portal. Nucleic Acids Res. 40, W597–W603. doi: 10.1093/nar/gks400
Ben-Amotz, A., Polle, J. E., and Rao, D. S. (2009). The Alga Dunaliella: Biodiversity, Physiology, Genomics and Biotechnology. Enfield, NH: Science Publishers. doi: 10.1201/b10300
Bonar, P. T., and Casey, J. R. (2008). Plasma membrane Cl-/HCO3- exchangers: structure, mechanism and physiology. Channels 2, 337–345. doi: 10.4161/chan.2.5.6899
Boyle, N. R., Page, M. D., Liu, B., Blaby, I. K., Casero, D., Kropat, J., et al. (2012). Three acyltransferases and nitrogen-responsive regulator are implicated in nitrogen starvation-induced triacylglycerol accumulation in Chlamydomonas. J. Biol. Chem. 287, 15811–15825. doi: 10.1074/jbc.M111.334052
Camargo, A., Llamas, A., Schnell, R. A., Higuera, J. J., Gonzalez-Ballester, D., Lefebvre, P. A., et al. (2007). Nitrate signaling by the regulatory gene NIT2 in chlamydomonas. Plant Cell 19, 3491–3503. doi: 10.1105/tpc.106.045922
DiMario, R. J., Machingura, M. C., Waldrop, G. L., and Moroney, J. V. (2018). The many types of carbonic anhydrases in photosynthetic organisms. Plant Sci. 268, 11–17. doi: 10.1016/j.plantsci.2017.12.002
Dubois, M., Gilles, K., Hamilton, J. K., Rebers, P. A., and Smith, F. (1956). Colorimetric method for determination of sugars and related substances. Anal. Chem. 28, 350–356. doi: 10.1021/ac60111a017
Dums, J. T., Murphree, C. A., Vasani, N., and Sederoff, H. (2018). Raw FASTQ Files for Dunaliella viridis Dumsii Transcriptome Sequencing in Variable Nitrogen Conditions. Genome Expression Omnibus. Version 1 GSE111548.
Fang, L., Qi, S., Xu, Z., Wang, W., He, J., Chen, X., et al. (2017). De novo transcriptomic profiling of Dunaliella salina reveals concordant flows of glycerol metabolic pathways upon reciprocal salinity changes. Algal Res. 23, 135–149. doi: 10.1016/j.algal.2017.01.017
Giordano, M., and Bowes, G. (1997). Gas exchange and c allocation in Dunaliella salina cells in response to the n source and CO2 concentration used for growth. Plant Physiol. 115, 1049–1056. doi: 10.1104/pp.115.3.1049
Giordano, M., and Raven, J. A. (2014). Nitrogen and sulfur assimilation in plants and algae. Aquat. Bot. 118, 45–61. doi: 10.1016/j.aquabot.2014.06.012
Goncalves, E. C., Koh, J., Zhu, N., Yoo, M. J., Chen, S., Matsuo, T., et al. (2016a). Nitrogen starvation-induced accumulation of triacylglycerol in the green algae: evidence for a role for ROC40, a transcription factor involved in circadian rhythm. Plant J. 85, 743–757. doi: 10.1111/tpj.13144
Goncalves, E. C., Wilkie, A. C., Kirst, M., and Rathinasabapathi, B. (2016b). Metabolic regulation of triacylglycerol accumulation in the green algae: identification of potential targets for engineering to improve oil yield. Plant Biotechnol. J. 14, 1649–1660. doi: 10.1111/pbi.12523
Gutierrez, J., Kwan, T. A., Zimmerman, J. B., and Peccia, J. (2016). Ammonia inhibition in oleaginous microalgae. Algal Res. 19, 123–127. doi: 10.1016/j.algal.2016.07.016
Hellebust, J. A., and Liu, M. S. (1974). Uptake of amino acids by the marine centric diatom Cyclotella cryptica. Can. J. Microbiol. 20, 1109–1118. doi: 10.1139/m74-173
Hellio, C., and Le Gal, Y. (1998). Histidine utilization by the unicellular alga Dunaliella tertiolecta. Comp. Biochem. Physiol. A Mol. Integr. Physiol. 119, 753–758. doi: 10.1016/S1095-6433(98)01011-3
Hong, L., Liu, J. L., Midoun, S. Z., and Miller, P. C. (2017). Transcriptome sequencing and annotation of the halophytic microalga Dunaliella salina. J. Zhejiang Univ. Sci. B 18, 833–844. doi: 10.1631/jzus.B1700088
Hosseini Tafreshi, A., and Shariati, M. (2009). Dunaliella biotechnology: methods and applications. J. Appl. Microbiol. 107, 14–35. doi: 10.1111/j.1365-2672.2009.04153.x
Huo, Y., Wernick, D. G., and Liao, J. C. (2012). Toward nitrogen neutral biofuel production. Curr. Opin. Biotechnol. 23, 406–413. doi: 10.1016/j.copbio.2011.10.005
Ietswaart, T., Schneider, P. J., and Prins, R. A. (1994). Utilization of organic nitrogen sources by two phytoplankton species and a bacterial isolate in pure and mixed cultures. Appl. Environ. Microbiol. 60, 1554–1560.
Jeon, H., Jeong, J., Baek, K., McKie-Krisberg, Z., Polle, J. E. W., and Jin, E. (2016). Identification of the carbonic anhydrases from the unicellular green alga Dunaliella salina strain CCAP 19/18. Algal Res. 19, 12–20. doi: 10.1016/j.algal.2016.07.010
Kanehisa, M., Furumichi, M., Tanabe, M., Sato, Y., and Morishima, K. (2017). KEGG: new perspectives on genomes, pathways, diseases and drugs. Nucleic Acids Res. 45, D353–D361. doi: 10.1093/nar/gkw1092
Kanehisa, M., Sato, Y., and Morishima, K. (2016). BlastKOALA and GhostKOALA: KEGG tools for functional characterization of genome and metagenome sequences. J. Mol. Biol. 428, 726–731. doi: 10.1016/j.jmb.2015.11.006
Keeling, P. J., Burki, F., Wilcox, H. M., Allam, B., Allen, E. E., Amaral-Zettler, L. A., et al. (2014). The marine microbial eukaryote transcriptome sequencing project (MMETSP): illuminating the functional diversity of eukaryotic life in the oceans through transcriptome sequencing. PLoS Biol. 12:e1001889. doi: 10.1371/journal.pbio.1001889
Kirk, D. L., and Kirk, M. M. (1978). Carrier-mediated uptake of arginine and urea by Chlamydomonas reinhardtii. Plant Physiol. 61, 556–560. doi: 10.1104/pp.61.4.556
Lardon, L., Helias, A., Sialve, B., Steyer, J. P., and Bernard, O. (2009). Life-cycle assessment of biodiesel production from microalgae. Environ. Sci. Technol. 43, 6475–6481. doi: 10.1021/es900705j
Li, B., and Dewey, C. N. (2011). RSEM: accurate transcript quantification from RNA-Seq data with or without a reference genome. BMC Bioinformatics 12:323. doi: 10.1186/1471-2105-12-323
Li, J., Xue, L., Yan, H., Wang, L., Liu, L., Lu, Y., et al. (2007). The nitrate reductase gene-switch: a system for regulated expression in transformed cells of Dunaliella salina. Gene 403, 132–142. doi: 10.1016/j.gene.2007.08.001
Machingura, M. C., Bajsa-Hirschel, J., Laborde, S. M., Schwartzenburg, J. B., Mukherjee, B., Mukherjee, A., et al. (2017). Identification and characterization of a solute carrier, CIA8, involved in inorganic carbon acclimation in Chlamydomonas reinhardtii. J. Exp. Bot. 68, 3879–3890. doi: 10.1093/jxb/erx189
Mackinder, L. C. M., Chen, C., Leib, R. D., Patena, W., Blum, S. R., Rodman, M., et al. (2017). A spatial interactome reveals the protein organization of the algal CO2-concentrating mechanism. Cell 171, 133.e14–147.e14. doi: 10.1016/j.cell.2017.08.044
Mariscal, V., Moulin, P., Orsel, M., Miller, A. J., Fernández, E., and Galván, A. (2006). Differential regulation of the chlamydomonas Nar1 gene family by carbon and nitrogen. Protist 157, 421–433. doi: 10.1016/j.protis.2006.06.003
Matasci, N., Hung, L., Yan, Z., Carpenter, E. J., Wickett, N. J., Mirarab, S., et al. (2014). Data access for the 1,000 plants (1KP) project. Gigascience 3:17. doi: 10.1186/2047-217X-3-17
Merchant, S. S., Kropat, J., Liu, B., Shaw, J., and Warakanont, J. (2012). TAG, you’re it! chlamydomonas as a reference organism for understanding algal triacylglycerol accumulation. Curr. Opin. Biotechnol. 23, 352–363. doi: 10.1016/j.copbio.2011.12.001
Micallef, L., and Rodgers, P. (2014). eulerAPE: drawing area-proportional 3-Venn diagrams using ellipses. PLoS One 9:e101717. doi: 10.1371/journal.pone.0101717
Moellering, E. R., and Benning, C. (2010). RNA interference silencing of a major lipid droplet protein affects lipid droplet size in Chlamydomonas reinhardtii. Eukaryot. Cell 9, 97–106. doi: 10.1128/EC.00203-09
Murphree, C. A., Dums, J. T., Jain, S. K., Zhao, C., Young, D. Y., Khoshnoodi, N., et al. (2017). Amino acids are an ineffective fertilizer for Dunaliella spp. growth. Front. Plant Sci. 8:847. doi: 10.3389/fpls.2017.00847
Oren, A. (2005). A hundred years of Dunaliella research: 1905-2005. Saline Systems 1:2. doi: 10.1186/1746-1448-1-2
Park, J., Wang, H., Gargouri, M., Deshpande, R. R., Skepper, J. N., Holguin, F. O., et al. (2015). The response of Chlamydomonas reinhardtii to nitrogen deprivation: a systems biology analysis. Plant J. 81, 611–624. doi: 10.1111/tpj.12747
Pick, U., and Avidan, O. (2017). Triacylglycerol is produced from starch and polar lipids in the green alga Dunaliella tertiolecta. J. Exp. Bot. 68, 4939–4950. doi: 10.1093/jxb/erx280
Polle, J. E. W., Barry, K., Cushman, J., Schmutz, J., Tran, D., Hathwaik, L., et al. (2017). Draft nuclear genome sequence of the halophilic and beta-carotene-accumulating green alga Dunaliella salina strain CCAP19/18. Genome Announc. 5:17. doi: 10.1128/genomeA.01105-17
Polle, J. E. W., Neofotis, P., Huang, A., Chang, W., Sury, K., and Wiech, E. M. (2014). Carbon partitioning in green algae (Chlorophyta) and the enolase enzyme. Metabolites 4, 612–628. doi: 10.3390/metabo4030612
Preininger, É, Kósa, A., Lörincz, Z., Nyitrai, P., Simon, J., Böddi, B., et al. (2015). Structural and functional changes in the photosynthetic apparatus of Chlamydomonas reinhardtii during nitrogen deprivation and replenishment. Photosynthetica 53, 369–377. doi: 10.1007/s11099-015-0129-y
Puente-Sanchez, F., Olsson, S., and Aguilera, A. (2016). Comparative transcriptomic analysis of the response of Dunaliella acidophila (Chlorophyta) to short-term cadmium and chronic natural metal-rich water exposures. Microb. Ecol. 72, 595–607. doi: 10.1007/s00248-016-0824-7
Qu, Z., and Hartzell, H. C. (2008). Bestrophin Cl- channels are highly permeable to HCO3-. Am. J. Physiol. Cell Physiol. 294, C1371–C1377. doi: 10.1152/ajpcell.00398.2007
Rismani-Yazdi, H., Haznedaroglu, B. Z., Bibby, K., and Peccia, J. (2011). Transcriptome sequencing and annotation of the microalgae Dunaliella tertiolecta: pathway description and gene discovery for production of next-generation biofuels. BMC Genomics 12:148. doi: 10.1186/1471-2164-12-148
Robinson, M. D., McCarthy, D. J., and Smyth, G. K. (2010). edgeR: a bioconductor package for differential expression analysis of digital gene expression data. Bioinformatics 26, 139–140. doi: 10.1093/bioinformatics/btp616
Sanz-Luque, E., Chamizo-Ampudia, A., Llamas, A., Galvan, A., and Fernandez, E. (2015). Understanding nitrate assimilation and its regulation in microalgae. Front. Plant Sci. 6:899. doi: 10.3389/fpls.2015.00899
Sauer, N., Komor, E., and Tanner, W. (1983). Regulation and characterization of two inducible amino-acid transport systems in Chlorella vulgaris. Planta 159, 404–410. doi: 10.1007/BF00392075
Schmollinger, S., Mühlhaus, T., Boyle, N. R., Blaby, I. K., Casero, D., Mettler, T., et al. (2014). Nitrogen-sparing mechanisms in chlamydomonas affect the transcriptome, the proteome, and photosynthetic metabolism. Plant Cell 26, 1410–1435. doi: 10.1105/tpc.113.122523
Shin, H., Hong, S., Kim, H., Yoo, C., Lee, H., Choi, H., et al. (2015). Elucidation of the growth delimitation of Dunaliella tertiolecta under nitrogen stress by integrating transcriptome and peptidome analysis. Bioresour. Technol. 194, 57–66. doi: 10.1016/j.biortech.2015.07.002
Shiraiwa, Y., Goyal, A., and Tolbert, N. E. (1993). Alkalization of the medium by unicellular green algae during uptake dissolved inorganic carbon. Plant Cell Physiol. 34, 649–657. doi: 10.1093/oxfordjournals.pcp.a078467
Slocombe, S. P., Zhang, Q., Ross, M., Anderson, A., Thomas, N. J., Lapresa, Á, et al. (2015). Unlocking nature’s treasure-chest: screening for oleaginous algae. Sci. Rep. 5:9844. doi: 10.1038/srep09844
Song, T., Gao, Q., Xu, Z., and Song, R. (2011). The cloning and characterization of two ammonium transporters in the salt-resistant green alga, Dunaliella viridis. Mol. Biol. Rep. 38, 4797–4804. doi: 10.1007/s11033-010-0621-1
Srirangan, S., Sauer, M. L., Howard, B., Dvora, M., Dums, J., Backman, P., et al. (2015). Interaction of temperature and photoperiod increases growth and oil content in the marine microalgae Dunaliella viridis. PLoS One 10:e0127562. doi: 10.1371/journal.pone.0127562
Tan, K. W. M., Lin, H., Shen, H., and Lee, Y. K. (2016). Nitrogen-induced metabolic changes and molecular determinants of carbon allocation in Dunaliella tertiolecta. Sci. Rep. 6:37235. doi: 10.1038/srep37235
Vieler, A., Wu, G., Tsai, C. H., Bullard, B., Cornish, A. J., Harvey, C., et al. (2012). Genome, functional gene annotation, and nuclear transformation of the heterokont oleaginous alga nannochloropsis oceanica CCMP1779. PLoS Genet. 8:e1003064. doi: 10.1371/journal.pgen.1003064
Wang, W., Allen, E., Campos, A. A., Cade, R. K., Dean, L., Dvora, M., et al. (2013). ASI: Dunaliella marine microalgae to drop-in replacement liquid transportation fuel. Environ. Prog. Sustain. Energy 32, 916–925. doi: 10.1002/ep.11855
Wang, Y., Stessman, D. J., and Spalding, M. H. (2015). The CO2 concentrating mechanism and photosynthetic carbon assimilation in limiting CO2: how chlamydomonas works against the gradient. Plant J. 82, 429–448. doi: 10.1111/tpj.12829
Winter, H. (1993). Untersuchungen Zur Akkumulatoin und Translokation von Assimilaten. Gottingen: University of Gottingen.
Yamano, T., Sato, E., Iguchi, H., Fukuda, Y., and Fukuzawa, H. (2015). Characterization of cooperative bicarbonate uptake into chloroplast stroma in the green alga Chlamydomonas reinhardtii. Proc. Natl. Acad. Sci. U. S. A. 112, 7315–7320. doi: 10.1073/pnas.1501659112
Keywords: Dunaliella, nitrogen starvation, ammonium, amino acids, glutamine, biofuel, nitrogen recycling, transcriptome
Citation: Dums J, Murphree C, Vasani N, Young D and Sederoff H (2018) Metabolic and Transcriptional Profiles of Dunaliella viridis Supplemented With Ammonium Derived From Glutamine. Front. Mar. Sci. 5:311. doi: 10.3389/fmars.2018.00311
Received: 29 May 2018; Accepted: 13 August 2018;
Published: 30 August 2018.
Edited by:
Pannaga Pavan Jutur, International Centre for Genetic Engineering and Biotechnology, IndiaReviewed by:
Kumari Kavita, National Institutes of Health (NIH), United StatesDuygu Dikicioglu, University of Cambridge, United Kingdom
Tingting Xiang, Stanford University, United States
Copyright © 2018 Dums, Murphree, Vasani, Young and Sederoff. This is an open-access article distributed under the terms of the Creative Commons Attribution License (CC BY). The use, distribution or reproduction in other forums is permitted, provided the original author(s) and the copyright owner(s) are credited and that the original publication in this journal is cited, in accordance with accepted academic practice. No use, distribution or reproduction is permitted which does not comply with these terms.
*Correspondence: Heike Sederoff, aHdzZWRlcm9AbmNzdS5lZHU=