 Tyler O. Gagné1*
 K. David Hyrenbach2
 Molly E. Hagemann3Oron L. Bass4
 Stuart L. Pimm5Mark MacDonald6Brian Peck7
 Kyle S. Van Houtan1,5
- 1Conservation and Research Department, Monterey Bay Aquarium, Monterey, CA, United States
- 2Department of Natural Science, Marine Science Programs at Oceanic Institute, Hawaii Pacific University, Honolulu, HI, United States
- 3Vertebrate Zoology Collections, Bernice Pauahi Bishop Museum, Honolulu, HI, United States
- 4South Florida Natural Resources Center, Everglades National Park, Homestead, FL, United States
- 5Nicholas School of the Environment, Duke University, Durham, NC, United States
- 6Department of Marine and Wildlife Resources, Pago Pago, AS, United States
- 7Rose Atoll Marine National Monument, United States Fish and Wildlife Service, Pago Pago, AS, United States
We analyze recently collected feather tissues from two species of seabirds, the sooty tern (Onychoprion fuscatus) and brown noddy (Anous stolidus), in three ocean regions (North Atlantic, North Pacific, and South Pacific) with different human impacts. The species are similar morphologically and in the trophic levels from which they feed within each location. In contrast, we detect reliable differences in trophic position amongst the regions. Trophic position appears to decline as the intensity of commercial fishing increases, and is at its lowest in the Caribbean. The spatial gradient in trophic position we document in these regions exceeds those detected over specimens from the last 130 years in the Hawaiian Islands. Modeling suggests that climate velocity and human impacts on fish populations strongly align with these differences.
Introduction
The scale and accessibility of marine ecosystems, anthropogenic impact, and industry removal presents management and conservation challenges. Consequently, monitoring and evaluation often rely on proxies to assess marine ecosystems. Such proxies include manually surveyed biological indicators, remotely sensed environmental data, and state-aggregated fisheries dependent metrics like mean trophic level (MTL) (Pauly et al., 1998; Holt and Miller, 2011; Hunsicker et al., 2016). For these to be effective decision-making tools, identifying indicators and metrics that accurately and independently quantify impacts is key (Link et al., 2009).
Food web status has been a widely used metric for gauging ecosystem state, especially in relation to commercial fishery impacts (Pimm, 1982). In particular, fishery-derived MTL is repeatedly used to gauge food web status and trends; though its interpretation has been contested (Pauly et al., 1998). Fishery-dependent MTL assessments have inherent biases that may fail to detect multiple ecosystem signals such as high trophic-level species loss, prey release, and market targeting shifts (Essington et al., 2006; Estes et al., 2011). Ideal biological indicators are those sampled and approximated from species representing broad ecosystem patterns (Lyday et al., 2015; Reed et al., 2016). The techniques must be robust and reproducible at scale (Gagné et al., 2018). Increasingly, metrics independent of fisheries and often involving non-target upper trophic level predators, like marine birds and mammals, offer promising approaches for circumventing biases (Holt and Miller, 2011).
To assess the status of pelagic food webs, we use compound-specific stable isotope analysis of amino acids (CSIA-AA) to compare seabird tissues across three ocean regions. This approach helps resolve previous questions of bias from fishery-data based metrics and from those relying on bulk stable isotope techniques which have come under scrutiny due to isotopic baseline shifts affecting trophic position estimates (Nielsen et al., 2015).
We focus on two species of colonial terns that are central place foragers, have large foraging ranges (BRNO = 200 km, SOTE = 800 km), and are circumtropically distributed (Hebshi et al., 2008). CSIA-AA determines trophic position robustly by comparing the relative enrichment of the 15N to 14N ratio (δ15N) in trophic and source amino acids (Nielsen et al., 2015). This approach proposes a fishery-independent metric to document food web status amongst locations. It builds upon our previous research, that applied this method across a chronology of 130-years (Gagné et al., 2018) within one region. To understand potential spatial patterns that the birds may be detecting, we use random forest regression models to investigate the influence of various anthropogenic and climate factors on seabird trophic position. We reaffirm seabirds are reliable indicators of marine systems, especially through the use of CSIA-AA to calculate their trophic position (Lyday et al., 2015), and in recording impacts from commercial fisheries extraction.
Materials and Methods
Specimen Collection and Preparation
We sampled brown noddy (Anous stolidus) and sooty tern (Onychoprion fuscatus) feathers from three locations in three distinct ocean basins: Rose Island, Rose Atoll National Wildlife Refuge, American Samoa (South Pacific); Waimanalo, Oahu, Hawaii (North Pacific); and Bush Key, Dry Tortugas National Park, Florida (North Atlantic). From 2013–2015, we collected senesced, fully emerged flight feathers at nesting colonies and additional samples from dead strandings (USFWS permits MB052060-0, MB180283-1).
Collected feathers were free from debris and other tissues, were stored in heavyweight polyethylene bags (ULINETM, 4 mil) with indicating silica gel desiccant (FisherTM grade 48, 4–10 mesh), and later debrided with compressed air. We homogenized individual feathers (n = 20) and sent samples to the UC Davis Stable Isotope Facility for CSIA-AA. Though our processed specimen data are limited (n = 20, 6 Hawaii, 4 Florida, 10 American Samoa with an even split of species by location), the sample size we collected is characteristic of CSIA-AA studies of marine species (Popp et al., 2007; Chikaraishi et al., 2009; Votier et al., 2010; O’Malley et al., 2012; Ostrom et al., 2017; Peavey et al., 2017) and effective at describing possible population patterns. That said, we discuss future research directions that may improve upon the sampling and analyses presented here.
Trophic Position Calculation
We calculated trophic position, TP, using:
where δ15NTrp is the mean value for six trophic amino acids (alanine, glutamic acid, isoleucine, leucine, proline, and valine), δ15NSrc is the single source amino acid (phenylalanine), and β (2.42) and TEF (trophic enrichment factor = 5.63) are amino acid-specific constants (Nielsen et al., 2015), calculated using established methods (Gagné et al., 2018). Variation of the selected constants does not impact the relative relationships of TP between species or location, only absolute values, and therefore does not influence our aim of detecting differences between regions. For each specimen, we generated 1000 random TP values from the δ15N (normal) parameter distributions the analytical lab provided for each amino acid (Figure 1A and Supplementary Table S1). Due to the large (20000 estimates) sample drawn the lab parametrized distributions, tests of difference are highly significant (p < 0.005) with narrow confidence intervals. Therefore, we report and discuss trophic positions effect size and magnitude differences (Sullivan and Feinn, 2012; Greenland et al., 2016).
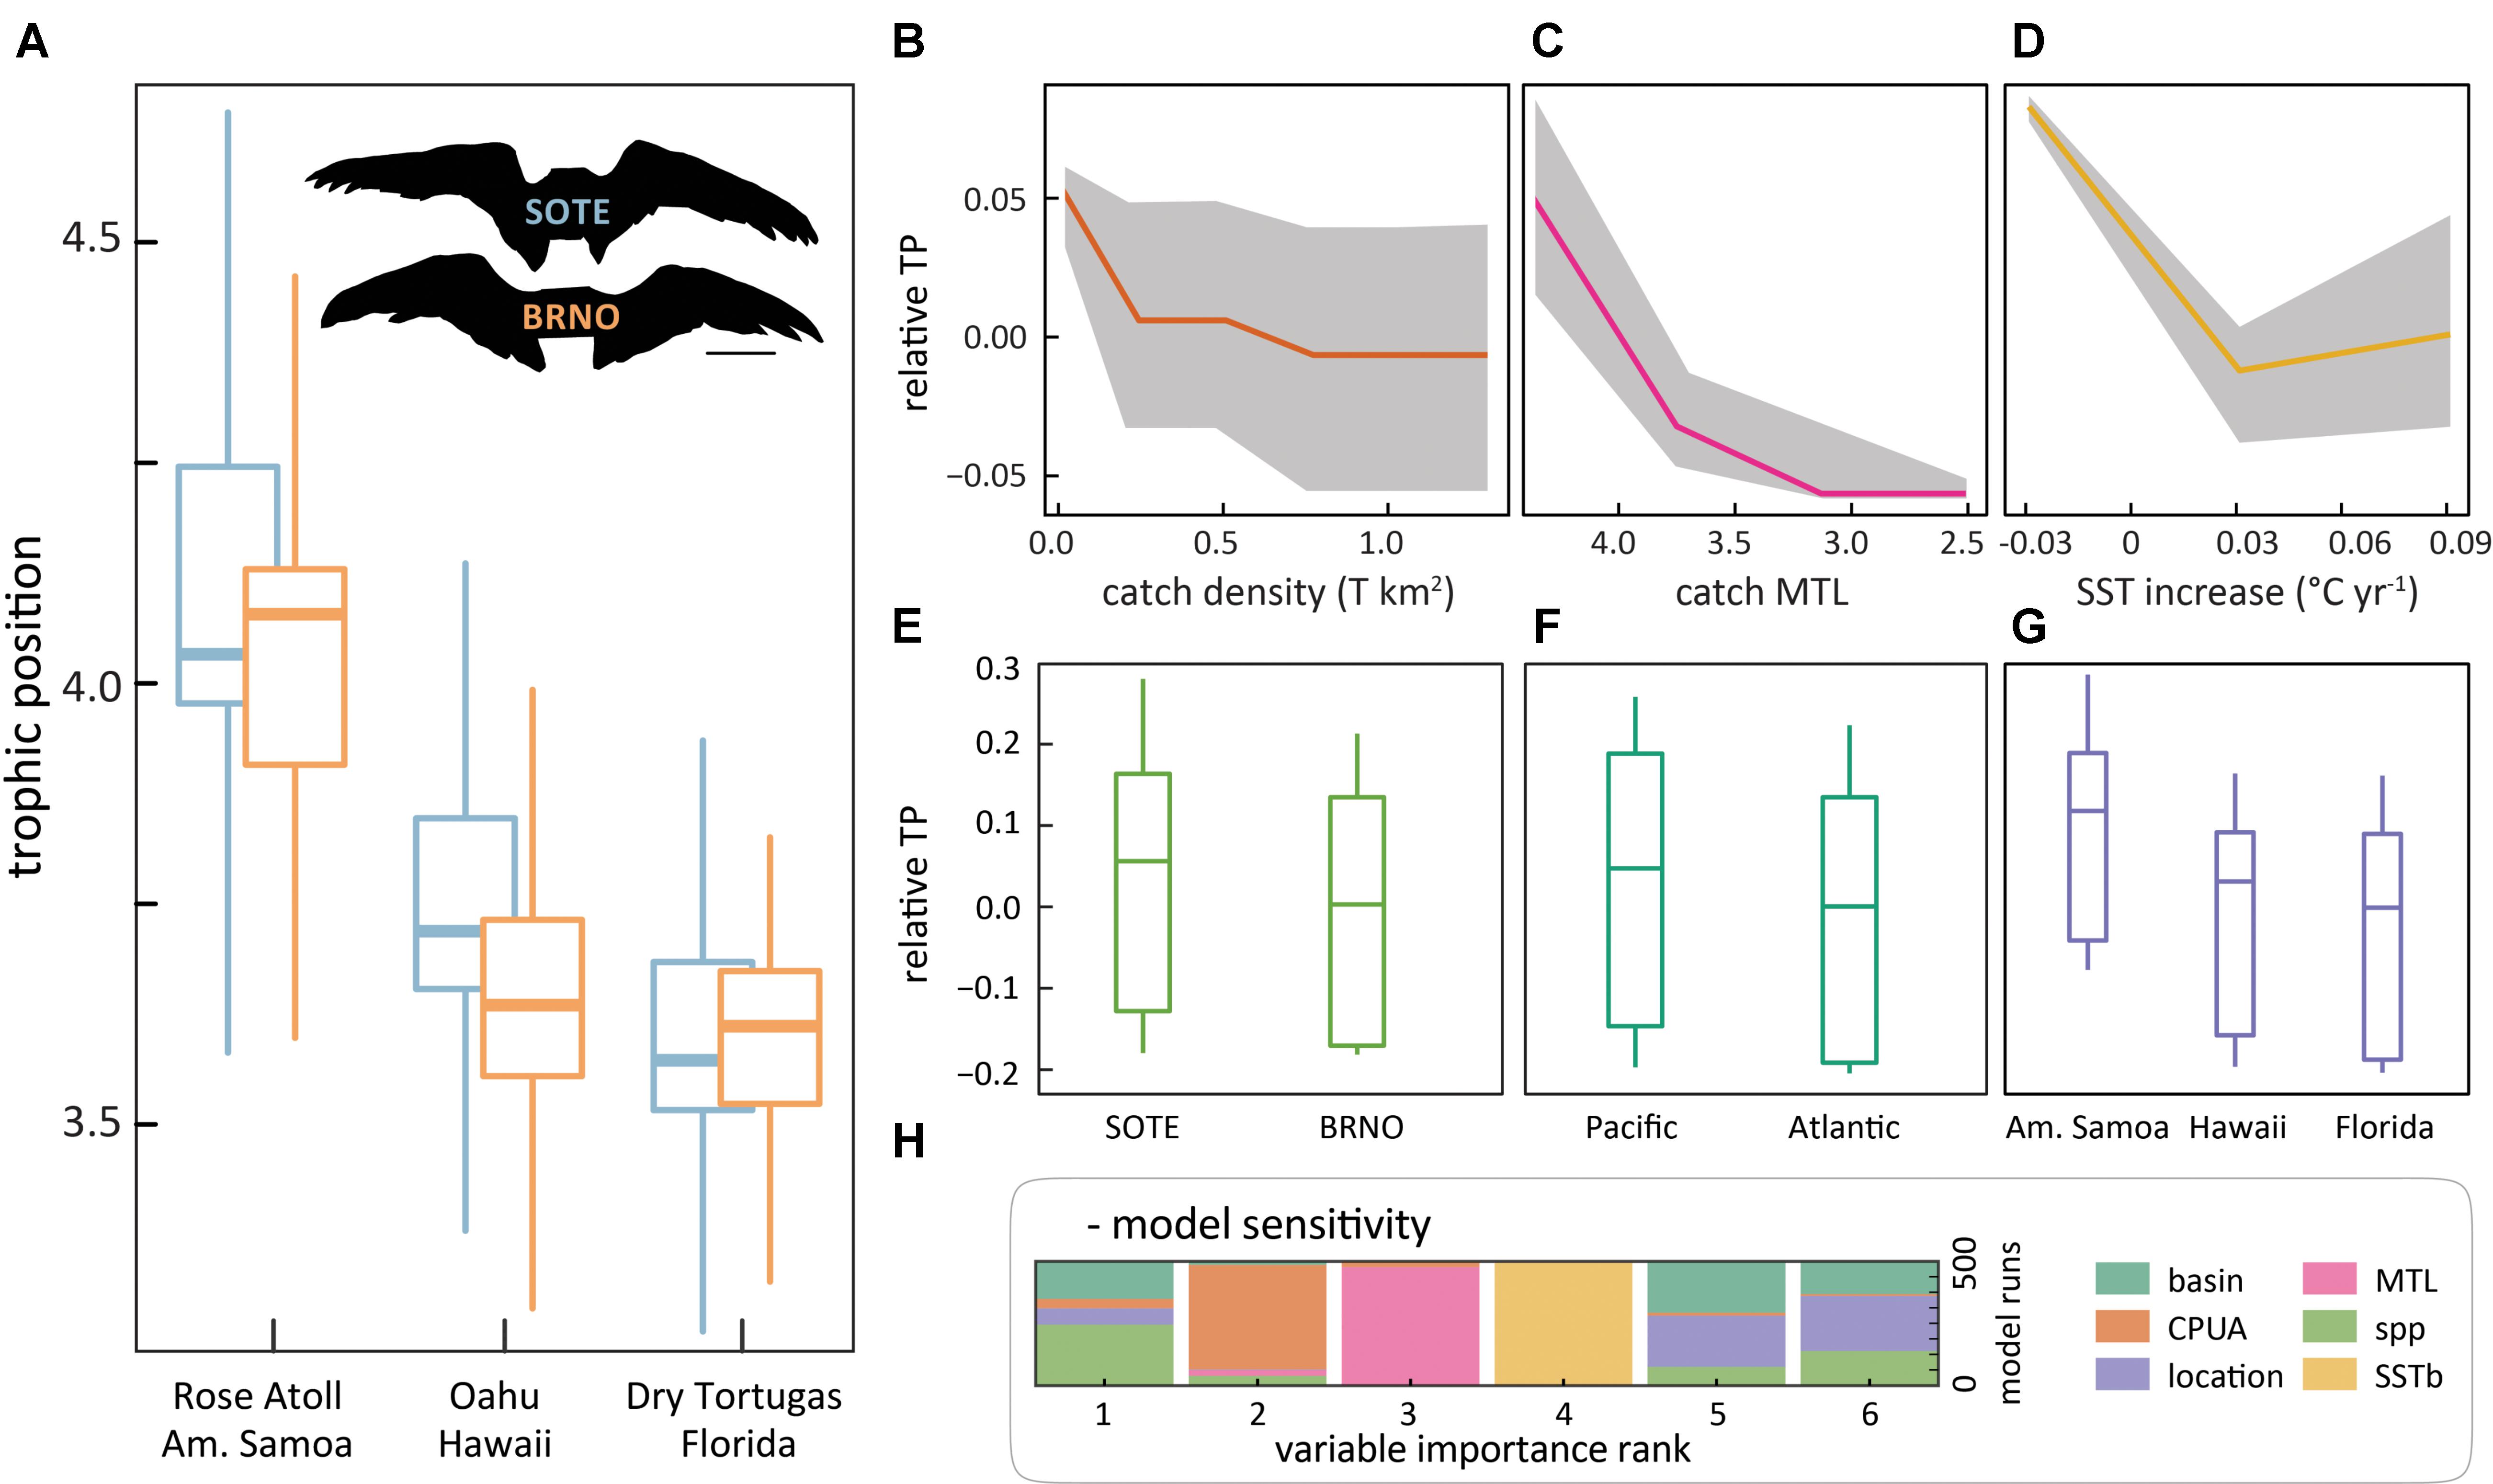
FIGURE 1. Trophic position of two seabirds (A) and conditional relationships with model predictors (B–G). A, whisker range is 1.5× the interquartile spread. Plot colors correspond to labeled wing silhouettes, “SOTE” is sooty tern and “BRNO” is brown noddy. B–G are conditional expectation plots of predictors from the model for continuous (B–D) and categorical model inputs (E–G). Relative TP on the y-axis of B–G refers to the change in trophic position units observed across the range of values of a predictor. Colored lines (B–D) and center quantile (E–G) represent the respective mean and median of the partial effect of a covariate on the model prediction of TP. Gray bands and quartiles represent the range and distribution of predictions, akin to a prediction interval. TP declines with increases in catch density (B) and rates of SST increase (D), and declines as Sea Around Us reported catch landings MTL decreases (C). We assessed model variable importance with a leave one out sensitivity analysis. Panel (H) shows the proportion of model runs where each covariate appeared at each importance rank. Beyond the splitting power of species and geography, fisheries related factors rank highly.
Model Input Aggregation
We aggregated covariates tied to environmental and human drivers that may describe spatial differences. As seabird prey items vary between regions, we represented fishing pressure for each region with catch density (catch-per-unit area, or CPUA, measured in tons km−1) as per previous studies (Pauly, 2007; Pauly et al., 2013). This metric is calculated by dividing the cumulative total annual catch from the Sea Around Us reconstructed landings by the total area of the EEZ of the location from which the feathers were sampled. We also obtained MTL by EEZ from the SeaAroundUs database. To capture the nature of the potentially relevant climate velocities that may have precipitated the relevant seabird prey composition, we calculated the 10-years change during and immediately prior to the sampling period. We calculated this as the rate of change in remotely sensed sea surface temperature (Supplementary Figures S1A,B, AVHRR POES 0.1°, 14-day composite) during the period of 2006-2016, consistent with previous studies (Hamann et al., 2015; Van Houtan et al., 2015).
Model Development
To explore correlative relationships, we implemented the random forest algorithm to model trophic position as a function of the drivers. Random forest models excel in their flexibility to model non-linearity and complex interactions while also maximizing generalizability, minimized overfitting tendency, and easy interpretation (Breiman, 2001). We trained random forest models with conservative hyper-parametrization. Hyper-parameters were set at 500 trees, 2 variables tried at each split, a minimum node size of 5 observations, and an out-of-bag sample proportion of 0.4 with replacement (Breiman, 2001). We built centered individual conditional expectation plots to highlight the range of predictor-response relationships conditional on the range of observations of the predictor values (Goldstein et al., 2015).
Sensitivity Analysis
We conducted a sensitivity analysis on variable importance rankings using a leave-one-out randomization technique for modeling fitting to measure sample stability on model inferences (Figure 1H; Archer and Kimes, 2008). In this process, we built 500 sets of variable importance values, based on 500 models each run from random subsets of the full sample set. As opposed to one set of variable importance rankings, this established a distribution of variable rankings under both sample perturbations and model fitting stochasticity that is inherent to random forest. This analysis provides a means to account for the influence of individual specimens given our relatively limited sample size.
Results
The sooty tern and brown noddy share a similar ecomorphology (Gagné et al., 2018). Figure 1A shows comparable trophic positions within species that decline amongst locations from American Samoa (mean = 4.00) to Hawaii (3.68) to Florida (3.59). Additionally, unlike bulk stable isotope analysis, CSIA-AA accounts for nitrogen from varied food web bases. Therefore, the observed shifts in trophic position suggest divergence in the trophic positions of available prey, and food web compression or simplification.
To model potential regional patterns, we use random forest models to investigate the influence of anthropogenic and climate factors on trophic position. We aggregated covariates tied to environmental and anthropogenic drivers that describe spatial differences in fisheries-dependent MTL, fisheries landings, and coupled sea surface temperature rate of change. Our models suggest that commercial fishing and climate align with the food web differences between regions. Figures 1B–H shows the model relationships and the estimated variable importance.
The random forest model explained 57.5% of the variance in trophic position, with a root mean square error of 0.17. The three continuous variable inputs show well-defined trends. Trophic position declines with increasing catch (Figure 1B), increasing rates of regional sea surface temperature change (Figure 1D), and as fishery-dependent MTL declines (Figure 1C). The categorical variables (Figures 1E–G, location, basin, and species) all offer strong and comparable splitting power (Figure 1H), though little insight into the changing conditions effecting TP. In the leave-one-out cross validation (Figure 1H), root mean square error on the out-of-test sets averaged 0.18 with a 95% quantile range of 0.098-0.284. This range does highlight some sensitivity to stability of the specimen dataset, which may be improved in future studies with additional specimens. However, due to field logistics and laboratory costs, studies using CSIA-AA for similar purposes often employ a similar number of replicates as we have here (see methods). Importantly, however, our sensitivity analysis reveals the modeled signal is distinct from the sample variance.
Discussion
Seabirds as an Alternative Trophic Indicator
Does higher seabird trophic position describe a less-impacted ecosystem state? Birds at the Western Atlantic site had a significantly lower trophic position in both species we measured (Figure 1A). Our model indicates lower trophic positions at this site are consistent with chronically high fishing pressure, sea-surface warming, and low MTL of fisheries catch. Conversely, our South Pacific site had the highest measured trophic position, paired with low fishing pressure, a recent cooling trend, and high MTL in fisheries catch. Future studies that compare such questions across more extensive geographies and perhaps timelines may be able to decouple model factors, and better reveal the individual effects of climate and fisheries on MTL. Such an approach may provide testing beyond the hypotheses we generated observationally and refine some of the low-resolution signals we detected. Nonetheless, in accord with recent reviews (Estes et al., 2011), we have documented the trophic downgrading of two seabird species across a large spatial gradient and described possible contributing factors.
Trophic Position Dissimilarity in Space Appears to Reflect Declines Across Time
The regional differences we describe are consistent with a recent 130-years analysis of trophic position in seabirds from the Hawaiian Archipelago. In that study (Gagné et al., 2018), the ensemble trophic position for eight seabird species declined an average 0.32 units from 1891–2015. (Sooty tern declined by 0.30 and brown noddy by 0.09.) As trophic position may be a reliable metric to track ecosystem changes in one ecosystem over time, it may also reflect food web status across spatially distinct ecosystems. Given this, the contemporary trophic position decline we observe when comparing Florida to American Samoa (0.41) and Hawaii to American Samoa (0.33) is larger than the 130-years decline observed in Hawaii alone (Gagné et al., 2018). Compared more directly, however, the spatial gradient in trophic position between Florida and American Samoa equates to 161 years of change in Hawaii described by Gagné et al. (2018) in their seabird ensemble (−0.258 change in trophic position per century). When we constrain the benchmark to just the sooty tern and brown noddy data from the Hawaii study (−0.157 change per 100 years) the metric jumps to 264 years of change. If we make similar comparisons of our spatial gradient between Hawaii and Florida, those numbers are 34 and 56 years, respectively. Confirming previous studies (e.g., Fitzpatrick and Keegan, 2007; Jackson, 2008; Huettmann, 2012), this suggests historical overfishing and other anthropogenic impacts in Caribbean coastal ecosystems are significantly more advanced than in other tropical regions.
In sum, we reaffirm that seabirds are reliable indicators of marine systems, especially when we use of CSIA-AA to calculate their trophic position. Importantly, our findings align with the widely reported consensus that the Gulf of Mexico is a highly impacted ecosystem (Halpern et al., 2008). To utilize our approach while also improving upon our constrained sample, we suggest continued sampling of seabird feathers from museums and nesting colonies with negligible impacts to wild populations (strandings, fisheries interactions). Such a monitoring framework may better inform sampling and modeling needs for ecosystem-based management and decision making. Furthermore, the development of a larger sample with our approach will better elucidate the nature of covariates and their interactions. Active movement tracking and spatially explicit fishery data, combined with the tissue sampling approach here, may further inform these patterns (Cherel et al., 2016). Ultimately, it is becoming clearer that seabird trophic position varies cross space and time and that it reliably informs food web status, and particularly the far-reaching impacts from commercial fisheries extractions.
Data Availability Statement
Datasets analyzed for this study are included in the data repository at: osf.io/4s9ty.
Ethics Statement
This research was performed under USFWS permits #MB052060-0, MB180283-1 to KH. All research followed the Institutional Animal Care and Use Committee criteria under NOAA and HPU.
Author Contributions
KVH and SP designed the study. All authors collected and prepared data. TG and KVH analyzed the data, prepared the figures, and wrote the manuscript. All authors reviewed the manuscript.
Funding
This work was supported in part by a Presidential Early Career Award for Scientists and Engineers (PECASE) to KVH.
Conflict of Interest Statement
The authors declare that the research was conducted in the absence of any commercial or financial relationships that could be construed as a potential conflict of interest.
Acknowledgments
C. Yarnes performed the CSIA-AA analyses. V. Lam provided fishery data from the Sea Around Us database. A. Copenhaver and E. Schick provided logistical support. F. Huettman, P. Renaud, and several reviewers improved earlier versions of this manuscript.
Supplementary Material
The Supplementary Material for this article can be found online at: https://www.frontiersin.org/articles/10.3389/fmars.2018.00317/full#supplementary-material
References
Archer, K. J., and Kimes, R. V. (2008). Empirical characterization of random forest variable importance measures. Comp. Stat. Data Anal. 52, 2249–2260. doi: 10.1016/j.csda.2007.08.015
Cherel, Y., Quillfeldt, P., Delord, K., and Weimerskirch, H. (2016). Combination of at-sea activity, geolocation and feather stable isotopes documents where and when seabirds molt. Front. Ecol. Evol. 4:3. doi: 10.3389/fevo.2016.00003
Chikaraishi, Y., Ogawa, N. O., Kashiyama, Y., Takano, Y., Suga, H., Tomitani, A., et al. (2009). Determination of aquatic food-web structure based on compound-specific nitrogen isotopic composition of amino acids. Limnol. Oceanogr. 7, 740–750. doi: 10.4319/lom.2009.7.740
Essington, T. E., Beaudreau, A. H., and Wiedenmann, J. (2006). Fishing through marine food webs. Proc. Natl. Acad. Sci. U.S.A. 103, 3171–3175. doi: 10.1073/pnas.0510964103
Estes, J. A., Terborgh, J., Brashares, J. S., Power, M. E., Berger, J., Bond, W. J., et al. (2011). Trophic downgrading of planet earth. Science 333, 301–306. doi: 10.1126/science.1205106
Fitzpatrick, S. M., and Keegan, W. F. (2007). Human impacts and adaptations in the caribbean Islands: an historical ecology approach. Earth Environ. Sci. Trans. R. Soc. Edinburgh 98, 29–45. doi: 10.1017/S1755691007000096
Gagné, T. O., Hyrenbach, K. D., Hagemann, M. E., and Van Houtan, K. S. (2018). Trophic signatures of seabirds suggest shifts in oceanic ecosystems. Sci. Adv. 4:eaao3946. doi: 10.1126/sciadv.aao3946
Goldstein, A., Kapelner, A., Bleich, J., and Pitkin, E. (2015). J. Comput. Graph. Stat. 24, 44–65. doi: 10.1080/10618600.2014.907095
Greenland, S., Senn, S. J., Rothman, K. J., Carlin, J. B., Poole, C., Goodman, S. N., et al. (2016). Statistical tests, P values, confidence intervals, and power: a guide to misinterpretations. Eur. J. Epidemiol. 31, 337–350. doi: 10.1007/s10654-016-0149-3
Halpern, B. S., Walbridge, S., Selkoe, K. A., Kappel, C. V., Micheli, F., D’agrosa, C., et al. (2008). A global map of human impact on marine ecosystems. Science 319, 948–952. doi: 10.1126/science.1149345
Hamann, A., Roberts, D. R., Barber, Q. E., Carroll, C., and Nielsen, S. E. (2015). Velocity of climate change algorithms for guiding conservation and management. Global Change Biol. 21, 997–1004. doi: 10.1111/gcb.12736
Hebshi, A. J., Duffy, D. C., and Hyrenbach, K. D. (2008). Associations between seabirds and subsurface predators around Oahu. Hawaii. Aquat. Biol. 4, 89–98. doi: 10.3354/ab00098
Holt, E. A., and Miller, S. W. (2011). Bioindicators: using organisms to measure environmental impacts. Nat. Educ. Knowl. 3:8.
Huettmann, F. (2012). From europe to north america into the world and atmosphere: a short review of global footprints and their impacts and predictions. Environmentalist 32, 289–295. doi: 10.1007/s10669-011-9338-5
Hunsicker, M. E., Kappel, C. V., Selkoe, K. A., Halpern, B. S., Scarborough, C., Mease, L., et al. (2016). Characterizing driver–response relationships in marine pelagic ecosystems for improved ocean management. Ecol. Appl. 26, 651–663. doi: 10.1890/14-2200
Jackson, J. B. (2008). Ecological extinction and evolution in the brave new ocean. Proc. Natl. Acad. Sci. U.S.A. 105, 11458–11465. doi: 10.1073/pnas.0802812105
Link, J. S., Yemane, D., Shannon, L. J., Coll, M., Shin, Y.-J., Hill, L., et al. (2009). Relating marine ecosystem indicators to fishing and environmental drivers: an elucidation of contrasting responses. ICES J. Mar. Sci. 67, 787–795. doi: 10.1093/icesjms/fsp258
Lyday, S. E., Ballance, L. T., Field, D. B., and Hyrenbach, K. D. (2015). Shearwaters as ecosystem indicators: towards fishery-independent metrics of fish abundance in the California current. J. Mar. Syst. 146, 109–120. doi: 10.1016/j.jmarsys.2014.08.010
Nielsen, J. M., Popp, B. N., and Winder, M. (2015). Meta-analysis of amino acid stable nitrogen isotope ratios for estimating trophic position in marine organisms. Oecologia 178, 631–642. doi: 10.1007/s00442-015-3305-7
O’Malley, J. M., Drazen, J. C., Popp, B. N., Gier, E., and Toonen, R. J. (2012). Spatial variability in growth and prey availability of lobsters in the northwestern hawaiian Islands. Mar. Ecol. Prog. Ser. 449, 211–220. doi: 10.3354/meps09533
Ostrom, P. H., Wiley, A. E., James, H. F., Rossman, S., Walker, W. A., Zipkin, E. F., et al. (2017). Broad-scale trophic shift in the pelagic North Pacific revealed by an oceanic seabird. Proc. R. Soc. B Lond. Biol. 284:20162436. doi: 10.1098/rspb.2016.2436
Pauly, D. (2007). The sea around US project: documenting and communicating global fisheries impacts on marine ecosystems. AMBIO 36, 290–295. doi: 10.1579/0044-7447(2007)36[290:TSAUPD]2.0.CO;2
Pauly, D., Christensen, V., Dalsgaard, J., Froese, R., and Torres, F. (1998). Fishing down marine food webs. Science 279, 860–863. doi: 10.1126/science.279.5352.860
Pauly, D., Hilborn, R., and Branch, T. A. (2013). Fisheries: does catch reflect abundance? Nature 494, 303–306. doi: 10.1038/494303a
Peavey, L. E., Popp, B. N., Pitman, R. L., Gaines, S. D., Arthur, K. E., Kelez, S., et al. (2017). Opportunism on the high seas: foraging ecology of olive ridley turtles in the eastern Pacific Ocean. Front. Mar. Sci. 4:348. doi: 10.3389/fmars.2017.00348
Popp, B. N., Graham, B. S., Olson, R. J., Hannides, C. C., Lott, M. J., López-Ibarra, G. A., et al. (2007). Insight into the trophic ecology of yellowfin tuna, Thunnus albacares, from compound-specific nitrogen isotope analysis of proteinaceous amino acids. Terres. Ecol. 1, 173–190. doi: 10.1016/S1936-7961(07)01012-3
Reed, J., Shannon, L., Velez, L., Akoglu, E., Bundy, A., Coll, M., et al. (2016). Ecosystem indicators—accounting for variability in species’ trophic levels. ICES J. Mar. Sci. J. Conseil 74, 158–169. doi: 10.1093/icesjms/fsw150
Sullivan, G. M., and Feinn, R. (2012). Using effect size—or why the P value is not enough. J. Graduate Med. Educ. 4, 279–282. doi: 10.4300/JGME-D-12-00156.1
Van Houtan, K. S., Halley, J. M., and Marks, W. (2015). Terrestrial basking sea turtles are responding to spatio-temporal sea surface temperature patterns. Biol. Lett. 11:20140744. doi: 10.1098/rsbl.2014.0744
Keywords: trophic ecology, commercial fisheries, ocean memory, global change, machine learning, stable isotopes, food webs
Citation: Gagné TO, Hyrenbach KD, Hagemann ME, Bass OL, Pimm SL, MacDonald M, Peck B and Van Houtan KS (2018) Seabird Trophic Position Across Three Ocean Regions Tracks Ecosystem Differences. Front. Mar. Sci. 5:317. doi: 10.3389/fmars.2018.00317
Received: 21 May 2018; Accepted: 20 August 2018;
Published: 07 September 2018.
Edited by:
Paul E. Renaud, Akvaplan-niva, NorwayReviewed by:
Chih-hao Hsieh, National Taiwan University, TaiwanAntony William Diamond, University of New Brunswick, Canada
Copyright © 2018 Gagné, Hyrenbach, Hagemann, Bass, Pimm, MacDonald, Peck and Van Houtan. This is an open-access article distributed under the terms of the Creative Commons Attribution License (CC BY). The use, distribution or reproduction in other forums is permitted, provided the original author(s) and the copyright owner(s) are credited and that the original publication in this journal is cited, in accordance with accepted academic practice. No use, distribution or reproduction is permitted which does not comply with these terms.
*Correspondence: Tyler O. Gagné, dGdhZ25lQG1iYXlhcS5vcmc=