 Jan Taucher1*
 Javier Arístegui2
 Lennart T. Bach1
 Wanchun Guan3
 María F. Montero2
 Alice Nauendorf1
 Eric P. Achterberg1
 Ulf Riebesell1
- 1GEOMAR Helmholtz Centre for Ocean Research Kiel, Kiel, Germany
- 2Instituto de Oceanografía y Cambio Global, Universidad de Las Palmas de Gran Canaria, Las Palmas, Spain
- 3Department of Marine Biotechnology, School of Laboratory Medicine and Life Science, Wenzhou Medical University, Wenzhou, China
The subtropical oceans are home to the largest phytoplankton biome on the planet. Yet, little is known about potential impacts of ocean acidification (OA) on phytoplankton community composition in the vast oligotrophic ecosystems of the subtropical gyres. To address this question, we conducted an experiment with 9 in situ mesocosms (~35 m3) off the coast of Gran Canaria in the eastern subtropical North Atlantic over a period of 9 weeks. By establishing a gradient of pCO2 ranging from ~350 to 1,025 μatm, we simulated carbonate chemistry conditions as projected until the end of the twenty-first century. Furthermore, we injected nutrient-rich deep water into the mesocosms halfway through the experiment to simulate a natural upwelling event, which regularly leads to patchy nutrient fertilization in the study region. The temporal developments of major taxonomic groups of phytoplankton were analyzed by flow cytometry, pigment composition and microscopy. We observed distinct shifts in phytoplankton community structure in response to high CO2, with markedly different patterns depending on nutrient status of the system. Phytoplankton biomass during the oligotrophic phase was dominated by picocyanobacteria (Synechococcus), which constituted 60–80% of biomass and displayed significantly higher cell abundances at elevated pCO2. The addition of deep water triggered a substantial bloom of large, chain-forming diatoms (mainly Guinardia striata and Leptocylindrus danicus) that dominated the phytoplankton community during the bloom phase (70–80% of biomass) and until the end of the experiment. A CO2 effect on bulk diatom biomass became apparent only in the highest CO2 treatments (>800 μatm), displaying elevated concentrations especially in the stationary phase after nutrient depletion. Notably, these responses were tightly linked to distinct interspecific shifts within the diatom assemblage, particularly favoring the largest species Guinardia striata. Other taxonomic groups contributed less to total phytoplankton biomass, but also displayed distinct responses to OA treatments. For instance, higher CO2 favored the occurrence of prymnesiophyceae (Phaeocystis globosa) and dictyochophyceae, whereas dinoflagellates were negatively affected by increasing CO2. Altogether, our findings revealed considerable shifts in species composition in response to elevated CO2 and/or lower pH, indicating that phytoplankton communities in the subtropical oligotrophic oceans might be profoundly altered by ocean acidification.
Introduction
Oceanic uptake of anthropogenic CO2 leads to pronounced shifts in seawater carbonate chemistry and a decrease in pH, a process commonly termed “ocean acidification” (OA) (Wolf-Gladrow and Riebesell, 1997; Caldeira and Wickett, 2003).
Intensive research efforts over the past decade have demonstrated that OA can substantially influence the physiological performance of marine phytoplankton (Riebesell and Tortell, 2011; Dutkiewicz et al., 2015). A wealth of laboratory studies, mostly with single species cultures, has shown highly variable physiological sensitivities of taxa to changing carbonate chemistry. Such differential sensitivities to OA could alter phytoplankton species composition and succession patterns, with important implications for entire pelagic food webs.
Following these considerations, more recent work has illuminated how OA effects manifest themselves on the level of ecological communities by investigating CO2-sensitivities of entire plankton communities in larger volume incubations (up to 80 m3) under close-to-natural conditions (Riebesell et al., 2013; Gazeau et al., 2016).
Most of these studies have reported pronounced effects of simulated OA on plankton communities in different ocean regions, e.g., in the Arctic Ocean, several locations in subpolar temperate waters and in the Mediterranean Sea (Bach et al., 2017; Maugendre et al., 2017; Schulz et al., 2017). These studies demonstrated that OA may lead to distinct “winners and losers” within the plankton community, sometimes with wider-reaching impacts on higher trophic levels and biogeochemical cycles (Sswat et al., 2018; Stange et al., 2018).
However, geographical coverage of such studies is still sparse and to date virtually nothing is known about OA impacts on phytoplankton communities in the oligotrophic regions of the subtropical ocean. These vast “ocean deserts” cover more than 60% of the ocean surface area, making them the largest ecosystem in the surface ocean (Longhurst et al., 1995; McClain et al., 2004). Physical conditions are typically characterized by a nutrient-poor surface layer, which is separated from deeper nutrient-rich waters by a strong and almost permanent thermocline. As a result, primary production (per unit surface area) in these waters is usually low-yet, their immense size makes the contribution of oligotrophic waters to global primary production significant (Signorini et al., 2015).
However, despite generally low nutrient levels, (sub-)mesoscale phenomena like eddies frequently inject nutrients into the surface layer, thus stimulating biological productivity in oligotrophic oceans worldwide (Mahadevan, 2016; McGillicuddy, 2016). Such local increases in chlorophyll and primary production associated with nutrient pumping in eddies have been also reported from the subtropical ocean in the Canary Current System, where mesoscale variability is particularly intense (Arístegui et al., 1997; Sangra et al., 2009; Schütte et al., 2016).
Predicting how the subtropical oligotrophic ocean will respond to climate change remains very difficult: One the one hand, increasing temperatures are expected to result in an expansion of oligotrophic gyres due to stronger thermal stratification (Polovina et al., 2008; Bopp et al., 2013). On the other hand, future changes in wind patterns as a result of global warming are predicted to increase upwelling-favorable winds in Eastern Boundary Current Systems, which would also lead to an increase of eddy kinetic energy and associated upward pumping of nutrients in these regions (Bakun, 1990; García-Reyes et al., 2015; Xiu et al., 2018).
Considering the global importance of subtropical oligotrophic ocean ecosystems and our sparse knowledge about their potential responses to OA, the goal of the present study was to investigate how increasing CO2 and lower pH affect phytoplankton community composition in these oceanic regions. The experiment was designed in a way, that allowed us to investigate phytoplankton responses to OA during oligotrophic periods as well as under the influence of patchy nutrient fertilization typical of the study region. The present study complements the findings of a companion paper in this Frontiers Research Topic, which addresses the effects of OA on size fractionated PP and biomass (Hernández-Hernández et al., 2018).
Materials and Methods
Mesocosm Experiment Set Up
We conducted a pelagic in situ experiment with large-volume mesocosms in Gando Bay, Gran Canaria for a period of 62 days from September to December 2014.
The setup consisted of nine pelagic mesocosms (M1–M9), each extending to a depth of 15 m (13 m bag and 2 m conical sediment trap attached to the bottom of the bag) and enclosing about 35 m3 of the natural water column (Riebesell et al., 2013; Taucher et al., 2017). One mesocosm (M6) was lost due to irreparable damage a few days after deep-water addition, and was thus excluded from analysis in the present study.
The mesocosms were treated with different amounts of CO2-enriched seawater following the method described in Riebesell et al. (2013). Briefly, natural seawater was enriched with pure CO2 in a large mixing tank, filled into 20 L bottles and added to the mesocosms with a special distribution device (“spider”), that allows distributing the water uniformly within a radius of ~1 m. By constantly pulling the spider up and down inside the mesocosms, we ensured homogenous CO2 enrichment throughout the entire water columns. CO2 enrichment was carried out at the beginning of the experiment, and two more times (day 22 and 38) to maintain carbonate chemistry within target levels. Based on these CO2 manipulations, we simulated various scenarios of OA, i.e., seawater carbonate chemistry conditions that are within RCP pathways projected until the end of the twenty-first century (IPCC, 2014). Average pCO2 during the experiment ranged between ~350 and 1,000 μatm in the different mesocosms (Table 1).
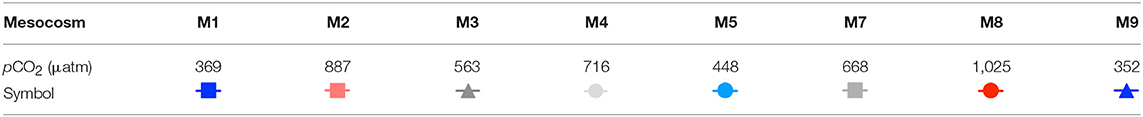
Table 1. pCO2 treatment of mesocosms (average over the study period), as well as symbols and color-code for figures.
After an oligotrophic phase of almost 4 weeks, we used a specifically developed deep-water collector to obtain ~85 m3 of nutrient-rich deep water (from 650 m depth) and by addition to the mesocosms simulate an upwelling event typical for the study region. Therefore, we replaced ~20% of the mesocosms' volumes with deep water during the night of day 24–25. Deep water addition had only a marginal effect on the carbonate system, with in the control mesocosms pCO2 in the control mesocosms increasing by a maximum of 40 μatm.
Based on the timing of deep-water addition and the temporal development of chlorophyll a, the experiment can be divided into three distinct phases: (I) the oligotrophic phase until t23, (II) the phytoplankton bloom between t25 and t35, and (III) the post-bloom phase from t37 until the end of the study. For a comprehensive description of experimental design and technical details, please refer to Taucher et al. (2017).
Sample Collection and Measurements
Phytoplankton Community Composition
Samples for phytoplankton were collected every second day with a custom-built pump system that created a gentle vacuum (< 150 mbar) and allowed for depth-integrated samples that rapidly collect large volumes of water distributed evenly throughout the water column of the mesocosms.
Subsamples for chlorophyll a (Chl a) and other phytoplankton pigments were collected onto glass fiber filters (GF/F Whatman, pore size: 0.7 μm) and analyzed by reverse-phase high-performance liquid chromatography (HPLC) on a Thermo Scientific HPLC Ultimate 3000 as described in Taucher et al. (2017). Contributions of individual phytoplankton groups to total Chl a were then estimated using the CHEMTAX software, which classifies phytoplankton based on taxon-specific pigment ratios (Mackey et al., 1996). Applied pigment ratios corresponded to those of the original work by Mackey et al. (1996).
We used three different flow cytometers to optimize coverage of the wide size spectrum of phytoplankton cells and particles during our study. Size classes are based on previously examined relationships between forward or sideward scatter and cell size and should thus be considered as an approximation. Furthermore, we differentiated between phytoplankton groups based on their patters in plots of forward or side scatter (FSC or SSC) vs. red (FL3) and orange (FL2) fluorescence.
Presented data for Prochlorococcus, Synechococcus and picoeukaryotes (<2 μm) were obtained by analyzing subsamples of seawater (about 1 ml) with a FACScalibur (Becton and Dickinson) flow cytometer. Nanophytoplankton (2–20 μm) was enumerated with an Accuri C6 (BD Biosciences) from 650 μl subsamples. Microphytoplankton (>20 μm), including large chain-forming diatoms were counted with a Cytosense system (subsample ~10 ml; Dubelaar and Gerritzen, 2000). Note that counting single diatom cells within a chain with the pulse-shape approach of the Cytosense was not successful during our study. Thus, our counts represent the number of diatom chains (and single cells) rather than the total abundance of diatom cells.
Samples for microscopy were obtained every 4 days, fixed with acidic Lugol solution and analyzed using the Utermöhl technique (Utermöhl, 1958), with classification until the lowest possible taxonomic level (species or genus). Biovolume for the different diatom species were calculated based on measurements of cell length and width (approximately 50 cells measured per species) and subsequent conversion into volume assuming cylindrical geometry for the present species (Menden-Deuer and Lessard, 2000).
Carbonate Chemistry and Nutrients
Partial pressure of aqueous CO2 (pCO2) was derived from total alkalinity and dissolved inorganic carbon using CO2SYS (Pierrot et al., 2006). Inorganic nutrients + , , and Si(OH)4 were determined colorimetrically following Murphy and Riley (1962) and Hansen and Koroleff, 1999). Ammonium () was fluorometrically measured following Holmes et al. (1999). For a more detailed description of these measurements see Taucher et al. (2017).
Statistical Analysis
To examine potential effects of OA on the abundance and biomass of the different phytoplankton taxa, we applied simple linear regression analysis. Therefore, we computed temporal averages of the datasets for the different experimental phases (see above), using the respective average pCO2 as the explanatory variable. Statistical significance was assumed for p < 0.05.
Results
Phase I: Oligotrophic Conditions
During the oligotrophic phase with low nutrient concentrations (Figure 1), chl a concentrations of the different phytoplankton groups remained consistently low, fluctuating around a total ~0.1 μg L−1 until day 23 (Figure 2). Based on CHEMTAX analysis of pigment composition and flow cytometry, biomass of the phytoplankton community was dominated by picocyanobacteria (Synechococcus), which constituted 70–80% of total chl a in the mesocosms. Comparison of temporal patterns and treatment differences between flow cytometry and pigment-based CHEMTAX analysis revealed that cyanobacteria biomass was almost exclusively composed of Synechococcus (Figures 2, 3). Prochlorococcus was present (~104-105 cells ml−1) only during the first few days of the experiment, but disappeared from the mesocosms around day 10 (Supplementary Material). The remaining biomass during this period was mainly composed of prymnesiophytes (identified as Phaeocystis globosus), dinoflagellates, and diatoms, which increased in biomass from day 15 onwards (Figure 2).
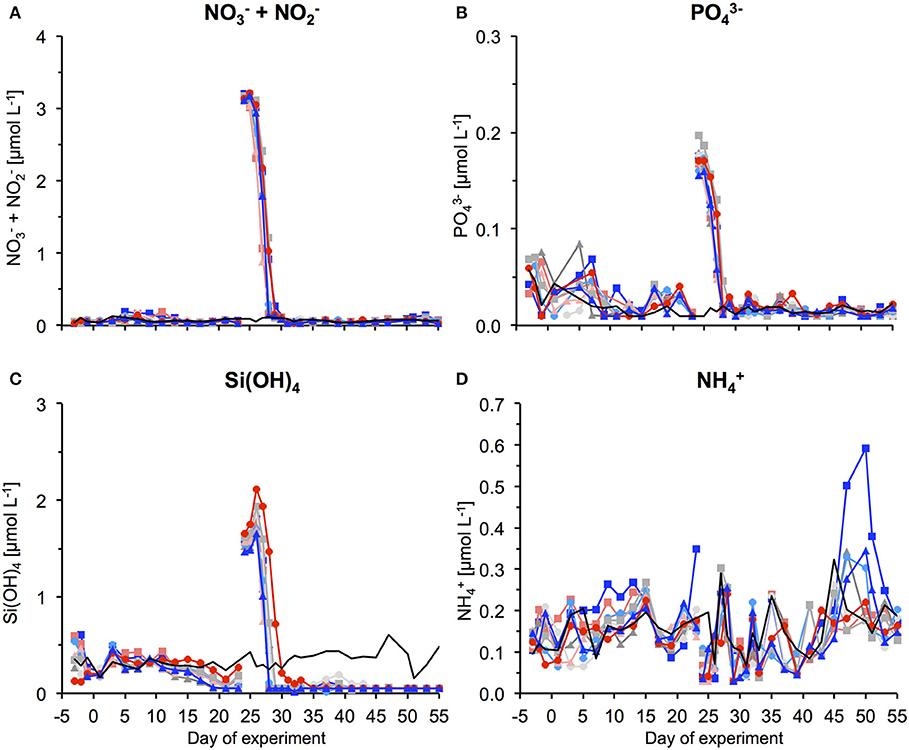
Figure 1. Inorganic nutrient concentrations over the course of the study. (A) + , (B) , (C) Si(OH)4, and (D) . The gap and associated change in concentrations between t23 and t25 denotes addition of nutrient-rich deep water to the mesocosms. For color code see Table 1. Thin black line without symbols shows conditions in water surrounding the mesocosms.
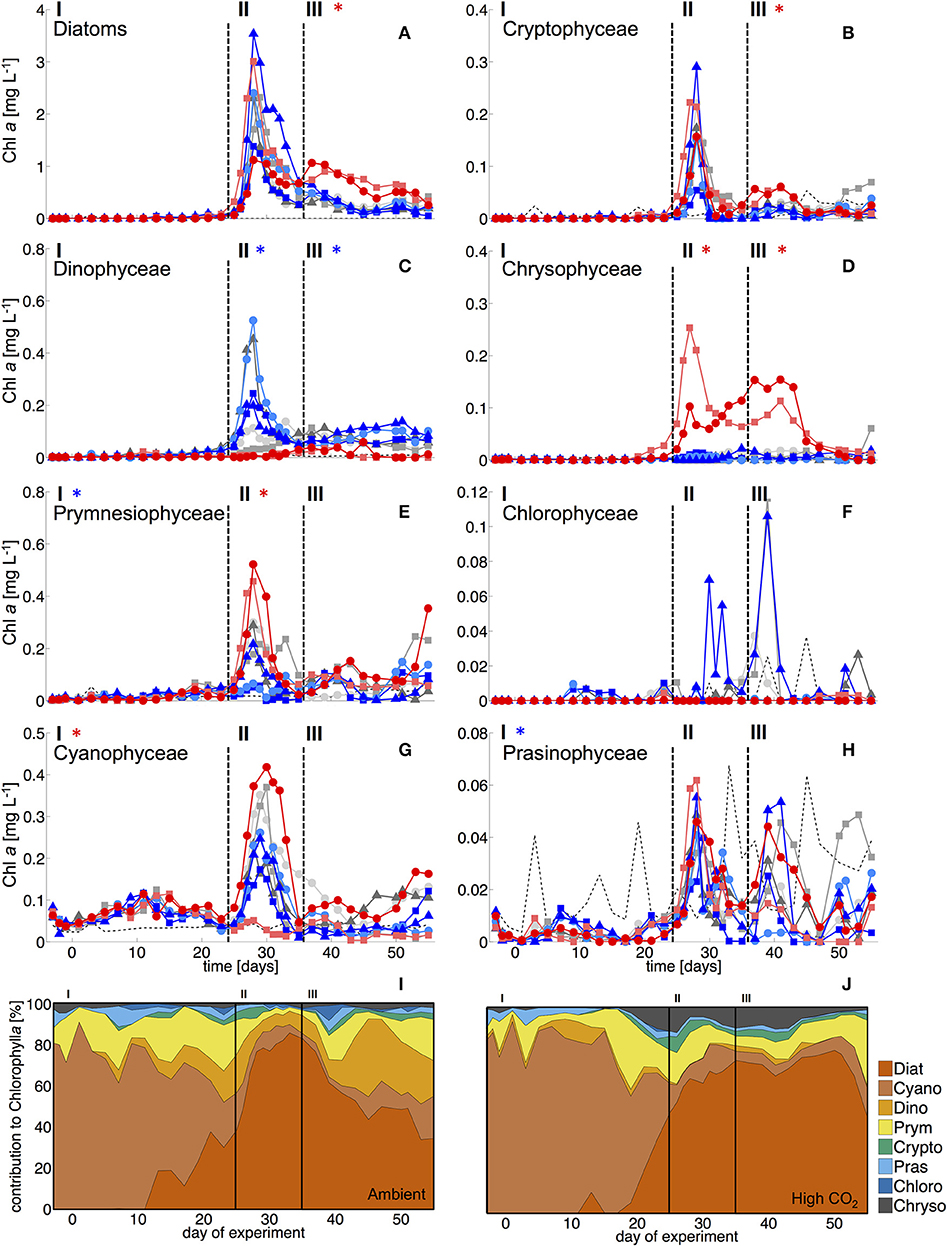
Figure 2. Biomass of phytoplankton groups based on pigment analysis and CHEMTAX. Dashed vertical lines denote different experimental phases (I-III, see section Methods). (A) Diatoms, (B) Cryptophyceae, (C) Dinophyceae, (D) Chrysophyceae (mainly reflecting the signal of the Dictyochophycea Vicicitus globosus), (E) Prymnesiophyceae (mostly Phaeocystis globosus), (F) Chlorophyceae, (G) Cyanophyceae (mostly Synechococcus), and (H) Prasinophyceae. Asterisks denote statistically significant effect of CO2 during this phase (red = positive, blue = negative). (I, J) Relative composition of total phytoplankton chl a under (I) ambient CO2 (M1, M9) and (J) in the high CO2 mesocosms (M2, M8).
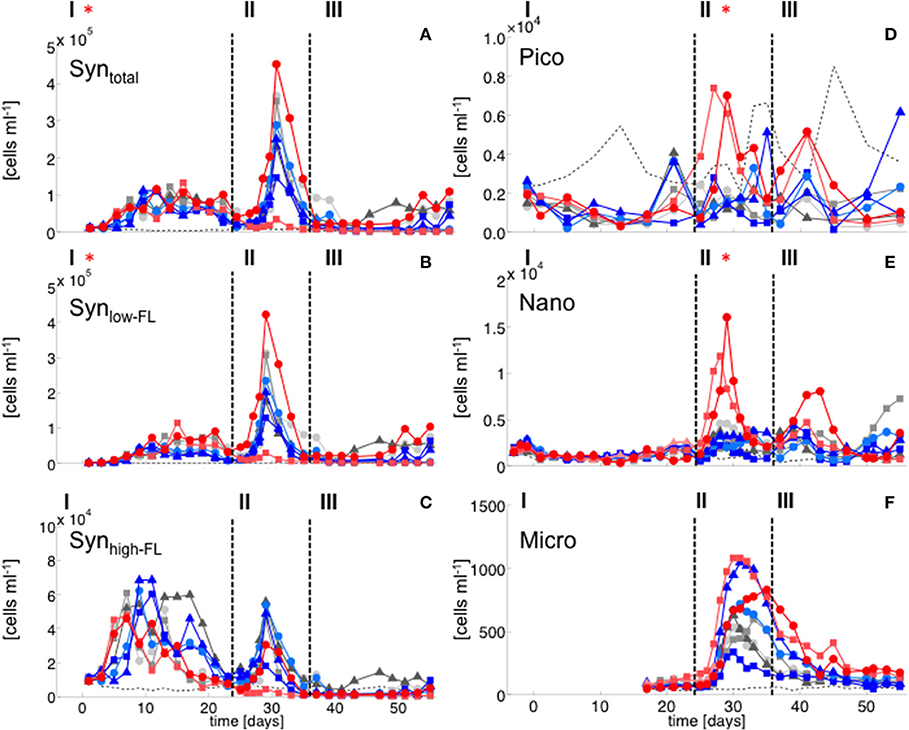
Figure 3. Flow cytometry. (A) Synechococcus total, (B) Synechococcus low fluorescence cluster, (C) Synechococcus high fluorescence cluster, (D) Picoeukaryotes, (E) Nanophytoplankton, (F) Microphytoplankton. Color code and symbols as in Figure 2.
Elevated CO2 significantly increased the abundance and biomass of Synechococcus under oligotrophic conditions, as indicated by flow cytometry and pigment analysis (Tables 2, 3). We could distinguish between two distinct Synechococcus populations based on their fluorescence patterns in flow cytometry analysis. We here refer to them as the high and low fluorescence populations (high-FL and low-FL). While both populations were similarly abundant (between 20,000 and 40,000 cells ml−1), they clearly differed in their response to CO2: while the high-FL cluster did not show a statistically significant response to CO2 (but a rather negative trend), the cell densities of the low-FL population were significantly enhanced with increasing CO2 (Figures 3A–C).
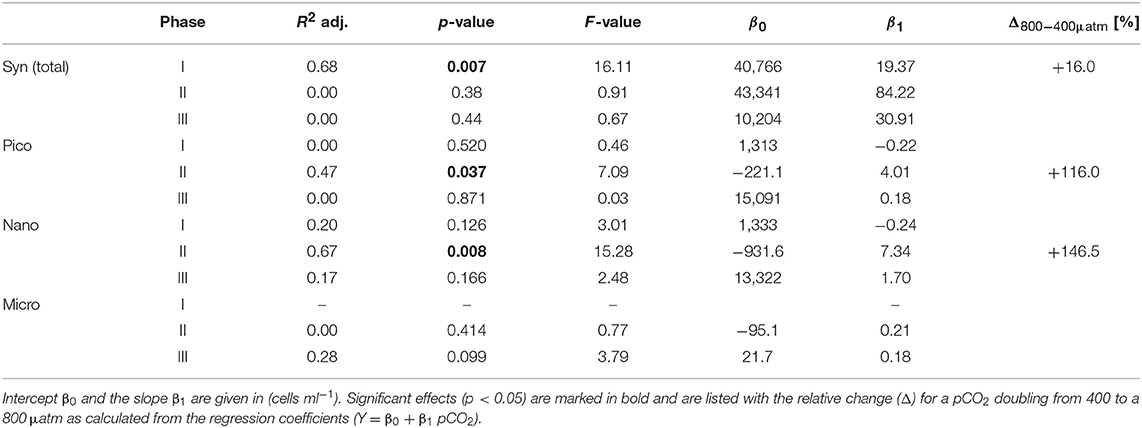
Table 2. Results of linear regression for CO2 effects on phytoplankton groups based on flow cytometry.
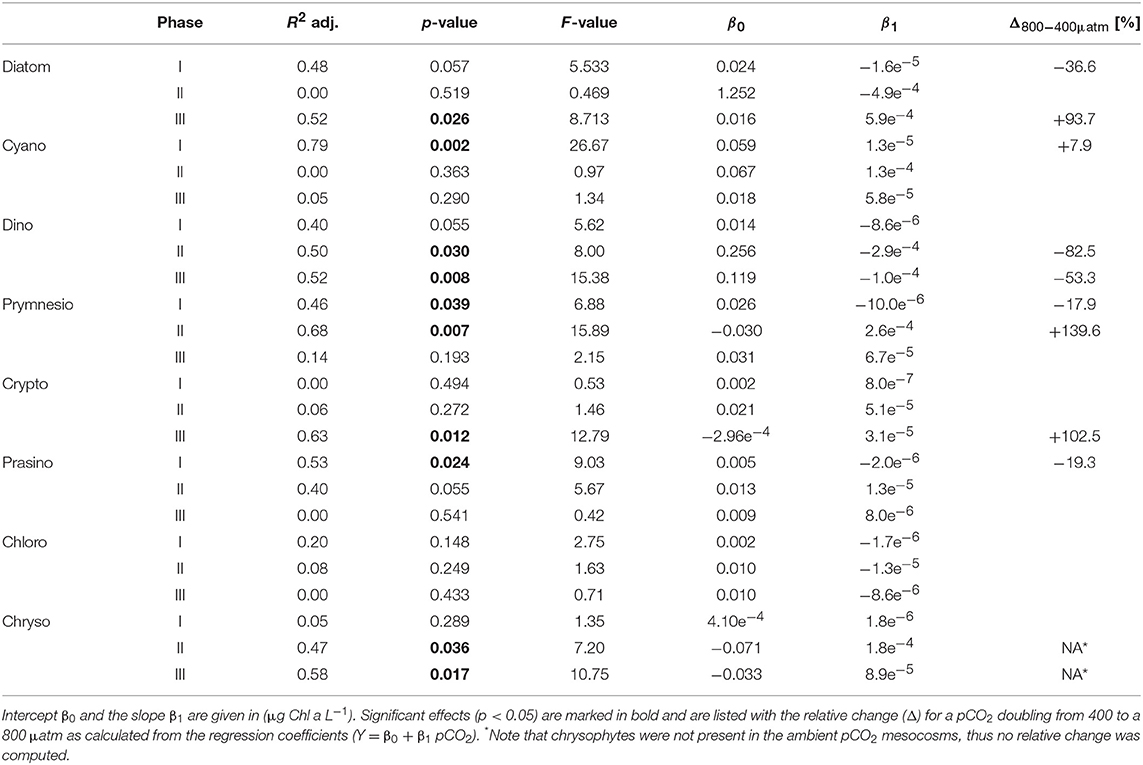
Table 3. Results of linear regression for CO2 effects on phytoplankton groups based on pigment analysis (HPLC) and CHEMTAX.
Most other groups did not display a response to CO2 treatments during oligotrophic conditions, except for prymnesiophytes, which were negatively affected by increasing CO2 during this phase I (Table 3).
Phase II: Phytoplankton Bloom
By addition of deep water, inorganic nutrients concentrations were increased to 3.15, 0.17, and 1.60 μmol L−1 for , , and Si(OH)4, respectively (Figure 1). In response to this nutrient fertilization, a phytoplankton bloom developed rapidly, visible both by a sharp increase in chl a concentrations and corresponding increases in cell numbers counted by flow cytometry and microscopy (Figures 2–5).
With the development of the bloom, the phytoplankton community quickly shifted toward the dominance of diatoms, which constituted up to 80% of total biomass (Figure 2). The most important species were Guinardia striata, Leptocylindrus danicus, Bacteriastrum delicatulum, and Nitzschia sp. Guinardia striata dominated the diatom community in terms of biovolume, constituting ~50 to >90% of diatom biovolume throughout the study (Figure 4).

Figure 4. Diatom community composition derived from microscopy. Abundance of (A) Guinardia striata, (B) Leptocylindrus danicus, (C) Bacteriastrum delicatulum, and (D) Nitzschia sp. Color code and symbols as in Figure 2. (E,F): relative contribution of different taxa to total diatom biovolume under (E) ambient CO2 (M1, M9) and (F) in the high CO2 mesocosms (M2, M8).
The peak in diatom biomass (based on CHEMTAX) was reached on day 28 in all mesocosms, i.e., only 3 days after deep-water addition and declined steadily until day 35, when biomass started to fluctuate around post-bloom levels. The bloom peak was somewhat delayed for larger microphytoplankton (counted by flow cytometry) and the dominant diatom species in particular. Here, highest abundances were reached between day 30 and 40 (Figures 3F, 4).
The abundance and biomass of other phytoplankton groups also increased substantially during the bloom, with some groups also displaying significant responses to CO2. Data from flow cytometry indicated that abundances of pico- and nanophytoplankton increased with elevated CO2 (Figure 3; Table 2).
Furthermore, analysis of CHEMTAX data revealed positive CO2 effects on prymnesiophytes and chyrsophytes (Table 3). Microscopy and visual inspection of sediment trap material indicated high (but very patchy) abundances of Phaeocystis globosa colonies. Since this species is usually identified as a prymnesiophyte in CHEMTAX analysis (Mackey et al., 1996; Zapata et al., 2004), this suggests that this species also dominated the signal and CO2 effect on this group in our study. Chrysophyte biomass consisted mainly of Vicicitus globosus (dictyochophycea). Species of this group have long been classified as chrysophyceae and have only recently been ordered into a separate taxonomic class (actinochrysophyceae; Mikrjukov and Patterson, 2001; Lee, 2008). Yet, based on their pigment signature, particularly the marker pigment 19′-butanoyloxyfucoxanthin (Chang et al., 2012), they are still identified as chrysophyceae in CHEMTAX analysis.
In contrast, dinoflagellate biomass was significantly lower under high CO2 conditions, not even indicating any signs of population growth in the highest treatments. This pattern was visible both in bulk dinoflagellate biomass (Figure 2), as well as for individual taxa (Figure 5).
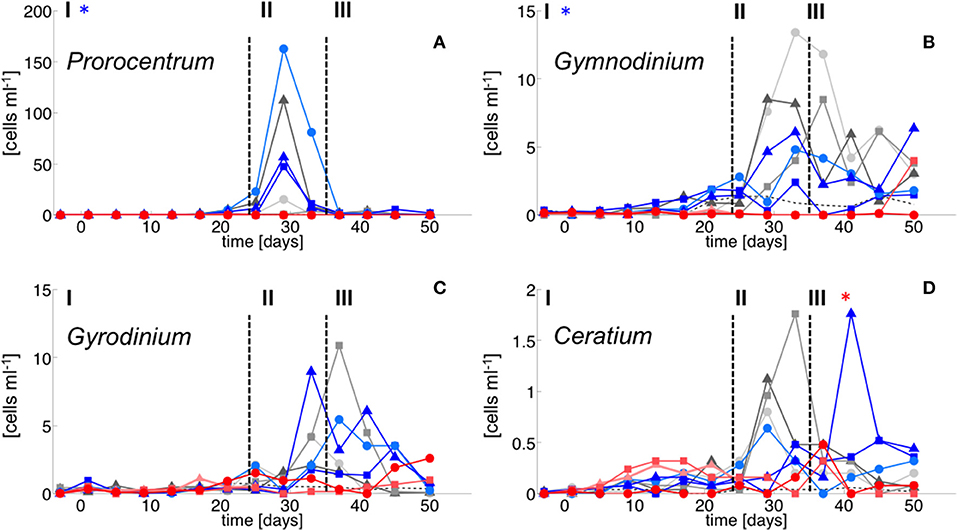
Figure 5. Dinoflagellate species abundance. (A) Prorocentrum minimum, (B) Gymnodinium sp., (C) Gyrodinium sp. and (D) Cetratium pentagonum. Color code and symbols as in Figure 2.
Diatoms, the dominant group during the phytoplankton bloom, did not display a clear response to CO2 in terms of bulk biomass based on CHEMTAX analysis. However, microscopic analysis revealed differential CO2 effects on the various diatom species. Guinardia striata abundances were significantly elevated in the high CO2 mesocosms, whereas a negative CO2 effect was detected for Leptocylindrus (Figure 4; Table 4). As a consequence, the composition of the diatom assemblage shifted substantially in response to increasing CO2, with Guinardia striata being virtually the only species present in noticeable numbers in the high CO2 mesocosms (Figures 4E,F).
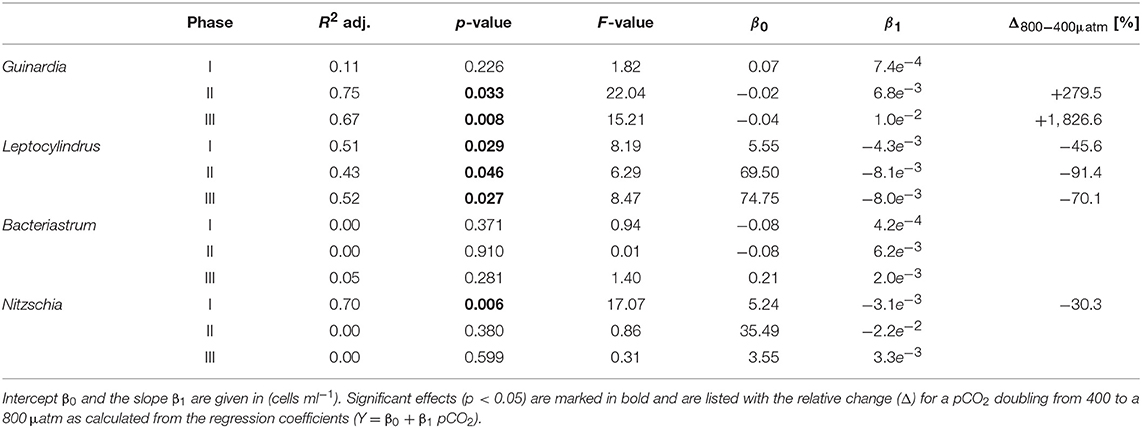
Table 4. Results of linear regression for CO2 effects on diatom species counted by light microscopy.
Phase III: Post-bloom
The CO2-related patterns in phytoplankton composition that emerged during the bloom prevailed during most of the post-bloom phase. During this period, the CO2 effect on diatoms also manifested itself in bulk diatom biomass derived from CHEMTAX: In the high CO2 mesocosms diatom biomass was significantly elevated compared to ambient conditions (by about 2-fold) until the end of the experiment (Figure 3). This pattern was mostly driven by the Guinardia striata, which strongly dominated the biomass of diatoms and overall phytoplankton in the high CO2 treatments (Figure 4). This trend was also visible in the microphytoplankton group (based on flow cytometry), although slightly non-significant (Figure 3; Table 2). Besides diatoms, the most prominent treatment effect during the post-bloom phase was the persisting negative CO2 effect on dinoflagellates, which remained almost absent under high CO2 conditions (Figure 2; Table 5).
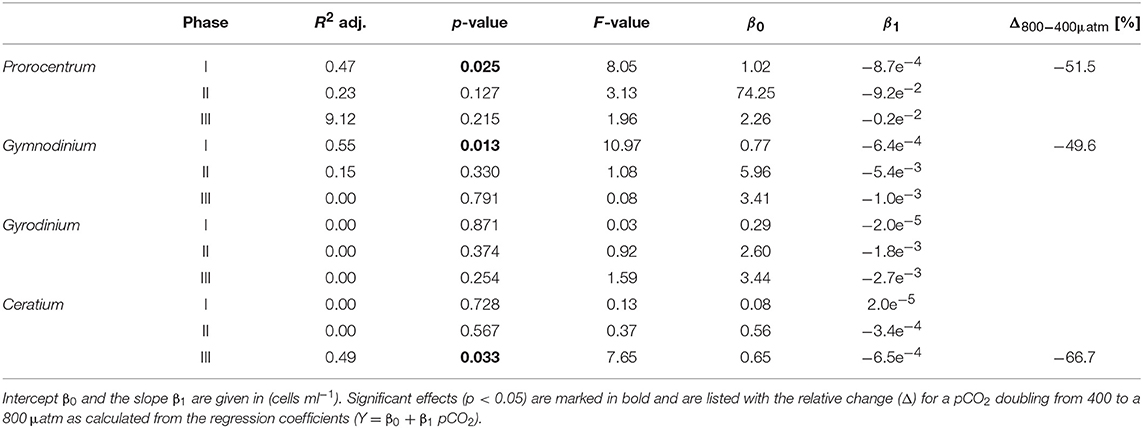
Table 5. Results of linear regression for CO2 effects on dinoflagellate species counted by light microscopy.
Discussion
Response of Individual Phytoplankton Taxa to Simulated Ocean Acidification—Physiological Drivers and the Potential Role of Zooplankton Grazing
Synechococcus
During the oligotrophic (N-limited) phase until day 24, cyanophyceae (almost exclusively Synechococcus) dominated the phytoplankton community and displayed a distinct positive response to simulated OA (Figures 2, 3; Tables 2, 3). This observation is consistent with laboratory-based experiments by Fu et al. (2007), who found increased net growth rates of Synechococcus at high CO2. Other studies have reported more variable effects of OA conditions on Synechococcus (Lomas et al., 2012; Bach et al., 2017; Schulz et al., 2017). Besides differences in the experimental setup (e.g., nutrient replete vs. deplete conditions, N vs. P limitation), the most likely explanation for these variable responses of Synechococcus to CO2 is the enormous intraspecific diversity within this taxon (Hunter-Cevera et al., 2016). Even in our study, we could distinguish between two clearly distinct Synechococcus clusters based on their fluorescence (FL) properties in flow cytometry analysis, likely resulting from differences in light adaptation. While the high-FL (low light adapted) cluster had lower abundances and displayed a rather negative CO2 trend, the low-FL (high light adapted) constituted the majority of the overall population and also drove the positive response to CO2 during the oligotrophic phase (Figure 3).
Since abundances of micro- and mesozooplankton did not display any CO2 effects during this period (Algueró et al., in review), it seems unlikely that indirect effects mediated by grazing can explain the observed patterns. Thus, a fertilizing effect of CO2 on the growth rate of Synechococcus seems to be the most likely explanation for our results.
Dictyochophyceae
As described in the Results section, chrysophyte biomass consisted mainly of Vicicitus globosus (dictyochophycea), which occurred in considerably higher abundances in the high CO2 mesocosms. Possible explanations and implications for the food web are discussed in a separate paper (Riebesell et al., in review). However, for the scope of the present study, it should be noted that Vicicitus globosus is known as a harmful algal bloom (HAB) species that produces hemolytic cytotoxins (Chang, 2015) and may thus have affected mixotrophic phytoplankton (see Discussion on dinoflagellates below). However, direct toxic effects on other phytoplankton seem very unlikely, as most groups did not show a negative response in mesocosms with high CO2 (M2 and M8) that would match the patterns of chrysophyceae biomass (i.e., Vicicitus globosus), and diatoms and prymnesiophyceae even reached highest biomass concentrations in the high CO2 treatments (Figure 3, 4).
Diatoms
Starting with the bloom onset on day 25, diatoms began to dominate phytoplankton biomass for the rest of the experiment. While no treatment-related differences were detectable during the bloom phase (II), diatom biomass was significantly elevated in the high CO2 mesocosms in the post-bloom phase (III), displaying a much longer retention of biomass in the water column than under ambient conditions. These observations are consistent with previous evidence, which found CO2 effects on diatom population densities to be most pronounced under post-bloom conditions when nutrients were exhausted (Taucher et al., 2015).
The effect of simulated OA on bulk diatom biomass in our experiment, was tightly coupled to distinct taxonomic shifts within the diatom assemblage. Most prominently, elevated CO2 had a significant positive effect of on cell densities of the dominant species Guinardia striata, a taxon that forms twisted chains from relatively large-sized cells (~170 × 17 μm in this study). In contrast, abundances of Leptocylindrus danicus (~30 × 7 μm) were highest in the ambient CO2 treatment and decreased significantly with increasing CO2 (Figure 4). A direct negative physiological effect seems unlikely, since previous studies have rather reported positive effects of CO2 on this taxon (Reul et al., 2014; Tatters et al., 2018). Thus, it seems more likely that Leptocylindrus danicus was outcompeted by Guinardia striata, possibly because the latter benefitted stronger from CO2 fertilization and could therefore take up a large portion of nutrients after deep-water addition. In that sense, our findings are consistent with previous theoretical and experimental studies, which predicted that increasing CO2 would affect larger species more than smaller ones (Wolf-Gladrow and Riebesell, 1997; Wu et al., 2014; Taucher et al., 2015). The reason is that larger cells (with lower surface-to-volume ratios) can rely less on diffusive uptake of CO2 and thus need to invest more resources into carbon concentrating mechanisms (CCM). Elevated CO2 can increase the proportion of diffusive carbon uptake, in turn leading to a down-regulation of CCMs and accelerated growth (Giordano et al., 2005).
Clearly, the possible role of an indirect CO2 effect mediated by grazing cannot be excluded, as micro- and mesozooplankton abundances were lower in the high CO2 treatments during the bloom and early post-bloom phase (Algueró et al, in review). For the dominant species Guinardia striata, its large cell and chain size and the relatively small size of zooplankton during the experiment (mainly copepods < 1 mm) make it unlikely that abundances of this diatom species were strongly affected by mesozooplankton grazing. However, it is possible that top-down control to some extent influenced the population size of the smaller species Leptocylindrus danicus before and/or during the bloom stage, thus keeping their abundance lower and thereby indirectly favoring the proliferation of Guinardia striata.
Altogether, our findings suggest that increasing CO2 might have highly variable effects on the competitive capabilities of different diatom species, which may ultimately translate into substantial taxonomic shifts during diatom blooms with ongoing OA.
Prymnesiophyceae (Phaeocystis Globosa)
During the phytoplankton bloom, Phaeocystis globosa formed large colonies (several mm in diameter) that were very patchily distributed within the water column. Moreover, part of their biomass was present as colonies temporarily attached to the mesocosm walls, a phenomenon that has been observed previously for this species (Rousseau et al., 2007). Thus, quantifying their abundance by microscopy was not possible. However, earlier studies have shown that Phaeocystis globosa taxa possess a characteristic pigment signature, particularly with respect to the accessory pigment 19′-hexanoyloxyfucoxanthin and its content relative to the more common fucoxanthin (Vaulot et al., 1994; Zapata et al., 2004). Thus, based on CHEMTAX analysis and visual inspection of Phaeocystis globosa colonies, we are confident that most biomass classified as prymnesiophyceae was constituted by Phaeocystis globosa in our study.
In our experiment, prymnesiophyceae formed a substantial bloom with considerably elevated biomass with increasing CO2 (see Figure 2E). Although occurrences of Phaeocystis taxa are rather uncommon at low latitudes (Vogt et al., 2012), occasional blooms in subtropical waters have been observed previously, particularly after upwelling events (Long et al., 2007). In terms of potential OA impacts, previous work has found subtle to moderate increases of physiological rates and colony formation of Phaeocystis globosa at elevated CO2 (Rost et al., 2003; Wang et al., 2010). Thus, similar to CO2 effects on other phytoplankton types during our experiment, beneficial effects of CO2 fertilization are the most obvious explanation for the proliferation of prymnesiophyceae (i.e., Phaeocystis globosa) under simulated OA conditions.
Indirect CO2 effects by grazing may have contributed to this pattern to some extent. However, as mentioned earlier, a large portion Phaeocystis globosa biomass was present in the form of large colonies during our study. The formation of such colonies has been demonstrated to act as a defense strategy, i.e., reducing feeding pressure by size-selective grazers (Jakobsen and Tang, 2002). Therefore, a strong indirect CO2 effect through zooplankton grazing seems unlikely in our study.
Dinoflagellates
Dinoflagellates are a diverse taxonomic group of eukaryotes which acquire energy through photosynthesis or heterotrophy, or a combination of both known as mixotrophy (Stoecker et al., 2017). Our data on dinoflagellate biomass are based on their contribution to chl a (based on CHEMTAX), thus considering auto- and mixotrophic taxa with a pigment composition characteristic for Dinophyceae, particularly regarding the marker pigment peridinin (Mackey et al., 1996). Accordingly, this pigment-based approach excludes heterotrophic species and likely also a large portion of mixotrophic (non-peridinin containing) species that acquire kleptochloroplasts from other phytoplankton.
Notably, dinoflagellates were the only phytoplankton group displaying a clear negative response to high CO2 throughout the study. This trend emerged already during the oligotrophic phase (although borderline non-significant, Table 3), prevailing and even amplifying throughout the bloom and entire post-bloom phase (see regression slopes in Table 3). In fact, the development of a dinoflagellate bloom or even an increase in population densities was not detectable in the high CO2 mesocosms (M2 and M8), which largely drove the CO2 effect detected by linear regression.
Microscopic counts suggested that dinoflagellate biomass was mainly comprised of Prorocentrum minimum, Gyrodinium sp., Gymnodinium sp, and Ceratium pentagonum. Since these taxa also contain peridinin they probably constituted most of the CHEMTAX signal. Indeed, temporal patterns and the low abundances of dinoflagellates in the high CO2 mesocosms appear very similar between CHEMTAX data and microscopic counts of these species (Figures 2, 5). On a species basis, linear regression detected significant effects only for some taxa and time periods, mainly because the CO2 effect appeared very non-linear, being mostly driven by the high CO2 mesocosms (M2 and M8).
Based on previous empirical evidence, it seems unlikely that the strongly reduced dinoflagellate numbers under high CO2 were driven by a direct physiological effect. In fact, most laboratory studies so far have reported dinoflagellates to be resilient or rather benefit from increasing pCO2 (Fu et al., 2008; Eberlein et al., 2014).
Furthermore, differences in grazing pressure by mesozooplankton cannot explain the observed pattern, as mesozooplankton abundances were lowest in the high CO2 treatments. Thus, one would have expected the opposite pattern.
Considering that all dinoflagellate taxa examined in our study are known to be mixotrophic (Stoecker, 1999; Stoecker et al., 2017), it seems more likely that dinoflagellates were indirectly affected by elevated CO2 via food-web effects. The presence of toxic Vicicitus globosus cells (classified as chrysophyceae by CHEMTAX), which occurred only in the high CO2 mesocosms may have impaired the growth of dinoflagellates. Laboratory-based experiments have demonstrated that Vicicitus globosus can have cytotoxic effects (i.e., lysis) on other microalgae, including dinoflagellates (Chang, 2015). Furthermore, there is some evidence that Phaeocystis globosa can have similar toxic effects (Peng et al., 2005). Since CO2 had also a positive effect on Phaeocystis globosa biomass, this may have further contributed to the decline of mixotrophic dinoflagellates under OA conditions. However, the fact that CO2 trends on dinoflagellates were mainly driven by the two mesocosms with highest CO2 (M2 and M8) rather points toward growth inhibition by Vicicitus. globosus, which was only present in these two mesocosms.
Conclusion
Our in situ mesocosm experiment provides the first evidence of OA impacts on phytoplankton community structure in the subtropical oligotrophic ocean. Under typical nutrient-poor and low chl a conditions, Synechococcus dominated phytoplankton biomass and seemed to profit from simulated OA. The phytoplankton bloom that developed after deep-water addition was strongly dominated by diatoms, which were retained much longer in the water column under OA conditions. These patterns were the result of distinct taxonomic shifts within the diatom assemblage, with a clear tendency toward larger species (here Guinardia striata) benefitting from increasing CO2. Considering that other taxa (Phaeocystis globosa, dictyochophyceae, dinoflagellates) were also significantly affected by increasing pCO2, the overall phytoplankton community composition, including bulk chl a biomass, was considerably altered by simulated OA. Notably, some of the high CO2/low pH effects observed during the bloom emerged already during the oligotrophic phase and were then amplified by nutrient fertilization (e.g., the negative effect on dinoflagellates). So far, there have been only few studies that investigated the response of plankton communities to OA under nutrient-poor conditions. Evidence from this earlier work is contrasting: Mesocosm studies in the Mediterranean Sea reported phytoplankton communities to be rather resilient to increasing pCO2, with no effects on total biomass and only subtle changes in taxonomic composition (Maugendre et al., 2017). However, these studies were rather short (12–20 days), and other recent work has shown that it may take more than a month until OA effect manifest themselves on the community level (Bach et al., 2017). In fact, other studies found ecological impacts of OA to be even more pronounced under nutrient-depleted conditions than during blooms (Paul et al., 2015; Sala et al., 2015; Bach et al., 2016). Our findings from the subtropical eastern North Atlantic are in support of the latter, indicating that phytoplankton communities in these regions might undergo distinct taxonomic shifts in response to increasing CO2. If our findings from this experiment hold true on larger spatial and temporal scales, then we can expect phytoplankton community composition in the subtropical oligotrophic ocean to be considerably altered by ongoing OA over the coming decades.
Author Contributions
UR, JT, LB, JA, and EA: conceived and designed the experiment. All authors performed the experiment and analyzed the data. JT with input from all co-authors wrote the paper.
Funding
This study was supported by the German Federal Ministry of Science and Education (BMBF) in the framework of the BIOACID II project (FKZ 03F06550). UR received additional funding from the Leibniz Award 2012 by the German Research Foundation (DFG). JA was supported by a Helmholtz International Fellow Award, 2015 (Helmholtz Association, Germany). JA and MM benefited also from the FLUXES project (CTM2015-69392-C3-1-R) funded by the Spanish government (Plan Nacional I + D).
Conflict of Interest Statement
The authors declare that the research was conducted in the absence of any commercial or financial relationships that could be construed as a potential conflict of interest.
Acknowledgments
We would like to thank the KOSMOS and the Plataforma Oceánica de Canarias (PLOCAN) teams assisting with all aspects of the organization and logistical support before, during and after this mesocosms campaign. Furthermore, we thank the captain and crew of RV Hesperides for deploying and recovering the mesocosms (cruise 29HE20140924), and RV Poseidon for transporting the mesocosms and support in collecting deep water during cruise POS463.
Supplementary Material
The Supplementary Material for this article can be found online at: https://www.frontiersin.org/articles/10.3389/fmars.2018.00330/full#supplementary-material
References
Arístegui, J., Tett, P., Hernandez-Guerra, A., Basterretxea, G., Montero, M. F., Wild, K., et al. (1997). The influence of island-generated eddies on chlorophyll distribution: A study of mesoscale variation around Gran Canaria. Deep-Sea Res. Part I Oceanogr. Res. Papers 44, 71–96. doi: 10.1016/S0967-0637(96)00093-3
Bach, L. T., Alvarez-Fernandez, S., Hornick, T., Stuhr, A., and Riebesell, U. (2017). Simulated ocean acidification reveals winners and losers in coastal phytoplankton. PLoS ONE 12:e0188198. doi: 10.1371/journal.pone.0188198
Bach, L. T., Taucher, J., Boxhammer, T., Ludwig, A., Achterberg, E. P., Algueró-Muñiz, M., et al. (2016). Influence of ocean acidification on a natural winter-to-summer plankton succession: first insights from a long-term mesocosm study draw attention to periods of low nutrient concentrations. PLoS ONE 11:e0159068. doi: 10.1371/journal.pone.0159068
Bakun, A. (1990). Global climate change and intensification of coastal ocean upwelling. Science 247, 198–201. doi: 10.1126/science.247.4939.198
Bopp, L., Resplandy, L., Orr, J. C., Doney, S. C., Dunne, J. P., Gehlen, M., et al. (2013). Multiple stressors of ocean ecosystems in the 21st century: projections with CMIP5 models. Biogeosciences 10, 6225–6245. doi: 10.5194/bg-10-6225-2013
Caldeira, K., and Wickett, M. E. (2003). Anthropogenic carbon and ocean pH. Nature 425, 365–365. doi: 10.1038/425365a
Chang, F. H. (2015). Cytotoxic effects of vicicitus globosus (Class Dictyochophyceae) and Chattonella marina (Class Raphidophyceae) on rotifers and other microalgae. J. Mar. Sci. Eng. 3, 401–411. doi: 10.3390/jmse3020401
Chang, F. H., McVeagh, M., Gall, M., and Smith, P. (2012). Chattonella globosa is a member of Dictyochophyceae: reassignment to Vicicitus gen. nov., based on molecular phylogeny, pigment composition, morphology and life history. Phycologia 51, 403–420. doi: 10.2216/10-104.1
Dubelaar, G. B. J., and Gerritzen, P. L. (2000). CytoBuoy: a step forward towards using flow cytometry in operational oceanography. Sci. Mar. 64, 255–265. doi: 10.3989/scimar.2000.64n2255
Dutkiewicz, S., Morris, J. J., Follows, M. J., Scott, J., Levitan, O., Dyhrman, S. T., et al. (2015). Impact of ocean acidification on the structure of future phytoplankton communities. Nat. Clim. Change Adv. 5, 1002–1006 doi: 10.1038/nclimate2722
Eberlein, T., Van de Waal, D. B., and Rost, B. (2014). Differential effects of ocean acidification on carbon acquisition in two bloom-forming dinoflagellate species. Physiol. Plant. 151, 468–479. doi: 10.1111/ppl.12137
Fu, F. X., Warner, M. E., Zhang, Y. H., Feng, Y. Y., and Hutchins, D. A. (2007). Effects of increased temperature and CO2 on photosynthesis, growth, and elemental ratios in marine Synechococcus and Prochlorococcus (Cyanobacteria). J. Phycol. 43, 485–496. doi: 10.1111/j.1529-8817.2007.00355.x
Fu, F. X., Zhang, Y. H., Warner, M. E., Feng, Y. Y., Sun, J., and Hutchins, D. A. (2008). A comparison of future increased CO2 and temperature effects on sympatric Heterosigma akashiwo and Prorocentrum minimum. Harmful Algae 7, 76–90. doi: 10.1016/j.hal.2007.05.006
García-Reyes, M., Sydeman, W. J., Schoeman, D. S., Rykaczewski, R. R., Black, B. A., Smit, A. J., et al. (2015). Under pressure: climate change, upwelling, and eastern boundary upwelling ecosystems. Front. Mar. Sci. 2:109. doi: 10.3389/fmars.2015.00109
Gazeau, F., Sallon, A., Maugendre, L., Louis, J., Dellisanti, W., Gaubert, M., et al. (2016). First mesocosm experiments to study the impacts of ocean acidification on plankton communities in the NW Mediterranean Sea (MedSeA project). Estuarine Coast. Shelf Sci. 186, 11–29. doi: 10.1016/j.ecss.2016.05.014
Giordano, M., Beardall, J., and Raven, J. A. (2005). CO2 concentrating mechanisms in algae: mechanisms, environmental modulation, and evolution. Annu. Rev. Plant Biol. 56, 99–131. doi: 10.1146/annurev.arplant.56.032604.144052
Hansen, H. P., and Koroleff, F. (1999). “Determination of nutrients,” in Methods of Seawater Analysis. eds K. Grasshoff, K. Kremling, and M. Ehrhardt (Weinheim: Wiley-VCH Verlag GmbH), 159–228.
Hernández-Hernández, N., Bach, L. T., Montero, M. F., Taucher, J., Baños, I., Guan, W., et al. (2018). High CO2 under nutrient fertilization increases primary production and biomass in subtropical phytoplankton communities: a mesocosm approach. Front. Mar. Sci. 5:213. doi: 10.3389/fmars.2018.00213
Holmes, R. M., Aminot, A., Kerouel, R., Hooker, B. A., and Peterson, B. J. (1999). A simple and precise method for measuring ammonium in marine and freshwater ecosystems. Can. J. Fish. Aquat. Sci. 56, 1801–1808. doi: 10.1139/f99-128
Hunter-Cevera, K. R., Post, A. F., Peacock, E. E., and Sosik, H. M. (2016). Diversity of Synechococcus at the Martha's vineyard coastal observatory: insights from culture isolations, clone libraries, and flow cytometry. Microb. Ecol. 71, 276–289. doi: 10.1007/s00248-015-0644-1
IPCC (2014). Climate Change 2013: The Physical Science Basis. Working Group I Contribution to the Fifth Assessment Report of the Intergovernmental Panel on Climate Change. Cambridge; New York, NY: Cambridge University Press.
Jakobsen, H. H., and Tang, K. W. (2002). Effects of protozoan grazing on colony formation in Phaeocystis globosa (Prymnesiophyceae) and the potential costs and benefits. Aquat. Microb. Ecol. 27, 261–273. doi: 10.3354/ame027261
Lee, R. E. (2008). “Heterokontophyta, dictyochophyceae,” in Phycology. ed R. E. Lee (Cambridge: Cambridge University Press), 359–364.
Lomas, M. W., Hopkinson, B. M., Losh, J. L., Ryan, D. E., Shi, D. L., Xu, Y., et al. (2012). Effect of ocean acidification on cyanobacteria in the subtropical North Atlantic. Aquat. Microb. Ecol. 66, 211–222. doi: 10.3354/ame01576
Long, J. D., Frischer, M. E., and Robertson, C. Y. (2007). A phaeocystis globosa bloom associated with upwelling in the subtropical South Atlantic Bight. J. Plankton Res. 29, 769–774. doi: 10.1093/plankt/fbm058
Longhurst, A. R., Sathyendranath, S., Platt, T., and Caverhill, C. (1995). An estimate of global primary production in the ocean from satellite radiometer data. J. Plankton Res. 17, 1245–1271. doi: 10.1093/plankt/17.6.1245
Mackey, M. D., Mackey, D. J., Higgins, H. W., and Wright, S. W. (1996). CHEMTAX–a program for estimating class abundances from chemical markers: application to HPLC measurements of phytoplankton. Mar. Ecol. Prog. Ser. 144, 265–283. doi: 10.3354/meps144265
Mahadevan, A. (2016). “The impact of submesoscale physics on primary productivity of plankton,” in Annual Review of Marine Science, Vol. 8, eds C. A. Carlson, and S. J. Giovannoni (Palo Alto, CA: Annual Reviews), 161–184.
Maugendre, L., Guieu, C., Gattuso, J. P., and Gazeau, F. (2017). Ocean acidification in the Mediterranean Sea: pelagic mesocosm experiments. A synthesis. Estuarine Coast. Shelf Sci. 186, 1–10. doi: 10.1016/j.ecss.2017.01.006
McClain, C. R., Signorini, S. R., and Christian, J. R. (2004). Subtropical gyre variability observed by ocean-color satellites. Deep Sea Res. Part II Topical Stud. Oceanogr. 51, 281–301. doi: 10.1016/j.dsr2.2003.08.002
McGillicuddy, D. J. (2016). “Mechanisms of physical-biological-biogeochemical interaction at the oceanic mesoscale,” in Annual Review of Marine Science, Vol. 8. eds C. A. Carlson, S. J. Giovannoni (Palo Alto, CA: Annual Reviews), 125.
Menden-Deuer, S., and Lessard, E. J. (2000). Carbon to volume relationships for dinoflagellates, diatoms, and other protist plankton. Limnol. Oceanogr. 45, 569–579. doi: 10.4319/lo.2000.45.3.0569
Mikrjukov, K. A., and Patterson, D. J. (2001). Taxonomy and phylogeny of heliozoa. III. Actinophryids. Acta Protozool. 40, 3–25.
Murphy, J., and Riley, J. P. (1962). A modified single solution method for the determination of phosphate in natural waters. Anal. Chim. Acta 27, 31–36. doi: 10.1016/S0003-2670(00)88444-5
Paul, A. J., Bach, L. T., Schulz, K. G., Boxhammer, T., Czerny, J., Achterberg, E. P., et al. (2015). Effect of elevated CO2 on organic matter pools and fluxes in a summer Baltic Sea plankton community. Biogeosciences 12, 6181–6203. doi: 10.5194/bg-12-6181-2015
Peng, X. C., Yang, W. D., Liu, J. S., Peng, Z. Y., Lu, S. H., and Ding, W. Z. (2005). Characterization of the hemolytic properties of an extract from Phaeocystis globosa Scherffel. J. Integr. Plant Biol. 47, 165–171. doi: 10.1111/j.1744-7909.2005.00039.x
Pierrot, D. E., Lewis, E., and Wallace, D. W. R. (2006). MS Excel Program Developed for CO2 System Calculations. ORNL/CDIAC-105a. Oak Ridge, TN: Carbon Dioxide Information Analysis Center, Oak Ridge National Laboratory, U.S. Department of Energy.
Polovina, J. J., Howell, E. A., and Abecassis, M. (2008). Ocean's least productive waters are expanding. Geophys. Res. Lett. 35, L0361. doi: 10.1029/2007GL031745
Reul, A., Munoz, M., Bautista, B., Neale, P. J., Sobrino, C., Mercado, J. M., et al. (2014). Effect of CO2, nutrients and light on coastal plankton. III. Trophic cascade, size structure and composition. Aquat. Biol. 22, 59–76. doi: 10.3354/ab00585
Riebesell, U., Czerny, J., von Brockel, K., Boxhammer, T., Budenbender, J., Deckelnick, M., et al. (2013). Technical note: a mobile sea-going mesocosm system–new opportunities for ocean change research. Biogeosciences 10, 1835–1847. doi: 10.5194/bg-10-1835-2013
Riebesell, U., and Tortell, P. D. (2011). “Effects of ocean acidification on pelagic organisms and ecosystems,” in Ocean Acidification. eds J. P. Gattuso, and L. Hansson (New York, NY: Oxford University Press), 99–121.
Rost, B., Riebesell, U., Burkhardt, S., and Sultemeyer, D. (2003). Carbon acquisition of bloom-forming marine phytoplankton. Limnol. Oceanogr. 48, 55–67. doi: 10.4319/lo.2003.48.1.0055
Rousseau, V., Chrétiennot-Dinet, M.-J., Jacobsen, A., Verity, P. G., and Whipple, S. (2007). The life cycle of Phaeocystis: state of knowledge and presumptive role in ecology. Biogeochemistry 83, 29–47. doi: 10.1007/s10533-007-9085-3
Sala, M. M., Aparicio, F. L., Balague, V., Boras, J. A., Borrull, E., Cardelus, C., et al. (2015). Contrasting effects of ocean acidification on the microbial food web under different trophic conditions. Ices J. Mar. Sci. 73, 670–679. doi: 10.1093/icesjms/fsv130
Sangra, P., Pascual, A., Rodriguez-Santana, A., Machin, F., Mason, E., McWilliams, J. C., et al. (2009). The canary eddy corridor: a major pathway for long-lived eddies in the subtropical North Atlantic. Deep Sea Res. Part I Oceanogr. Res. Papers 56, 2100–2114. doi: 10.1016/j.dsr.2009.08.008
Schulz, K. G., Bach, L. T., Bellerby, R. G. J., Bermúdez, R., Büdenbender, J., Boxhammer, T., et al. (2017). Phytoplankton blooms at increasing levels of atmospheric carbon dioxide: experimental evidence for negative effects on prymnesiophytes and positive on small picoeukaryotes. Front. Mar. Sci. 4:64. doi: 10.3389/fmars.2017.00064
Schütte, F., Brandt, P., and Karstensen, J. (2016). Occurrence and characteristics of mesoscale eddies in the tropical northeastern Atlantic Ocean. Ocean Sci. 12, 663–685. doi: 10.5194/os-12-663-2016
Signorini, S. R., Franz, B. A., and McClain, C. R. (2015). Chlorophyll variability in the oligotrophic gyres: mechanisms, seasonality and trends. Front. Mar. Sci. 2:1. doi: 10.3389/fmars.2015.00001
Sswat, M., Stiasny, M. H., Taucher, J., Algueró-Muñiz, M., Bach, L. T., Jutfelt, F., et al. (2018). Food web changes under ocean acidification promote herring larvae survival. Nat. Ecol. Evol. 2, 836–840. doi: 10.1038/s41559-018-0514-6
Stange, P., Taucher, J., Bach, L. T., Algueró-Muñiz, M., Horn, H. G., Krebs, L., et al. (2018). Ocean acidification-induced restructuring of the plankton food web can influence the degradation of sinking particles. Front. Mar. Sci. 5:140. doi: 10.3389/fmars.2018.00140
Stoecker, D. K. (1999). Mixotrophy among dinoflagellates. J. Eukaryotic Microbiol. 46, 397–401. doi: 10.1111/j.1550-7408.1999.tb04619.x
Stoecker, D. K., Hansen, P. J., Caron, D. A., Mitra, A., and Annual, R. (2017). Mixotrophy in the marine plankton. Annu. Rev. Mar. Sci. 9, 311–335. doi: 10.1146/annurev-marine-010816-060617
Tatters, A. O., Schnetzer, A., Xu, K., Walworth, N. G., Fu, F. X., Spackeen, J. L., et al. (2018). Interactive effects of temperature, CO2 and nitrogen source on a coastal California diatom assemblage. J. Plankton Res. 40, 151–164. doi: 10.1093/plankt/fbx074
Taucher, J., Bach, L. T., Boxhammer, T., Nauendorf, A., Consortium, T. G. C. K., Achterberg, E. P., et al. (2017). Influence of ocean acidification and deep water upwelling on oligotrophic plankton communities in the subtropical north atlantic: insights from an in situ mesocosm study. Front. Mar. Sci. 4:85. doi: 10.3389/fmars.2017.00085
Taucher, J., Jones, J., James, A., Brzezinski, M. A., Carlson, C. A., Riebesell, U., et al. (2015). Combined effects of CO2 and temperature on carbon uptake and partitioning by the marine diatoms Thalassiosira weissflogii and Dactyliosolen fragilissimus. Limnol. Oceanogr.60, 901–919. doi: 10.1002/lno.10063
Utermöhl, H. (1958). Zur Vervollkommnung Der Quantitativen Phytoplankton-Methodik. Stuttgart: Schweizerbart.
Vaulot, D., Birrien, J. L., Marie, D., Casotti, R., Veldhuis, M. J. W., Kraay, G. W., et al. (1994). Morphology, ploidy, pigment composition, and genome size of cultured strains of Phaeocystis (Prymnesiophyceae). J. Phycol. 30, 1022–1035. doi: 10.1111/j.0022-3646.1994.01022.x
Vogt, M., O'Brien, C., Peloquin, J., Schoemann, V., Breton, E., Estrada, M., et al. (2012). Global marine plankton functional type biomass distributions: phaeocystis spp. Earth Syst. Sci. Data 4, 107–120. doi: 10.5194/essd-4-107-2012
Wang, Y., Smith, W. O., Wang, X. D., and Li, S. S. (2010). Subtle biological responses to increased CO2 concentrations by Phaeocystis globosa Scherffel, a harmful algal bloom species. Geophys. Res. Lett. 37.doi: 10.1029/2010GL042666
Wolf-Gladrow, D., and Riebesell, U. (1997). Diffusion and reactions in the vicinity of plankton: a refined model for inorganic carbon transport. Mar. Chem. 59, 17–34. doi: 10.1016/S0304-4203(97)00069-8
Wu, Y., Campbell, D. A., Irwin, A. J., Suggett, D. J., and Finkel, Z. (2014). Ocean acidification enhances the growth rate of larger diatoms. Limnol. Oceanogr. 59, 1027–1034. doi: 10.4319/lo.2014.59.3.1027
Xiu, P., Chai, F., Curchitser, E. N., and Castruccio, F. S. (2018). Future changes in coastal upwelling ecosystems with global warming: the case of the California current system. Sci. Rep. 8:2866. doi: 10.1038/s41598-018-21247-7
Keywords: ocean acidification, phytoplankton, marine ecology, diatoms, oligotrophic oceans, upwelling, Canary Islands, subtropical North Atlantic
Citation: Taucher J, Arístegui J, Bach LT, Guan W, Montero MF, Nauendorf A, Achterberg EP and Riebesell U (2018) Response of Subtropical Phytoplankton Communities to Ocean Acidification Under Oligotrophic Conditions and During Nutrient Fertilization. Front. Mar. Sci. 5:330. doi: 10.3389/fmars.2018.00330
Received: 31 May 2018; Accepted: 28 August 2018;
Published: 20 September 2018.
Edited by:
Claire Mahaffey, University of Liverpool, United KingdomReviewed by:
Karin M. Björkman, University of Hawaii, United StatesJohn Patrick Dunne, Geophysical Fluid Dynamics Laboratory-NOAA, United States
Copyright © 2018 Taucher, Arístegui, Bach, Guan, Montero, Nauendorf, Achterberg and Riebesell. This is an open-access article distributed under the terms of the Creative Commons Attribution License (CC BY). The use, distribution or reproduction in other forums is permitted, provided the original author(s) and the copyright owner(s) are credited and that the original publication in this journal is cited, in accordance with accepted academic practice. No use, distribution or reproduction is permitted which does not comply with these terms.
*Correspondence: Jan Taucher, anRhdWNoZXJAZ2VvbWFyLmRl