 Sylke Wohlrab1,2*
 Jan M. Falcke3
 Senjie Lin4
 Huan Zhang4Stefan Neuhaus5Stephanie Elferink1Daniela Voss6
 Oliver Zielinski6
 Uwe John1,2
- 1Department of Ecological Chemistry, Alfred Wegener Institute, Helmholtz Centre for Polar and Marine Research, Bremerhaven, Germany
- 2Helmholtz Institute for Functional Marine Biodiversity, Oldenburg, Germany
- 3Department for Integrative Evolutionary Biology, Max Planck Institute for Developmental Biology, Tübingen, Germany
- 4Department of Marine Sciences, University of Connecticut, Groton, CT, United States
- 5Department of Scientific Computing and Bioinformatics, Alfred Wegener Institute, Helmholtz Centre for Polar and Marine Research, Bremerhaven, Germany
- 6Institute for Chemistry and Biology of the Marine Environment, University of Oldenburg, Oldenburg, Germany
Communities of microscopic dinoflagellates are omnipresent in aquatic ecosystems. Consequently, their traits drive community processes with profound effects on global biogeochemistry. Species traits are, however, not necessarily static but respond to environmental changes in order to maintain fitness and may differ with cell size that scales physiological rates. Comprehending such trait characteristics is necessary for a mechanistic understanding of plankton community dynamics and resulting biogeochemical impacts. Here, we used information theory to analyze metatranscriptomes of micro- and nano-dinoflagellate communities in three ecosystems. Measures of gene expression variations were set as a proxy to determine conserved and plastic community traits and the environmental influence on trait changes. Using metabarcoding, we further investigated if communities with a more similar taxon composition also express more similar traits. Our results indicate that plastic community traits mainly arise from membrane vesicle associated processes in all the environments we investigated. A specific environmental influence on trait plasticity was observed to arise from nitrogen availability in both size classes. Species interactions also appeared to be responsible for trait plasticity in the smaller-sized dinoflagellates. Additionally, the smaller-sized dinoflagellate communities are characterized by the expression of a large pool of habitat specific genes despite being taxonomically more similar across the habitats, in contrast to the microplanktonic assemblages that adapted to their environments by changing species composition. Our data highlight the functional diversification on the gene level as a signature of smaller sized dinoflagellates, nitrogen availability and species interactions as drivers of trait plasticity, and traits most likely linked to fitness and community performance.
Introduction
Marine plankton communities are at the interface between the atmosphere and ocean depths where their traits drive the exchange of elements and thereby fulfill key functions in global biogeochemical processes (Falkowski et al., 1998). The community traits of the plankton organisms, however, vary in space and time, mainly as a consequence of the interaction with the respective dynamic environmental conditions (Barton et al., 2013; Fuhrman et al., 2015). To gain a mechanistic and predictive understanding of the linkage from environmental regime shifts, trait changes, to community functional plasticity, it is imperative to understand the impact of environmental factors (abiotic and biotic) on potential plastic community traits and to identify traits most strongly linked to fitness and performance (Green et al., 2008). In accordance, there is a need for conceptualization of the traits given the complexity of marine plankton community processes (Barton et al., 2013; Worden et al., 2015).
Dinoflagellates are major components of the world oceans’ plankton that have evolved diverse lifestyles ranging from free-living planktonic species capable of photosynthesis, mixotrophs, and heterotrophs to symbiosis (herein defined as parasitic, mutualistic or commensal) (Hackett and Anderson, 2004; Taylor, 2004). Dinoflagellates are also culprits of harmful algal blooms that negatively impact ecosystem functioning and services (Kellmann et al., 2010; Anderson et al., 2012). As such, dinoflagellate communities are complex systems potentially with diverse trophic linkages to other plankton, with rich source of plasticity. Identifying and separating processes of the community that are conserved in different environments from plastic processes that vary with environmental conditions can be extremely helpful for understanding the ecological success of this lineage in a wide range of environments. Conserved processes or traits will most likely contribute similarly to overall community functions such as carbon export, energy and nutrient sequestration and transfer in different environments. The contribution of plastic traits to community processes yet may have greater consequences on the environmentally driven dynamics of biogeochemical processes. Furthermore, plastic traits are more likely to link to fitness and to feedback responses to local environmental condition changes (Barton et al., 2013).
Each community member’s trait expression in its environment is simultaneously influenced by its interactions with sympatric species and by resource available to sustain growth. These influences can manifest at the level of community structure or more subtly (but biogeochemically as significantly) at the level of biochemical network (Arrigo, 2005). While community species composition is easier to detect, the latter demands more complicated analyses such as gene expression profiling. Environmental influence may first alter gene expression pattern then cause species shift (Arrigo, 2005). At the molecular level, adaptation of a community to the respective environment can be achieved by (1) differential expression of conserved genes common in all members and (2) expression of species specific genes. Processes that do not differ in their gene expression across environments can indicate functional conservatism of the respective traits. Here, we used gene expression variation as a proxy to determine trait changes of three different dinoflagellate communities, and used high-throughput 18S rDNA sequencing to analyze the structures of the communities. Having both rDNA and mRNA sequences further allowed us to analyze the relationship between community diversity and functional diversity at the gene level. Size fractionation (into micro- and nano- assemblages) was performed to account for potential differences driven by cell size, as size is a master trait that constrains physiological rates (e.g., growth, metabolism, access to resources) and shapes the ecological niches of phytoplankton (Litchman and Klausmeier, 2008). The size fractionation would further provide information on the relatively underexplored nanoplankton size class of dinoflagellates (Le Bescot et al., 2016). For both size classes, we mapped functional groups of genes along a conservation-plasticity gradient to show the direction of trait changes (toward common functions or toward community-specific functions) and to interrogate whether the distribution of traits along the conservation-plasticity gradient is influenced by environmental factors or a potential inherent feature of the dinoflagellate communities. We further discuss potential evolutionary implications of size-dependent gene diversity and resulting trait expression.
Materials and Methods
Field Sampling for Environmental Parameters and Molecular Analysis
Field campaign was conducted on board R/V Heincke, covering three stations in the North Sea and Baltic Sea (Supplementary Figure S1) from May 30th to June 10th, 2011. Water samples were collected using Niskin bottles on a CTD rosette from 5, 10, and 12 m depths (Supplementary Figure S1). CTD casts were performed with a Seabird ‘sbe911+’ CTD probe with sampling rosette SBE32 (12 × 6 L Niskin bottles, onboard device). Live data acquisition was carried out via CTD-client onboard (Seasave V7.22) to locate chlorophyll maxima and data post-processing was done with Seasoft V2. Salinity and depth were calculated from pressure values according to UNESCO, and temperature was corrected to ITS-90 (Preston-Thomas, 1990). Metadata and hydrographic information are available at PANGEA (Rohardt and Cembella, 2012).
From water samples at the defined chlorophyll maxima, subsamples for nutrients (nitrate, nitrite, silicate) were taken in polypropylene bottles (50 mL) and frozen immediately at −25°C. Nutrient concentrations were analyzed within 3 months according to Grasshoff et al. (1999). Chlorophyll-a concentrations were determined from 500 to 1,500 mL of water samples filtered through Whatman GF/F filters (nominal pore size of 0.7 μm). The filtration was covered in dark and filters were frozen immediately at −80°C on board. Pigment extraction was done within 2 months by sonification of filters in 10 mL 90% acetone-water solution and incubation overnight at 4°C. The extract was centrifuged for 10 min at 3,020 × g. The fluorescence of the supernatant was determined at 665 nm using a Turner Designs TD–700 Laboratory Fluorometer. As reference, 90% acetone-water solution was used, computation of chlorophyll-a concentrations (μg/L) were done according to Arar (1997).
Water for the nanoplankton samples (size fraction from 3 to 20 μm) were collected from Niskin bottles at the defined chlorophyll maxima. Obtained seawater (∼5 L) was pre-filtered through a 20 μm Nitex mesh and 2 × 2 L vacuum filtered through 3 μm pore size polycarbonate filters (Merck Millipore, Billerica, MA, United States). Cells were rinsed off from each filter with 1.5 mL of 0.2 μm sterile filtered seawater (for DNA) or 1 mL TriReagent (Sigma-Aldrich, Steinheim, Germany) (for RNA) into 50 mL collection tubes. Samples for DNA were pelleted by centrifugation, re-suspended with Lysis Buffer (DNeasy Plant Mini Kit, Qiagen, Hilden, Germany), snap-frozen in liquid nitrogen and stored at −20°C till further use. RNA samples were transferred into a 2 mL collection tube containing acid washed glass beads, vortexed for ∼20 s, snap-frozen into liquid nitrogen and stored at −80°C until further use.
For the microplankton samples, 60 L of sea water were collected with a membrane pump (QBY-25- SS; AGB-Pumpen, Germany) from the depths with the highest chlorophyll a values and subsequently size fractionated by gravity filtration through Nitex meshes of 200, 50, and 20 μm. The 50–20 μm size fraction was back washed with 0.2 μm sterile filtered sea water into a 50 mL collection tube and split into two equivalent samples for DNA and RNA isolations. DNA samples were further processed as described above. RNA samples were centrifuged for 5 min and obtained pellets were re-suspended in 1 mL 60°C hot TriReagent (Sigma-Aldrich), transferred into a 2 mL collection tube containing acid washed glass beads, vortexed for ∼20 s, snap-frozen into liquid nitrogen and stored at −80°C until further use.
RNA Extraction, Library Preparation, and Sequencing
Samples were homogenized using a bead-beating method as described in Zhang et al. (2013). Briefly, ∼100 mg of acid washed and autoclaved 0.5 mm-zirconia/silica beads (Biospec Products, Inc., United States) were added to the tubes and samples were homogenized using an MP Fast Prep-24 Tissue and Cell Homogenizer (MP Biomedicals, United States) for 1 min at a speed of 6 m/s. Samples were chilled on ice for 2 min and homogenization was repeated once more. Total RNA was isolated following Zhang et al. (2007). The quantity and quality of the RNA were assessed with a NanoDrop1000 Spectrometer. Due to the existence of potential inhibitors which could interfere with downstream cDNA synthesis and PCR amplification of the libraries, the obtained RNA samples were further purified using OneStepTM PCR Inhibitor Removal Kit (Zymo Research, United States) following the manufacturer’s protocol.
Dinoflagellate-Specific cDNA Library Preparation and Sequencing
A total of six cDNA libraries (three station, two size fractions each station) were prepared from the RNA samples. The 1st-strand cDNA from each sample was synthesized following Zhuang et al. (2015). Briefly, a random primer (454BT7N9: 5′-CTATGCGCCTTGCCAGCCCGCTCAGTAATACGACTCACTATAGGGAGNNNNNNNNN-3′) was used to synthesize cDNA. The 1st-strand cDNA was then used as the template for PCR amplification of the metatranscriptome using a modified DinoSL primer (454ADinoSL, 5′-CGTATCGCCTCCCTCGCGCCATCAGNCCGTAGCCATTTTGGCTCAAG-3′) as the forward primer paired with 454BT7 (5′-CTATGCGCCTTGCCAGCCCGCTCAGTAATACGACTCACTATAGGGAG-3′) as the reverse primer. The PCR amplification was carried out for each library under a touchdown PCR program using ExTaq HS DNA polymerase (Takara Bio, Kusatsu, Japan): 94°C for 1 min; 95°C for 15 s, 60°C for 30 s, 72°C for 2 min for 10 cycles; 95°C for 15 s, 52°C for 30 s, 72°C for 2 min for 15 cycles. The amplicons with size range from 300 to 700 bp were selected by agarose gel cutting and purified for 454 sequencing. The spliced-leader metatranscriptome cDNA libraries from the nano- and microplankton from each of the three sample sides were pooled and sequenced on a PicoTiterPlate with a Roche GS Junior machine (Roche, Mannheim, Germany) following the manufactures’ protocol.
Bioinformatic Analysis
Sequences of each library were assembled into contigs (size ≥ 200 bp) with the CLC Genomic Workbench using default settings (Qiagen). Raw sequence reads were mapped back to contigs to obtain read counts per contig. Library sizes and read counts were normalized in R with the DESeq package (Anders and Huber, 2010). All contigs were aligned to the KOG database (EuKaryotic Orthologous Groups) (KOG, Tatusov et al., 2003) obtained from http://ftp.ncbi.nih.gov/pub/COG/KOG/ with a cut-off of BLASTx (E-value ≤ 10−5). Gene functions were predicted from the top BLASTx hit. Normalized read counts for contigs with same KOG predicted gene functions were collapsed. Annotated genes belonged to the three KOG-Groups: ‘Information Storage and Processing,’ ‘Cellular Processes and Signaling,’ and ‘Metabolism.’ Each KOG-Group contained several KOG-Categories (Figure 3).
Assembled contigs were further clustered with a similarity cut-off of 95% identity [CD-HIT suite (Li and Godzik, 2006), sequence identity cut-off set to 0.95, remaining parameters set to default] to get insights into the sequence diversity present in the two different size fractions (Figure 2).
Transcriptomic differences were estimated across all stations but separately for each size fractions in order to account for size-dependent differences. For each size fractions, we calculated the following indices according to Martínez and Reyes-Valdés (2008) per functional KOG-Group: the average gene frequency pi, the gene specificity Si per station, the functional specialization δj, the transcriptome diversity Hj, the divergence of the transcriptome from the average of all stations HRj, and the Kullback–Leibler divergence Dj as a measure of how much a given KOG-Category departs from the average transcriptome. Details can be accessed in the Supplementary Material. The applied method is more robust as classical differential gene expression analyses as it does not rely on single gene expression estimates but rather on the behavior of functional groups of genes. This makes the applied method robust for outliers and applicable to non-replicated, environmental data.
We plotted the Kullback–Leibler divergence Dj vs. the functional specialization δj to provide an overview of the degree of conservatism or plasticity of genes expressed within each functional process. Low values of both Dj and δj indicate that the transcriptome from all samples contains on average the same gene functions at similar frequencies (which are defined as conservative traits). Increasing values of Dj and δj indicate that gene frequencies and gene functions become more different across the samples (which are defined as plastic traits). The divergence from Dj = δj indicates the cause of the increased plasticity: Dj > δj indicates that plasticity is mainly caused by differential expression of genes that are on average expressed in all samples; Dj < δj indicates that plasticity is mainly caused by expressing sample specific genes (Martínez and Reyes-Valdés, 2008).
We used the distance to the origin (Dj and δj = 0) of each KOG-Category and sampling station as a proxy for the degree of conservatism or plasticity. The effect of the environment or community on the distance was analyzed with ANOVAs using R! (R Core Team, 2016). Analyses were performed separately for each size fraction and KOG-Group (‘Cellular Processes and Signaling,’ ‘Information Storage and Processing,’ ‘Metabolism’). We tested the effect of each KOG-Category on the distance to the origin to assess whether there were differences in the degree of conservatism and plasticity independent of the environmental conditions (between KOG-Category variances). Significant differences in the distance to the origin would indicate that the observed expression patterns are potentially an inherent feature of the dinoflagellate community where plasticity cannot be attributed to a specific environmental factor (environmentally unspecified influence on community trait plasticity). We further tested the influence of the environment on the distance to the origin by using “stations” as fixed factor and KOG-Category as within subject variation error term (within KOG-Category variances). Significant results would indicate an environmental influence on the underlying gene expression pattern. For significant results, KOG-Categories and/or stations were grouped into statistically homogenous subsets with the R package ‘multcompView’ (Graves et al., 2015). Distances to the origin of KOG-Categories with significant within KOG-Category variances were correlated to the respective stations with principal component analysis using R! (R Core Team, 2016). Obtained results would show which environment (station) most strongly influenced vector lengths (distance to the origin) and thus, gene expression plasticity.
DNA Extraction and Community 28S rDNA Amplicon (Metabarcode) Sequencing
Cell pellets were lysed with a Bio101 FastPrep instrument (Thermo, Savant Illkirch, France) at maximum speed (6.5 ms−1) for 45 s. DNA extraction preceded according to the DNeasy Plant kit protocol. Amplicon primers were designed by fusing the universal primer Dir-F and Dir2-CR for the 28S ribosomal RNA gene (28S rDNA) region D1 and D2 (Scholin et al., 1994) to the 454-overhang adapter sequences (28S amplicon PCR forward 5′CGTATCGCCTCCCTCGCGCCA-TCAG-variable MID sequence 10 bp-ACCCGCTGAATTTAAGCATA, reverse primer 5′CTATGCGCCTTGCCAGCCCGC-TCAG- variable MID sequence 10bp-CCTTGGTCCGTGTTTCAAGA). Prior to 28S rDNA PCR the extracted DNA was normalized to 5 ng per μL, and 12.5 ng were used per reaction. The PCR was performed using the Expand High Fidelity system (Roche, Basel, Switzerland) with the following program: 94°C for 2 min, 30 cycles of 94°C for 30 s, 55°C for 30 s and 72°C for 2 min followed by a final extension for 10 min at 72°C. The PCR product (˜910 bp) was separated via gel-electrophoresis and the resulting band was cut from the gel and purified using the Qiagen MinElute Gel extraction kit following the manufactures’ protocol. After an additional bead cleanup using AMPure beads (Beckman, Krefeld, Germany) the amplicon length distribution was determined on the Bioanalyzer (Agilent Technologies, Santa Clara, CA, United States) and the DNA quality and quantity was checked on the NanoDrop1000 Spectrometer (Thermo Scientific, Wilmington, DE, United States). The amplicon libraries were pooled in equal amounts and sequenced on the Roche GS Junior machine (Roche, Mannheim, Germany) following the manufactures’ protocol.
Community Structure Analysis
Raw data files were demultiplexed and transformed into fastq files with the Roche gsSeqTools. Sequence quality control, OTU clustering and preliminary taxonomic annotation was performed by an in-house QIIME-based (Caporaso et al., 2010) (version 1.8) analysis pipeline (Stecher et al., 2016) as following. Sequences having more than two errors in the sequencing primer were discarded from the sequence set. The primer sequences were removed and the sequences were trimmed (i) at the first detected base ambiguity, (ii) at the first homopolymer exceeding a length of eight consecutive bases, (iii) at the first occurrence of a 50 bp-window falling below an average phred quality score of 25, or (iv) at the 600th base of the sequence. The remaining sequences were checked for a minimum length of 300 bp.
Quality-trimmed sequences of all samples/size fractions were combined and de novo (i.e., without providing reference sequences as seed sequences) clustered into artificial operational taxonomic units (OTUs) using USEARCH v5.2.236 (Edgar, 2010). A similarity threshold of 98% was used, which has been shown to be a suitable value for eukaryotic diversity estimates (Bachy et al., 2011) and the most abundant amplicon in each cluster was selected as OTU representative. During the clustering process the sequences were cleaned from potential chimera (PCR artifacts) using the UCHIME algorithm (Edgar et al., 2011) with utilization of abundance sorted query sequence pre-cluster as self-reference (de novo mode). OTU cluster comprising less than four sequences were excluded from further analyses. An OTU table had been created which allowed the back-tracing of the number of amplicons of a certain OTU for a certain sample/size fraction and served as the basic data product for subsequent diversity analyses.
The OTU representative sequences were preliminary annotated using the QIIME version 1.8 default classifier applied with default parameters. The SILVA (Pruesse et al., 2007) 121 Parc dataset of 28S sequences served as annotation reference. Sequences thereby predicted to be Dinophyceae were furtherly analyzed by a phylogenetic approach which places sequences onto a phylogenetic tree (Matsen et al., 2010) and subsequently determines the last common ancestor (LCA) of the placements per sequence at a minimum confidence threshold (i.e., cumulated likelihood weight ratios) of 0.7. The taxonomic labels of the inner tree nodes were collected from the LCA root-wards and replaced the preliminary annotation. The therefor used tool PhyloAssigner (version 6.166) was introduced in Vergin et al. (2013). Details concerning the creation of the used dinoflagellate reference tree/alignment set and the procedure of the performed phylogenetic placement can be taken from Elferink et al. (2017). The OTU distribution was correlated to the stations with a principal component analysis and hierarchical clustered (complete linkage) with R! (R Core Team, 2016) in order to assess community similarity.
Sequence Data Deposition
All 454 pyrosequencing reads (raw data) have been deposited in the NCBI Sequence Read Archive and are accessible under the BioProject ID:PRJNA350371.
Results
Environmental Parameters
Environmental parameters among the three habitats investigated here differed mainly by nitrogen concentrations, chlorophyll-a concentrations, salinity, and silicate concentrations (Table 1). Nitrogen concentrations were highest at Station 21. Chlorophyll-a concentration was highest at Station 42. Concentrations for silicate, temperature and salinity were highest at the Baltic Sea Station 61 (Table 1).
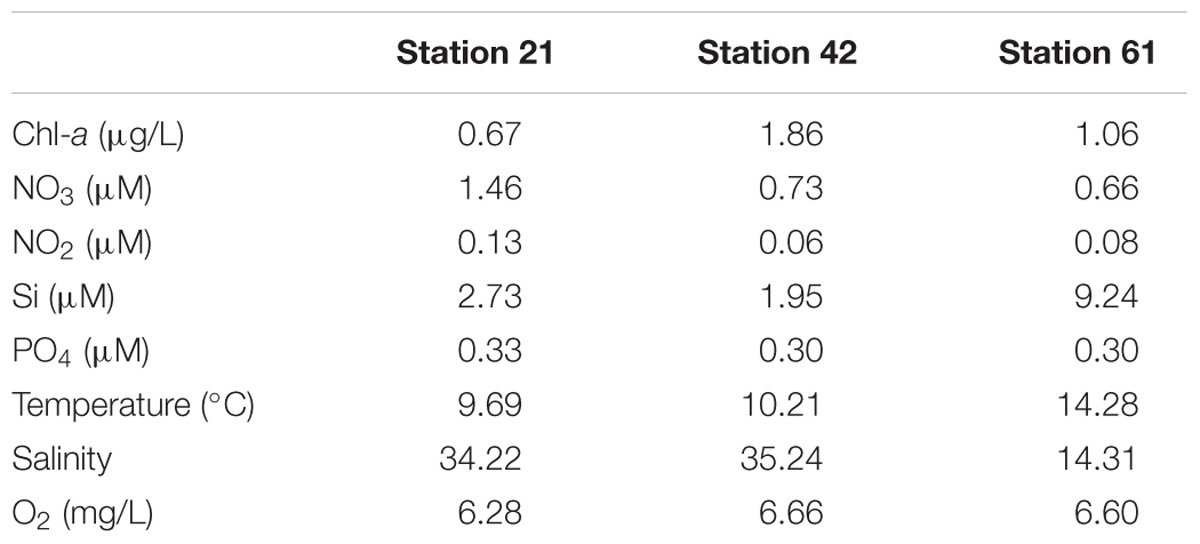
TABLE 1. Values of abiotic environmental parameters for each sampling station.
More Divergent Micro-Dinoflagellate Communities Than Nano-Dinoflagellate Communities Across Ecosystems
The relative abundance based on metabarcode assignments of Dinophyta in both size classes was highest for Station 42 (∼60% of all OTUs), followed by Station 21 (∼40%) and was lowest for Station 61 (∼20%) (Supplementary Table S1). At Station 61, diatom-derived metabarcodes were most abundant, and second most abundant at Stations 21 and 42 (Supplementary Table S1).
From all dinoflagellate OTUs, 78% were assigned to the level of family, 65% to the genus level and 24% of all OTUs to species level. There was no significant difference in assignment success for the two size classes (Students’ t-test p > 0.05). As shown in Figure 1, the assemblage of the micro-dinoflagellates from Station 21 was dominated by Gonyaulacales (∼60% of assigned metabarcodes), with Gonyaulax and Alexandrium OTUs representing the largest proportion. The second most abundant lineage was an unknown genus in the Peridiniales (∼24%). At Station 42, Peridinales, and herein mainly Scrippsiella and Protoperidinium, represented the most prominent OTUs of the micro-dinoflagellates (∼72%), followed by the Gonyaulacales (∼25%). Micro-dinoflagellates from Station 61 were dominated by Gymnodiniales (∼38%), the exclusively parasitic order of Syndiniales (∼33%) and the mostly heterotrophic order of Dinophysiales (∼20%). Prominent genera within these orders were Gyrodinium (Gymnodinales), Dinophysis (Dinophysiales), and Amoebophrya (Syndiniales).
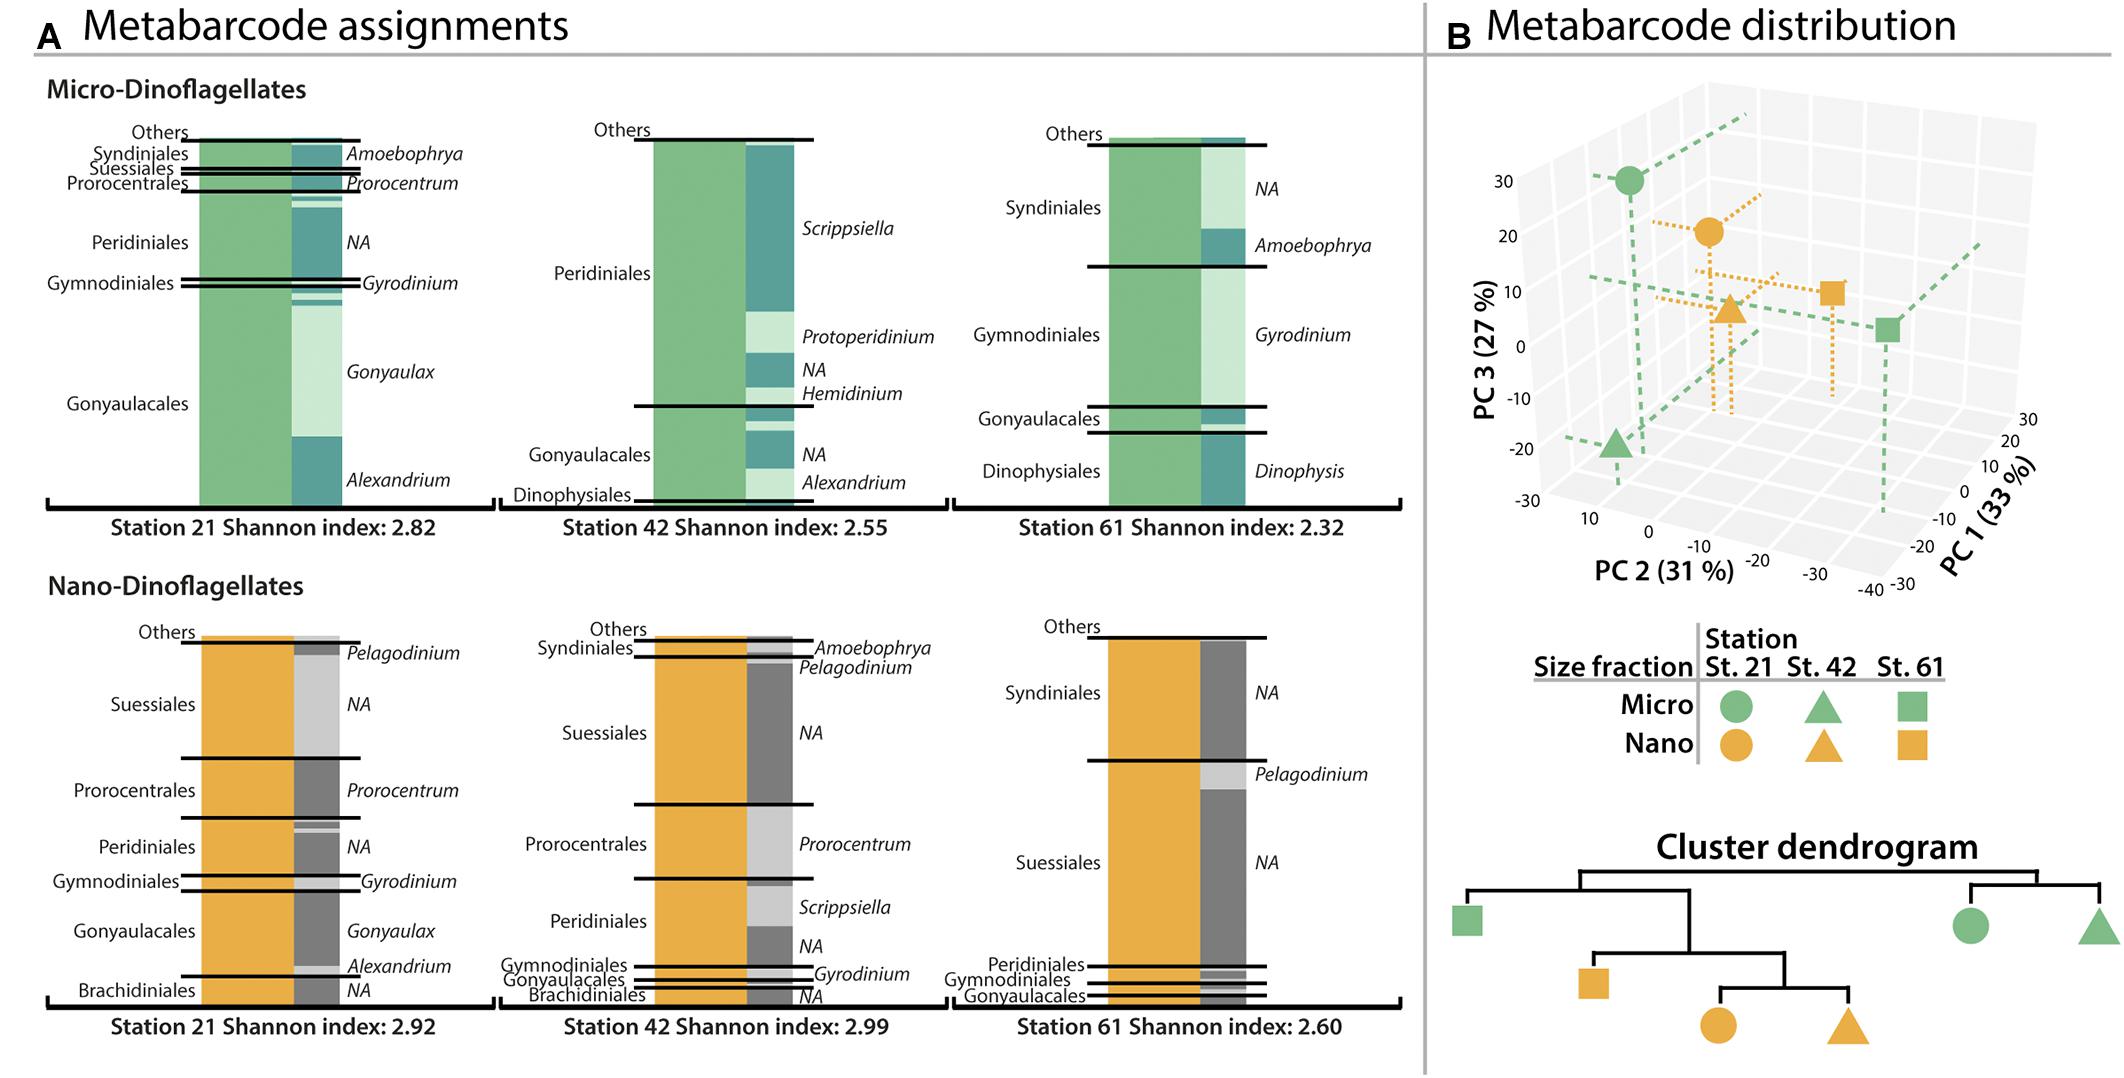
FIGURE 1. Distribution of order- and genus metabarcodes (OTUs) assigned to dinoflagellates. (A) Dinoflagellate-OTUs obtained from the microplankton size fraction (20–50 μm) and dinoflagellate-OTUs obtained from the nanoplankton size fraction (3–20 μm). Gray bars on the left show OTU assignments to orders greater than 1% abundance (lower abundant orders in ‘Others’). Gray shaded bars show the subdivision into assigned genera with most abundant genera labeled if applicable. (B) Plot of the OTU distribution based on principal component analysis and similarity of OTU distribution as cluster dendrogram. Percentages of variance accounted for by each principal component are given in brackets.
Figure 1 also shows that abundant nano-dinoflagellate OTUs from Station 21 belonged to several orders with similar amounts of assigned metabarcodes: the essentially symbiotic Suessiales (∼31%), Gonyaulacales (∼23%), Prorocentrales (∼16%), and Peridiniales (∼15%), with Gonyaulax (Gonyaulacales) and Prorocentrum (Prorocentrales) being prominent members. At Station 42, the Suessiales made up ∼40% of all nano-dinoflagellate OTUs, followed by the Peridinales (∼24%) and Prorocentrales (∼20%) mainly represented by Scrippsiella and Prorocentrum, respectively. The nano-dinoflagellates from Station 61 contained dominantly OTUs of symbiotic orders of Suessiales (∼56% metabarcode abundance), followed by the parasitic Syndiniales (∼33%). Yet the majority of these OTUs could not be assigned to a genus. Overall, the nano-dinoflagellate fraction yielded ∼19% common lineages compared to ∼9% for the micro-dinoflagellate fraction.
More Conserved Gene Repertoires (mRNA and Annotated Orthologs) in Micro-Dinoflagellate Communities Than Nano-Dinoflagellate Communities Across Ecosystems
In contrast to the trend of species composition, the metatranscriptome from the micro-dinoflagellates in both sequence and function was more similar among the three study locations than the metatranscriptome from the nano-dinoflagellates (Figure 2). The metatranscriptome mRNA sequence comparisons showed that ∼99% of the contigs from the nano-dinoflagellate were unique to one sample, whereas ∼19% of that from the micro-dinoflagellates were common among the three sites (Figure 2). The functional annotation rate based on gene orthologs (KOG genes) was between 16 and 25%, which is in the expected range for planktonic metatranscriptome studies (Alexander et al., 2015; Pearson et al., 2015; Zhuang et al., 2015). Based on the functional KOG annotations, the nano-dinoflagellates had ∼20% common gene orthologs and the micro-dinoflagellates had around ∼50% common gene orthologs (Figure 2).
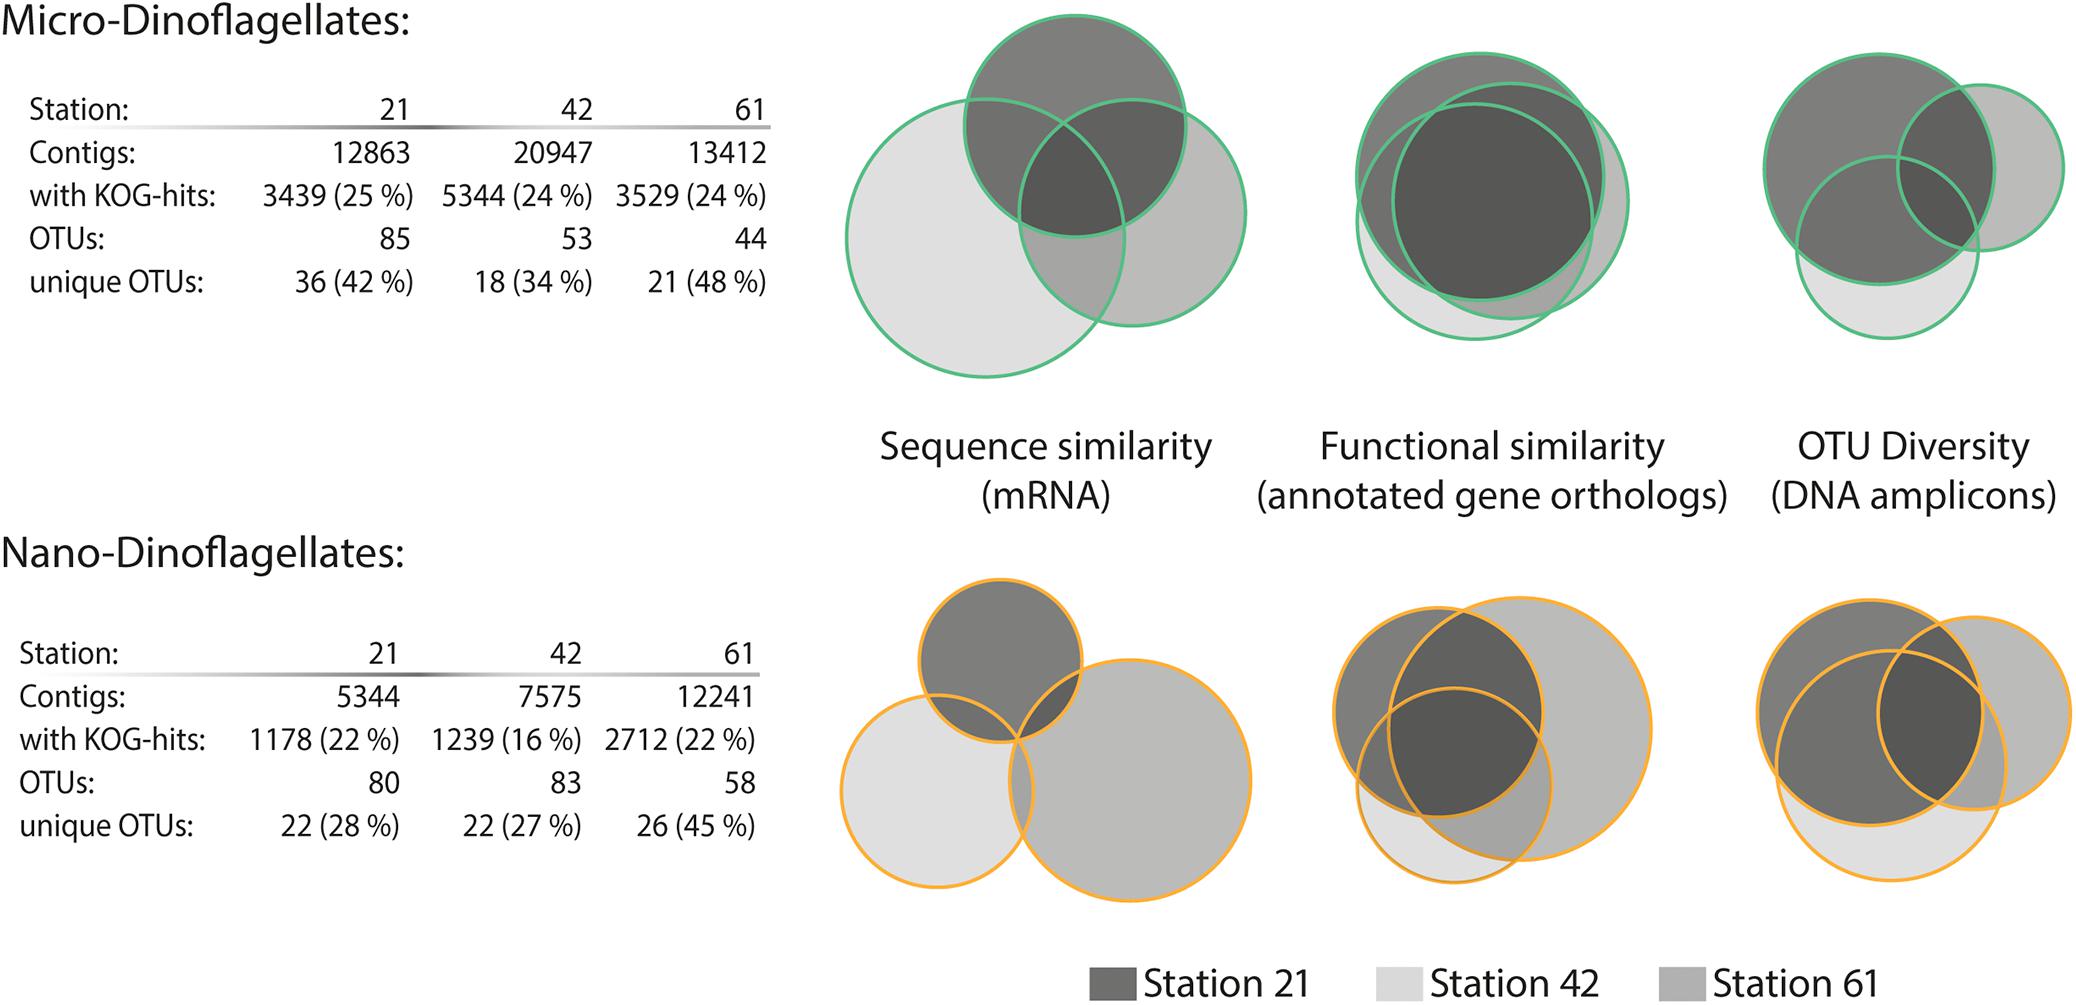
FIGURE 2. Sequence diversity and functional similarity of the dinoflagellate metabarcode and metatranscriptome assemblages. Sequence similarity of the SL-mRNA is based on an identity cut-off of 95%; sequence diversity of the operational taxonomic units (OTUs, 28s-rDNA) is based on an identity cut-off of 98%. Functional similarity is based on KOG (eukaryotic orthologous groups) annotation terms. Information about the total numbers of assembled contigs and the fraction with assigned KOG annotations (e-value ≤ 10−5 cut-off) is given in the table below for each station and size fraction.
Conserved and Plastic Community Traits
Community traits are represented by KOG-Categories and defined as conserved or plastic based on their Dj and δj values. The distance of a KOG-Category to the origin is used as a proxy for the degree of conservatism and plasticity, with the reference line with a slope of 1 representing a gradient from conservative (lower end) to plastic (upper end) (Figure 3). The distance to the origin increases with increasing plasticity of a process, represented by a KOG-Category. Roughly, three distinct mechanisms can influence the distance to the origin: (1) communities which express the same gene pool with similar expression levels would have shorter distances (defined as conservative); (2) communities which express the same gene pool but at different levels would have longer distances and be located below the reference line (defined as plastic); (3) communities which express distinct genes would have longer distances and be located above the reference line (defined as plastic). Based on these definitions, detected KOG-Categories were ranked and grouped into several major KOG-Groups (Figure 3).
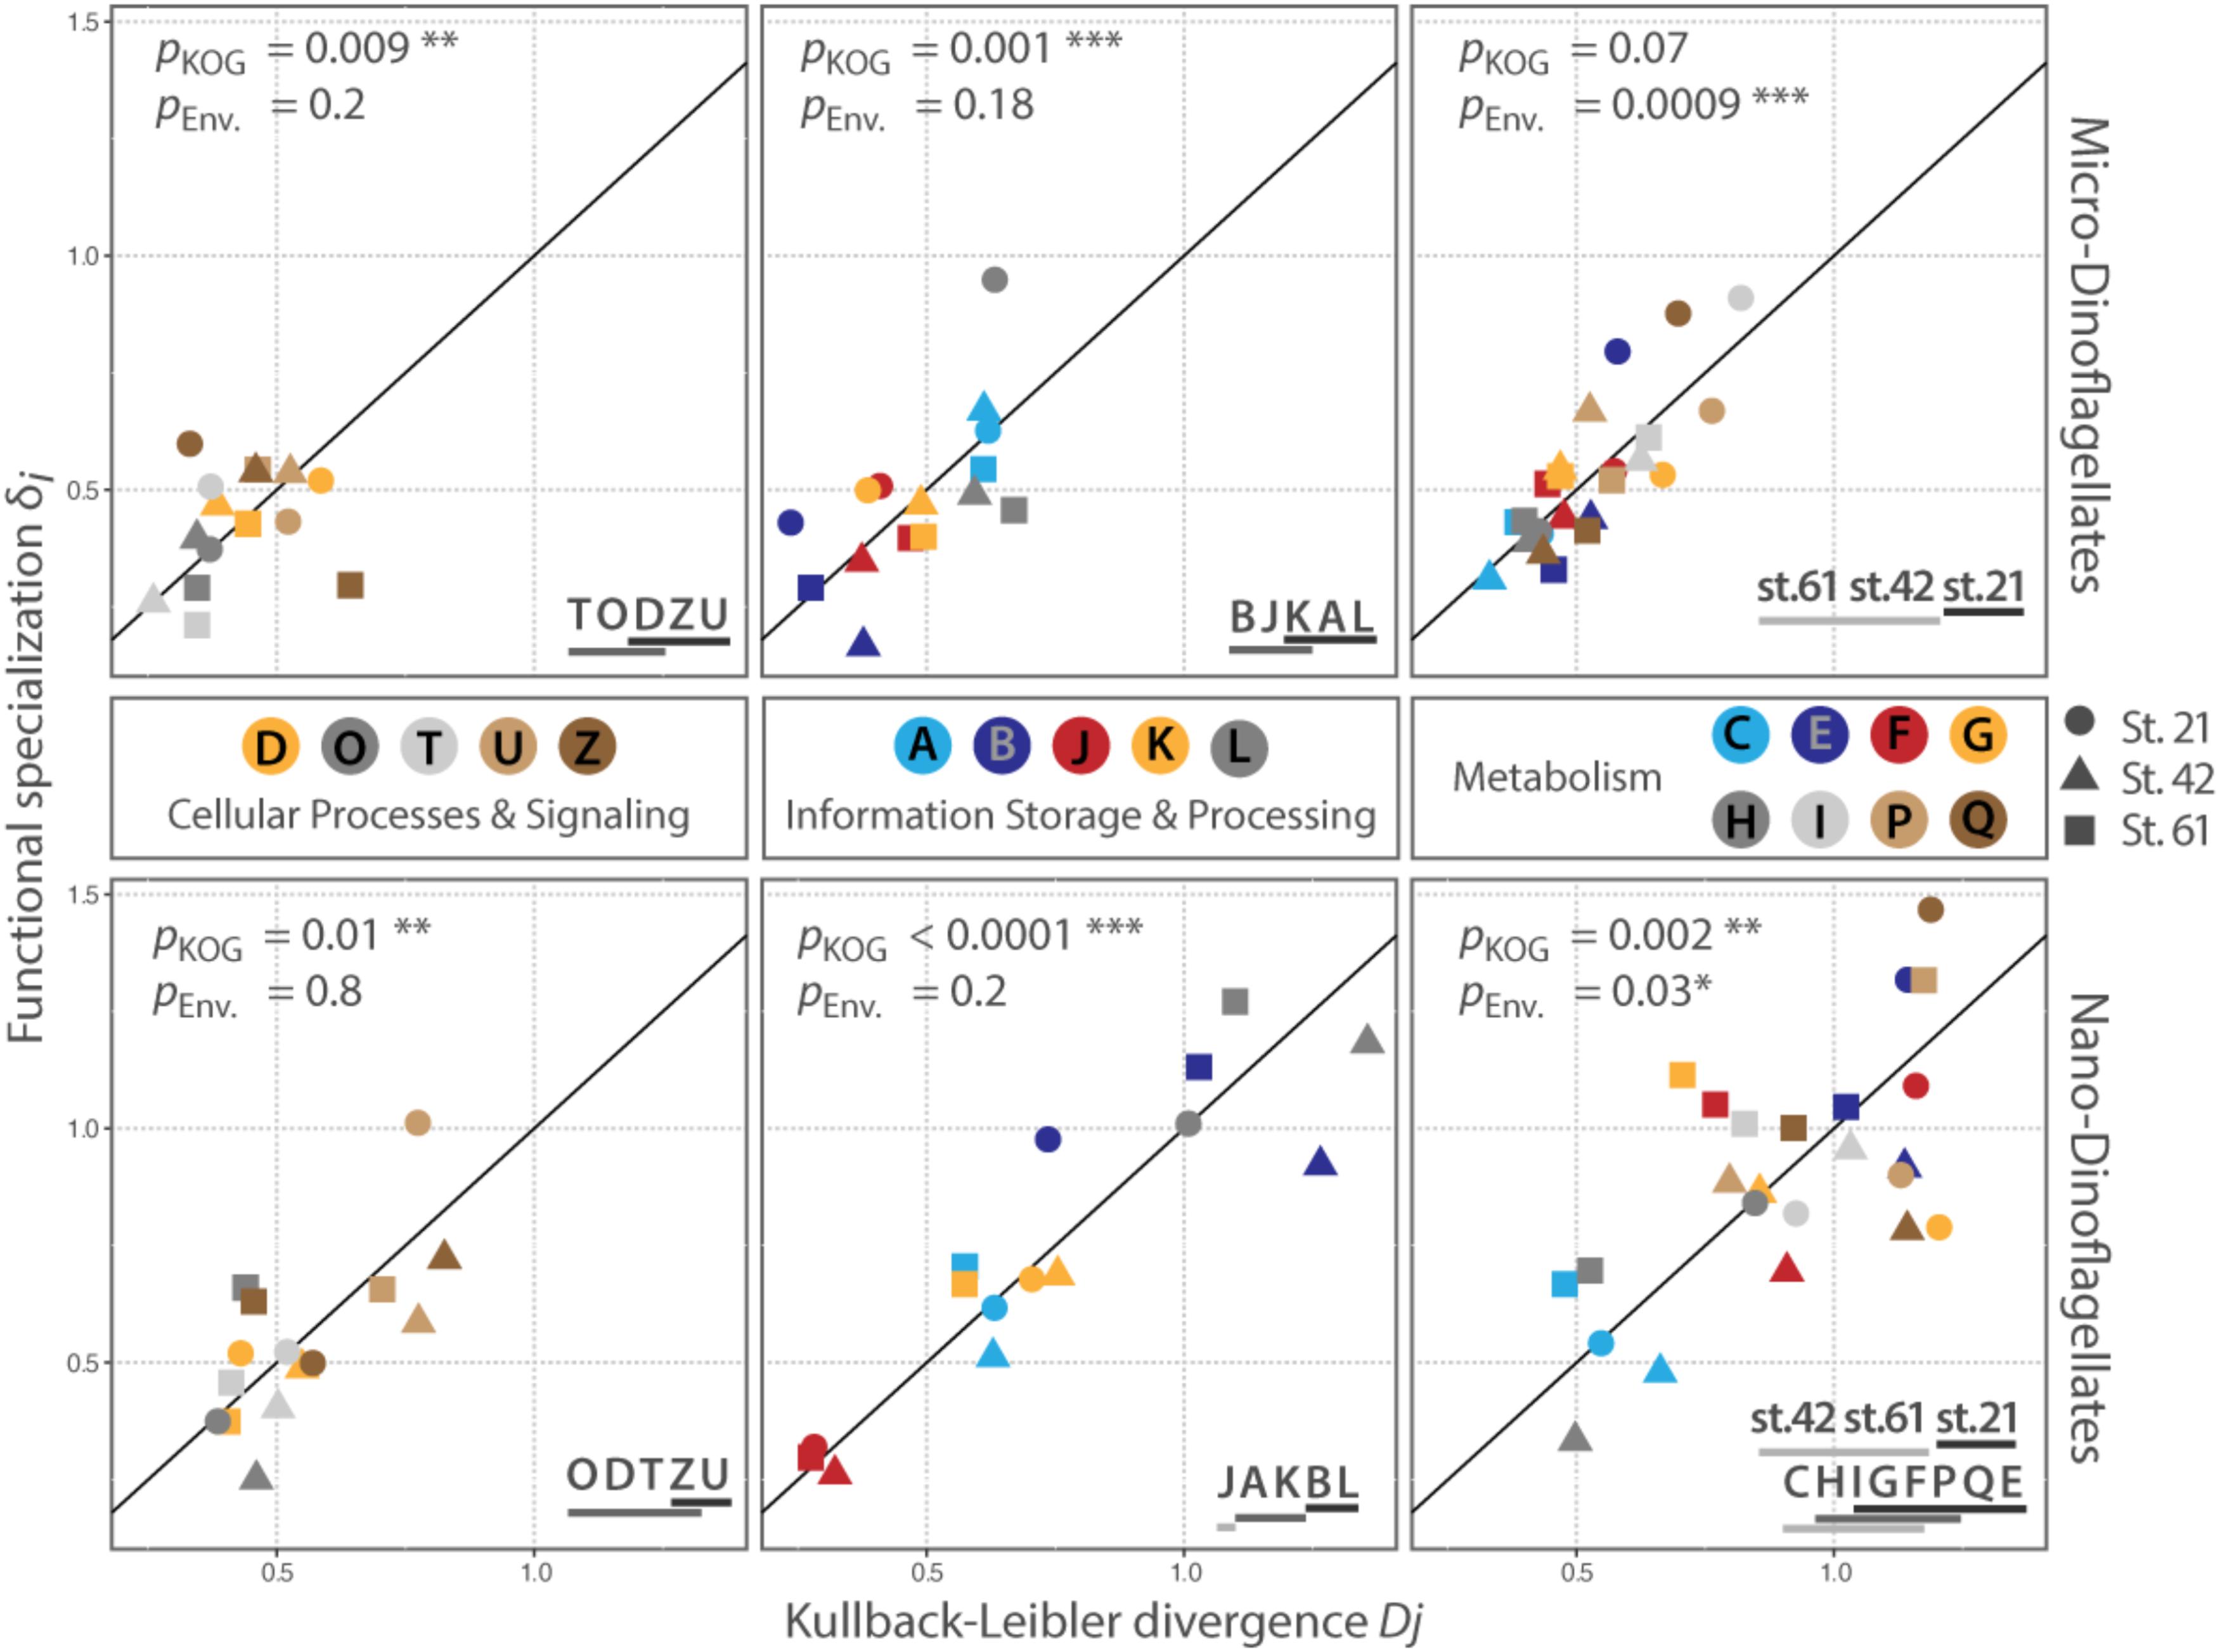
FIGURE 3. Distribution of KOG-Categories along the conservation – plasticity gradient. The x-axis represents the Kullback–Leibler divergence Dj; the y-axis represented the functional specialization index δi. The distance to the origin indicates the degree of plasticity with higher values for Dj and δi for categories that are more plastic. The reference line represents the conservation – plasticity gradient. Points above the line indicate plasticity by expressing mainly sample specific genes; points below the line represent plasticity by differential expression of transcripts common to all samples in the respective size class. pKOG gives p-values for the factor ‘category’ (between KOG-Category variances); pENV gives p-values for the factors ‘station per category’ (within KOG-Category variances). Asterisks indicate the level of significance: ∗P ≤ 0.05, ∗∗P ≤ 0.01, ∗∗∗P ≤ 0.001. Lines below letters on the bottom right show statistically homogenous subsets for each significant factor. Each letter abbreviates a functional category; names of the functional categories are according to KOG. J: translation, ribosomal structure and biogenesis, A: RNA processing and modification, K: transcription, L: replication, recombination and repair, B: chromatin structure and dynamics, D: cell cycle control, cell division, chromosome partitioning, O: posttranslational modification, protein turnover, chaperones, T: signal transduction mechanisms, U: intracellular trafficking, secretion, and vesicular transport, Z: cytoskeleton, C: energy production and conversion, G: carbohydrate transport and metabolism, E: amino acid transport and metabolism, F: nucleotide transport and metabolism, H: coenzyme transport and metabolism, I: lipid transport and metabolism, P: inorganic ion transport and metabolism, Q: secondary metabolites biosynthesis, transport and catabolism.
The between KOG-Category variance, i.e., the distribution of the same KOG-Categories along the conservation – plasticity gradient, differed significantly (pKOG < 0.05) for each KOG-Group and size fraction, except for the KOG-Group ‘Metabolism’ in the micro-dinoflagellates (Figure 3). The KOG-Categories within a KOG-Group thus exhibited significantly different grouping from each other along the conservation – plasticity gradient (displayed as statistically homogenous subsets, Figure 3, lower right). The most plastic process for both size classes in the KOG-Group ‘Cellular Processes and Signaling’ is ‘U’ (Intracellular trafficking, secretion, and vesicular transport) and ‘Z’ (Cytoskeleton). In the KOG-Group ‘Information Storage and Processing’ the most plastic process for both size classes is ‘L’ (Replication, recombination and repair), but also transcriptional processes (‘K’) together with processes associated with RNA processing and modification (‘A’) appear to be rather plastic (Figure 3). The between KOG-Category variance of metabolic processes for the nano-dinoflagellates showed that ‘C’ (Energy production and conversion) and ‘H’ (Coenzyme transport and metabolism) were significantly more conserved than the more plastic KOG-Categories ‘E’ (Amino acid transport and metabolism) and ‘Q’ (secondary metabolites biosynthesis transport and catabolism).
The within KOG-Category variance was only significantly (pEnv < 0.05) influenced by the factor ‘station’ for the KOG-Group of ‘Metabolism,’ albeit in both size fractions (Figure 3). KOG-Categories in the KOG-Group of Metabolism thus were significantly more plastic for both size classes under environmental conditions prevailing at Station 21 (displayed as statistically homogenous subsets, Figure 3, lower right and as vector lengths, Figure 4). For both size classes, this is particularly pronounced for processes belonging to the functional groups of ‘E’ and ‘Q’ (Figure 4). These categories are also characterized by a high expression of sample specific genes (Table 2).
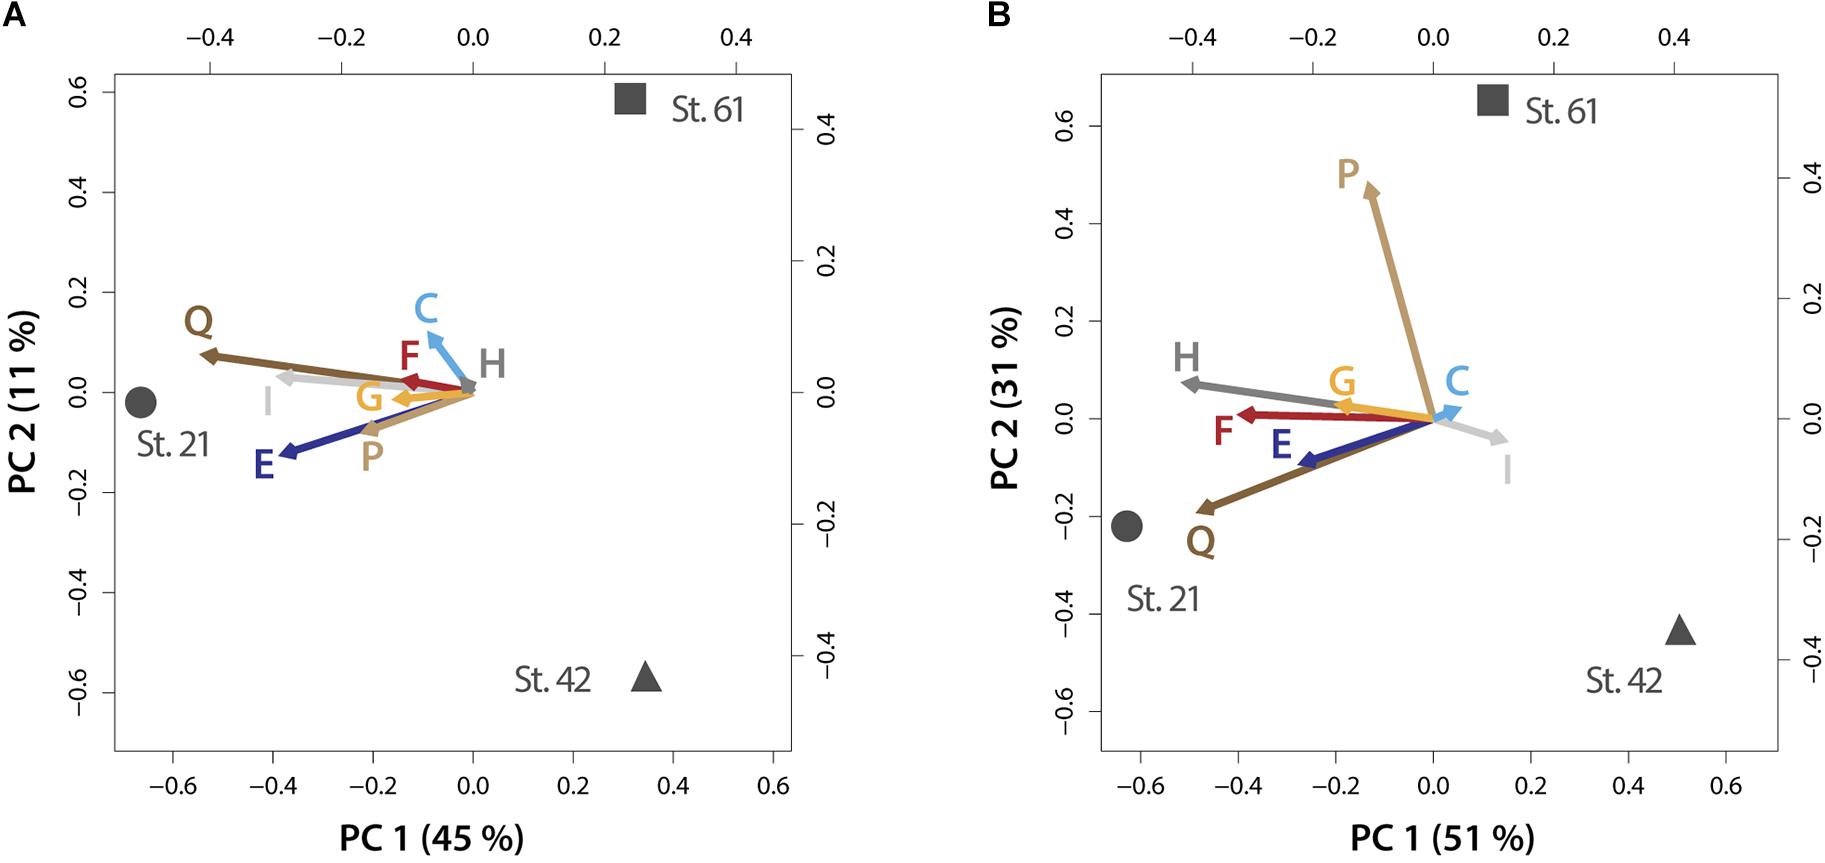
FIGURE 4. PCA biplots on plasticity within metabolic processes for the micro-dinoflagellates (A) and the nano-dinoflagellates (B). Vector lengths and direction indicate the influence on plasticity of the respective KOG-Category (abbreviated as letters) by environmental parameters prevailing at the respective stations. Letters codes for KOG-Categories are as in Figure 3. Percentages of variance accounted for by each principal component are given in brackets.
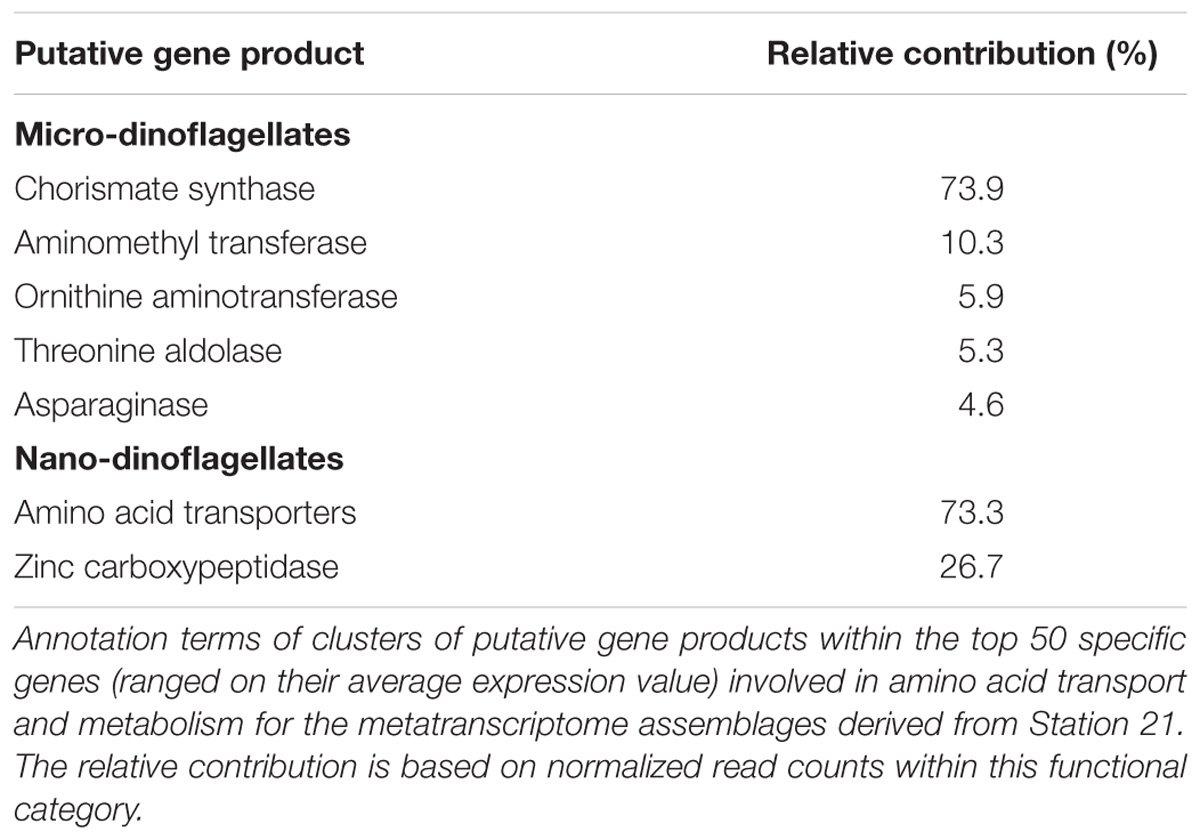
TABLE 2. Most abundant, station specific genes involved in amino acid metabolism.
The group of highly expressed, sample specific genes in the micro-dinoflagellates from Station 21 contains Chorismate synthase, an enzyme involved in the synthesis of aromatic amino acids and numerous aromatic compounds (i.e., secondary metabolites). The same group further contains genes coding for aminomethyl transferase and threonine aldolase, both enzymes can increase the cellular C1 pool and thereby feed several major cellular processes (e.g., nucleic acid biosynthesis, amino acid metabolism, methyl group biogenesis, vitamin metabolism) (Appling, 1991; Hanson and Roje, 2001). Further highly expressed, sample specific genes in the micro-dinoflagellates from Station 21 code for the enzymes Ornithine-δ-aminotransferase and Asparaginase. Ornithine-δ-aminotransferase is involved in the urea cycle and decreases cellular arginine levels, thus enhances the transfer of nitrogen from arginine to other amino acids and delivers precursors for polyamine synthesis (Bouchereau et al., 1999; Funck et al., 2008; Stránská et al., 2008). Asparaginase is connected to the above-described mechanism as it mobilizes aspartate, an important component for arginine biosynthesis (Slocum, 2005; Funck et al., 2008). The functional category E of the nano-dinoflagellate metatranscriptome at Station 21 is characterized by a high expression of amino acid transporters and enzymes that cleave polypeptides into amino acids (Table 2).
Our data further revealed sampled environments that induced the expression of comparable unique community traits. Metatranscriptomes obtained from the respective environments are characterized by a comparable high amount of sample specific genes within functional KOG-Categories (Figure 3, symbols placed above the reference line). We observed such a high expression of community specific genes within functional KOG-Categories for the micro-dinoflagellates within the metatranscriptome from Station 21, and for nano-dinoflagellates within the metatranscriptome from Station 61. Within both respective metatranscriptomes, the majority of KOG-Categories were placed above the reference lines (10 out of 18 KOG-Categories for the micro-dinoflagellates; 14 out of 18 KOG-Categories for the nano-dinoflagellates) (Figure 3).
Occurrence of Core Dinoflagellates Genes
The so-called ‘core dinoflagellate genes’ are described as genes highly expressed in natural and cultured dinoflagellate samples (Lin, 2011). We identified such transcripts in our samples based on the pi-value (average gene frequencies) with high pi-values referring to the most abundant genes across all samples per size fraction (Supplementary Table S2). The majority of the top 50 annotated and highly expressed genes in all samples (Supplementary Table S2) belong to the KOG-Categories ‘J’ (translation, ribosomal structure and biogenesis) and O (posttranslational modification, protein turnover, chaperones). Several of these genes were also highly expressed in other dinoflagellate (meta-)transcriptome studies (reviewed in Lin, 2011), e.g., several ribosomal protein genes, Translation initiation factor 5a, Ubiquitin system genes, 14-3-3-protein genes, HSP 70, molecular chaperone DnaJ, glutathione-S-transferase, peptidylprolyl isomerase, S-adenosyl-L-homocysteine hydrolase and fumarate reductase. The functional composition of the here analyzed metatranscriptomes hence matches expectations based on literature data.
Discussion
Overall, the dinoflagellate metatranscriptome revealed phylum-typical signatures (“core dinoflagellate transcriptome,” see Supplementary Table S2) (Lin, 2011) and a diverse set of habitat-specific gene sequences and functions, particularly in the nano-dinoflagellate assemblage (Figure 2). Our taxonomic diversity results are in line with Le Bescot et al. (2016) indicating the existence of distinct order- and genus- level biodiversity patterns across size fractions and ecosystems. Furthermore, our results are in congruence with comparable marine planktonic metabarcoding studies (Guillou et al., 2008; de Vargas et al., 2015; Elferink et al., 2017), all revealing a large pool of OTUs belonging to symbiotic dinoflagellates (including parasitic, mutualistic or commensal) (Figure 1).
Conserved and Plastic Community Traits
Differences in the degree of conservatism and plasticity independent of prevailing environmental conditions were observed within all KOG-Groups and size fractions except for the KOG-Group ‘Metabolism’ in the micro-dinoflagellates (Figure 3). Trait plasticity within these KOG-Groups arises from different gene abundances in each metatranscriptome and can either result from (1) being an inherent feature of the respective trait or (2) genes representing these traits being differentially expressed or abundant in the community members. In both cases, plasticity cannot be attributed to a particular environmental factor but can be considered to be important for fitness and performance of the respective dinoflagellate community and to be influential on overall community processes. Such potentially influential plastic community traits are represented in both size classes by the expression of genes belonging to the KOG-Categories ‘U’ (Intracellular trafficking, secretion, and vesicular transport), ‘Z’ (Cytoskeleton), ‘K’ and ‘A’ (transcription and RNA processing) as well as ‘L’ (replication, recombination, and repair) (Figure 3). Plasticity in trait expression related to the uptake and secretion of substances (KOG-Category ‘U’) has been shown to be accompanied by expression changes in genes coding for cytoskeleton traits (Wohlrab et al., 2016). Along with transcription regulation and DNA processing (KOG-Category ‘K’ and ‘L’), the aforementioned traits seems to be of particular importance for the persistence of dinoflagellate communities. Especially, traits associated with the excretion or uptake of substances can have profound effects on community members and biogeochemical processes through, e.g., the secretion of allelochemically active molecules, ligands or substances that induce particular matter formation (Engel et al., 2004; Strom, 2008). With comparable significance, more conserved are traits expressed by the KOG-Categories ‘T’ (signal transduction mechanisms), ‘J’ (translation, ribosomal structure and biogenesis) and ‘O’ (posttranslational modification, protein turnover, chaperones). These categories are often the most plastic ones in laboratory experiments with dinoflagellates and often trigger non-stimulus-specific stress responses (Wohlrab et al., 2010, 2016; Lu et al., 2016). Perhaps the differential expression of single genes within the categories ‘T,’ ‘J,’ and ‘O’ as response to environmental stimuli is essential for acclimating to short term environmental alterations. However, these processes show rather little expression plasticity in our environmental samples. The discrepancy is probably in part because conditions used in the laboratory experiments often comprise sudden and rather extreme changes after long terms of stable conditions. Timing is a common issue in gene expression analysis and also here might the history and stability of the prevailing environmental conditions have influenced our results. Such issues can be overcome by increasing the numbers of Station sampled, and thereby diminishing the timing-effect and/or by sampling each waterbody at defined time intervals.
Metabolic processes only clustered significantly for the nano-dinoflagellates along the conservation – plasticity gradient with a significantly more conserved gene expression in the KOG-Categories ‘C’ (energy production and conversion) and ‘H’ (coenzyme transport and metabolism). The investigated environments thus appear to have little influence on gene expression within these categories, indicating that adaption to the environment includes balancing energy and co-enzyme metabolism toward a configuration most efficient for the cell (Kliebenstein, 2008; Carlson and Taffs, 2010). Such observed constrained gene expression plasticity ensures a constant provision of molecules and critical functions that are derived from energy and coenzyme metabolism (Kliebenstein, 2008). Though the clustering of metabolic processes is not significant for the micro-dinoflagellates, the KOG-Categories ‘C’ and ‘H’ were also placed on the lower end of the conservation–plasticity gradient (Figure 3).
An environment-specific influence on community trait plasticity was only observed for metabolic processes, albeit for both size fractions. The mixed model and PCA analysis showed that plasticity (shown as vector lengths) is caused by prevailing environmental conditions at Station 21 (Figure 4). Metabolic processes at this station are therefore characterized by comparable increased gene expression plasticity. This is particularly pronounced in both size fractions for metabolic processes that consume nitrogen, i.e., amino acid and secondary metabolism (Figure 4). Station 21 had the highest nitrogen loadings in our survey and nitrogen is often the most limiting macronutrient to instantaneous growth (Tyrrell, 1999). A high flexibility within nitrogen consuming pathways is therefore consistent with the need to respond to supplies of the often limited nitrogen pools. Indeed, nitrogen availability is known to trigger the abundance of dinoflagellates that form harmful algal blooms or can even make those blooms more toxic (Masó and Garcés, 2006; Van de Waal et al., 2014).
The metatranscriptome pattern of the micro-dinoflagellates we observed here illustrates how the environmental nitrogen availability activates several metabolic pathways and fuels cellular growth. It indicates a high turnover and dynamic within the nitrogen metabolism, i.e., the mobilization of cellular nitrogen pools and the synthesis of amino acids and secondary metabolites via the shikimate pathway. Additionally, the potential replenishment of the cellular One-Carbon-Pool (as indicated by the expression of aminomethyl transferase and threonine aldolase genes) might support the biosynthesis of several nitrogen containing compounds. The nano-dinoflagellates, in contrast, indicate the operation of distinct mechanisms in their metatranscriptome and seem to be characterized by a ‘recycling’ strategy specialized for the uptake of dissolved organic compounds. Though their amino acid metabolism is also characterized by the expression of sample specific genes, these genes primarily code for amino acid transporters and peptidases, enzymes that cleave polypeptides into amino acids (Table 2). Similar results have been obtained by Aylward et al. (2015) for picoplankton assemblages where the progressive release of dissolved organic matter from primary producers increased the expression of sugar transporters, amino acid transporters and peptidases. The nano-dinoflagellates in our study thus seem to more rely on the uptake and usage of leakage, lysis or host products rather than on their de novo biosynthesis. Thus, there might be a tight connection between the metabolic activity of the larger dinoflagellates (and further community members) and the use of, e.g., their leakage compounds in the smaller dinoflagellates. Such a tight coupling of metabolic processes might also be an evolutionary starting point to develop symbiotic relations, a prominent life-style of smaller sized dinoflagellates (Guillou et al., 2008). This is consistent with the observation that the nano-dinoflagellates were mostly parasitic and symbiotic, which presumably requires exchange of substances.
In summary, communities represented by the different size fractions showed similar patterns in their expression of conserved and plastic traits. Moreover, our results suggest that the availability of nitrogen is a trigger for metabolic trait plasticity, yet with size dependent differences in gene abundances for specific functional processes. However, due to the low numbers of samples analyzed in this study, the effect of nitrogen on trait plasticity and the consistence of conserved and plastic dinoflagellate community traits needs further evaluation.
Relationship Between Taxonomic and Trait Diversity, and Evolutionary Implications
The nano-dinoflagellates metatranscriptomes are, compared to the micro-dinoflagellate transcriptomes, more diverse in terms of expressed mRNA sequences and corresponding annotated gene functions (Figure 2). Rarefaction curves from the mRNA sequence reads are saturated for all samples (Supplementary Figure S2) indicating that the analyzed nano-dinoflagellate transcriptomes are more shaped by functional and structural mRNA radiation events than the micro-dinoflagellate transcriptomes. The nano-dinoflagellate communities therefore have potentially evolved a considerable habitat and niche specificity in functional processes (Pearson et al., 2015). The proposed niche specificity in functional processes is especially pronounced for the mainly symbiotic and parasitic nano-dinoflagellates from the Baltic Sea (Station 61, Figure 2) which express a metatranscriptome that contains approximately 34% unique gene orthologs. This high amount of unique gene orthologs leads to the observed expression of mainly sample-specific genes in the majority of functional KOG-Categories (Figure 3, symbols above the reference line). It is well known that biotic interactions, like symbiotic relations, are major drivers for organismal diversification (van Valen, 1973; Smetacek, 2001; Paterson et al., 2010; Armbrust and Palumbi, 2015; Lima-Mendez et al., 2015) and so, co-evolutionary processes might have also driven the high amount of structural and functional mRNA radiation observed for the nano-dinoflagellates from Station 61.
The less differential taxon distribution (Figure 1) and compensatory higher amount of unique mRNA sequences (Figure 2) of the nano-dinoflagellate assemblage fits one of the scenarios Arrigo (2005) hypothesized, i.e., that physiological adjustments of the community members can maintain community composition. It also points toward the existence of several isolated subpopulation that have evolved diverging gene functions based on their specific habitat or niche (Kashtan et al., 2014). As we only analyzed mRNA abundances and no genomic gene abundances, we cannot rule out that the identified habitat-specific genes are present in all communities, albeit not expressed. However, it is possible that the observed high abundance of habitat specific genes might be a result of clonal selection of different genotypes or ecotypes within the nano-dinoflagellates. The existence of several ecotypes or subpopulations in the plankton has previously been demonstrated for major picocyanobacteria (Synchococcus and Prochlorococcus) (Moore et al., 1998; Johnson et al., 2006; Martiny et al., 2009; Kashtan et al., 2014; Sohm et al., 2016), picoeukaryotes (Ostreococcus) (Rodríguez et al., 2005; Demir-Hilton et al., 2011), nanoeukaryotes [e.g., Emiliania huxleyi (von Dassow et al., 2015), and marine stramenopiles (Seeleuthner et al., 2018)], but is not known to date to exist for nano-dinoflagellates. Nevertheless, the evolution of various ecotypes might be a common feature of diverse marine microbial communities (Sohm et al., 2016).
Micro-dinoflagellates, in comparison to the nano-dinoflagellates, show a distinct pattern in terms of their OTU and mRNA sequence distribution. Generally, the micro-dinoflagellates express a more homogenous mRNA pool (both structural and functional) which originates from a less homogenous species pool (Figures 1, 2). Furthermore, traits represented by functional KOG-Categories in the taxonomically most distinct community (Station 61, Figure 1B) are expressed by genes common to all micro-dinoflagellates (Figure 3, symbols below the reference line). Whereas micro-dinoflagellates from Station 21 were taxonomically similar to that at Station 42, they showed community traits that arise from the expression of mainly sample specific genes (Figure 3, symbols above the reference line). The expression of community specific traits in the micro-dinoflagellates is therefore more influenced by the prevailing environmental conditions and originates from a more homogenous mRNA pool compared to the nano-dinoflagellates. The contrasting traits of the nano-dinoflagellates arising from a community specific mRNA pool indicate functional diversification in this small-sized dinoflagellate assemblage, as recently observed for marine pico-nano stramenopiles (Seeleuthner et al., 2018).
Conclusion
The comparison of mRNA and OTU diversity in our study indicates that the smaller sized dinoflagellates might be more bound or adapted to their niche than larger dinoflagellates that express a more ‘universal genetic repertoire.’ However, it remains open if the genomes of the nano-dinoflagellates also consist of mainly habitat specific genes. If so, clonal selection and the emergence of local ecotypes might be more prominent in the smaller sized dinoflagellates, which would raise the question about a general size trade-off that determines how populations evolve or respond to environmental change.
Plastic traits, supposed to determine fitness and performance of the respective communities, are represented by genes belonging to processes that influence transcription, DNA replication, recombination and repair as well as intracellular vesicle associated processes. Whereas the first two processes are important drivers for the intracellular regulation of trait expression, the last process can more directly influence biochemical cycles and species interactions by, i.e., the excretion of substances like allelochemicals or the uptake of organic matter via mixotrophy or osmotrophy. Additionally, should trait changes associated with amino acid and secondary metabolite biosynthesis, if sufficient nitrogen is provided, also be considered as important processes for fitness and feed-back mechanisms. Traits associated with energy production and conversion as well as traits associated with coenzyme transport and metabolism yet showed in our analysis a rather conserved expression pattern and are thus stable with respect to their potential influence on community processes in the here investigated environments.
Although, we applied this method to only the dinoflagellate transcripts in the natural community, it can be easily scaled up to include more samples and all community members as well as their respective contribution to community processes. Increasing the amount of samples and environmental parameters will be an imperative to further elucidate and evaluate how traits are bound to, or influenced by environmental conditions. Furthermore, this method is not restricted to gene expression data and can be used for or combined with other large-scale environmental datasets like, e.g., metabolite or DOM fingerprint data (Li et al., 2016).
Author Contributions
SW drafted and wrote the manuscript and performed the data analysis and interpretation. SN, UJ, and SE performed the phylogenetic analysis of the OTU data. SW, JF, DV, and UJ did the field sampling of plankton communities and collection of environmental data. JF, HZ, SL, and UJ performed DNA and RNA sequencing and analysis. DV and OZ analyzed the environmental data. SW, JF, and UJ conceived the study design. SL contributed significantly to the final version of the manuscript. SL, HZ, SN, DV, JF, and UJ contributed to the manuscript.
Funding
Financial support was provided by the PACES research program of the Alfred Wegener Institute Helmholtz Centre for Polar and Marine Research and by the German Research Foundation (DFG) Priority Program DynaTrait (1704; Jo 702/7-1). SL and HZ were supported by the National Science Foundation under grant EF-0629624 of the Assembly of Tree of Life program awarded to C. F. Delwiche, D. W. Coats, and S. Lin.
Conflict of Interest Statement
The authors declare that the research was conducted in the absence of any commercial or financial relationships that could be construed as a potential conflict of interest.
Acknowledgments
We thank the master and crew of RV Heincke for their help and support during the ship cruise. The cruise was conducted under the grant number AWI HE358 00. We thank Hrutuja Diwan and Yameng Lu for their help with plankton sampling. We thank the reviewers for their thoughtful and thorough reviews, which were of great help in revising and improving the manuscript.
Supplementary Material
The Supplementary Material for this article can be found online at: https://www.frontiersin.org/articles/10.3389/fmars.2018.00358/full#supplementary-material
References
Alexander, H., Rouco, M., Haley, S. T., Wilson, S. T., Karl, D. M., and Dyhrman, S. T. (2015). Functional group-specific traits drive phytoplankton dynamics in the oligotrophic ocean. Proc. Natl. Acad. Sci. U.S.A. 112, E5972–E5979. doi: 10.1073/pnas.1518165112
Anders, S., and Huber, W. (2010). Differential expression analysis for sequence count data. Genome Biol. 11:R106. doi: 10.1186/gb-2010-11-10-r106
Anderson, D. M., Cembella, A. D., and Hallegraeff, G. M. (2012). Progress in understanding harmful algal blooms: paradigm shifts and new technologies for research, monitoring, and management. Annu. Rev. Mar. Sci. 4, 143–176. doi: 10.1146/annurev-marine-120308-081121
Appling, D. R. (1991). Compartmentation of folate-mediated one-carbon metabolism in eukaryotes. FASEB J. 5, 2645–2651. doi: 10.1096/fasebj.5.12.1916088
Arar, E. J. (1997). “Method 446.0 in vitro determination of chlorophylls a, b, c + c and pheopigments in marine and freshwater alage by visible spectrophotometry,” in Methods for the Determination of Chemical Substances in Marine and Estuarine Environmental Matrices (Washington, DC: U.S. Environmental Protection Agency). Available at: https://cfpub.epa.gov/si/si_public_record_report.cfm?dirEntryId=309415
Armbrust, E. V., and Palumbi, S. R. (2015). Uncovering hidden worlds of ocean biodiversity A 3-year expedition yields a treasure trove of data on microorganisms and small animals in the world’s oceans. Science 348, 865–867. doi: 10.1126/science.aaa7378
Arrigo, K. R. (2005). Marine microorganisms and global nutrient cycles. Nature 437, 349–355. doi: 10.1038/nature04159
Aylward, F. O., Eppley, J. M., Smith, J. M., Chavez, F. P., Scholin, C. A., and DeLong, E. F. (2015). Microbial community transcriptional networks are conserved in three domains at ocean basin scales. Proc. Natl. Acad. Sci. U.S.A. 112, 5443–5448. doi: 10.1073/pnas.1502883112
Bachy, C., Lopez-Garcia, P., Vereshchaka, A., and Moreira, D. (2011). Diversity and vertical distribution of microbial eukaryotes in the snow, sea ice and seawater near the North Pole at the end of the polar night. Front. Microbiol. 2:106. doi: 10.3389/fmicb.2011.00106
Barton, A. D., Pershing, A. J., Litchman, E., Record, N. R., Edwards, K. F., Finkel, Z. V., et al. (2013). The biogeography of marine plankton traits. Ecol. Lett. 16, 522–534. doi: 10.1111/ele.12063
Bouchereau, A., Aziz, A., Larher, F., and Martin-Tanguy, J. (1999). Polyamines and environmental challenges: recent development. Plant Sci. 140, 103–125. doi: 10.1016/S0168-9452(98)00218-0
Caporaso, J. G., Kuczynski, J., Stombaugh, J., Bittinger, K., Bushman, F. D., Costello, E. K., et al. (2010). QIIME allows analysis of high-throughput community sequencing data. Nat. Methods 7, 335–336. doi: 10.1038/nmeth.f.303
Carlson, R. P., and Taffs, R. L. (2010). Molecular-level tradeoffs and metabolic adaptation to simultaneous stressors. Curr. Opin. Biotechnol. 21, 670–676. doi: 10.1016/j.copbio.2010.05.011
de Vargas, C., Audic, S., Henry, N., Decelle, J., Mahé, F., Logares, R., et al. (2015). Eukaryotic plankton diversity in the sunlit ocean. Science 348:1261605. doi: 10.1126/science.1261605
Demir-Hilton, E., Sudek, S., Cuvelier, M. L., Gentemann, C. L., Zehr, J. P., and Worden, A. Z. (2011). Global distribution patterns of distinct clades of the photosynthetic picoeukaryote Ostreococcus. ISME J. 5, 1095–1107. doi: 10.1038/ismej.2010.209
Edgar, R. C. (2010). Search and clustering orders of magnitude faster than BLAST. Bioinformatics 26, 2460–2461. doi: 10.1093/bioinformatics/btq461
Edgar, R. C., Haas, B. J., Clemente, J. C., Quince, C., and Knight, R. (2011). UCHIME improves sensitivity and speed of chimera detection. Bioinformatics 27, 2194–2200. doi: 10.1093/bioinformatics/btr381
Elferink, S., Neuhaus, S., Wohlrab, S., Toebe, K., Voß, D., Gottschling, M., et al. (2017). Molecular diversity patterns among various phytoplankton size-fractions in West Greenland in late summer. Deep Sea Res. Part I Oceanogr. Res. Pap. 121, 54–69. doi: 10.1016/j.dsr.2016.11.002
Engel, A., Thoms, S., Riebesell, U., Rochelle-Newall, E., and Zondervan, I. (2004). Polysaccharide aggregation as a potential sink of marine dissolved organic carbon. Nature 428, 929–932. doi: 10.1038/nature02453
Falkowski, P. G., Barber, R. T., and Smetacek, V. (1998). Biogeochemical controls and feedbacks on ocean primary production. Science 281, 200–206. doi: 10.1126/science.281.5374.200
Fuhrman, J. A., Cram, J. A., and Needham, D. M. (2015). Marine microbial community dynamics and their ecological interpretation. Nat. Rev. Microbiol. 13, 133–146. doi: 10.1038/nrmicro3417
Funck, D., Stadelhofer, B., and Koch, W. (2008). Ornithine-δ-aminotransferase is essential for arginine catabolism but not for proline biosynthesis. BMC Plant Biol. 8:40. doi: 10.1186/1471-2229-8-40
Grasshoff, K., Kremling, K., and Ehrhardt, M. (1999). Methods of Seawater Analysis. Weinheim: Wiley-VCH Verlag GmbH.
Graves, S., Piepho, H.-P., Selzer, L., and Dorai-Raj, S. (2015). multcompView: Visualizations of Paired Comparisons. R Package Version 0.1–7.
Green, J. L., Bohannan, B. J. M., and Whitaker, R. J. (2008). Microbial biogeography: from taxonomy to traits. Science 320, 1039–1043. doi: 10.1126/science.1153475
Guillou, L., Viprey, M., Chambouvet, A., Welsh, R. M., Kirkham, A. R., Massana, R., et al. (2008). Widespread occurrence and genetic diversity of marine parasitoids belonging to Syndiniales (Alveolata). Environ. Microbiol. 10, 3349–3365. doi: 10.1111/j.1462-2920.2008.01731.x
Hackett, J., and Anderson, D. (2004). Dinoflagellates: a remarkable evolutionary experiment. Am. J. Bot. 91, 1523–1534. doi: 10.3732/ajb.91.10.1523
Hanson, A. D., and Roje, S. (2001). One-carbon metabolism in higher plants. Annu. Rev. Plant Biol. 52, 119–137. doi: 10.1146/annurev.arplant.52.1.119
Johnson, Z. I., Zinser, E. R., Coe, A., McNulty, N. P., Woodward, E. M. S., and Chisholm, S. W. (2006). Niche partitioning among prochlorococcus ecotypes along ocean-scale environmental gradients. Science 311, 1737–1740. doi: 10.1126/science.1118052
Kashtan, N., Roggensack, S. E., Rodrigue, S., Thompson, J. W., Biller, S. J., Coe, A., et al. (2014). Single-cell genomics reveals hundreds of coexisting subpopulations in wild Prochlorococcus. Science 344, 416–420. doi: 10.1126/science.1248575
Kellmann, R., Stuken, A., Orr, R. J. S., Svendsen, H. M., and Jakobsen, K. S. (2010). Biosynthesis and molecular genetics of polyketides in marine Dinoflagellates. Mar. Drugs 8, 1011–1048. doi: 10.3390/md8041011
Kliebenstein, D. J. (2008). A role for gene duplication and natural variation of gene expression in the evolution of metabolism. PLoS One 3:e1838. doi: 10.1371/journal.pone.0001838
Le Bescot, N., Mahe, F., Audic, S., Dimier, C., Garet, M. J., Poulain, J., et al. (2016). Global patterns of pelagic dinoflagellate diversity across protist size classes unveiled by metabarcoding. Environ. Microbiol. 18, 609–626. doi: 10.1111/1462-2920.13039
Li, D., Heiling, S., Baldwin, I. T., and Gaquerel, E. (2016). Illuminating a plant’s tissue-specific metabolic diversity using computational metabolomics and information theory. Proc. Natl. Acad. Sci. U.S.A. 113, E7610–E7618. doi: 10.1073/pnas.1610218113
Li, W., and Godzik, A. (2006). Cd-hit: a fast program for clustering and comparing large sets of protein or nucleotide sequences. Bioinformatics 22, 1658–1659. doi: 10.1093/bioinformatics/btl158
Lima-Mendez, G., Faust, K., Henry, N., Decelle, J., Colin, S., Carcillo, F., et al. (2015). Determinants of community structure in the global plankton interactome. Science 348:1262073. doi: 10.1126/science.1262073
Lin, S. (2011). Genomic understanding of dinoflagellates. Res. Microbiol. 162, 551–569. doi: 10.1016/j.resmic.2011.04.006
Litchman, E., and Klausmeier, C. A. (2008). Trait-based community ecology of phytoplankton. Annu. Rev. Ecol. Evol. Syst. 39, 615–639. doi: 10.1146/annurev.ecolsys.39.110707.173549
Lu, Y., Wohlrab, S., Groth, M., Glöckner, G., Guillou, L., and John, U. (2016). Transcriptomic profiling of Alexandrium fundyense during physical interaction with or exposure to chemical signals from the parasite Amoebophrya. Mol. Ecol. 25, 1294–1307. doi: 10.1111/mec.13566
Martínez, O., and Reyes-Valdés, M. H. (2008). Defining diversity, specialization, and gene specificity in transcriptomes through information theory. Proc. Natl. Acad. Sci. U.S.A. 105, 9709–9714. doi: 10.1073/pnas.0803479105
Martiny, A. C., Tai, A. P. K., Veneziano, D., Primeau, F., and Chisholm, S. W. (2009). Taxonomic resolution, ecotypes and the biogeography of Prochlorococcus. Environ. Microbiol. 11, 823–832. doi: 10.1111/j.1462-2920.2008.01803
Masó, M., and Garcés, E. (2006). Harmful microalgae blooms (HAB); problematic and conditions that induce them. Mar. Pollut. Bull. 53, 620–630. doi: 10.1016/j.marpolbul.2006.08.006
Matsen, F. A., Kodner, R. B., and Armbrust, E. V. (2010). pplacer: linear time maximum-likelihood and bayesian phylogenetic placement of sequences onto a fixed reference tree. BMC Bioinformatics 11:538. doi: 10.1186/1471-2105-11-538
Moore, L. R., Rocap, G., and Chisholm, S. W. (1998). Physiology and molecular phylogeny of coexisting Prochlorococcus ecotypes. Nature 393, 464–467. doi: 10.1038/30965
Paterson, S., Vogwill, T., Buckling, A., Benmayor, R., Spiers, A. J., Thomson, N. R., et al. (2010). Antagonistic coevolution accelerates molecular evolution. Nature 464, 275–278. doi: 10.1038/nature08798
Pearson, G. A., Lago-Leston, A., Canovas, F., Cox, C. J., Verret, F., Lasternas, S., et al. (2015). Metatranscriptomes reveal functional variation in diatom communities from the Antarctic Peninsula. ISME J. 9, 2275–2289. doi: 10.1038/ismej.2015.40
Preston-Thomas, H. (1990). The international temperature scale of 1990 (ITS-90). Metrologia 27, 3–10. doi: 10.1088/0026-1394/27/1/002
Pruesse, E., Quast, C., Knittel, K., Fuchs, B. M., Ludwig, W. G., Peplies, J., et al. (2007). SILVA: a comprehensive online resource for quality checked and aligned ribosomal RNA sequence data compatible with ARB. Nucleic Acids Res. 35, 7188–7196. doi: 10.1093/nar/gkm864
R Core Team (2016). R: A Language and Environment for Statistical Computing. Vienna: R Foundation for Statistical Computing.
Rodríguez, F., Derelle, E., Guillou, L., Le Gall, F., Vaulot, D., and Moreau, H. (2005). Ecotype diversity in the marine picoeukaryote Ostreococcus (Chlorophyta, Prasinophyceae). Environ. Microbiol. 7, 853–859. doi: 10.1111/j.1462-2920.2005.00758.x
Rohardt, G., and Cembella, A. (2012). Physical oceanography during HEINCKE cruise HE358. PANGEA Data Publisher Earth Environ. Sci. doi: 10.1594/PANGAEA.785573
Scholin, C. A., Herzog, M., Sogn, M., and Anderson, M. (1994). Identification of group- and strain-specific genetic markers for globally distributed Alexandrium (Dinophyceae). II. Sequence analysis of a fragment of the LSU rRNA gene. J. Phycol. 30, 999–1011. doi: 10.1111/j.0022-3646.1994.00999.x
Seeleuthner, Y., Mondy, S., Lombard, V., Carradec, Q., Pelletier, E., Wessner, M., et al. (2018). Single-cell genomics of multiple uncultured stramenopiles reveals underestimated functional diversity across oceans. Nat. Commun. 9:310. doi: 10.1038/s41467-017-02235-3
Slocum, R. D. (2005). Genes, enzymes and regulation of arginine biosynthesis in plants. Plant Physiol. Biochem. 43, 729–745. doi: 10.1016/j.plaphy.2005.06.007
Sohm, J. A., Ahlgren, N. A., Thomson, Z. J., Williams, C., Moffett, J. W., Saito, M. A., et al. (2016). Co-occurring Synechococcus ecotypes occupy four major oceanic regimes defined by temperature, macronutrients and iron. ISME J. 10, 333–345. doi: 10.1038/ismej.2015.115
Stecher, A., Neuhaus, S., Lange, B., Frickenhaus, S., Beszteri, B., Kroth, P. G., et al. (2016). rRNA and rDNA based assessment of sea ice protist biodiversity from the central Arctic Ocean. Eur. J. Phycol. 51, 31–46. doi: 10.1080/09670262.2015.1077395
Stránská, J., Kopčný, D., Tylichová, M., Snégaroff, J., and Šebela, M. (2008). Ornithine δ-aminotransferase: an enzyme implicated in salt tolerance in higher plants. Plant Signal. Behav. 3, 929–935. doi: 10.4161/psb.6771
Strom, S. L. (2008). Microbial ecology of ocean biogeochemistry: a community perspective. Science 320, 1043–1045. doi: 10.1126/science.1153527
Tatusov, R., Fedorova, N., Jackson, J., Jacobs, A., Kiryutin, B., Koonin, E., et al. (2003). The COG database: an updated version includes eukaryotes. BMC Bioinformatics 4:41. doi: 10.1186/1471-2105-4-41
Taylor, F. J. R. (2004). “Extraordinary dinoflagellates : past and present,” in Neo-Science of Natural History: Integration of Geoscience and Biodiversity Studies : Proceedings of International Symposium on “Dawn of a New Natural History - Integration of Geoscience and Biodiversity Studies, (Sapporo: Graduate School of Science, Hokkaido University).
Tyrrell, T. (1999). The relative influences of nitrogen and phosphorus on oceanic primary production. Nature 400, 525–531. doi: 10.1038/22941
Van de Waal, D. B., Smith, V. H., Declerck, S. A. J., Stam, E. C. M., and Elser, J. J. (2014). Stoichiometric regulation of phytoplankton toxins. Ecol. Lett. 17, 736–742. doi: 10.1111/ele.12280
Vergin, K. L., Beszteri, B., Monier, A., Thrash, J. C., Temperton, B., Treusch, A. H., et al. (2013). High-resolution SAR11 ecotype dynamics at the Bermuda Atlantic time-series study site by phylogenetic placement of pyrosequences. ISME J. 7, 1322–1332. doi: 10.1038/ismej.2013.32
von Dassow, P., John, U., Ogata, H., Probert, I., Bendif, E., Kegel, J. U., et al. (2015). Life-cycle modification in open oceans accounts for genome variability in a cosmopolitan phytoplankton. ISME J. 9, 1365–1377. doi: 10.1038/ismej.2014.221
Wohlrab, S., Iversen, M. H., and John, U. (2010). A molecular and co-evolutionary context for grazer induced toxin production in Alexandrium tamarense. PLoS One 5:e15039. doi: 10.1371/journal.pone.0015039
Wohlrab, S., Tillmann, U., Cembella, A., and John, U. (2016). Trait changes induced by species interactions in two phenotypically distinct strains of a marine dinoflagellate. ISME J. 10, 2658–2668. doi: 10.1038/ismej.2016.57
Worden, A. Z., Follows, M. J., Giovannoni, S. J., Wilken, S., Zimmerman, A. E., and Keeling, P. J. (2015). Rethinking the marine carbon cycle: factoring in the multifarious lifestyles of microbes. Science 347:1257594. doi: 10.1126/science.1257594
Zhang, H., Finiguerra, M., Dam, H. G., Huang, Y. S., Xu, D. H., Liu, G. X., et al. (2013). An improved method for achieving high-quality RNA for copepod transcriptomic studies. J. Exp. Mar. Biol. Ecol. 446, 57–66. doi: 10.1016/j.jembe.2013.04.021
Zhang, H., Hou, Y., Miranda, L., Campbell, D. A., Sturm, N. R., Gaasterland, T., et al. (2007). Spliced leader RNA trans-splicing in dinoflagellates. Proc. Natl. Acad. Sci. U.S.A. 104, 4618–4623. doi: 10.1073/pnas.0700258104
Keywords: plankton, metabarcoding, metatranscriptomics, dinoflagellates, adaptation, molecular ecology
Citation: Wohlrab S, Falcke JM, Lin S, Zhang H, Neuhaus S, Elferink S, Voss D, Zielinski O and John U (2018) Metatranscriptome Profiling Indicates Size-Dependent Differentiation in Plastic and Conserved Community Traits and Functional Diversification in Dinoflagellate Communities. Front. Mar. Sci. 5:358. doi: 10.3389/fmars.2018.00358
Received: 29 June 2018; Accepted: 18 September 2018;
Published: 10 October 2018.
Edited by:
Haiwei Luo, The Chinese University of Hong Kong, Hong KongReviewed by:
Marine Landa, University of California, Santa Cruz, United StatesDeana Erdner, University of Texas at Austin, United States
Copyright © 2018 Wohlrab, Falcke, Lin, Zhang, Neuhaus, Elferink, Voss, Zielinski and John. This is an open-access article distributed under the terms of the Creative Commons Attribution License (CC BY). The use, distribution or reproduction in other forums is permitted, provided the original author(s) and the copyright owner(s) are credited and that the original publication in this journal is cited, in accordance with accepted academic practice. No use, distribution or reproduction is permitted which does not comply with these terms.
*Correspondence: Sylke Wohlrab, U3lsa2UuV29obHJhYkBhd2kuZGU=