 Sarai Pouso
 Silvia Ferrini
 R. Kerry Turner2
 María C. Uyarra
 Ángel Borja
- 1Marine Research Division, AZTI, Pasaia, Spain
- 2Centre for Social and Economic Research on the Global Environment, School of Environmental Sciences, University of East Anglia, Norwich, United Kingdom
- 3Department of Political and International Sciences, University of Siena, Siena, Italy
In the Nerbioi estuary (North Spain), the Wastewater Treatment Plant (WWTP) constructed in 1990 resulted in an abrupt decrease in water pollution and an opportunity for improved recreational experiences in the three beaches on the estuary. The monetary value of these recreational benefits was estimated using the travel cost method and compared, via a partial cost-benefit analysis, with the costs of beach maintenance. The travel cost models reveal that summer recreational trips to the three Nerbioi beaches have a value of 5.99, 7.06, and 8.09 € trip-1, respectively. Visitor’s profile and social characteristics influenced the models, while the effects of these variables also varied across beaches. Following a conservative approach, the aggregate recreational value of the estuarine beaches was estimated to be more than 3.5 million year-1. This economic benefit, obtained from summer estimates and focusing on one ecosystem service (i.e., beach recreation) from the multiple ones offered by the estuary, is sufficient to cover 100% of annual beach maintenance costs and 12% of the annual sewerage system running costs. Our findings highlight that investing in water sanitation projects such as WWTPs are not only important for the ecological recovery of degraded coastal environments, but also produce additional human benefits that are able to cover (at least) part of the running cost of these large capital investments.
Introduction
Due the large number of ecosystem services that they provide, estuaries are the marine ecosystems that support to the widest range of human activities (Barbier et al., 2011; Elliott and Whitfield, 2011; Barbier, 2017). Recreation is one of those estuarine human activities. It is considered to be a cultural ecosystem service (Hernández-Morcillo et al., 2013), which is important for human well-being (Haines-Young and Potschin, 2010) and an input into coastal economies (Barry et al., 2011). However, the estuarine ecosystem services are at risk due to their fragility and exposure to over-exploitation (Lotze et al., 2006; Turner and Schaafsma, 2015).
Investing in environmental restoration could possibly help to halt degradation, conserve biodiversity and secure the supply of ecosystem services (Benayas et al., 2009). The efficient use of scarce investments requires that the performance of the restoration project should be appraised in terms of the capital and running costs of the investments, and the yield in the form of ecological and human benefits (Pearce and Turner, 1990; De Groot et al., 2013). If benefits/costs can be meaningfully expressed in monetary term, cost-benefit analysis can help to support decision making in estuaries restoration and maintenance (Turner, 2016). The monetary valuation of a spectrum of ecosystem services requires a wide range of tools and methods (De Groot et al., 2012; Badura et al., 2016; Costanza et al., 2017). Among these tools, revealed preference and stated preference techniques are usually applied to estimate ecosystem services that lack a market value, such as recreation. Revealed preference methods infer values from observed behavior, and thus, from actual choices people make within markets (Boyle, 2003; Ferrini et al., 2014). Stated preference methods attempt to establish non-market values using survey questions, usually by asking respondents to choose between different scenarios (Brown, 2003; Metcalfe et al., 2012).
Beach recreation, which is often an open-access and non-priced good, has been commonly valued in monetary terms using the travel cost revealed preference method (Parsons, 2003; Milcu et al., 2013; Alves et al., 2017). The travel cost method estimates the monetary value of recreational benefits to be at least what visitors are willing to pay to get to the recreation site (Farber et al., 2002). The travel cost methodology allows for the inclusion of the social characteristics of visitors. This characteristic is relevant when the user’s profile is thought to be affecting the benefit obtained. Indeed, social characteristics can shape preferences and values toward ecosystem services (Martín-López et al., 2012), which will condition the valuation of a specific benefit.
In this investigation, we focus on a case study of the beaches located inside the restored Nerbioi estuary (Basque Country, northern Spain). The aim is to examine the water quality restoration costs, including the construction of the main Wastewater Treatment Plant (WWTP), the beach maintenance costs, and the beach recreational benefits. We then adopt a “partial” cost-benefit approach to focus only on beach recreation and beach maintenance costs. The ex post capital costs of the WWTP are treated as “sunk costs,” i.e., a cost that has already been incurred and cannot be recovered. Strictly speaking the current and future running costs of the WWTP should be included in the cost-benefit analysis. However, it is difficult to apportion plant running costs to just beach recreation as the WWTP related-investment has benefited other ecosystem services, not just recreation (i.e., recreational fishing, CO2 capture, etc.). Therefore, our cost-benefit analysis is restricted in its scope to a comparison of the beach recreation benefits with beach maintenance costs. The restored estuary will provide much more than just beach recreation/amenity benefits, e.g., improved fishing, biodiversity and human health benefits, but so far, these have not been monetarily assessed.
Nerbioi Estuary Restoration and Beach Recreation
The estuary of Nerbioi is 22 km long and it has two distinct zones: (i) the inner part, a channelized zone of 15 km length that crosses the city of Bilbao; and (ii) the outer part, a coastal embayment of around 30 km2 highly occupied by industrial and recreational ports (Figure 1). The nine villages located along the two banks of the estuary comprise the highest population density in the Basque Country, with more than 696,000 inhabitants1.
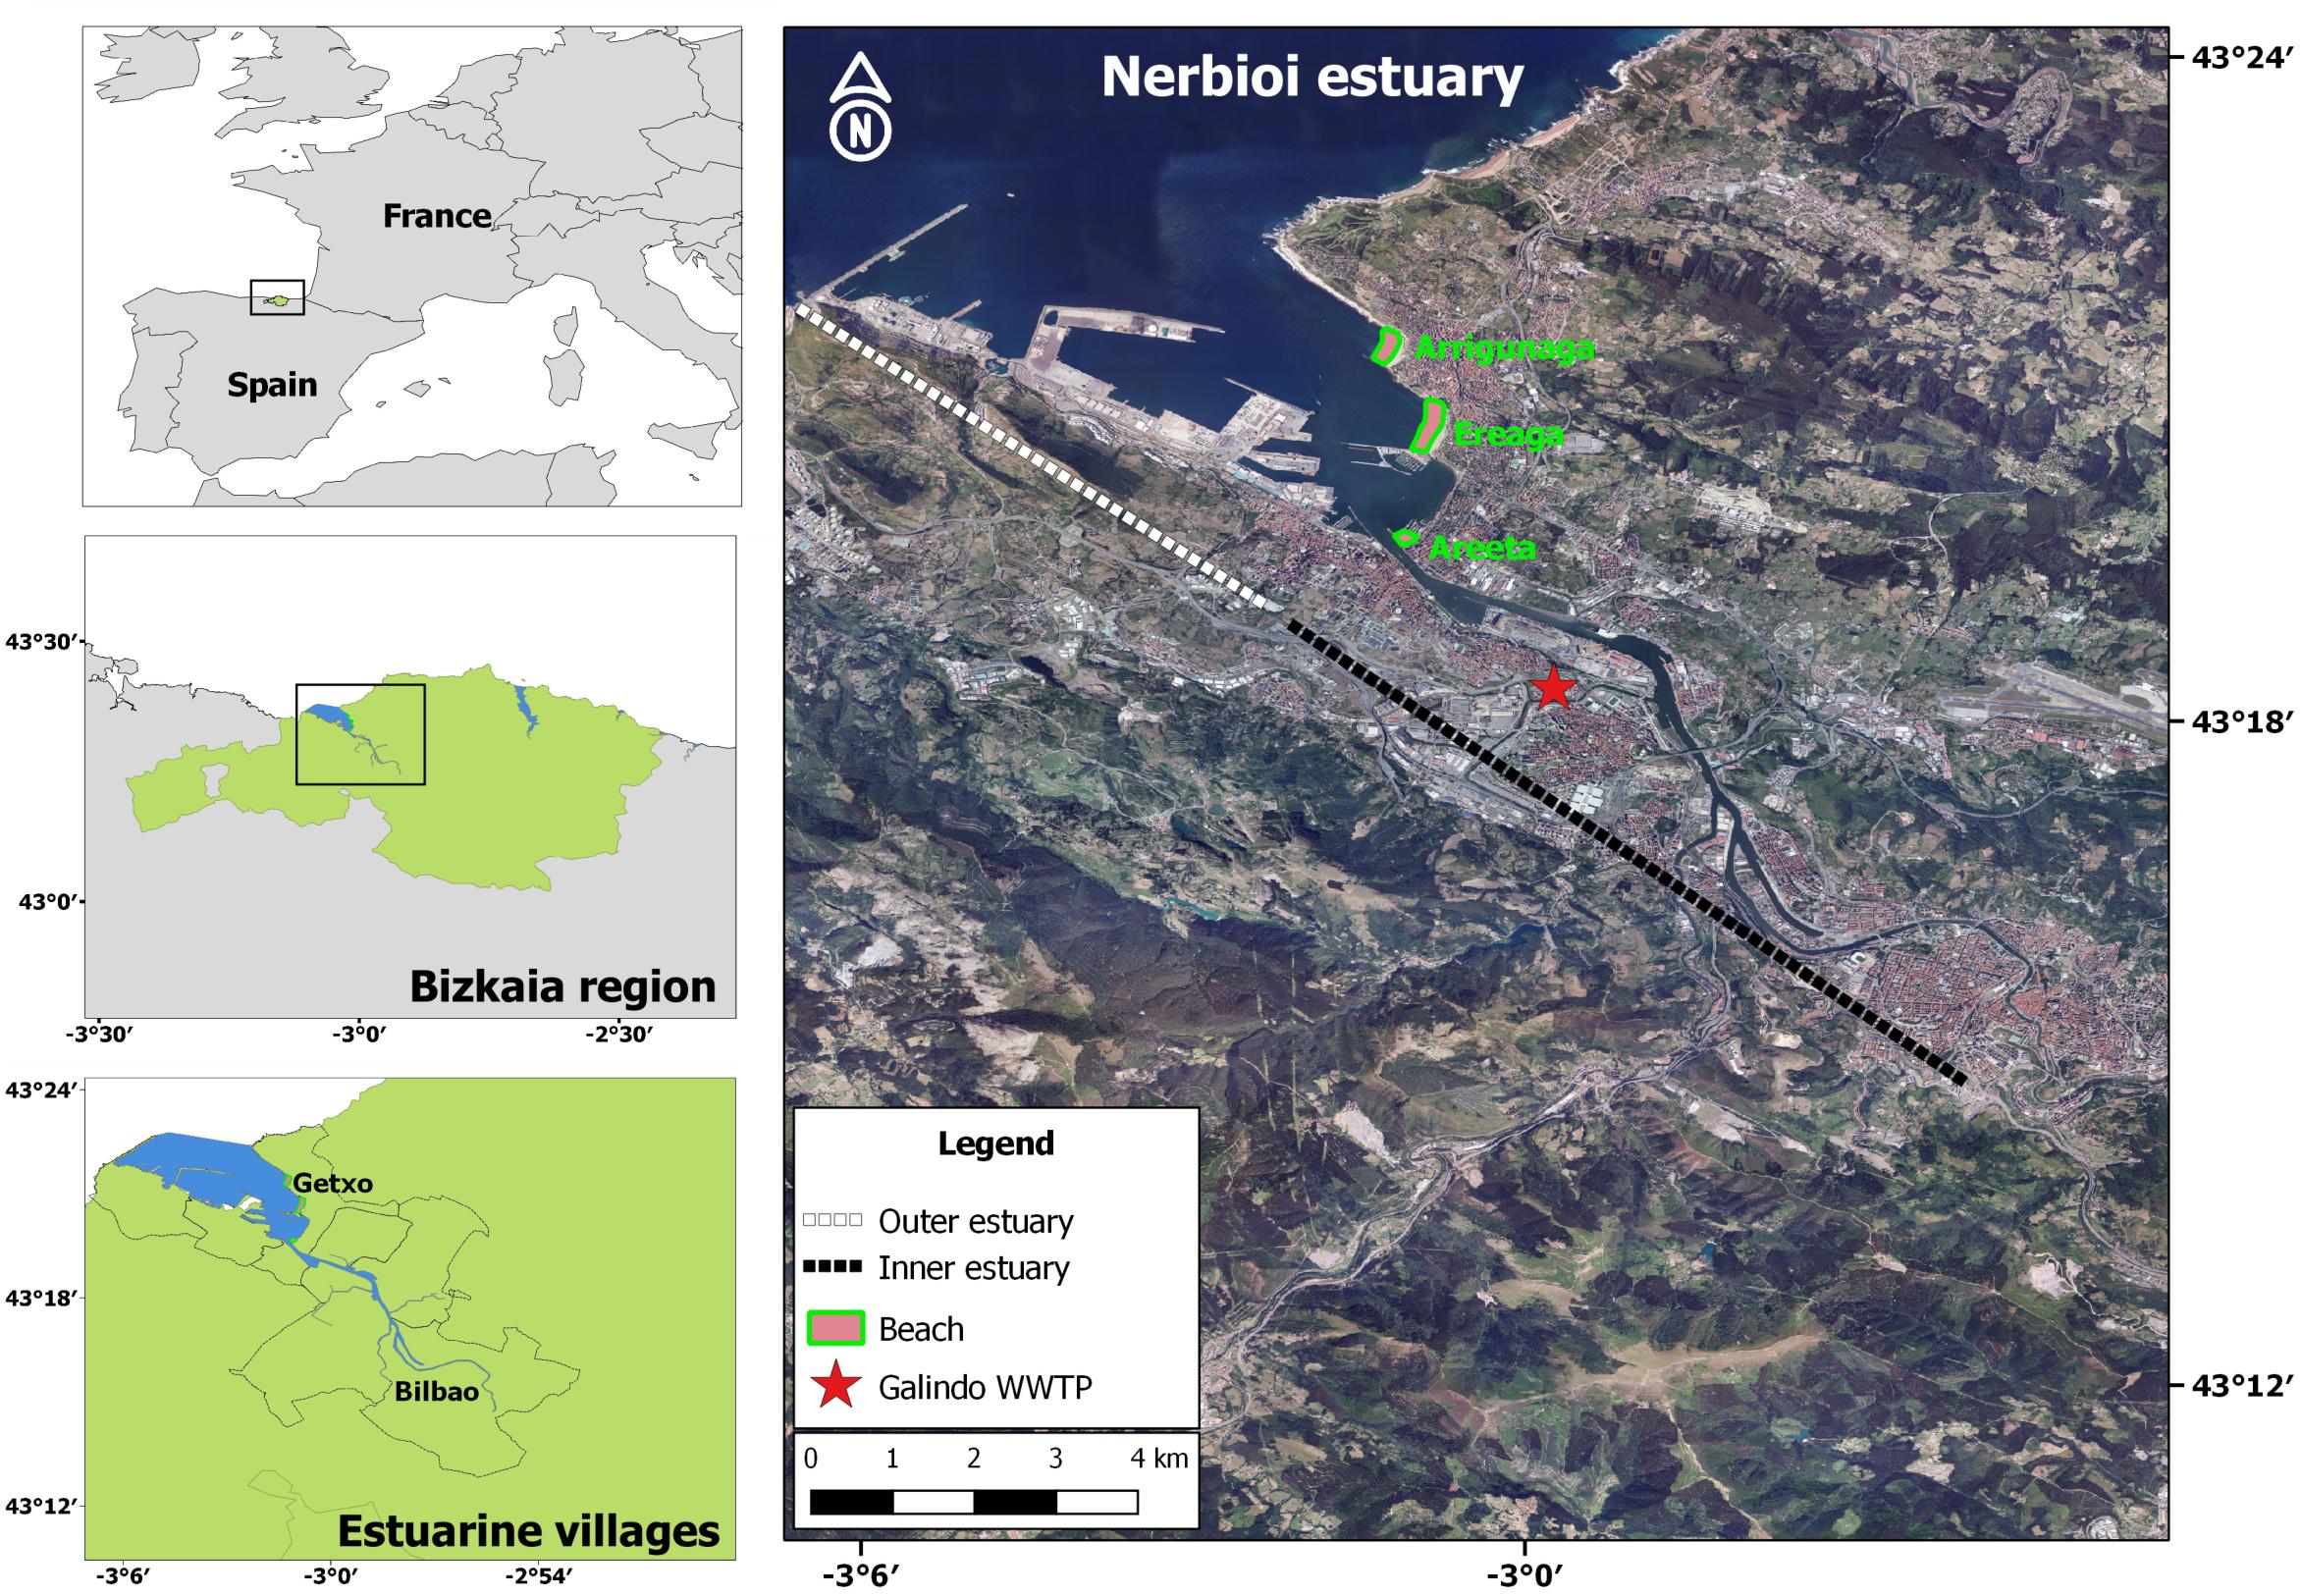
FIGURE 1. Location of the Nerbioi estuary at different geographical scales (within the Bay of Biscay and Bizkaia region); and location of the three beaches in the outer part of the Nerbioi estuary. WWTP, Wastewater Treatment Plant.
From the second half of the 19th century, the industry, urban and port developments in the estuarine villages transformed the area into one of the most important economic zones in Spain, mainly due to the development of iron and steel industries. However, the economic development also turned the estuary into the most polluted coastal area of northern Spain, changing and degrading its morphology and the ecological conditions (Cearreta et al., 2000, 2004). Non-treated industrial wastes and domestic sewage that were discharged directly into the estuary (Belzunce et al., 2004; Borja et al., 2006), caused intense pollution in its waters (Borja et al., 2010) and limited the recreational use of its internal beaches (García-Barcina et al., 2002).
In 1979, after the public and regulatory concerns about the environmental degradation of the area, a water sanitation plan was approved by local authorities (Pascual et al., 2012). The aim of the plan was to restore the good aesthetic, sanitary and ecological conditions along the estuary, and aid the recovery of the estuarine beaches. The main investment in the estuarine recovery has been the implementation of the WWTP of Galindo (Figure 1). Between 1989 and 2017, 660 million € have been invested in sanitation infrastructures and wastewater treatment at this WWTP (Pascual et al., 2012). Currently, the annual running costs of the WWTP of Galindo (including energy, maintenance, operation, etc.) have been estimated at more than 19 million €, while the ones of the peripherical systems (i.e., other WWTP that discharge in Nerbioi’s tributaries, and therefore waters that arrive to the estuary) have estimated cumulative costs of more than 4 million € year-1 (Table 1).
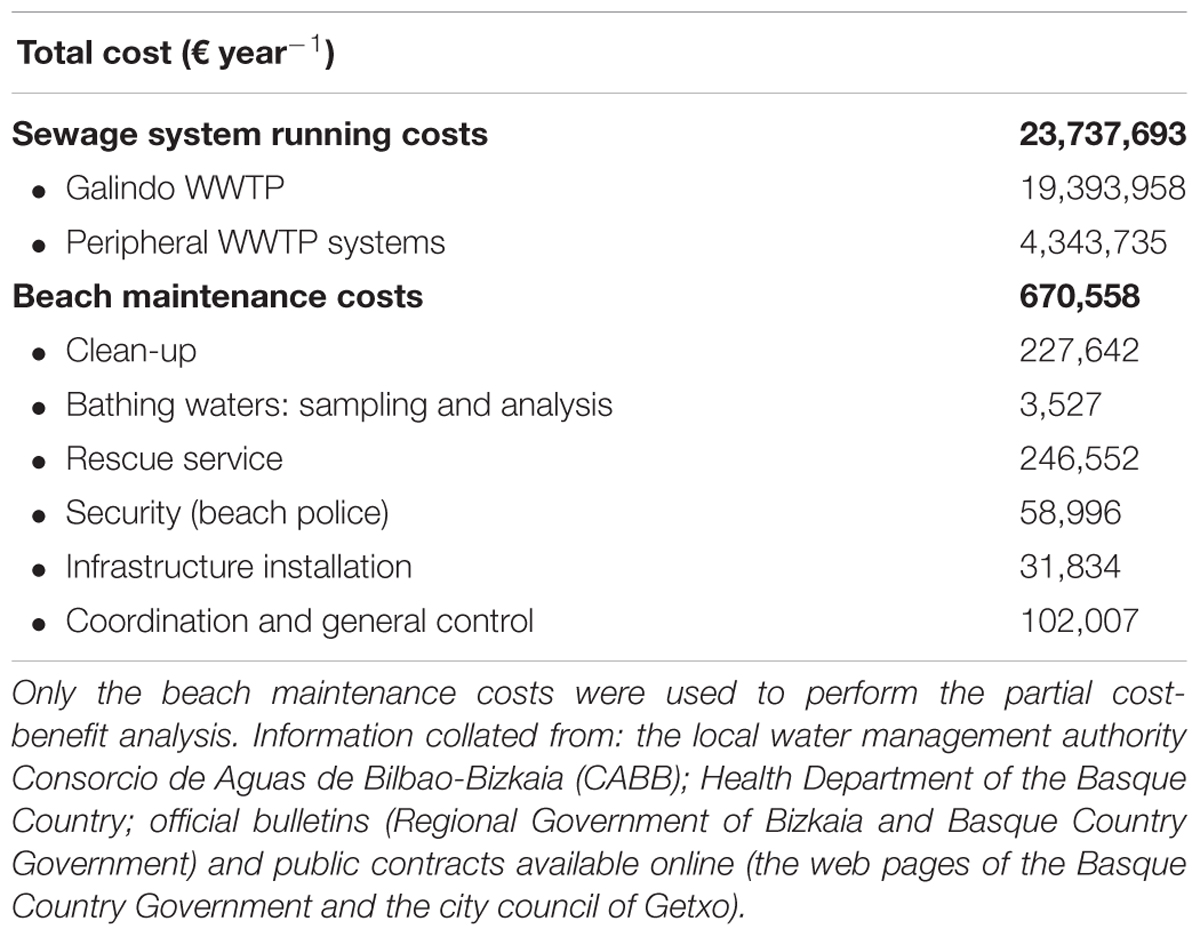
TABLE 1. Annual costs (excluding VAT) of the sewage system [Wastewater Treatment Plant (WWTP) of Galindo and peripheral systems] and maintenance of beaches.
The implementation of the WWTP of Galindo and the decline of industrial activities at the end of the 20th century allowed the progressive recovery of the estuarine waters (Cajaraville et al., 2016), with a consequent improvement in the ecological quality (Borja et al., 2016), biological value (Pascual et al., 2012) and positive effects in cultural ecosystem services such as recreational fishing and beach recreation (Pouso et al., 2018a,b).
Focusing on beach recreation, three beaches can be found inside the estuary, all of them located on the right bank of the outer estuary and in Getxo village: (i) Areeta has the smallest sandy-shore and it is the closest to the inner part of the estuary; (ii) Ereaga, the middle beach, has the largest sandy-shore area and receives the highest number of visitors during summer; and (iii) Arrigunaga is the outermost beach (Table 2). The bathing waters of these beaches recovered gradually, firstly in the external beaches, Ereaga and Arrigunaga, and more recently in Areeta, the innermost beach (Pouso et al., 2018b). Currently, the waters of these three beaches are the only declared bathing water areas inside the estuary. The current maintenance costs of these three beaches have been estimated to be 670,558 € year-1, including all-year-around clean-up and specific summer services such as rescue and security services, infrastructure installation, etc. (Table 1).
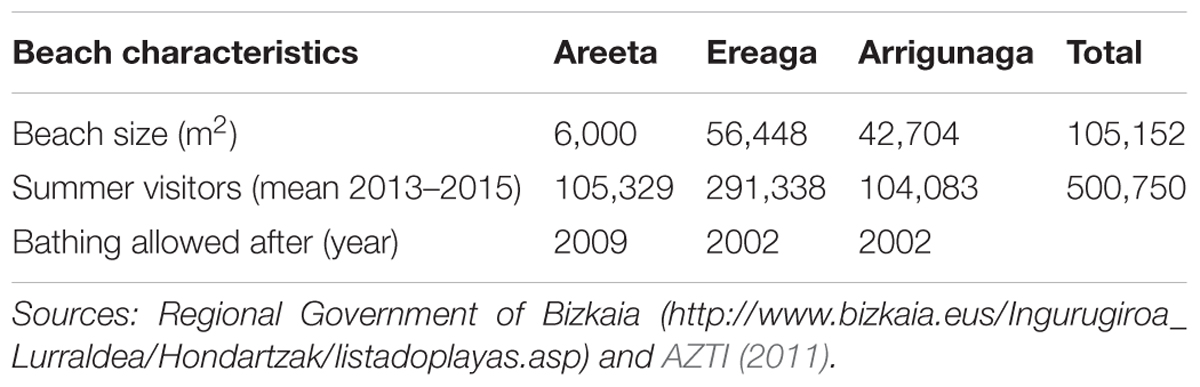
TABLE 2. Main characteristics of the beaches.
The mean profile of a visitor to Nerbioi beaches can be described as middle aged, educated, mostly female, living in one of the estuarine villages (Pouso et al., 2018b). Their main motivations for going to the beach are sunbathing, relaxing and bathing. While the reasons for choosing to visit these specific beaches are their proximity to home, their accessibility and their tranquility (Pouso et al., 2018b). The main differences between beach visitors are: (i) in Areeta and Arrigunaga, there is a higher proportion of locals who reach the beach walking, while in Ereaga, there is a higher proportion of visitors who live in other estuarine villages and access the beach by car; and (ii) the worst perception of and attitude toward bathing waters are found among Areeta visitors, where a lower percentage of people practiced aquatic activities (Pouso et al., 2018b).
Materials and Methods
Partial Cost-Benefit Analysis
A partial cost-benefit analysis was done to monetarily asses the beach recreation activity in the Nerbioi estuary. Cost-benefit analysis is an analytical tool to assess the welfare change attributable to an investment (Sartori and European Commission, 2015). Cost-benefit analysis can be used for valuing the expected benefits of alternative investments. After the implementation of a restoration project in a degraded system, we can use a cost-benefit analysis to assess the gain in ecosystem services benefits against the restoration investment costs (Bullock et al., 2011). In the Nerbioi estuary, we focus on a comparison of the social benefits, in terms of beach recreational opportunities, with the costs necessary to maintain the beach recreation quality, grouped as beach maintenance costs in Table 1.
The cost-benefit analysis of the discounted flows of gains and losses is estimated for the 2016–2030 period and assessed through the Economic Net Present Value (ENPV) performance indicator. In Spain, there is no consensus on the discount rate that should be applied when performing cost-benefit analysis, although it usually varies between 4 and 6% (Souto Nieves, 2001; Cruz Rambaud and Muñoz Torrecillas, 2006; Sartori and European Commission, 2015). Therefore, the ENPV in Nerbioi was estimated with three different social discount rates: 3%, 4%, and 5%.
To check the effect on the ENPV of a ±1% variation in benefits and costs, two sensitivity analysis were performed. If a 1% variation in the costs or benefits caused a variation in the ENPV > 1%, the variable was considered critical (Sartori and European Commission, 2015). Afterward, the switching values (i.e., the decreases in benefits and increases in costs needed for ENPV to equal zero) were estimated.
Finally, three future scenarios were simulated: (i) a decrease in population based on the future prospects by the Basque Statistical Institution (Eustat, 2014), which estimated a decrease of 5.6% for Bizkaia region between 2014 and 2026.; (ii) a continued rise in beach maintenance costs of 3.5% every 2 years, based on the increase registered for the period 2016–2018; and (iii) a combination of scenarios 1 and 2.
Cost Estimation
The sewage system running costs (Table 1) were not included in the partial cost-benefit analysis, as they serve the region’s population (García-Barcina et al., 2006) and are linked to the provision of other ecosystem services and benefits, not just beach recreation.
Therefore, to perform the partial cost-benefit analysis in Nerbioi, the costs of beach maintenance (Table 1) were considered as the only direct costs attributable to the beach recreation activity. The monetary budgets of all the activities needed for the beach maintenance and services (i.e., beach running costs) represent the cost-opportunity of local government investments for maintaining the ecosystem recreation service in the estuary.
Valuation of Beach Recreation Benefits
The second component needed to perform the cost-benefit analysis is the estimation of the benefits. Non-marketed goods such as beach recreation can be valued using revealed preference methods, which infer values from observed actual behavior (Champ et al., 2003). In this study, the single site travel cost approach was selected, which is one of the most used revealed preference methods to estimate the economic use values of recreational activities (Parsons, 2003).
For the Nerbioi beaches, the annual benefits were calculated in two steps: (i) building single-site travel cost models for each beach; and (ii) estimating the aggregated surplus values based on the total number of trips to each beach in summer (Parsons, 2003). As estimates only consider visitors for a period of the year, the benefits will be underestimated. The data used to build the travel costs models were collected through a questionnaire distributed across the three beaches during summer 2016. The beach users who answered the questionnaire were selected in an aleatory way, and only people older than 16 years old were asked to complete the questionnaire. To obtain a balanced and representative sample of participants across beaches, the interviewer distributed questionnaires according to beach visitation rates (Table 2). A total of 426 questionnaires were collected in the three beaches. Detailed information on questionnaire design and distribution can be consulted in Pouso et al. (2018b).
The number of recreation trips to the beach taken by each respondent during summer season (i.e., from June to September) was established as the dependent variable of the travel costs function. The mean number of recreational trips during summer was estimated in 26 ± 22 trips.
Given the selected dependent variable count data, the travel cost models were built as Poisson regressions, and dependent on the travel cost (TC), travel cost to the substitute site (TCS), income (I) and several demographic variables (SC) (Parsons, 2003):
The first element conditioning the number of trips to the recreational site is the travel cost (TC). For each visitor, TCi was defined as the sum of the travel expenses required to reach the beach (TEi) and the time cost (tCi):
The first step to estimate the TCi, was to calculate the distance and time from the origin to the destination. The origin was considered as the postal code from where the visitor began their journey to the beach (home, work, accommodation, etc.). The origin was defined as the coordinates of the centroid of the postal code area, while the destination was defined as the coordinates of the visited beach.
When the visitors reached the beach, walking, driving or cycling, the distance and time were calculated using the ggmap package (Kahle and Wickham, 2013) in R environment (R Core Team, 2015). When the visitors reached the beach by public transport, distance and time were calculated splitting them into three parts: (i) the walking distance and time from the origin to the nearest train or metro station; (ii) the distance and time in public transport from the origin station to the destination station; and (iii) the walking distance and time from the destination station to the beach. Walking distances and times for (i) and (iii), and driving distances and times for (ii) were calculated using the ggmap package (Kahle and Wickham, 2013). When public transport was used, i.e., the underground, the distance in (ii) was estimated using Google Maps2, and time in (ii) was estimated using the information on travel times between stations3.
The travel expenses (TEi) were estimated according to the transport used. When the visitor reached the beach walking or cycling, travel expenses were considered equal to zero. When the visitor reached the beach using public transport, the price of a round ticket from the origin to the destination was considered. If the visitor reached the beach driving, the travel expenses were estimated as:
where tolli is the one-way price of the highway toll; Di is the distance traveled; carCost is the average running cost per km of a vehicle in Spain (=0.35€)4; parkfee is the price per hour of car park (=1.07€, only applicable in Areeta); and tbeachi is the time expend at the beach. For those visitors who revealed to have reach the beach by car and accompanied, they were expected to share the costs and consequently, TEiCar was divided by 2.
Following Fezzi et al. (2014), time costs (tCi) for each visitor were calculated as:
where ti is the time spend traveling from the origin to the destination by each visitor; and tCmean is a constant that indicates the monetary value of the time spend traveling (€ min-1), calculated as:
where Iind is the mean available income per individual in the sample (=13,639 € year-1); wh is the average annual working hours (=2080 h); and VTT is the average value of travel time per income fixed at 3/4 (Fezzi et al., 2014).
The second element conditioning the number of trips to a recreational site is the travel costs to a substitute site (TCS). The substitute site is usually considered as a site located nearby or with similar characteristics to the visited site (Parsons, 2003). We considered that the three beaches of the estuary act as substitute sites for one another. Thus, from the two possible substitute beaches, the one located closest to the origin of each visitor was considered as the substitute site. TCSi was estimated exactly as for the TCi, replacing the destination coordinates by the ones of the substitute site.
Finally, the monthly household income (Ii) and other demographic variables (Table 3) were explored to be included in the travel cost models. Before incorporating them in the travel cost models, some of the demographic variables were transformed into dummy variables (Table 3). Later, all the demographic variables were tested against TC, TCS, and Income with different statistical test. This step was done to avoid multicollinearity in the regression models by discarding the variables that showed significant correlation. The variables, TC, TCS, and Income were compared with demographic variables using: (i) Spearman’s Rank correlation when the demographic variable was continuous or ranked-categorical; (ii) Mann–Whitney U Test, to compare TC and TCS with dichotomous variables; or (iii) Chi-squared analysis, to compare Income with dichotomous variables. The variables that showed correlation with TC, TCS, and/or Income were removed from further analysis. The independence between the remaining demographic variables was later checked with the Fisher’s exact Test.
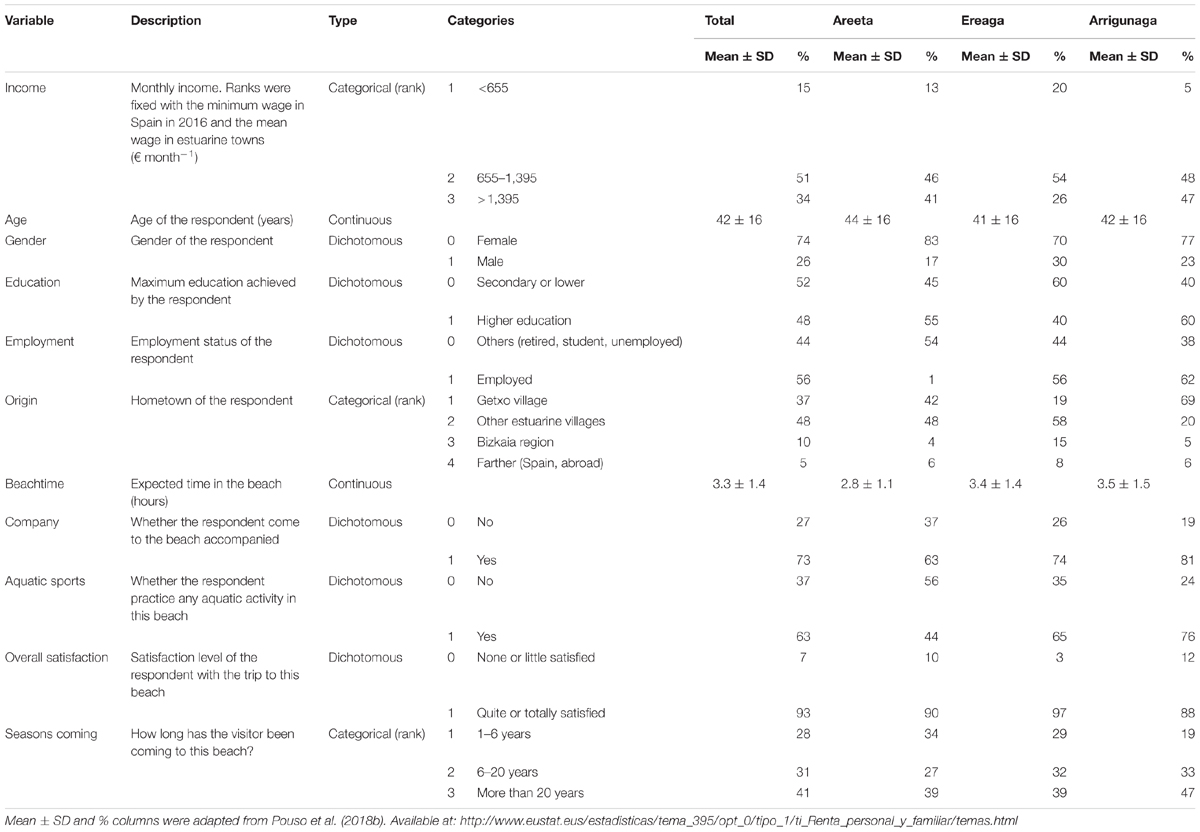
TABLE 3. Income and demographic variables considered in the travel cost models.
A demand function for each beach was estimated as the Poisson regression models using the stats package in R environment (R Core Team, 2015). As the questionnaires were answered on-site, the dependent variable was corrected for selection bias as suggested by Parsons (2003). The basic models included the number of recreation trips to the beach taken by each respondent as the dependent variable, and TC, TCS, and Income as the independent variables. In the final models, the demographic variables were included.
The results of the Poisson models were used to calculate the aggregate access value for each beach (Parsons, 2003):
where TRIPS is defined as the total number of day trips to the beach during summer and calculated as the mean number of visits for the period 2013–20155; and is the average per-trip value in the Poisson model. After Parsons (2003), is defined as:
where is the coefficient for TC on the Poisson models.
Results
Valuation of Beach Recreation Benefits
From the 426 questionnaires collected, 400 could be used to perform the travel cost analysis (93 in Areeta, 209 in Ereaga, and 98 in Arrigunaga). The mean TC value was 5.63 € trip-1 (min. 0.73, max. 44.89 € trip-1) while mean TCS was estimated at 6.40 € trip-1 (min. 0.21, max. 43.44 € trip-1).
In the basic Poisson regression models (i.e., built only with TC, TCS, and Income), the TC estimate was negative and significant at the three beaches (Supplementary Table 1). The TCS estimate was significantly positive in Ereaga and Arrigunaga, while in Areeta, it was significantly negative. The significant negative influence of TCS could be indicating that neither Ereaga nor Arrigunaga act as substitute sites for Areeta. Therefore, in the next step, where demographic variables were incorporated in the models, TCS was considered equal to 0 for Areeta. Also, in Areeta surveys, it was detected that some respondents could be visiting the beach as part of a multiple purpose trip, especially when they arrived using a transport different from walking. In order to avoid an overestimation of the travel cost and consequently, an overestimation of the aggregate surplus value in Areeta, only the visitors who reach the beach walking were used to build the model (n = 59).
A total of seven demographic variables (i.e., age, gender, education, employment, origin, beach time, and seasons coming) were found to be significantly correlated with TC, TCS, and/or Income (p-value < 0.05 for the different test performed) (Supplementary Table 2) and therefore, removed from further analysis to avoid multicollinearity. The remaining demographic variables were company, aquatic sports, and overall satisfaction. The Fisher’s Tests confirmed that these three variables were not significantly correlated between them and were included in the definitive Poisson models.
In the definitive Poisson regression models, the number of trips decreased as TC increased, while the number of trips taken to Ereaga and Arrigunaga increased as TCS increased (Table 4). The demographic variables had different effects in each beach: in Ereaga, people with higher Income, those who came to the beach accompanied and satisfied visitors (i.e., overall satisfaction equal to 1), took a higher number of trips to the beach, while the effect of aquatic sports was the opposite (i.e., people practicing aquatic sports took less trips than those who did not practice any aquatic sports). In Areeta and Arrigunaga, the effect of Income and aquatic sports was opposite to the effect in Ereaga, meaning that people practicing aquatic sports took more trips to these beaches and that the number of visits decreased as the income increased. The overall satisfaction in Arrigunaga had the same effect as in Ereaga, meaning that satisfied visitors took more trips, while in Areeta the effect was the opposite.
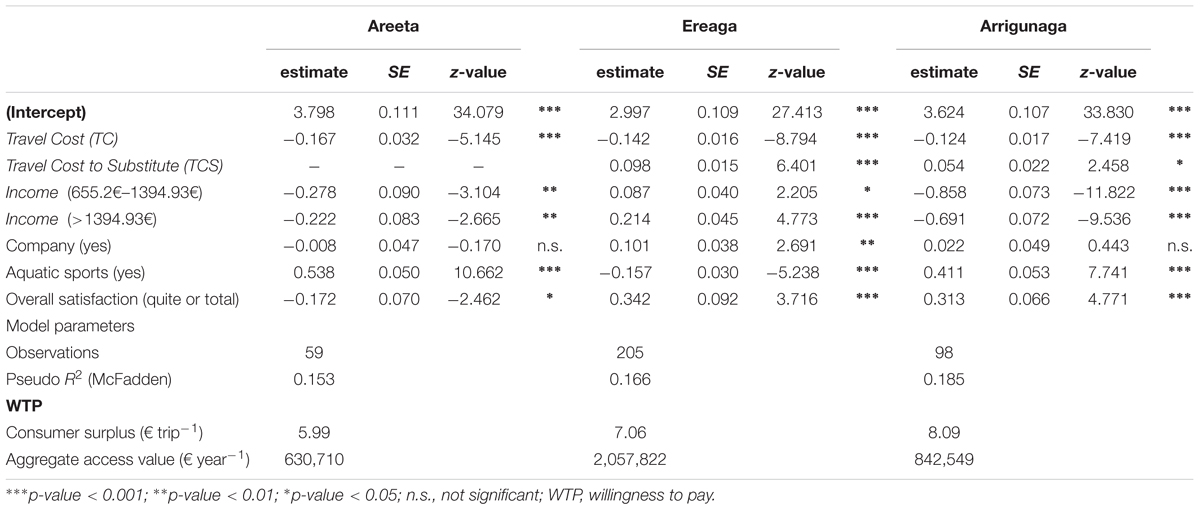
TABLE 4. Poisson models for recreational trips to Areeta, Ereaga, and Arrigunaga and the single and aggregate surplus.
The lowest consumer surplus and aggregate access value were estimated for Areeta (5.99 € trip-1 and 630,710 € year-1, respectively). Arrigunaga had the highest consumer surplus (8.09 € trip-1) and an aggregate value of 842,549 € year-1. In Ereaga, the consumer surplus was valued in 7.06 € trip-1, while the aggregate access value was 2,057,822 € year-1, the highest among the three beaches.
Partial Cost-Benefit Analysis
Considering the aggregate access values as the benefits returned to society and the beach maintenance costs as the costs directly attributable to beach recreation, we estimate that in total the three beaches provide ∼2.9 million € year-1. These benefits need now to be compared with costs and both discounted over the chosen time horizon. Assuming that annual running costs and benefits are constant for the period 2016–2030, the ENPVs ranged between 29.5 and 33.9 million € year-1, given the highest (5%) and the lowest (3%) SDR were applied, respectively (Table 5). After the sensitivity analysis, the beach recreation benefits were found to be a critical variable, as a 1% decrease in 2016 caused a decrease in ENPV of 1.24%. However, in order to nullify the benefits (ENPV = 0), we need to observe an 80% decrease in benefits, or 412% increase in costs.
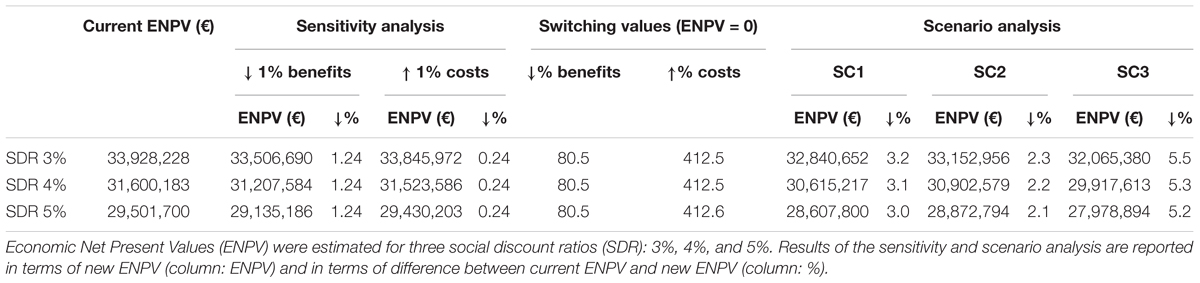
TABLE 5. Results of the cost-benefit analysis performed for 2016–2030.
The future reduction of the local population and increase in beach maintenance cost simulated through three scenarios caused ENPV reductions of >2% (Table 5). The lowest reduction was registered in scenario 2 (i.e., increase in beach maintenance costs), where ENPV decrease 2.1–2.3%. The highest ENPV reduction (5.2–5.5%) was predicted in scenario 3, where a combination of the effects of population decrease and maintenance cost increase were simulated. Scenario 1 (i.e., population decrease) caused an intermediate reduction in ENPV of 3.0–3.2%.
Discussion
A partial cost-benefit analysis was performed in the restored Nerbioi estuary to check if the non-marketed benefits obtained through beach-recreation can cover the current costs needed to deliver such a cultural ecosystem service. By building single-site travel cost models, we estimated the monetary value of beach recreation in an area where the water quality and ecological conditions have improved significantly in the last 25 years (Uriarte and Borja, 2009; Cajaraville et al., 2016).
The Poisson regression models built, revealed that significant differences exist between the recreation activities in the three beaches. The significant negative value of the TCS in Areeta indicated that there was not a real substitute site for this beach; which could be related with the characteristics of the beach and with the user’s profile. Areeta is, among the three estuarine beaches, the one with the highest urbanized surroundings and the worst water-quality conditions (Pouso et al., 2018b). These characteristics could be behind the differences found on the visitor’s profile. Indeed, Areeta visitors are known to be older and spent significant less time on the beach than was the case in the other beaches (Pouso et al., 2018b). Based on that previous study and the results obtained in the travel cost models, we concluded that the recreational activity in this beach is different to the recreational activity in Ereaga and Arrigunaga.
Comparing the travel cost models of the three beaches, we found that certain demographic characteristics had an opposite effect on the number of summer trips, which could be related with the specific characteristics of the beaches and the social profile of the visitors. Thus, a higher income in Ereaga had a positive effect on the number of trips, in line with travel cost studies in other areas (Fezzi et al., 2014; Ezebilo, 2016), while the effect was the opposite in the other two beaches. We think that this could be related with the higher number of non-locals found in Ereaga, which translates into a higher economic effort incurred every time they want to visit the beach (Prayaga, 2017). Therefore, those with higher incomes might be able to travel more frequently here. In Areeta and Arrigunaga, where the effect of the increase in income was the opposite, the reason could be related with the high percentage of local visitors from Getxo. We hypothesized that the high percentage of locals in Areeta and Arrigunaga made the income variable effect to reverse, as wealthier locals can spend more traveling to farther and more appealing beaches. Indeed, the region has several beaches located nearby that have maintained historically better water quality conditions than the beaches in the Nerbioi. The variable company was only found to be significant in Ereaga, and the effect was positive; the reason behind this effect could be again related to the fact that they traveled from further away. All these demographic characteristics translated into differences in the use of the goods, highlighting the importance of analysing the social demographic variables when performing ecosystems service valuation (Martín-López et al., 2007).
The high proportion of locals and of visitors living in the nearby villages who reach the beaches walking or using public transport have conditioned the results of our travel costs models. The travel cost method values the analyzed good considering how much the visitor must invest in terms of the time and trip costs to reach the recreational site; therefore, expenses are lower for those living near the visited site than for those living farther away (Parsons, 2003; Voke et al., 2013). Therefore, in Nerbioi beaches most of the visitors spent relatively low amounts of money in each trip and time effort to enjoy the good. However, the travel cost value could be an underestimation of the good, as enjoying recreation in local areas could be important in health/wellbeing and cultural terms, such as cultural identity and place attachment (Hoyos et al., 2009; Loomis and Paterson, 2014). These additional values are not captured by the travel cost models, so care should be taken when interpreting the estimated benefits.
The relatively low travel cost in the Nerbioi beaches is also highlighted when we attempted to compare our results with previous studies carried out in other beaches in Spain, such as in the Mediterranean coast (Ariza et al. (2012) estimated the consumer surplus in 17.9–42.6 € in summer and 9.7–29.8 € in winter) or the south-Atlantic coast (Alves et al. (2017) estimated the consumer surplus between 42.35 and 73.27 € in summer and 51.71–100.85 € in winter). This difference could again be an effect of the high percentage of local visitors in the Nerbioi, compared with the Mediterranean and south-Atlantic coasts, where ‘sun and beach tourism’ is more popular and historically attracts the highest number of visitors to Spain (Cànoves-Valiente et al., 2016). Indeed, the north-Atlantic coast, where Nerbioi estuary is located, has different climatic conditions than other coastal areas in Spain, with less sunshine hours during summer, lower overall temperatures and higher rainfall than the south-Atlantic and Mediterranean coasts (Sanchez-Lorenzo et al., 2007). This translates into worse bathing water conditions (Aragonés et al., 2016) and worse general conditions for beach recreation. Consequently, the Nerbioi beaches received less visits during summer than other beaches in Spain, which translated into lower aggregate surplus values. Furthermore, the aggregate surplus values were estimated only with the recreational trips taken during summer; however, these beaches are in urban locations and they attract visitors all year around, which will increase the aggregate surplus values. The lack of data on the number of beach visitors in winter impeded the calculation of the aggregate surplus values for this period. We consider that the probable underestimation of the beach recreation benefits in Nerbioi is a good practice, as afterward, the aggregate surplus values were used to perform a cost-benefit analysis.
Still, the aggregate surplus estimations in the three beaches covered the total annual beach maintenance costs and 12% of the sewerage system running costs (Table 1). This is a substantial amount, considering that as mentioned before, the benefits were estimated adopting a cautionary approach, as they were calculated considering “summer visitors” only and focusing on one ecosystem service. Indeed, our analysis focused on a single ecosystem service (i.e., beach recreation), even though the restored estuary is providing multiple benefits (including health/wellbeing) to local and visitors. Some of these additional benefits, for example recreational fishing, are highly dependent on water quality and therefore, they were only recovered after the improvements registered in the last decades (Pouso et al., 2018a). Most recently international sport competitions have taken place in the estuary with important economic revenues for the area. Other economic activities, such as the real estate market in the estuarine banks, have likely benefited from the rehabilitation of the Nerbioi estuary, as it has happened in other estuaries and coastal wetlands (Earnhart, 2001; Pendleton, 2010). Finally, the restoration of the Nerbioi estuary attracted the attention of multiple scientific marine disciplines, such as water and sediment pollution, biology and ecology contributing to the scientific knowledge and education; some examples are: (Cearreta and Leorri, 2000; Cearreta et al., 2000; Belzunce et al., 2001; Borja et al., 2006; García-Barcina et al., 2006; Uriarte and Borja, 2009; Pascual et al., 2012; Cajaraville et al., 2016). Some of the actual benefits could have been present for local visitors prior to the restoration process. Indeed, some of the beach recreation activities are non-water-quality dependent (e.g., sunbathing or sand sports such as volley ball), and these activities could be economically significant. To the best of our knowledge, there is not information available on beach use and activities prior to the water quality improvement; however, considering that most of the current visitors revealed that they practice aquatic activities in these beaches and that bathing is one of the main motivations to visit them (Pouso et al., 2018b); we can claim that the water quality improvement has been crucial for the current high number of visitors found in Nerbioi beaches.
The Nerbioi estuary is important in terms of ecosystem services, as well as an important area for the region in economic and social terms (Casado-Arzuaga et al., 2013). Many economic activities take place along its two banks and in the ports located inside the estuary. In addition, 61% of the Bizkaia region’s population lives in one of the nine estuarine villages. Therefore, the three beaches studied here offer the nearest beach recreational opportunity for a high number of people who chose to visit them mainly because of their proximity to home and their good accessibility (Pouso et al., 2018b).
The expected decrease in the region’s population will cause a decrease in benefits, but according to our results this reduction will not change the sign of the cost/benefit rate. Despite the likely reduction of local population, the promotion and advertising of the tourism sector by public institutions in the region and the existence of other recreational opportunities nearby (Casado-Arzuaga et al., 2014) are likely to boost the number of non-local visitors and halt the expected decrease in beach-recreation benefits.
Measuring in monetary terms the benefits provided by environmental goods has proved to offer useful information for policy makers and public (Garrod and Willis, 1999; Turner et al., 2010); and this also holds true for the Nerbioi estuary. The non-marketed benefit analysis performed in this study could be of special interest for all the institutions that contributed to the rehabilitation of the Nerbioi estuary. It indicates that decision support systems could use economic valuation and other evaluation methods to value the range of ecosystem services benefits restored thanks to the improvement of water quality. Future studies that aim at estimating market and non-market benefits provided by the recovered Nerbioi estuary could help to draw a more complete picture of the outcomes of the restoration project (set up nearly 30 years ago) in the area.
To perform an economic valuation of the ecosystem services gained after the implementation of a restoration project can provide easy-to-communicate information on the project’s outcomes. As seen for the Nerbioi beaches, the social characteristics of the users can influence the final monetary valuation of the ecosystem services, so the method to perform such a valuation should be chosen according to the type of ecosystem service to be valued and to the available information on service users.
Conclusion
The beach recreation service recovered after the restoration of the Nerbioi estuary has a significant monetary value, according to the conservative benefit estimation performed in this study. The beach-recreation benefits were able to cover the whole costs of beach maintenance plus an important percentage of the sewage scheme system costs. The use of econometric tools such as travel cost models to value non-marketed coastal ecosystem services provides important information that can be easily communicated to policy-makers and stakeholders. Travel cost accounts only for the used values and ignored additional benefits that could exist from the enjoyment of these areas, so results should be used with caution. Also, users’ profiles have proved to influence the final economic value, even when the analyzed areas are so close to one another. If possible, travel costs results should be combined with information collated using other valuation techniques.
Data Availability Statement
Datasets are available on request.
Author Contributions
SP, ÁB, and MU developed the idea of the study. SP, SF, and RT carried out the travel cost analysis and cost-benefit analysis. SP, SF, RT, ÁB, and MU wrote the article.
Funding
This work was supported by URA, through a convention with AZTI, and MARS project (Managing Aquatic ecosystems and water Resources under multiple Stress) funded under the 7th EU Framework Programme, Theme 6 (Environment including Climate Change), Contract No.: 603378 (http://www.mars-project.eu). SP was supported by a grant from Fundación AZTI and an Erasmus+ grant by the University of the Basque Country.
Conflict of Interest Statement
The authors declare that the research was conducted in the absence of any commercial or financial relationships that could be construed as a potential conflict of interest.
Acknowledgments
We would like to thank the Regional Government of Bizkaia, the Health Department of Bizkaia and Consorcio de Aguas de Bilbao-Bizkaia (CABB) for sharing unpublished information on beach visitors, bathing waters and sewage system running costs, respectively. Javier Franco (AZTI) and Jose Maria Garcia (CABB) provided and explained the investments done in the sewage system. We wish to thank the University of East Anglia for receiving SP during her internship. We would like to thank the reviewers who helped us to improve the first version of the manuscript. This is contribution number 881 from AZTI (Marine Research Division).
Supplementary Material
The Supplementary Material for this article can be found online at: https://www.frontiersin.org/articles/10.3389/fmars.2018.00375/full#supplementary-material
Footnotes
- ^http://www.eustat.eus/estadisticas/tema_268/opt_1/ti_Estadistica_municipal_de_habitantes/temas.html
- ^https://www.google.es/maps
- ^https://www.metrobilbao.eus/utilizando-el-metro/mapa-y-frecuencias
- ^The average running cost per km of a vehicle was estimated with the information from the report that estimated the average cost of maintenance of petrol and diesel cars in Spain in 2017 (http://aeaclub.org/cuanto-cuesta-tener-coche/), and considering the diesel/petrol car-fleet ratio in Spain (http://www.acea.be/statistics/article/Passenger-Car-Fleet-by-Fuel-Type).
- ^The Regional Government of Bizkaia estimates the number of daily visitors to each beach as the sum of visitors present in the beach at 12 p.m. and 5 p.m. The number of visitors is directly count by beach police members. This information was provided by the Regional Government.
References
Alves, B., Ballester, R., Rigall-I-Torrent, R., Ferreira,Ó., and Benavente, J. (2017). How feasible is coastal management? A social benefit analysis of a coastal destination in SW Spain. Tour. Manag. 60, 188–200. doi: 10.1016/j.tourman.2016.12.004
Aragonés, L., López, I., Palazón, A., López-Úbeda, R., and García, C. (2016). Evaluation of the quality of coastal bathing waters in Spain through fecal bacteria Escherichia coli and Enterococcus. Sci. Total Environ. 566–567, 288–297. doi: 10.1016/j.scitotenv.2016.05.106
Ariza, E., Ballester, R., Rigall-I-Torrent, R., Saló, A., Roca, E., Villares, M., et al. (2012). On the relationship between quality, users’ perception and economic valuation in NW Mediterranean beaches. Ocean Coast. Manag. 63, 55–66. doi: 10.1016/j.ocecoaman.2012.04.002
AZTI (2011). Perfiles de las Aguas de Baño de la Zona Litoral de la CAPV. Vitoria-Gasteiz: URA Agencia Vasca del Agua.
Badura, T., Bateman, I., Agarwala, M., and Binner, A. (2016). “Valuing preferences for ecosystem related goods and services,” in Routledge Handbook of Ecosystem Services, eds M. Potschin, R. Haines-Young, R. Fish, and R. K. Turner (Abingdon: Routledge), 228–242. doi: 10.4324/9781315775302-21
Barbier, E. B. (2017). Marine ecosystem services. Curr. Biol. 27, R507–R510. doi: 10.1016/j.cub.2017.03.020
Barbier, E. B., Hacker, S. D., Kennedy, C., Koch, E. W., Stier, A. C., and Silliman, B. R. (2011). The value of estuarine and coastal ecosystem services. Ecol. Monogr. 81, 169–193. doi: 10.1890/10-1510.1
Barry, L., van Rensburg, T. M., and Hynes, S. (2011). Improving the recreational value of Ireland’s coastal resources: a contingent behavioural application. Mar. Policy 35, 764–771. doi: 10.1016/j.marpol.2011.01.009
Belzunce, M. J., Solaun, O., Franco, J., Valencia, V., and Borja, A. (2001). Accumulation of organic matter, heavy metals and organic compounds in surface sediments along the Nervión Estuary (Northern Spain). Mar. Pollut. Bull. 42, 1407–1411. doi: 10.1016/S0025-326X(01)00216-8
Belzunce, M. J., Solaun, O., Valencia, V., and Pérez, V. (2004). Contaminants in estuarine and coastal waters. Elsevier Oceanogr. Ser. 70, 233–251. doi: 10.1016/S0422-9894(04)80047-3
Benayas, J. M. R., Newton, A. C., Diaz, A., and Bullock, J. M. (2009). Enhancement of biodiversity and ecosystem services by ecological restoration: a meta-analysis. Science 325, 1121–1124. doi: 10.1126/science.1172460
Borja, A., Chust, G., Rodríguez, J. G., Bald, J., Belzunce-Segarra, M. J., Franco, J., et al. (2016). “The past is the future of the present”: learning from long-time series of marine monitoring. Sci. Total Environ. 566–567, 698–711. doi: 10.1016/j.scitotenv.2016.05.111
Borja, A., Dauer, D., Elliott, M., and Simenstad, C. (2010). Medium- and long-term recovery of estuarine and coastal ecosystems: patterns, rates and restoration effectiveness. Estuaries Coast. 33, 1249–1260. doi: 10.1007/s12237-010-9347-5
Borja, A., Muxika, I., and Franco, J. (2006). Long-term recovery of soft-bottom benthos following urban and industrial sewage treatment in the Nervión estuary (southern Bay of Biscay). Mar. Ecol. Prog. Ser. 313, 43–55. doi: 10.3354/meps313043
Boyle, K. J. (2003). “Introduction to the revealed preference methods,” in A Primer on Nonmarket Valuation The Economics of Non-Market Goods and Services, eds P. A. Champ, K. J. Boyle, and T. C. Brown (Dordrecht: Springer Netherlands), 259–268.
Brown, T. C. (2003). “Introduction to the stated preference methods,” in A Primer on Nonmarket Valuation The Economics of Non-Market Goods and Services, eds P. A. Champ, K. J. Boyle, and T. C. Brown (Dordrecht: Springer Netherlands), 99–110.
Bullock, J. M., Aronson, J., Newton, A. C., Pywell, R. F., and Rey-Benayas, J. M. (2011). Restoration of ecosystem services and biodiversity: conflicts and opportunities. Trends Ecol. Evol. 26, 541–549. doi: 10.1016/j.tree.2011.06.011
Cajaraville, M. P., Orive, E., Villate, F., Laza-Martínez, A., Uriarte, I., Garmendia, L., et al. (2016). Health status of the Bilbao estuary: a review of data from a multidisciplinary approach. Estuar. Coast. Shelf Sci. 179, 124–134. doi: 10.1016/j.ecss.2016.01.013
Cànoves-Valiente, G., Prat-Forga, J., and Blanco-Romero, A. (2016). Tourism in Spain, beyond the sun and the beach. Recent evolution and changes in the destinies of littoral towards a cultural tourism. Bol. Asoc. Geógr. Esp. 71, 547–551.
Casado-Arzuaga, I., Madariaga, I., and Onaindia, M. (2013). Perception, demand and user contribution to ecosystem services in the Bilbao Metropolitan Greenbelt. J. Environ. Manage. 129, 33–43. doi: 10.1016/j.jenvman.2013.05.059
Casado-Arzuaga, I., Onaindia, M., Madariaga, I., and Verburg, P. H. (2014). Mapping recreation and aesthetic value of ecosystems in the Bilbao Metropolitan Greenbelt (northern Spain) to support landscape planning. Landsc. Ecol. 29, 1393–1405. doi: 10.1007/s10980-013-9945-2
Cearreta, A., Irabien, M. J., Leorri, E., Yusta, I., Croudace, I. W., and Cundy, A. B. (2000). Recent anthropogenic impacts on the Bilbao estuary, Northern Spain: geochemical and microfaunal evidence. Estuar. Coast. Shelf Sci. 50, 571–592. doi: 10.1006/ecss.1999.0582
Cearreta, A., Irabien, M. J., and Pascual, A. (2004). “Human activities along the Basque coast during the last two centuries: geological perspective of recent anthropogenic impact on the coast and its environmental consequences,” in Oceanography and Marine Environment in the Basque Country Elsevier Oceanography Series, eds A. Borja and M. Collins (Amsterdam: Elsevier),27–50.
Cearreta, A., and Leorri, E. (2000). La transformación ambiental reciente de la Ría de Bilbao: indicadores micropaleontológicos en el registro sedimentario estuarino. Nat. Cantabricae 1, 21–31.
Champ, P. A., Boyle, K. J., and Brown, T. C. (eds) (2003). A Primer on Nonmarket Valuation. Dordrecht: Springer Netherlands, doi: 10.1007/978-94-007-0826-6
Costanza, R., de Groot, R., Braat, L., Kubiszewski, I., Fioramonti, L., Sutton, P., et al. (2017). Twenty years of ecosystem services: how far have we come and how far do we still need to go? Ecosyst. Serv. 28, 1–16. doi: 10.1016/j.ecoser.2017.09.008
Cruz Rambaud, S., and Muñoz Torrecillas, M. J. (2006). Social discount rate: a revision. An. Estud. Econ. Empresariales 16, 75–98.
De Groot, R., Brander, L., van der Ploeg, S., Costanza, R., Bernard, F., Braat, L., et al. (2012). Global estimates of the value of ecosystems and their services in monetary units. Ecosyst. Serv. 1, 50–61. doi: 10.1016/j.ecoser.2012.07.005
De Groot, R. S., Blignaut, J., Van Der Ploeg, S., Aronson, J., Elmqvist, T., and Farley, J. (2013). Benefits of investing in ecosystem restoration. Conserv. Biol. 27, 1286–1293. doi: 10.1111/cobi.12158
Earnhart, D. (2001). Combining revealed and stated preference methods to value environmental amenities at residential locations. Land Econ. 77, 12–29. doi: 10.2307/3146977
Elliott, M., and Whitfield, A. K. (2011). Challenging paradigms in estuarine ecology and management. Estuar. Coast. Shelf Sci. 94, 306–314. doi: 10.1016/j.ecss.2011.06.016
Eustat (2014). Proyecciones de Poblacion 2026. Análisis de Resultados. Euskal Estatistika Erakundea, Eustat. Available at: www.eustat.es
Ezebilo, E. E. (2016). Economic value of a non-market ecosystem service: an application of the travel cost method to nature recreation in Sweden. Int. J. Biodivers. Sci. Ecosyst. Serv. Manag. 12, 314–327. doi: 10.1080/21513732.2016.1202322
Farber, S. C., Costanza, R., and Wilson, M. A. (2002). Economic and ecological concepts for valuing ecosystem services. Ecol. Econ. 41, 375–392. doi: 10.1016/S0921-8009(02)00088-5
Ferrini, S., Schaafsma, M., and Bateman, I. (2014). Revealed and stated preference valuation and transfer: a within-sample comparison of water quality improvement values. Water Resour. Res. 50, 4746–4759. doi: 10.1002/2013WR014905
Fezzi, C., Bateman, I. J., and Ferrini, S. (2014). Using revealed preferences to estimate the Value of Travel Time to recreation sites. J. Environ. Econ. Manag. 67, 58–70. doi: 10.1016/j.jeem.2013.10.003
García-Barcina, J. M., González-Oreja, J. A., and De la Sota, A. (2006). Assessing the improvement of the Bilbao estuary water quality in response to pollution abatement measures. Water Res. 40, 951–960. doi: 10.1016/j.watres.2006.01.004
García-Barcina, J. M., Oteiza, M., and de la Sota, A. (2002). “Modelling the faecal coliform concentrations in the Bilbao estuary,” in Nutrients and Eutrophication in Estuaries and Coastal Waters, eds E. Orive, M. Elliott, and V. N. de Jonge (Dordrecht: Springer Netherlands), 213–219. doi: 10.1007/978-94-017-2464-7_18
Garrod, G., and Willis, K. G. (1999). Economic Valuation of the Environment. Cheltenham: Edward Elgar Publishing.
Haines-Young, R. H., and Potschin, M. P. (2010). “The links between biodiversity, ecosystem services and human well-being,” in Ecosystem Ecology: A New Synthesis. BES Ecological Reviews Series, eds D. Raffaelli and C. Frid (Cambridge: CUP), 110–139.
Hernández-Morcillo, M., Plieninger, T., and Bieling, C. (2013). An empirical review of cultural ecosystem service indicators. Ecol. Indic. 29, 434–444. doi: 10.1016/j.ecolind.2013.01.013
Hoyos, D., Mariel, P., and Fernández-Macho, J. (2009). The influence of cultural identity on the WTP to protect natural resources: some empirical evidence. Ecol. Econ. 68, 2372–2381. doi: 10.1016/j.ecolecon.2009.03.015
Loomis, D. K., and Paterson, S. K. (2014). Human dimensions indicators of coastal ecosystem services: a hierarchical perspective. Ecol. Indic. 44, 63–68. doi: 10.1016/j.ecolind.2013.12.022
Lotze, H. K., Lenihan, H. S., Bourque, B. J., Bradbury, R. H., Cooke, R. G., Kay, M. C., et al. (2006). Depletion, degradation, and recovery potential of estuaries and coastal seas. Science 312, 1806–1809. doi: 10.1126/science.1128035
Martín-López, B., Iniesta-Arandia, I., García-Llorente, M., Palomo, I., Casado-Arzuaga, I., Amo, D. G. D., et al. (2012). Uncovering ecosystem service bundles through social preferences. PLoS One 7:e38970. doi: 10.1371/journal.pone.0038970
Martín-López, B., Montes, C., and Benayas, J. (2007). Influence of user characteristics on valuation of ecosystem services in Doñana Natural Protected Area (south-west Spain). Environ. Conserv. 34, 215–224. doi: 10.1017/S0376892907004067
Metcalfe, P. J., Baker, W., Andrews, K., Atkinson, G., Bateman, I. J., Butler, S., et al. (2012). An assessment of the nonmarket benefits of the Water Framework Directive for households in England and Wales. Water Resour. Res. 48:W03526. doi: 10.1029/2010WR009592
Milcu, A. I., Hanspach, J., Abson, D., and Fischer, J. (2013). Cultural ecosystem services: a literature review and prospects for future research. Ecol. Soc. 18:44. doi: 10.5751/es-05790-180344
Parsons, G. R. (2003). “The Travel Cost Model,” in A Primer on Nonmarket Valuation The Economics of Non-Market Goods and Services, eds P. A. Champ, K. J. Boyle, and T. C. Brown (Dordrecht: Springer Netherlands), 269–329. doi: 10.1007/978-94-007-0826-6_9
Pascual, M., Borja, A., Franco, J., Burdon, D., Atkins, J. P., and Elliott, M. (2012). What are the costs and benefits of biodiversity recovery in a highly polluted estuary? Water Res. 46, 205–217. doi: 10.1016/j.watres.2011.10.053
Pearce, D. W., and Turner, R. K. (1990). Economics of Natural Resources and the Environment. Baltimore, MD: John Hopkins University Press.
Pendleton, L. (2010). The Economic and Market Value of Coasts and Estuaries: What’s at Stake? Arlington, VA: Restore America’s Estuaries.
Pouso, S., Uyarra, M. C., and Borja, Á. (2018a). Recreational fishers’ perceptions and behaviour towards cultural ecosystem services in response to the Nerbioi estuary ecosystem restoration. Estuar. Coast. Shelf Sci. 208, 96–106. doi: 10.1016/j.ecss.2018.04.033
Pouso, S., Uyarra, M. C., and Borja, Á. (2018b). The recovery of estuarine quality and the perceived increase of cultural ecosystem services by beach users: a case study from northern Spain. J. Environ. Manage. 212, 450–461. doi: 10.1016/j.jenvman.2018.02.033
Prayaga, P. (2017). Estimating the value of beach recreation for locals in the Great Barrier Reef Marine Park, Australia. Econ. Anal. Policy 53, 9–18. doi: 10.1016/j.eap.2016.10.001
R Core Team (2015). R: A Language and Environment for Statistical Computing. Vienna: R Foundation for Statistical Computing.
Sanchez-Lorenzo, A., Brunetti, M., Calbó, J., and Martin-Vide, J. (2007). Recent spatial and temporal variability and trends of sunshine duration over the Iberian Peninsula from a homogenized data set. J. Geophys. Res. 112:D20115. doi: 10.1029/2007JD008677
Sartori, D., and European Commission (eds). (2015). Guide to Cost-Benefit analysis of Investment Projects: Economic Appraisal Tool for Cohesion Policy 2014 - 2020. Dec. 2014. Luxembourg: Publications Office of the EuropeanUnion.
Souto Nieves, G. (2001). Tasas de Descuento Para la Evaluación de Inversiones Públicas: Estimaciones Para España. Madrid: Instituto de EstudiosFiscales.
Turner, R. K. (2016). “The ‘Balance Sheet’ approach within adaptive management for ecosystem services,” in Routledge Handbook of Ecosystem Services, eds M. Potschin, R. Haines-Young, R. Fish, and R. K. Turner (Abingdon: Routledge), 289–303.
Turner, R. K., Morse-Jones, S., and Fisher, B. (2010). Ecosystem valuation. A sequential decision support system and quality assessment issues. Ann. N. Y. Acad. Sci. 1185, 79–101. doi: 10.1111/j.1749-6632.2009.05280.x
Turner, R. K., and Schaafsma, M. (eds). (2015). Coastal Zones Ecosystem Services. Cham: Springer International Publishing. doi: 10.1007/978-3-319-17214-9
Uriarte, A., and Borja, A. (2009). Assessing fish quality status in transitional waters, within the European Water Framework Directive: setting boundary classes and responding to anthropogenic pressures. Estuar. Coast. Shelf Sci. 82, 214–224. doi: 10.1016/j.ecss.2009.01.008
Keywords: travel cost method, cost-benefit analysis, ecosystem restoration, cultural ecosystem services, economic valuation
Citation: Pouso S, Ferrini S, Turner RK, Uyarra MC and Borja Á (2018) Financial Inputs for Ecosystem Service Outputs: Beach Recreation Recovery After Investments in Ecological Restoration. Front. Mar. Sci. 5:375. doi: 10.3389/fmars.2018.00375
Received: 01 August 2018; Accepted: 26 September 2018;
Published: 16 October 2018.
Edited by:
Sebastian Villasante, Universidade de Santiago de Compostela, SpainReviewed by:
Jan Marcin Weslawski, Institute of Oceanology (PAN), PolandUrsula Scharler, University of KwaZulu-Natal, South Africa
Copyright © 2018 Pouso, Ferrini, Turner, Uyarra and Borja. This is an open-access article distributed under the terms of the Creative Commons Attribution License (CC BY). The use, distribution or reproduction in other forums is permitted, provided the original author(s) and the copyright owner(s) are credited and that the original publication in this journal is cited, in accordance with accepted academic practice. No use, distribution or reproduction is permitted which does not comply with these terms.
*Correspondence: Sarai Pouso, c3BvdXNvQGF6dGkuZXM=